



Abstract
We examine whether the legal decision to grant unitary status to the Charlotte–Mecklenburg school district, which led to the end of race-conscious student assignment policies, increased the probability that families with children enrolled in the district would move to neighborhoods with a greater proportion of student residents of the same race as their own children. Motivated by the rich but inconclusive literature on the consequences of educational and residential segregation, we make use of a natural policy experiment—a judicial decision to end court-ordered busing—to estimate the causal impacts of this policy shift on household residential decisions. We find that, for those who moved, the legal decision made White families with children in the Charlotte–Mecklenburg Schools substantially more likely than they were during desegregation to move to a neighborhood with a greater proportion of White residents than their own neighborhood.
In 2007, the U.S. Supreme Court, in Parents Involved in Community Schools v. Seattle School District No. 1 et al. (Seattle) (2007), barred school districts from voluntarily using racial classifications in student assignment to correct de facto segregation. The plurality opinion by Chief Justice Roberts distinguished the voluntary choices of families to live in segregated communities from the governmentally mandated segregation of Jim Crow: “Where resegregation is a product not of state action but of private choices, it does not have constitutional implications” (Seattle, 2007, p. 735 quoting Kennedy, Freeman v. Pitts, 1992). Here, Roberts extended the legal theory first articulated in Pasadena City Board of Education v. Spangler (1976) that has, since Board of Education of Oklahoma City v. Dowell (1991), become the dominant framework for majority opinions in school desegregation and integration cases. In fact, in quoting Justice Kennedy’s majority decision in Freeman, Roberts clearly intended to remind Kennedy, the swing vote in Seattle, of his words from 15 years prior: “Residential housing choices, and their attendant effects on the racial composition of schools, present an ever changing pattern, one difficult to address through judicial remedies” (Freeman, 1992, p. 495).
The justices in these cases view educational segregation as a product of either (a) governmental policies that explicitly assign students of different races to separate schools, in which case the state has a compelling interest to classify students by race to reassign them in an integrated fashion, or (b) individual choices and economic patterns over which the courts have no say. The plurality in Seattle would limit the use of racial classification in student assignment policies only to instances where it is necessary to remedy the effects of past intentional discrimination. 1 Beyond these, however, a third possibility, articulated in Justice Breyer’s dissent, is that “state action” that is not explicitly racially segregative may nonetheless lead to greater levels of residential segregation. If legal decisions and government policy actually cause residential segregation by changing the structure of incentives that drive private choices, then evidence of segregation resulting from state action might necessitate judicial remedy.
In this article, we investigate evidence of segregative private actions in response to a court-mandated shift in student assignment policy in the Charlotte–Mecklenburg Schools (CMS) in North Carolina. In the landmark civil rights case Swann v. Charlotte–Mecklenburg Board of Ed. (1971), the U.S. Supreme Court ruled that federal courts could remedy racial segregation in Charlotte–Mecklenburg by ordering the school district to take affirmative steps to eliminate the vestiges of segregation “root and branch” (Green v County School Board, 1968). The Court affirmed the constitutionality of judicially mandated policies to rezone attendance boundaries, transport students by bus, and pair children from different neighborhoods to ensure public school integration. Over time, school district administrators came to see this set of policies, developed by professor and National Association for the Advancement of Colored People (NAACP) consultant Dr. John Finger, as integral to promoting diverse schools. Thus, the Finger Plan remained in effect until William Capacchione sued the district to end its race-conscious assignment policy after his daughter was denied admission to a magnet school. To satisfy the legal requirements to end desegregation, the litigants were required to demonstrate that the district had eradicated its segregation-era practice of offering one set of schools to White students and another set to non-White students—a “dual” school system. After a series of appeals, the Fourth Circuit Court ruled that CMS had ended its two-track system and granted the district “unitary” status in 2001 (Belk v. Charlotte–Mecklenburg Schools, 2001). As a result, the district was released from its obligation to take proactive steps to integrate the schools. When the Supreme Court declined to hear the case in 2002, the district adopted the Family Choice Plan (FCP) for the 2002–2003 academic year and reverted to a neighborhood school system in 2005, ending three decades of race-conscious student assignment.
We argue that this court-mandated shift in student assignment policy creates a natural experiment with which to test the causal effects of the declaration of unitary status on residential segregation. Specifically, we employ an interrupted time series approach to investigate whether the judicial decisions ending court-mandated school integration policies caused families in Charlotte–Mecklenburg to move to neighborhoods in which the race of the children attending the public school there more closely matched their own child’s race.
Earlier research, discussed below, suggests that the school desegregation orders from the 1960s and 1970s did produce changes in housing patterns. We add to a large body of prior research on the effects of desegregation decrees and declarations of unitary status, and contribute, in particular, by modeling individual behavior and being substantially more precise than prior studies in tracking residential movement. We find that although the end of the CMS desegregation policies had no immediate impact on the overall extent of residential segregation among families in the CMS system, for those families choosing to relocate within the county from one year to the next, it increased by half the odds that White families would select a residence located in a school attendance zone with a greater proportion of students who were White than their former residence. We take this result as evidence that “state action,” which is not explicitly segregative, nonetheless has the potential to have long-run impacts on residential segregation.
This article proceeds in six sections. In the second section, we motivate our research and present the historical and legal background of court-ordered desegregation in Charlotte. In the third section, we introduce our data. We discuss preliminary descriptive and graphical analysis in the fourth section. In the fifth section, we present results from models identifying individual household preferences. Finally, in the sixth section, we discuss the implications of these findings.
Motivation and Context
In After Brown, the seminal quantitative work on the interrelationship between the courts and educational segregation, Clotfelter (2004) identifies three indicators that court-imposed desegregation orders from the late 1960s and 1970s led to “White flight” and increased residential segregation. First, in areas affected by desegregation home values declined in the aftermath of court orders. Second, White families with school-aged children moved out of jurisdictions with desegregated schools at a faster rate than White households without children. Finally, metropolitan regions consisting of smaller districts were more likely to experience relocation of White families following desegregation orders because smaller districts permit families to sort themselves based on race. In contrast, in districts covering entire metropolitan areas, White families were less likely to relocate—unless they were willing to also enter different labor markets or commute long distances—because such moves would not ensure that their children would attend racially homogenous schools. Clotfelter’s descriptive findings are consistent with causal research examining housing prices along district boundaries (Bogart & Cromwell, 2000; Boustan, 2012; Kane, Riegg, & Staiger, 2006), mechanisms of segregation and “White flight” (Baum-Snow & Lutz, 2011), and district coverage of metropolitan areas (Reber, 2005).
This last result is particularly important in the context of our study. The CMS school district covers the entirety of Mecklenburg County—over 500 square miles. With the caveat that some families opted for private schools, 2 few families moved out of Mecklenburg County in response to the original Swann decision (Clotfelter, 2004). Still today, CMS remains a remarkably racially and ethnically diverse district with a student population that in the 2012–2013 school year was 42% Black, 32% White, 18% Hispanic, 5% Asian, and 3% multiracial and other races. Thus, unlike other large metropolitan areas, many of which contain several districts serving different and racially homogenous student populations, CMS has the potential for racially integrated schools and communities without redrawing school district boundaries.
Historical and Legal Background
In 1970, on the eve of the Swann case, the CMS schools, like many other southern districts, had made only modest progress in desegregating its schools. Clotfelter (2004) uses a segregation index to describe the extent to which children are exposed to classmates of different races relative to the proportion of non-White students in a district. The index ranges from 0, indicating that all schools or neighborhoods have non-White enrollment proportional to the overall demographics of the district, to 1, indicating complete segregation of White students and non-White students. 3 The index is interpretable as the proportion of non-White individuals who would need to move to a different neighborhood for the school district’s neighborhoods to be perfectly integrated given the racial composition of the community. Figure 1, reproduced from Clotfelter’s After Brown and supplemented with our own calculations, indicates that prior to the Brown decision in 1954, the CMS schools were entirely segregated, with a segregation index of 1. In 1970, the year before the Supreme Court decided Swann, the segregation index had only fallen to 0.63. By 1972, as a consequence of the Finger Plan policies that included rezoning and gerrymandering attendance zones, pairing Black, inner-city students and White, suburban students to attend the same school, and busing students between city core and suburbs, the index had fallen to nearly 0. The racial composition of every CMS school matched the racial makeup of the entire district. The index remained at or below 0.1 through the early 1990s, when CMS replaced mandatory busing for all students with a mix of busing and controlled choice among magnet schools. Rates of segregation rose gradually over the next decade before increasing sharply in the aftermath of the unitary status declaration, reaching 0.28 in 2003 and 0.33 for the 2009–2010 academic year. The increase in school segregation in the 1990s and 2000s in CMS corroborates Stroub and Richards’s (2013) finding that southern districts with prior de jure segregation experienced much more modest reintegration trends in the 2000s than the rest of the country.
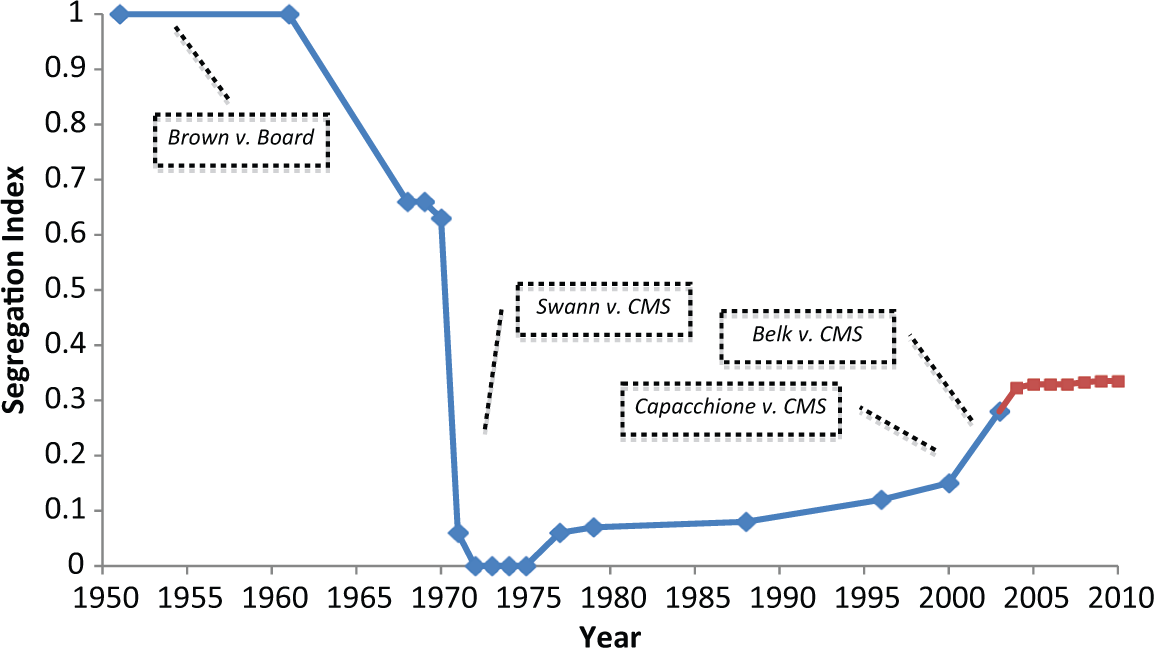
Segregation index in Charlotte–Mecklenburg Schools, 1950–2010.
The end of the race-conscious student assignment policy led to an increase in between-school racial segregation. This is unsurprising, since Charlotte’s neighborhoods were still highly segregated between 1971 and 2002, despite the school desegregation order. The FCP, implemented in 2002, afforded parents the option to apply to other schools throughout the district but guaranteed students a seat in their neighborhood school. Though many students sought to take advantage of the school choice provision of the FCP, most White students did not select out of their neighborhood schools. In fact, more than three quarters of students in the predominantly White suburbs selected their home schools, with the rest opting for magnets. In contrast, only one quarter of inner-city residents selected their home school (Doss Helms, Mellnik, & Smith, 2002). These two patterns led suburban schools to become oversubscribed and open primarily to those families who lived in the neighborhood. Thus, while the FCP was a choice plan in name, families who did not live in a desirable school’s zone had almost no chance to choose into it. In practice, therefore, the FCP was essentially a neighborhood assignment plan. Furthermore, this policy was altered again in 2005 such that students were assigned to their neighborhood school with no formal choice options outside of limited specialty programs in magnet schools. Finally, only four charter schools had been operating in Mecklenburg County for more than 2 years at the time of the declaration of unitary status in 2002 (and only 10 as of the 2008–2009 school year). As a consequence, we find it unlikely that charter options had a significant impact on families’ ability to express their schooling choice through entry into charter lotteries rather than through residential moves. Thus, with little allowance for active school choice, CMS schools became more racially segregated after the policy change because of preexisting patterns of residential segregation.
Numerous studies have exploited Charlotte–Mecklenburg’s declaration of unitary status and the subsequent increases in school segregation to explore the impacts of the policy change on various outcomes. The new assignment policy has been identified as a cause of increases in school socioeconomic segregation (Mickelson, Smith, & Southworth, 2009), declines in the academic performance of White students and Black students (Mickelson, 2003), the sorting of more effective teachers to nonminority students (Jackson, 2009), and large increases in criminality among non-White males (Billings, Deming, & Rockoff, 2014). Furthermore, Hastings, Kane, and Staiger (2006) find that families used the options afforded through the FCP to select schools nearer their residence that were more racially homogenous, rather than higher performing. Despite increased school segregation, however, the policy change has not altered the Black–White test score gap in CMS (Vigdor, 2011). What remains unclear is whether school segregation in CMS increased after 2002 only because families returned to schools located in already segregated neighborhoods, or whether the lifting of the court order actually contributed additively to segregation by affecting the residential choices of CMS families.
Weinstein (n.d.) recently found that, after the declaration of unitary status, resulting increases in the proportion of Black students attending certain elementary schools led to subsequent increases in the proportion of Black residents in those schools’ residential assignment zones. Specifically, a 10-percentage-point increase in the percentage of Black students assigned to an elementary school led to a 1.2-percentage-point increase in the percentage of CMS students who are Black in the neighborhood after 5 years. Whereas Weinstein’s identification is based on experienced postdeclaration shocks to aggregate school and neighborhood composition, our data set allows us to observe the choice each family makes between its current residence and all other available options. Consequently, whereas Weinstein finds neighborhood composition changes 4 and 5 years after the declaration of unitary status, we are able to observe the specific choices families made in the immediate aftermath of the new assignment policy. In the fifth section, we discuss other key distinctions between our results and his.
Theoretical Framework and Model
We compare the racial composition and achievement of the school attendance zone in which each student resides in a given year (year t) to the characteristics of the choice set into which each student might move in the following year (year t + 1), using each zone’s characteristics as measured in year t. We theorize that families with school-aged children select their neighborhoods as a function of their personal characteristics, interacted with the school-based amenities available to residents of the neighborhood and all other nonschool neighborhood amenities, subject to their household budget constraint. Formally,

where L is a family’s location, S represents school-related housing amenities, N represents all other housing amenities, X represents household characteristics, I is income, and U is unearned income. During desegregation, we posit that school-based amenities associated with housing choice within a district weight only minimally, since a family’s choice of residence does not determine the public school their children attend, or does so only temporarily. Once a district is declared unitary, however, families can exert their school and Tiebout (1956) preferences through housing choice. For some families, this may entail selecting into a neighborhood associated with a school with a greater proportion of students who are of the same race as their child than the proportion in their current neighborhood’s school. Thus, S in Equation 1 can be written as a function of assigned school racial composition (R) and all other characteristics (A) such as safety, facilities, student achievement, teacher and staff qualifications, and proximity: S = f(R, A).
From 1971 to 2002, parents who were unwilling or unable to remove their children from the Charlotte–Mecklenburg public schools were unable to control the racial composition of the school their children attended through residential choice. In fact, the district frequently created new school pairings and redrew assignment boundaries to preserve the integrated nature of its schools. Thus, the Finger Plan and subsequent adjustments ensured that the demographics of individual CMS schools were nearly identical to those of the district as a whole. Given the metropolitan coverage of the CMS district, we reason that, during this period, residential choices of families with school-aged children would have been motivated by the availability, price, and quality of the housing stock, the local provision of noneducational government amenities, and a wide variety of other nonobservable factors, but importantly only minimally by the perceived quality of local neighborhood schools. Once the court-mandated assignment policies ended in 2002, however, parents could exercise their preferences for neighborhoods that maximized personal utility with respect to schools. For families whose utility was heavily influenced by school quality, after 2002, they could use residential choice to select a school they perceived to be of high quality—even if one criterion was racial homogeneity of the school.
To causally attribute changes in family residential decisions to the unitary status declaration, we must show that Mecklenburg County residents could not have anticipated the policy change. The long, protracted court battle over desegregation clearly signaled to families the possibility of policy shifts. However, as the timeline in Table 1 indicates, the District, Circuit, and Supreme Courts were starkly divided over this case. After the District Court declared CMS to have achieved unitary status in 1999, the Fourth Circuit Court of Appeals overturned this ruling in 2000. Then, in 2001, the full en banc panel of 11 Fourth Circuit judges overturned the 2000 decision. However, the NAACP quickly appealed the Fourth Circuit ruling to the Supreme Court, which decided against hearing the case only in April 2002. Given this pattern of events, we argue that it is unlikely that families would have made housing choices prior to the 2002–2003 school year that were contingent on being able to select a school through their choice of residence. Even if it were possible for families to anticipate the new assignment policy, we reason that this behavior would, in fact, bias our results downward, particularly for Whites. White families who preferred more racially similar schools and who anticipated the shift in school assignment to a neighborhood-based system would, if responsive, have moved to neighborhoods with a higher proportion of White residents prior to the policy shift and before the expected rise in housing prices.
Chronology of Declaration of Unitary Status and Return to Neighborhood Schools

For several reasons, we anticipate a lag in residential sorting after the introduction of the new assignment plan in August 2002. First, families might have chosen to wait to assess whether the new race-neutral assignment policy was, in fact, a permanent fixture given all of the uncertainty in the lead-up to its adoption. In July 2001, the CMS board approved, in principle, the race-neutral assignment plan. The following January, students submitted applications for up to three schools, with each student’s residential zone school as a default. The change in policy also included a grandfathering clause whereby students in a terminal grade (i.e., 5th, 8th, or 12th) who wanted to remain at their current schools were given high priority but not the guarantee to remain in that school. In February 2002, the district informed families of school assignment, but made clear that this assignment was provisional pending the Supreme Court ruling. Therefore, school assignment for the 2002–2003 school year remained uncertain until April 2002, leaving families very little time to move in response. Given the timing around the finalization of this policy, families may have been more willing to take a “wait and see” attitude regarding decisions around relocation as a means of influencing school choice.
In addition, the policy left little time for families to search for suitable housing options. It takes time to search for a new home or sell an existing one. In addition, renters may have been averse to the penalties associated with breaking a lease. Furthermore, though parents knew in February 2002 the school to which they had been tentatively assigned for the 2002–2003 school year, they knew nothing about its new racial or socioeconomic makeup. As such, they would have been likely to delay any move until they had a better sense of the school to which they had been assigned.
Both our framework and theoretical choice models, first articulated by Schelling (1972), developed by McFadden (1973, 1979), and applied more recently by Mare and Bruch (2003; Bruch & Mare, 2006) to patterns of residential segregation, motivate our central research question: Did the unitary status declaration and the subsequent shift in student assignment policies increase the probability that families would move to a school assignment zone where the proportion of public schoolchildren who were of the same race as their own child was higher than the proportion in their current school assignment zone?
Building on Clotfelter (2004), we hypothesize that White families, in particular, may be responsive to the change in school assignment policy because they had greater financial resources on which to capitalize in exercising residential choice, on average. In 2000, median family income (in 1999 dollars) was $72,043 among Whites, $39,479 among Blacks, and $36,416 among Hispanics in Mecklenburg County (U.S. Census Bureau, 2000). Due to more limited resources, it follows that Black and Hispanic families, though highly mobile, would be comparatively more constrained in expressing preference for wealthier, and consequently Whiter, neighborhoods. As a result of both residential preferences and the financial capacity to express them through residential relocation, we reason that, after the declaration of unitary status, White movers would prioritize moving to school attendance zones with schools that were both higher performing and lower minority. 4 Among those unable to afford such attendance zones, we anticipate that the next most preferred option would be for schools that were not necessarily better performing but that still served a greater proportion of White students than their current school.
Data
Our primary data source is student-level administrative data compiled by CMS for the years 1999–2009. This data set includes 1,440,027 student records. We exclude all students living outside the boundaries of the school district (the CMS district and Mecklenburg County are coextensive), which leads us to eliminate a few dozen records in each year. This rich panel data set contains information on student demographic characteristics, school identifiers, course enrollment, test performance, and—most importantly for our analysis—student race/ethnicity and student home addresses for each year of attendance. We use ArcGIS software to geocode the addresses associated with over 99% of the person–period observations in our data set. Through this process, we assign a longitude and latitude coordinate to each address and then match the coordinates of each student’s home address to its relevant school assignment zone. We identify school assignment zones using CMS-provided school attendance zone boundary maps (called shapefiles in geocoding vocabulary). We utilize maps that are both year and grade level (i.e., elementary, middle, and high school) specific, as over the time period considered, school assignment zone boundaries were changing and different zones were relevant to children according to grade level. For example, in the 2001–2002 school year, there were 67 distinct elementary school attendance zones, 21 distinct middle school attendance zones, and 12 distinct high school attendance zones.
We focus our analysis on elementary schools because we hypothesize that families with middle and high school children may be less responsive to the policy shift, given that they would have less time to reap the perceived benefits of a more racially homogenous setting. Indeed, as we note below, results for older students are similar to, but more modest in magnitude than, those for elementary school students.
Graphical and Descriptive Analysis
Rates of Segregation
Figure 2 presents the nature and extent of residential segregation of students in CMS for grades prekindergarten through 5 between 2000 and 2007. The black areas represent elementary attendance zones where greater than 80% of resident students are non-White, while the light gray sections represent zones where greater than 80% of the resident students are White. The dark gray sections represent ranges between 20% and 80% non-White.
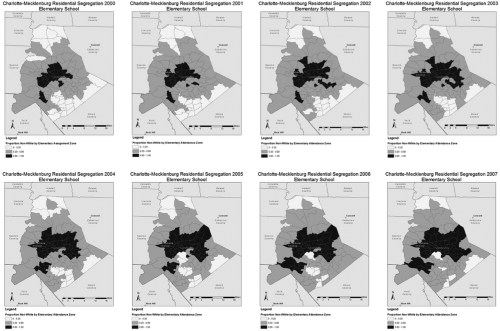
Patterns of high-concentration White and non-White elementary attendance zones, using 2001–2002 boundaries.
The most striking feature in these maps is the extent of residential segregation in the district; the geographic area of the highly segregated elementary attendance zones is large and located in the most densely inhabited central neighborhoods of the city. Importantly for the purposes of our study, in the years 2003 through 2007, we observe growing numbers of attendance zones of the 80% non-White type throughout the county. Though not shown here, this pattern is consistent for middle school and high school attendance zones.
Increases in the number of zones with high concentrations of White or non-White students, however, does not necessarily mean increases in levels of segregation. The overall proportion of CMS students who were non-White grew from half in 1999 to two thirds in 2009—driven in part by dramatic growth in the Hispanic population. Therefore, even if there were no changes in overall patterns of residential segregation, we might expect to see more zones with greater than 80% non-White residents.
We employ the segregation index used by Clotfelter (2004) to investigate trends in the overall state of residential segregation between White children and non-White children attending CMS schools between 1999 and 2009. As above, when using this index, a value of one indicates complete segregation, and a value of zero indicates perfect integration—that is, the racial makeup of each school attendance zone in the district exactly matches the racial makeup of the whole district. Figure 3 plots Clotfelter’s segregation index, calculated using the formula in Note 3, for elementary school students. We use 2001–2002 boundaries for all years of this analysis. Were we to employ different boundaries for each year, we would potentially confound changes in the segregation index resulting from redistricted attendance zones with changes in the index resulting from CMS families expressing segregative residential choices in response to the policy change. As Figure 3 demonstrates, the overall status of segregation is nearly constant over the 8 years and does not appear affected by the 2002 policy change. 5

Residential segregation index in CMS for White families and non-White families with elementary school students using 2001–2002 boundaries, by year (2000–2007).
Patterns of Mobility
In Table 2, we present descriptive information on the mobility of elementary school students. Each row corresponds to two school years. For example, the first row corresponds to school years 1998–1999 and 1999–2000. Students included in the analysis for this row are those who were in Grades 4 and under in the 1998–1999 school year and in Grades 5 and under in the 1999–2000 year. In this way, we restrict ourselves to families whose residential choices would pertain to elementary schools. The third column reports the proportion of elementary school students who were present in our data in 1998–1999 but were absent in 1999–2000. We refer to these students as leavers but are unable to differentiate whether they left Mecklenburg County entirely or instead remained in the county but turned to a nonpublic school option. The fourth column reports the proportion of students present in both years who moved across a school attendance zone boundary between the time their address was recorded in 1998–1999 and when it was recorded again in 1999–2000. 6 The fifth column represents those who are present in both years and remained in the same attendance zone. The proportion of movers is fairly stable in all years with a minimum of 12.6% of households in 2008 and a maximum of 19.9% in 2000. While there is some year-to-year fluctuation in the proportion of families who move, we observe neither a discontinuity in the proportion of moves in the aftermath of the unitary status declaration nor a clear trend over time. Furthermore, we see no trends aligned with the assignment policy change in the proportion of students who leave the district.
Descriptive Statistics on the Proportion of Elementary School Students Who Leave CMS Entirely, Move to a New School Attendance Zone, or Stay in the Same School Attendance Zone From One School Year to the Next (1999–2008)

Figure 4 disaggregates the results in Table 2 by racial category. Again, there is no discontinuity in the proportion of any particular subgroup in the probability of moving around the change in assignment policy. In fact, there are no apparent differences in the trends of movement from one school attendance zone to another across different races. These results are not sensitive to whether we restrict the analysis to only those families who continue to send their children to CMS schools versus including those who leave the district.
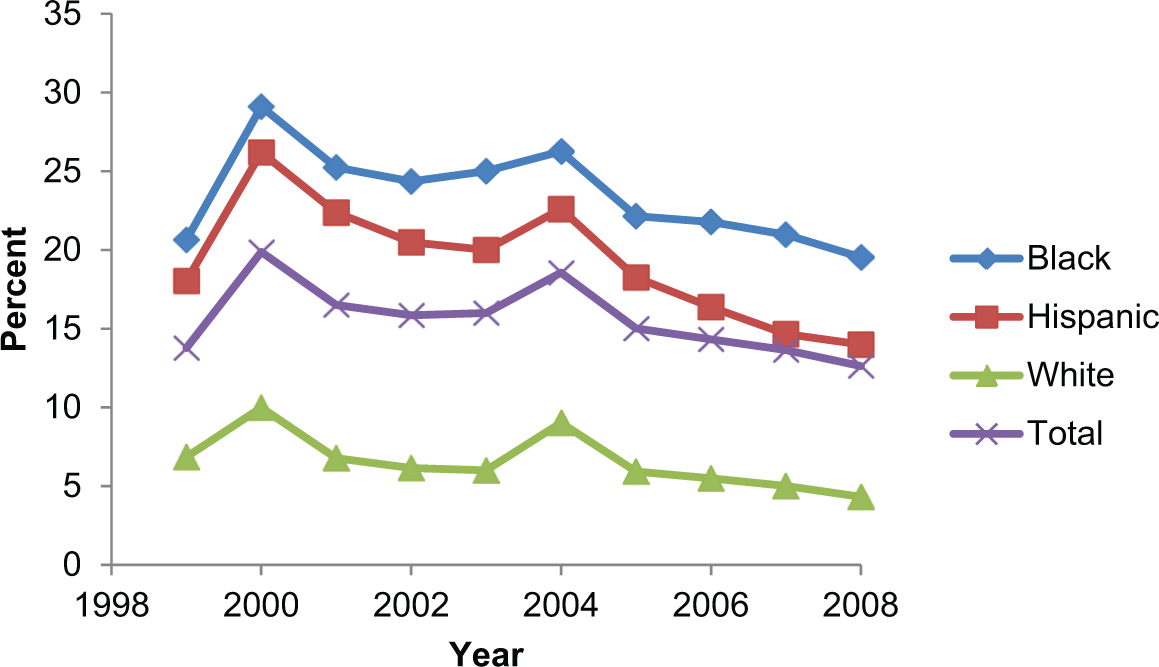
Trends in the share of elementary school families who move to new school attendance zone, by race.
In short, the graphical and descriptive results presented here do not suggest that overall patterns of residential segregation or decisions to move were impacted by the declaration of unitary status. In the next section, we turn to examining how it may have impacted individual household preferences nevertheless.
Families’ Revealed Preferences
Our analytic goal is to understand whether and the extent to which families’ revealed preferences for racially homogenous school attendance zones changed in the aftermath of the unitary status declaration. To assess this change in revealed preferences, we examine, among families who move, year-to-year changes in the likelihood of families selecting into a school attendance zone that is more similar to their child’s own race than the zone that they depart. In order to do so, we require an analytic approach that allows us to describe individual household choice as a function of characteristics that are specific to the combination of the household and of each possible option from which a household can choose. We therefore utilize McFadden’s conditional logit model, which allows us to examine the factors that govern a family’s decision not only of whether to move but also of where to move. Long (2004) provides an illustrative application of this approach and particularly of the model’s ability to handle covariates defined in a manner that is specific to the decision maker and a particular option.
McFadden Conditional Choice Model
In this section, we first outline in formal terms the theoretical framework for why the conditional logit model properly describes the residential choices families will make. Then, we describe how we format our data set to permit estimating the conditional choice model. Finally, we describe the model itself. 7
Assume that a given family i, has j school attendance zones from which to choose and that each school zone can be described by a vector of characteristics Yj. These characteristics might include average property value, school quality, local amenities, proximity to public transportation, and demographic (e.g., racial) makeup of the zone residents. Let Xi represent family characteristics such as race and prior school achievement of the children in the household. The value of the jth attendance zone to family i is U(Yj,Xi). U denotes utility, and U(Yj,Xi) indicates that the utility that family i would gain from residing in attendance zone j is a function of the characteristics both of attendance zone j and of family i. Following these definitions,

where E(Yj,Xi) represents the mean utility of Yj for individuals with a vector of characteristics Xi, and εij represents the random variation among families that depends on unobservable preferences.
We assume that the nonrandom portion of a family’s utility for a particular zone is a function of that school zone’s characteristics and the interaction between school zone and household-level characteristics. These interactions represent household-zone-specific measures. In contrast, household characteristics on their own are not included in considering utility for particular school zones, as a family’s characteristics, in a vacuum, should not influence choice of residence. Rather, it is only how a family’s characteristics match a neighborhood of potential residence that should have an effect on whether or not a family selects a given attendance zone. We highlight below why this point is important from an analytic perspective.
We assume that for each household, school zone selection will be utility maximizing, subject to the household’s budget constraint. That is, family i selects Yk if and only if

Therefore, our model considers each family’s choice among the j potential school attendance zones. To fit our model, we organize the data as pairwise combinations of each family i with each school attendance zone j, for a total of i × j observations. While the number of schools (and associated school attendance zones) varied somewhat from year to year, organizing the data in this way in each year yields between 67 and 78 observations for each family with an elementary-aged child. 8
Having organized the data in this way, the model that we specify is made up of j equations for each family i with each equation describing one of the elements (i.e., zones) in the choice set. In fitting this model, we estimate the probability of each family i choosing to live in school zone j, relative to all other alternatives, in year t. The outcome, ZONEijt, is equal to one for the school zone actually chosen by family i in year t and zero for all other zones. This allows us to model explicitly the trade-offs between the school zone selected and the unselected alternatives. The primary predictor variable interacts LESS_WHITEijt, which is equal to one for each zone in which a higher proportion of the CMS students residing within it are non-White compared to the student’s current zone of residence and zero otherwise. YEAR, represents a linear time trend recentered on zero in 2002, the year of the unitary status declaration. Finally, POSTt is equal to one in 2003 and subsequent years and indicates the years after the declaration of unitary status. 9 Our research question asks whether the unitary status declaration caused families to make segregative moves; however, the change in assignment policy permitted families to control the makeup of their children’s school according to observable school-level characteristics other than racial makeup. In order to differentiate moves that reflect a preference for more racially segregated neighborhoods and ones that reflect a preference for higher achieving schools, we also introduce a critical control variable, HI_ACHijt. HI_ACHijt is equal to one if the school associated with a particular zone has average standardized math and reading achievement scores on the North Carolina End-of-Grade assessments that are higher than the student’s initial zone of residence. To capture the fact that one choice available to families is to not move, we capitalize on Mare and Bruch’s (2003) strategy and include the control variable STAYijt which is equal to one for the school assignment zone in which family i initially lived, and zero otherwise. The inclusion of STAY also permits the conditional choice model to capture the nonlinear jump from a family deciding whether to move as opposed to deciding where to move. In certain specifications, we also include the student-level variable, ACHIEVEijt, a student’s performance on the North Carolina End-of-Grade mathematics assessment, to detect whether families with children with higher academic performance might be more motivated to move in search of more homogenous schools and neighborhoods. 10
The zone level variables STAY, LESS_WHITE, and HI_ACH in our model correspond to the characteristics of zone Yj in Equations 2 and 3. Where MOVE is equal to 1, these characteristics are defined as Yk. The interaction between these zone-level features and individual characteristics such as race and ACHIEVE equate to the household-zone characteristics of Xi. Thus, in our simple specification, the utility of a residence for a given family is a product of its zone-level racial and school characteristics, the zone characteristics interacted with the child’s racial and achievement profile, and family- and child-specific unobservables.
For the sake of clarity in writing out the model below, we represent the control variables STAY, HI_ACH, and ACHIEVE and their interactions with each other and with LESS_WHITE as


The parameters of interest are β3 and β4, and their estimates will be negative and statistically significant for Whites if the policy shift caused an increase in segregative zone choices among families who moved.
We underscore that both LESS_WHITE and HI_ACH are binary measures. While we recognize that this modeling choice results in some loss of granularity, we choose to use binary variables in our primary specifications because our central interest is in whether families are more likely after unitary status to make segregative moves and not in the more nuanced question related to the functional form of the relationship between zone selection and the size of differentials in racial makeup. Given this goal, the binary variables allow for clear and more easily interpretable results with respect to the key question of whether the policy change increased the likelihood of segregative residential movement. Nonetheless, we test whether our results are sensitive to using a continuous variable, NONWHITE_DIFFijt, constructed by subtracting the proportion of non-White residents in each of the zones in an individuals’ choice set from the proportion of non-White residents in their starting zone. Because of how we construct NONWHITE_DIFF, the parameters of interest on its interactions with time will be positive for Whites if the policy shift caused an increase in the probability of segregative moves.
As noted above, for each consecutive pair of years (t, t + 1), this analytic procedure involves estimating a set of j equations for each family i, as for each family we are interested in the probability of selecting from among a set of j options. As a consequence of estimating within each family, student- and family-level characteristics do not enter the equations as main effects. Rather, they enter as interactions with the characteristics of specific choices. Therefore, in order to incorporate student-level racial characteristics, we simply estimate models separately for Whites and non-Whites. Given that our data include a near-census of all students served by CMS, subsetting the data in this way does not unduly threaten the precision of our estimates.
Ideally, we would define time-specific alternatives and person–period cases in the conditional logit model and then cluster standard errors at the student level to reflect the fact that some households are observed in the data for several years. Without these additions, the model is already computationally intensive. Unfortunately, when we attempt to fit this augmented specification, the model fails to converge. Therefore, we treat each period-specific observation of an individual as independent from any other-period observation of that person. Specifying the model in this way treats each individual’s probability of moving in a given year as independent from choices made in any prior year. This simplifying assumption means that our residuals will necessarily be correlated, leading to an underestimate of our parameter estimate standard errors. To address this concern, we conducted sensitivity analyses to explore the extent to which our standard errors were underestimated. In order to do so, within each family’s set of observations (each corresponding to a possible move from year t to year t + 1), we randomly sampled a single observation and refit our model with this reduced sample. While it would be feasible, technically, to use this approach to generate standard errors empirically (similar to bootstrapping), this was impossible given the computational demands of fitting even a single iteration of the conditional logit model with a data set of this size. Therefore, we repeated this procedure 10 times in order to gauge the extent to which we should inflate our standard errors. This procedure indicated that an inflation factor of 1.5 to 2 for all standard errors serves as a suitable and conservative adjustment. In all results, we present the unadjusted standard errors but consider the standard error inflation factor in assessing statistical significance. This sensitivity check also yielded point estimates that were essentially unchanged from those presented below, providing assurance that the repeated observation of children over time did not lead to bias in our point estimates.
Results
Table 3 displays results of pooled-year conditional logit regressions for elementary school students. For each model, the first column presents results pertaining to White students, and the second column presents results pertaining to non-White students. Model I displays results from the simplest specification, which includes the variables STAY, LESS_WHITE, and their interactions with the time variables. Parameter estimates associated with STAY describe trends in mobility across school attendance boundaries over the 11-year period between 1998–1999 and 2008–2009. Together, these estimates reveal that, as expected, the most frequent residential choice families made was to not move. Note that because the majority of families do not move and because of the relatively high starting level of residential segregation (Figure 2), our modeling of families’ revealed preferences will describe choices of marginal movers rather than all families.
McFadden Choice Models Predicting Log Odds of Elementary CMS Students Selecting School Zone Based on Whether Zone Has Greater Proportion of Non-White Students, Controlling for Whether School Zone Represents Current Residence, Has Better Math and Reading Performance, and Has Better Individual Student Achievement (1999–2008)

Note. Standard errors (SEs), presented in parentheses, are the raw SEs from the nonclustered estimation procedures. A conservative inflation multiplier of 2 should be applied to all SEs. Indicators of statistical significance in this table are based on the inflated SEs.
p < .05. **p < .01. ***p < .001.
Considering results for White families, the negative coefficient on the main effect of LESS_WHITE indicates that across all years, when White families with elementary students chose to move, they had much lower odds of moving to zones with a larger share of non-White students (compared to zones with an equal or lower share of non-White students) than their current zone. LESS_WHITE×POST is the key variable of interest. The log-odds coefficient on LESS_WHITE×POST for White students is a statistically significant −0.403.
By exponentiating the linear combination of the coefficients, we obtain the associated odds ratios. In interpreting these results for White families, we also invert in order to illustrate the preference of White families for attendance zones with greater shares of students who were White—moves that are segregative in nature. These calculations reveal that between spring 2002 and spring 2003, the odds that a White family who moved would relocate to a Whiter school attendance zone were an estimated 3.1 times the odds that the family would move to a less White zone. Therefore, even prior to the declaration of unitary status, when White families chose to move, they exhibited a strong preference for communities that were less integrated than their starting community. After the declaration of unitary status, however, this preference became even stronger. Between spring 2003 and spring 2004, the estimated odds ratio was 4.5 to 1. Evidence of this elevated preference continues through the subsequent years. Whereas Weinstein (n.d.) finds small and insignificant changes in neighborhood racial composition in the immediate aftermath of the unitary status declaration, this result provides evidence of immediate effects on the revealed preferences of households as a result of the policy change.
Model II of Table 3 introduces the additional school quality variable, HI_ACH, and the interaction between HI_ACH and LESS_WHITE, which we find to be a meaningful predictor of residential decisions. We continue to observe a large, robustly significant, and negatively signed coefficient on LESS_WHITE×POST. The results in Model II indicate that after 2002, White families were much more likely to select into a Whiter but worse performing zone than their current one. However, they were no more likely to select into a Whiter and academically stronger neighborhood than before the new assignment policy.
While White families with elementary school students exhibited a decline in their odds of moving to a more non-White zone, non-White families’ odds of making the same move was more stable during this time. The coefficient on LESS_WHITE×POST in Table 3, Model I is insignificant when the standard errors are inflated. However, when we control for the academic quality of the school in the zone in Model II, non-Whites had a discontinuous decrease in the likelihood that they would move to more non-White zones after the implementation of the new assignment policy.
It is difficult to interpret any particular coefficient in Table 3 in substantive terms because of the multiple interactions. Therefore, we illustrate trends in preferences for White and non-White elementary families in Figure 5. For White families, Panel A of Figure 5 plots the odds ratio of moving to a zone that has a greater proportion of students who are White, according to whether the zone has higher average levels of student achievement than the family’s current zone. For non-White families, Panel B of Figure 5 plots the odds ratio of moving to a zone that has a greater proportion of students who are non-White, again controlling for HI_ACH. 11 That is, these panels indicate the odds that White families and non-White families will make segregative residential choices. Panel A illustrates that White families showed a clear preference for moving to zones that had a higher proportion of White students living in them, whether they were higher performing or not. If students in the zone, on average, performed equal to or worse than students in a family’s current zone on state math and reading assessments; however, the effect of zone racial composition on the probability that a family would move there varied substantially before and after the unitary status declaration.

Fitted odds ratio of moving to an elementary zone that has a greater proportion of White residents (for White families) and of non-White residents (for non-White families) than the student’s current zone, by academic performance of school within zone (1999–2008).
Among White families, the estimated odds of moving to a lower-performing, Whiter zone compared to a lower-performing, more non-White zone following the 2001–2002 school year were 3.3 to 1. The odds of making this same move increased to 5.2 to 1 following the 2002–2003 school year. The odds of moving toward a lower-performing, Whiter zone remained elevated above preunitary levels for the subsequent 5 years. White families were about twice as likely to select a zone that had a greater proportion of White student residents if student performance in the zone was either weaker or as strong as the student’s current zone. Panel B of Figure 5 illustrates analogous trends among non-White families. As indicated in the discussion above, we observe less dramatic shifts in the school-zone preferences of non-White families immediately after the unitary status declaration followed by a return to levels observed prior to the policy change.
In Model III (Table 3), we include students’ academic achievement (available only for elementary students in Grades 3 through 5), and the interaction between individuals’ achievement and the zone’s racial composition and overall performance (full sets of parameters on the ACHIEVE variable and its interactions are available on request). First, we find that White students with higher levels of academic performance are less likely to move. Among those White families who do move, those with higher achieving students are more likely to move to a better performing school zone. We find no relationship between White students’ academic performance and whether they will move to a Whiter school zone or a better, less White zone. Higher performing non-White students, however, are much less likely to move to a more non-White zone, controlling for zone-level average academic performance. Most importantly for this investigation, the coefficients on the parameters of interest are consistent with those we present in Model II. Since the inclusion of student achievement controls does not alter the substantive results of our analysis, we select the more parsimonious specification, Model II, as our preferred model. 12
When we use the continuous predictor variable, NONWHITE_DIFF to describe the discrepancy in racial composition of individuals’ starting and ending zones, our results are consistent with those in the dichotomous model. White students are more likely to move to Whiter zones after the start of the new assignment policy, but this shift is specific to zones that are no stronger academically then their starting residence. We also disaggregate the category of non-White into the race-specific categories of Black and Hispanic (all other ethnic groups combined represent less than 10% of the population). We find no meaningful differences between these results and those using a binary definition of race.
Alternative Explanations
Though our results reveal changes in residential choices aligned to the new assignment policy, we must consider whether alternative explanations are equally plausible. It is possible that policy changes other than the unitary status declaration produced the discontinuity that we observe. A key shift in national educational policy came in January 2002 when President George W. Bush signed the No Child Left Behind Act (NCLB) into law and states were required to release public report cards on school performance in the fall of 2003 for the 2002–2003 school year. Thus, it is possible that our results are a consequence of families taking advantage of newly available information on school composition and quality. The fitted probabilities for better and worse performing assignment zones, however, do not show evidence of White families selecting into better schools at higher rates in the aftermath of the policy change. In fact, the coefficient on HI_ACH×POST in Model II of Table 3 and a series of year-by-year regressions we conducted, show that White families were less likely to move to a better performing elementary or middle school zone in the aftermath of NCLB. 13 In addition, NCLB likely had little impact on information publicly available on school-level performance in CMS. Even before NCLB, North Carolina already had a strong educational accountability system based on student achievement (Carnoy & Loeb, 2003). For example, students took End-of-Grade standardized tests, teachers could earn bonuses tied to student achievement, schools were recognized publicly according to levels of test score performance, and schools faced potential sanctions or interventions for less than adequate test performance (Lauen & Gaddis, 2010). Taken together, it is unlikely that NCLB provided CMS families with much additional information with which to assess and select among the district’s schools.
While the revealed preferences of White movers were for Whiter neighborhoods, we cannot eliminate the possibility that families’ preferences may not be explicitly driven by race. Instead, these White families could be choosing to move to Whiter zones that had other preferred amenities that were also correlated with their racial composition. While our data do not permit us to exclude the possibility that household preferences were driven by zones’ socioeconomic makeup, most of the potentially observable zone differences are also likely correlated with school performance. The inclusion of HI_ACH in our models, and all the correlated amenities of a neighborhood with a stronger school, does not reduce White families’ preference for Whiter neighborhoods, postunitary decision. Minimally, we have demonstrated that White families moved in segregative directions postunitary declaration, even if race may not have been the sole driver.
Another major threat to valid causal inference based on interrupted time series analysis is that individuals can anticipate a policy shift and respond preemptively, prior to the policy’s enactment. Here, however, the tumultuous legal history in CMS suggests this is unlikely. Nonetheless, there is a concern that those families who chose to move across school attendance boundaries prior to the declaration of unitary status were different in some meaningful way from those who chose to move afterward. If this were the case, it would imply that the end of the race-conscious assignment plan did not affect individuals’ residential choice, but rather that it induced a different set of families with different preferences to move. This might also mean that a return to the previous policy would yield no integrative benefits. As reported in Figure 2, we find that in all years Black families and Hispanic families were more likely than White families to move across school attendance zone boundaries. This may be because Black families and Hispanic families are, in general, more mobile than their White counterparts. It may also be that Black families and Hispanic families live in more densely populated, smaller school attendance zones such that moves that they make may be more likely to carry them across school attendance zone boundaries. Indeed, when we examine the share of families who move either within or across school attendance zones, a much larger share of moves made by Black families and Hispanic families carry them across school attendance zone boundaries. Over the years considered, we observe, in general, a downward trend in the proportion of families moving across school attendance zone boundaries. This same pattern is true for White families, Black families, and Hispanic families. Nevertheless, as we report in Table 2 and Figure 4, we do not observe any large, discontinuous jumps in the share of families moving across school attendance zone boundaries, such that the validity of our substantive conclusions is threatened.
Discussion
The end of the race-conscious student assignment policy in Charlotte–Mecklenburg increased families’ ability to use residential choice to exercise school choice. For White families who moved during this time period and whose vector of housing preferences included neighborhood racial composition, the end of desegregation led them to be more likely to pick a neighborhood (or school zone) with a greater proportion of White student residents. Two equally plausible mechanisms may drive these patterns. One explanation is that White movers fall into two groups with distinct preferences. One set of movers prioritizes improved schooling quality as measured by student achievement on state assessments. The rate at which these families selected zones with better-performing schools was unaffected by the unitary status declaration. Another set of movers prioritizes racially isolated residential and educational settings for their children, and these families were more easily able to exercise these preferences after CMS enacted the new assignment policy. A second, competing explanation is that White movers have broadly similar preferences for neighborhoods and schools that are both Whiter and academically stronger. However, within White movers, only the subset of wealthier families is able to access preferred housing stock in neighborhoods that are both Whiter and assigned to stronger schools. In this explanation, there was no disruption in the secular relocation trends of the movers with greater financial resources on which to draw. These families continued to consistently prefer homes that were in Whiter neighborhoods and assigned to stronger schools. Their poorer counterparts, however, could not buy into their most preferred neighborhood. Instead, they selected neighborhoods that, while providing them schooling choices that were not higher performing, offered more racially similar surroundings for their children. Unfortunately, our data lack student-level socioeconomic information and, therefore, do not permit us to distinguish between these explanatory mechanisms.
The change in revealed preferences was sudden and consistent over the following 5 years. Nonetheless, it does not appear to have led to substantially different overall levels of segregation in the short term. This is not surprising. Although White families who moved after the declaration of unitary status in CMS were more likely to move in segregative ways, White families, overall, were very stable in their residential choices, with only 5% to 10% of those with elementary school students moving across attendance zone boundaries in a given year. In addition, non-White movers were marginally more likely to move to Whiter neighborhoods after the changed assignment policy. These moves would serve to counterbalance some of the segregative choices White families made during these years. Ultimately, together with the already high starting segregation levels, marginal movers alone may be insufficient to produce changes in Clotfelter’s index of segregation, at least in the short run. 14 Though we do not observe a change in the status of segregation, the rate at which individual families make choices over time that contribute to or limit segregation is the first derivative of the overall trend in segregation. Thus, we should expect to observe rising values for the segregation index in the years to come. Given the current district policy that relies on assignment zones based on residence, one would expect this to compound levels of residential segregation in the district over time.
In light of the compounding effects that we find of race-neutral plans on residential choices, and the Seattle decision’s limits on the use of race-conscious student assignment policies, American schoolchildren have increasingly fewer opportunities to benefit from residential and educational integration. A large body of research points to the potentially detrimental results of this pattern. First, “network” and “social contact” theories suggest that the connections that result from the friendships and acquaintances that children form in their neighborhoods positively affect their future life outcomes (cf. Allport, 1954; Bayer, Ross, & Topa, 2008; Ellison & Powers, 1994). Furthermore, some evidence indicates that children, particularly Black children and Hispanic children, who grow up in integrated communities have higher educational attainment, stronger labor market outcomes, and better health than their peers living in segregated neighborhoods (cf. Ananat, 2007; Angrist & Lang, 2004; Borjas, 1995; Card & Rothstein, 2007; Clark & Drinkwater, 2002; Cutler & Glaeser, 1997; Darden, Rahbar, Jezierski, Li, & Velie, 2009; Durlauf, 2004; Schwartz, 2010; Weinberg, 2000; Williams & Collins, 2001).
A separate set of literature has documented academic, noncognitive, and prosocial benefits of integrated education (Linn & Welner, 2007; Vigdor & Ludwig, 2008), though some debate persists as to whether existent research has successfully disentangled the independent effects of racial segregation from other confounding variables (cf. Armor, Thernstrom, & Thernstrom, 2006). Recent evidence suggests that court-ordered desegregation improved Black students’ high school graduation rates (Guryan, 2004; Johnson, 2011), whereas post-desegregation racial sorting worsened the Black–White test score gap (Hanushek, Kain, & Rivkin, 2009; Hoxby, 2000) and increased Black dropout rates in the North (Lutz, 2011). A combination of cross-sectional (Braddock & Eitle, 2004), longitudinal (Johnson, 2011), and experimental (Crain & Strauss, 1985) research documents improved postsecondary, labor-market, health, and incarceration outcomes for students in desegregated schools. The most rigorous meta-analysis of the impact of school diversity on race relations documents substantially reduced interracial prejudice (Pettigrew & Tropp, 2006). Furthermore, where educational segregation exists, there is potential for resources and educational quality to be distributed unequally across schools and, therefore, across racial groups (Clotfelter, 2004). Therefore, all else equal, policy makers interested in racial equity should prefer school assignment policies that promote maximal integration to avoid the potential for inequitable school conditions. Indeed, research conducted by the Center for Education Policy Research (CEPR) in Charlotte–Mecklenburg found that poor students and students of color in CMS were less likely to be taught by a teacher with tenure, with National Board certification, or who had attended a competitive college. Instead, they were more likely to be taught by a teacher with less experience, who was a late hire, or who was a novice (CEPR, 2010).
In this article we provide evidence that “state action,” which is not explicitly segregative, may nonetheless have a causal impact on individual residential choices that over time may lead to greater levels of residential segregation. Such a dynamic process might require a review of precedent barring the use of race to promote integrated schools. To be sure, race-neutral assignment policies that have disparate impacts are distinct from the stigmatizing effects of “segregation with the sanction of law” (Brown v. Board of Education, 1954). Nevertheless, our findings suggest that the line is not clear between formalized de jure segregation and informal de facto segregation resulting from residential choices. It is this lack of distinction that may necessitate a reexamination of current Constitutional jurisprudence.
Footnotes
D
L