



Abstract
Education agencies are evaluating teachers using student achievement data. However, very little is known about the comparability of test-based or “value-added” metrics across districts and the extent to which they capture variability in classroom practices. Drawing on data from four urban districts, we found that teachers were categorized differently when compared within versus across districts. In addition, analyses of scores from two observation instruments, as well as qualitative viewing of lesson videos, identified stark differences in instructional practices across districts among teachers who received similar within-district value-added rankings. These patterns were not explained by observable background characteristics of teachers, suggesting that factors beyond labor market sorting likely played a key role.
Introduction
Researchers and federal policymakers have called on schools and districts to evaluate teachers and make job decisions such as firing, promotion, and tenure using student achievement data (Duncan, 2009; Hanushek, 2009). Measuring teacher effectiveness with test-based or “value-added” metrics is appealing for a variety of reasons. These measures are relatively low cost to implement at scale due to federal testing mandates (Harris, 2009) and have been shown to be an unbiased way to identify effective teachers (Chetty, Friedman, & Rockoff, 2014; Kane, McCaffrey, Miller, & Staiger, 2013; Kane & Staiger, 2008). Further, they capture an important construct to some: an ability to raise student achievement (Duncan, 2009; Gordon, Kane, & Staiger, 2006; Hanushek, 2009).
At the same time, others question whether value-added scores support valid inferences about individual teachers and thus dispute their usefulness for job decisions and improvement efforts. Recent research suggests that value-added scores are sensitive to contextual factors, such as the specific course taught, the students in the classroom, and the set of teachers to whom an individual teacher is compared (Goldhaber & Theobald, 2012; Hill, Kapitula, & Umland, 2011; Newton, Darling-Hammond, Haertel, & Thomas, 2010). Further, weak to moderate relationships between value-added scores and classroom observations (Bell, Gitomer, McCaffrey, Hamre, & Pianta, 2012; Kane & Staiger, 2012) have raised uncertainty about the face validity of these test-based metrics (Hill et al., 2011).
A related area of inquiry that is particularly relevant to policy is the comparability of value-added rankings across districts. In this article, we ask: Are teachers ranked similarly when they are compared within versus across districts? Do these rankings signal similar or different sets of instructional practices? While we have not found any discussion on this topic in the academic literature, prior research suggests two reasons why value-added categorizations may be sensitive to the district in which they are measured. First, teachers are not randomly assigned to districts, with many factors, such as proximity to home, salary, and student composition influencing the choice of where to teach (Boyd, Lankford, Loeb, & Wyckoff, 2004; Guarino, Santibañez, & Daley, 2006; Jacob, 2007). As such, it is reasonable to predict that some districts may have a higher concentration of effective teachers, while others have a higher concentration of ineffective teachers. Second, district contexts differ in both the resources made available to teachers (e.g., curricula, professional development) and the ways in which they implement reform initiatives (Firestone, Mangin, Martinez, & Polovsky, 2005; Little, 1989; Spillane, 2000), which in turn influence instructional content and delivery. Use of high-quality curriculum materials in one district and professional development specifically aligned to these materials may lead to stronger instruction compared to districts without these resources.
Such differences would be important to policy for at least three reasons. First, it is not clear whether the signal of teachers’ effectiveness sent by their value-added rankings retains a substantive interpretation across contexts, especially in instances where teachers move from one district to another. Second, if there are large and noteworthy differences in instruction between high- and low-ranked teachers in some districts but not in others, then the latter districts may need to be cautious in making job decisions based on these metrics. Third, if instruction of high- or low-ranked teachers is stronger in some districts compared to others, this would provide an opportunity to understand what these districts do to recruit high-quality teachers or support high-quality teaching.
This article describes a mixed-methods study exploring the sensitivity of value-added categorizations to within- versus across-district comparisons and the relationship between these rankings and instructional quality. Our sample consists of teachers from four urban school districts on the East Coast of the United States whose students took a common, low-stakes assessment. This allowed us to test the sensitivity of value-added categorizations to within- versus across-district comparisons. Further, we explored whether differences existed in the instructional practices of high- or low-ranked teachers across districts. To do so, we built on the recent tradition of comparing observational and test-based metrics of teacher quality (see e.g., Bell et al., 2012; Grossman, Loeb, Cohen, & Wyckoff, 2013; Hill et al., 2011; Kane & Staiger, 2012; Stronge, Ward, & Grant, 2011) with data from two observation instruments. We also drew on a subsample of videotaped lessons to better describe these differences in instruction. Finally, we examined the extent to which findings could be explained by observable background characteristics of teachers in order to inform labor market and sorting hypotheses.
Background
Value-Added Rankings of Teacher Effectiveness
Policy discussions calling for the use of value-added models to assess and evaluate teachers assume that these models estimate the unique effects of teachers on student achievement (McCaffrey, Lockwood, Koretz, & Hamilton, 2003). Over the past several years, researchers have sought to test this claim, focusing on the extent to which value-added scores are biased by nonrandom sorting of students to teachers (Rothstein, 2010). Results from a small-scale study in Los Angeles and from the Measures of Effective Teaching (MET) project indicated that teachers previously identified as more effective using value-added scores also produced greater student growth than other teachers in the same school, grade, and subject even after random assignment of teachers to classes (Kane et al., 2013; Kane & Staiger, 2008). Chetty et al. (2014) extended this work in a quasi-experimental design that exploited variation in teacher effectiveness as a result of turnover across schools. Together, these analyses provide strong empirical support of value-added models to produce unbiased estimates of teacher effectiveness.
However, questions remain about the validity of inferences one can draw from value-added scores. One issue is the appropriate comparison group when estimating a teacher’s value-added score, which often is considered an issue of “fairness.” Should a teacher be compared to all possible teachers, other teachers who teach similar types of students and classes, other teachers in the same school? Thus, in addition to controlling for prior test scores, models oftentimes account for the composition of students in the classroom (Goldhaber & Theobald, 2012), which is thought to influence test scores beyond teachers themselves (Hanushek, Kain, Markman, & Rivkin, 2003; Kupermintz, 2003; Thum & Bryk, 1997). At the same time, studies generally have found that rankings are not highly sensitive to student and classroom controls beyond prior achievement (Aaronson, Barrow, & Sander, 2007; Goldhaber & Theobald, 2012; Hill et al., 2011; Newton et al., 2010).
A more fraught issue is whether or not to compare teachers only to other teachers in the same school. Goldhaber and Theobald (2012) demonstrated that of teachers initially ranked in the bottom quintile of value added when controlling for just student- and class-level covariates, over 11% moved out of this category when the model also controlled for school fixed effects. As teacher quality varies widely across schools, a teacher considered to be low quality when compared to all teachers in a given sample (e.g., a district) may move up the rankings when only compared to other teachers in the same school. While school fixed effects models generally are not used in practice when evaluating teachers, these findings highlight the role that schools can play when ranking teachers in this way.
In recent years, attempts to validate value-added measures also have focused on their relationship to external constructs including teaching quality. For many, this comparison is important given that value-added scores are assumed to represent “good teaching and, by extension, good teachers” (Hill et al., 2011, p. 795). This has been made possible by observation instruments that quantitatively capture the nature and quality of teachers’ instruction. The MET project found correlations between value added and a number of observation instruments in the range of .12 to .34 (Kane & Staiger, 2012). Two studies have focused specifically on the observation instruments used in this study. Bell et al. (2012) examined the relationship between scores on the Classroom Assessment Scoring System, which captures student-teacher interactions, and algebra teacher value-added scores on an end-of-course exam. They found correlations between .17 and .26 across dimensions and model specifications. In a small sample of 24 middle school math teachers, Hill et al. (2011) found somewhat higher correlations across models, between .32 and .45, utilizing a content-specific instrument, the Mathematical Quality of Instruction. Together, these studies draw mixed conclusions about the extent to which teachers’ value-added rankings signal their instructional quality.
Studies seeking to identify differences in instruction between teachers with high and low value-added scores have uncovered some differences across classrooms. Comparing fifth-grade teachers ranked in the top and bottom quartiles of value added, Stronge et al. (2011) found that low value-added classrooms had significantly more disruptive behavior and worse classroom management as well as weaker relationships between teachers and students. In a similar analysis, Grossman et al. (2013) found that high-ranked teachers in English language arts were more likely to provide explicit strategy instruction.
District Effects on Teacher and Teaching Effectiveness
The studies reviewed above raise a number of important questions regarding the interpretation of value-added scores. To what extent do comparison groups affect conclusions about teachers’ underlying effectiveness at raising student achievement? Do value-added scores signal a specific set of instructional practices?
Theory and prior research suggest that another important aspect to consider when making sense of value-added rankings is the district in which they are measured. A broad literature on teacher recruitment, retention, and turnover indicates that teachers’ decisions about where to teach are influenced by a variety of factors (for reviews, see Guarino et al., 2006; Jacob, 2007). Using data from New York State, Boyd et al. (2004) found that teachers choose jobs close to their hometowns. Aligned with labor market theory, teachers’ preferences also are related to salary (Hanushek, Kain, & Rivkin, 2004; Lankford, Loeb, & Wyckoff, 2002; Murnane & Olsen, 1990; West & Chingos, 2009). Further, teacher transfers across districts are related to their effectiveness at raising test scores (Goldhaber, Gross, & Player, 2011) and to the test scores and demographic characteristics of their students (West & Chingos, 2009). Non-random sorting based on these and other factors likely lead to differences in teacher effectiveness across districts, which could impact value-added rankings.
A second reason why value-added rankings may be sensitive to the district in which they are measured is that local education agencies differ in their ability to support teaching and learning. Historically, organizational theorists have assumed that districts lack conditions necessary to make substantive impacts on schools, teachers, or students (DiMaggio & Powell, 1983; Meyer & Rowan, 1977). However, more recent investigations, largely in the form of cross-district case studies, highlight the role that districts can and should play in educational improvement, particularly as mediators of reform efforts. Examining nine districts across Michigan, Spillane (2000) found that some were successful in bridging the gap between reformers’ proposals and teachers’ implementation of these ideas, while other districts failed to understand “the spirit” of reform and translate this into practice. One likely mechanism relates to districts’ approaches to professional development. Case studies highlight some coordinated and coherent approaches to in-service learning (e.g., content-specific development aligned to curricula) and others that were more haphazard (Elmore & Burney, 1999; Firestone et al., 2005; Hightower, 2002; Little, 1989).
Despite a strong theoretical basis to suggest that teacher and teaching quality might vary across districts, to our knowledge, only one study has explored this empirically. Using statewide data from New York, Lankford et al. (2002) created a composite measure of teacher quality comprised of teaching experience, education, and knowledge. They found that 35% of the variation in these observable characteristics lay within districts; the rest lay across districts. However, given that these observable characteristics explain only a small portion of the variability in value-added scores (Aaronson et al., 2007), this work is limited in its conclusions. Further, it is unclear how these findings relate to differences in instruction.
Directions for Current Research
To date, exploring the sensitivity of value-added rankings to within- versus across-district comparisons and how these rankings map to instructional quality has been a challenge. By and large, research studies (and policy efforts) calculate value-added estimates within districts. This is, in part, a logistical constraint, with data collection generally focused on only one district. Another reason is that states often administer different achievement tests that vary in their format, content coverage, and cognitive demand. These and other factors mean that teacher rankings can vary depending on the test of student achievement used to calculate value-added scores (Lockwood et al., 2007; Papay, 2011). Finally, with only a few exceptions (e.g., MET, TIMSS Video Study), research projects have not been able to compare the instructional practices of teachers in different district settings due to lack of broad-scale observational data. We are able to address these challenges with a unique sample and data set.
Methods
Sample
Data come from a research project conducted by the National Center for Teacher Effectiveness (NCTE), which took place in fourth- and fifth-grade classrooms across four school districts (henceforth numbered 1 through 4) from three states in the 2010–2011 and 2011–2012 school years. During recruitment, project managers presented study information to schools based on district referrals and size; they required a minimum of two teachers at each of the sampled grades. Of eligible teachers, 56% agreed to participate (ranging from 40% in District 1 to 76% in District 2). In our Results section, we show that teachers who agreed to participate in the study have similar state value-added scores to the rest of the fourth- and fifth-grade teachers in their respective districts, leading us to conclude that low participation rates should not bias our results. The full sample for whom we have both observation and test score data includes 220 teachers, with 44, 37, 32, and 107 teachers from Districts 1 through 4, respectively. 1
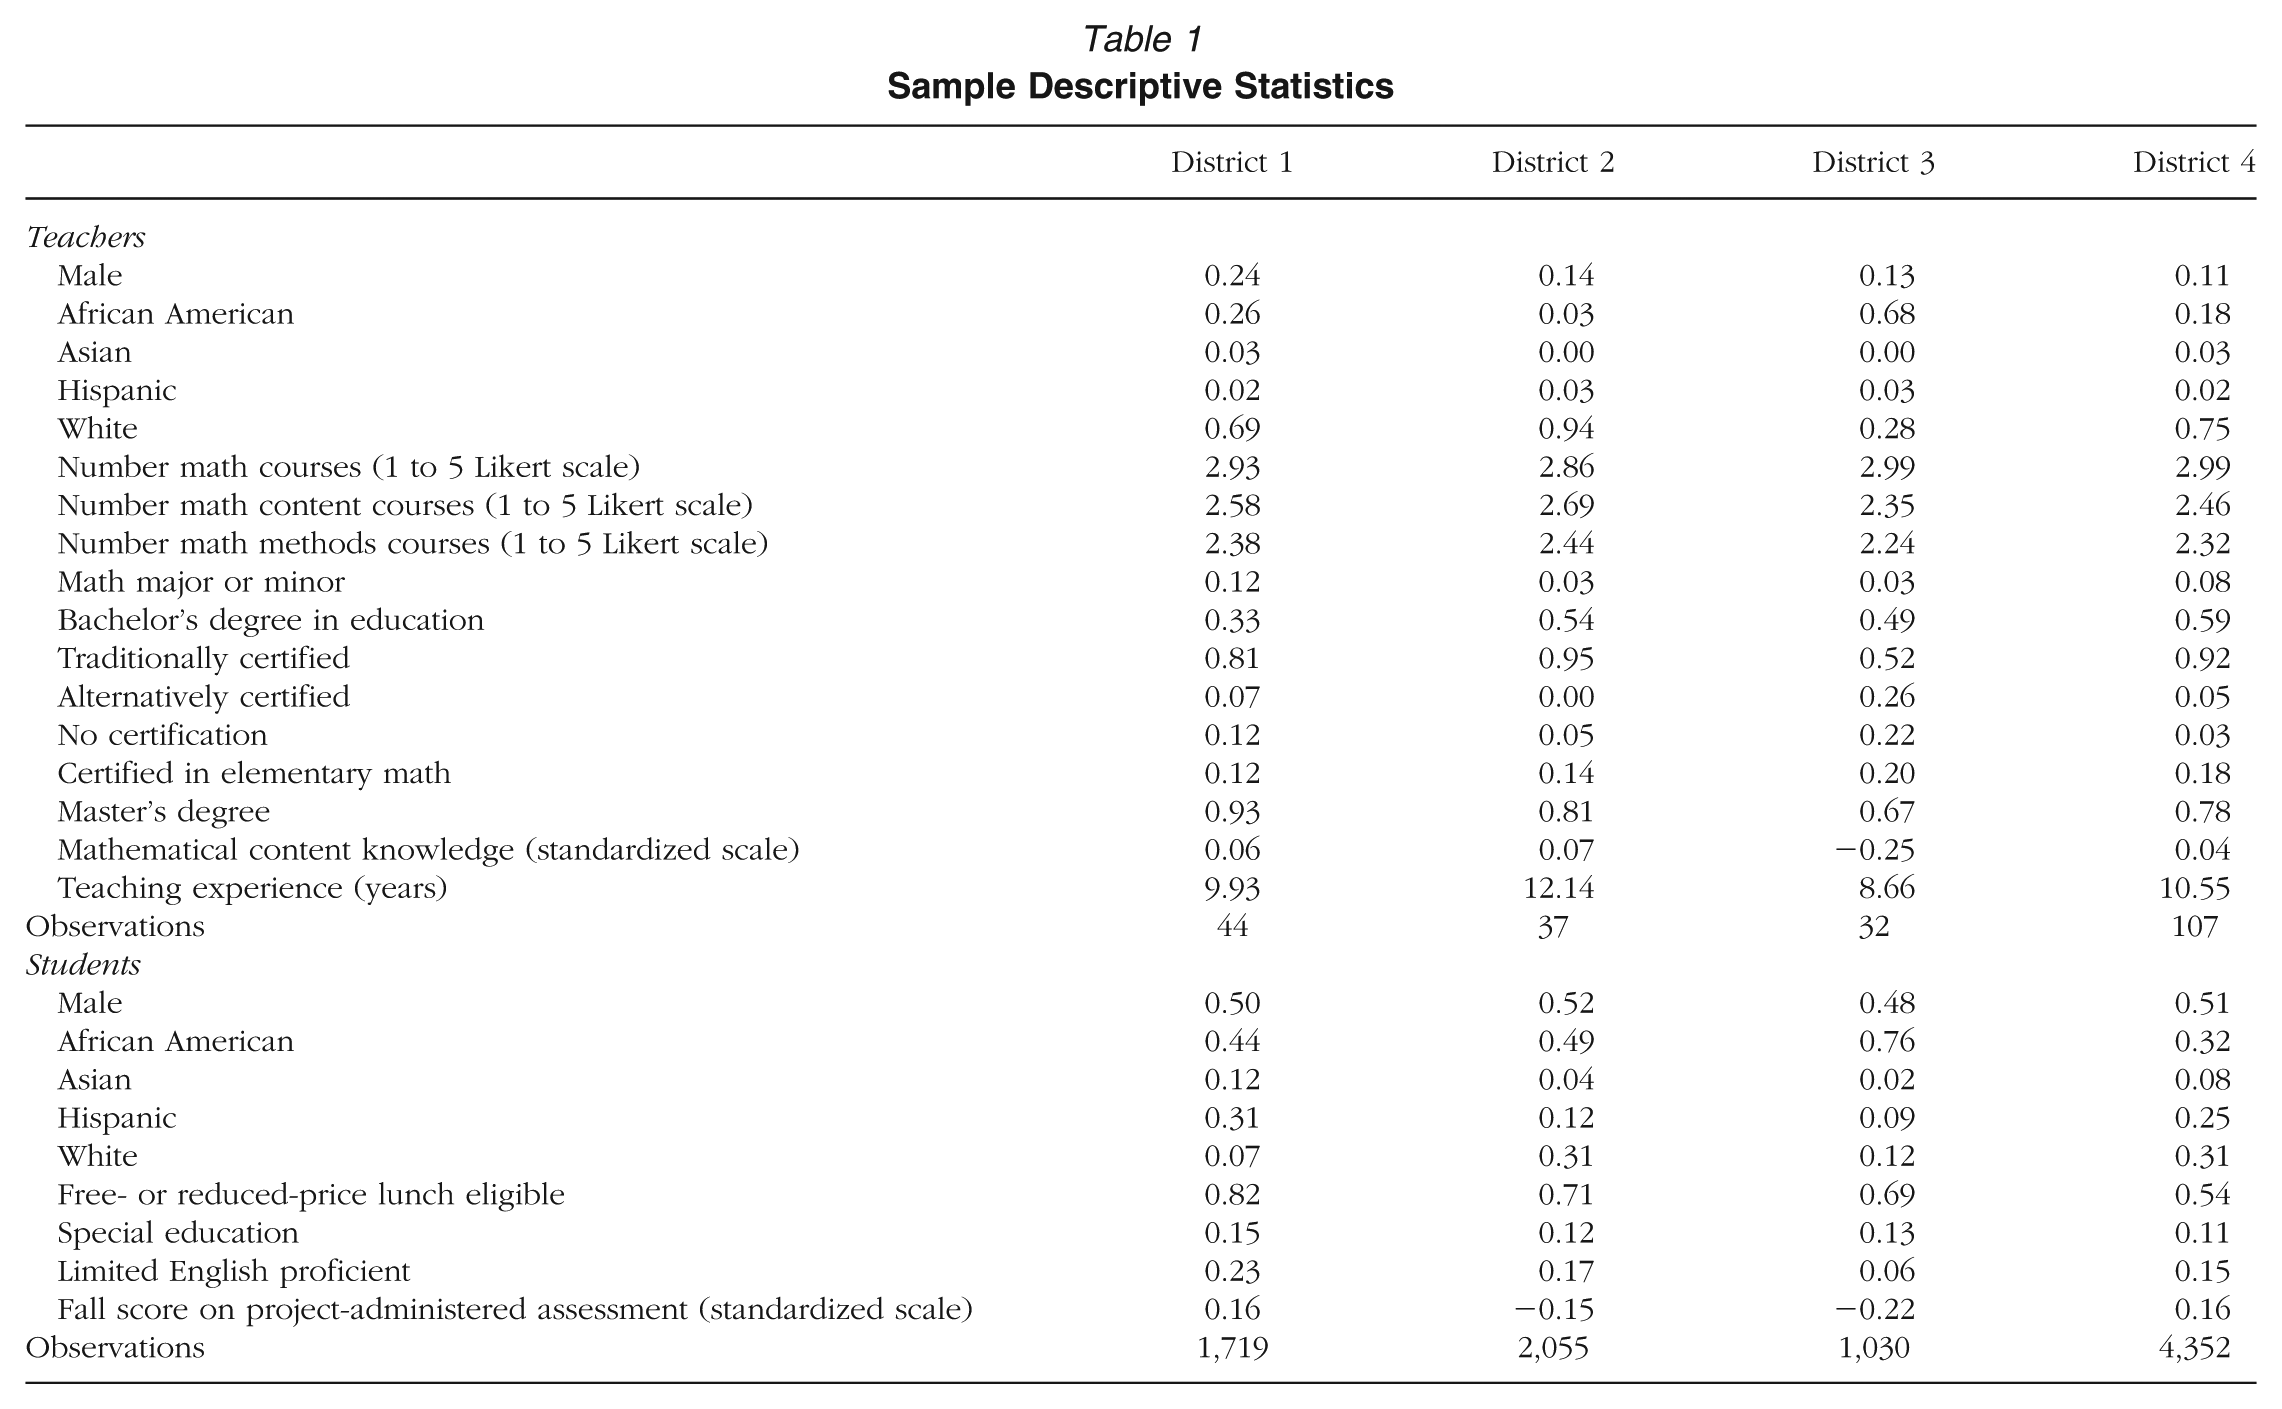
In Table 1, we present descriptive statistics on sample teachers and their students. On average, teachers in District 1 had roughly 10 years of teaching experience, compared to 12, 9, and 11 years for Districts 2, 3, and 4, respectively. District 3 had a larger share of teachers certified through alternative routes. Further, relative to other teachers in the study, those in Districts 3 scored below average on the test of mathematical content knowledge. Students in this district also scored below those from Districts 1 and 4, on average, but similarly to those in District 2 on the baseline test of mathematical knowledge that is common across districts.
Sample Descriptive Statistics
Communication with district coordinators provides additional information on these districts. As noted by Hill, Blazar, and Lynch (2015), Districts 1 and 2, which are in the same state, took the same standardized assessment and utilized the same set of curriculum materials with a strong focus on inquiry-oriented activities. District 1 paired these materials with intensive efforts to provide professional development around ambitious, inquiry-oriented mathematics instruction. In District 3, there have been recent, intensive efforts to implement a high-stakes teacher evaluation system but little focus specifically on mathematics instruction. Teachers in District 4 reported using curricula materials considered to be more procedural in nature than those in Districts 1 and 2. Additionally, the District 4 coordinator reported a moderate amount of standards-aligned teacher professional development, as compared to those in the other three districts.
Data
District Administrative Records
The first data source is administrative records, including teacher-student links, demographic information, and state test scores, for all fourth- and fifth-grade students in each of the participating districts. These data span two years of the NCTE study and up to two additional years prior. Teacher-student links were verified for all study participants based on class rosters provided by these teachers.
Coding of publicly released items from each of the high-stakes state tests suggests that they were similar in their content coverage but quite different in their cognitive demand (Lynch, Chin, & Blazar, 2015), which was assessed using the Surveys of Enacted Curriculum framework (Porter, 2002). All three high-stakes tests (Districts 1 and 2 took the same assessment) focused predominantly on numbers and operations (40% to 50%), followed by geometry (roughly 15%), algebra (15% to 20%), data (9% to 19%), and measurement (3% to 8%). However, the test in Districts 1 and 2 was considered to be the most demanding, with a large share of open-ended or short-response items (36%) that asked students to explain their reasoning and solve non-routine problems such as looking for patterns. Comparatively, tests in Districts 3 and 4 were dominated by multiple-choice items that most often asked students to execute basic procedures. These substantive differences between state tests indicate that a common assessment such as the one utilized here is necessary to compare teachers across contexts.
Low-Stakes Common Assessment
The second related data source is a low-stakes math assessment developed as part of the NCTE study and administered to all students across the four districts (see Hickman, Fu, & Hill, 2012). Students took this test in the fall and spring of each of the two school years. 2 Validity evidence indicated internal consistency reliability of .82 or higher for each form across the relevant grade levels and school years. Lynch et al. (2015) found that this assessment was most similar to the high-stakes test in Districts 1 and 2, where roughly 20% of items required explanations of student thinking or asked them to solve non-routine problems. Content coverage was similar to all three high-stakes tests.
Mathematics Lessons
The third data source is videotaped lessons of mathematics instruction. Lessons were captured over a two-year period, with three lessons per teacher, on average, per year. Most lessons lasted between 45 and 60 minutes. 3 We used these videotaped lessons for two purposes. First, we relied on preexisting scores on two established observational instruments, the Mathematical Quality of Instruction (MQI), focused on mathematics-specific practices, and the Classroom Assessment Scoring System (CLASS), focused on general teaching practices. In addition, we observed lessons as part of qualitative analyses to illustrate and triangulate findings from our quantitative results.
For the MQI, two project raters watched each lesson and scored teachers’ instruction on 13 items for each 7.5-minute segment on a scale from low (1) to high (3). For the CLASS, one rater watched each lesson and scored teachers’ instruction on 11 items for each 15-minute segment on a scale from low (1) to high (7) (for description of items, see Blazar, Braslow, Charalambous, & Hill, 2015). All raters completed an online training, passed a certification exam, and participated in ongoing calibration sessions. Raters were matched to videos based on availability, with a restriction that no rater should watch more than one lesson per teacher per year. Districts played no role in assigning available videos. Further, raters were blind to districts and were not provided any information on teachers, such as their value-added score, in a way that might have influenced the rating process.
Factor analyses of these same data (Blazar et al., 2015) identified four unique dimensions of instruction, which differ from the original structure laid out by instrument developers. Ambitious Mathematics Instruction captures opportunities for students to derive meaning about mathematical ideas and the quality of teachers’ interactions with students around this content. Mathematical Errors and Imprecisions assesses the correctness of the content taught. Classroom Emotional Support captures teachers’ interactions with students and the overall climate in the classroom. Finally, Classroom Organization details teachers’ use of behavior management and classroom productivity. 4 The first two dimensions are from the MQI, and the latter two are from the CLASS. Though the MQI assigns higher scores for Mathematical Errors and Imprecisions in cases where teachers make more errors in their instruction, we reverse coded this dimension to match the valence of the other domains. Thus, for all four domains, higher scores indicate higher-quality instruction. Given that teachers provided different numbers of lessons to the project, we utilized empirical Bayes estimation to shrink scores back toward the mean based on their precision (see Raudenbush & Bryk, 2002). Final scores were standardized within the sample.
We estimated reliability for these instructional quality dimensions in two ways. First, we calculated the percentage agreement between the two raters who scored each lesson (i.e., interrater reliability). Because only one rater scored each lesson on the CLASS instrument, these estimates only were possible for the MQI. Item-level agreement rates range from 59% to 95%. Averaging agreement rates across items within each dimension, we estimated interrater reliability of 74% for Ambitious Mathematics Instruction and 86% for Mathematical Errors and Imprecisions. Second, we calculated the amount of variance in teacher scores attributable to the teacher (i.e., the intraclass correlation), adjusted for the modal number of lessons. These estimates are .69 for Ambitious Mathematics Instruction, .52 for Mathematical Errors and Imprecisions, .55 for Classroom Emotional Support, and .65 for Classroom Organization. Though some of these estimates are lower than conventionally acceptable levels, they are consistent with those generated from similar studies (Bell et al., 2012; Kane & Staiger, 2012).
Teacher Survey
The last data source is a survey administered at the beginning of each academic year. Items captured teachers’ demographic information, years teaching math, route to certification, other specialized certifications, whether or not the teacher had a master’s degree, whether or not the teacher majored or minored in math in college, and whether or not the teacher received a bachelor’s degree in education. In addition, the survey asked about the amount of undergraduate or graduate coursework in math, math content for teachers, and methods for teaching mathematics (1 = no classes, 2 = one or two classes, 3 = three to five classes, 4 = six or more classes). Finally, the survey included test items from the Learning Mathematics for Teaching assessment (Hill, Schilling, & Ball, 2004), focusing on teachers’ pedagogical content knowledge, and the Massachusetts Test for Educator Licensure assessment, focusing on content knowledge. Given that items could not be separated empirically (Charalambous, Hill, McGinn, & Chin, 2014), we created a single construct called teachers’ mathematical content knowledge. Scores were generated by IRTPro software and standardized in these models, with a reliability of .92.
Data Analytic Strategy
Estimating Teachers’ Value-Added Scores
Our research questions ask about the extent to which teachers’ value-added categorizations are sensitive to within- versus across-district comparisons and whether the instructional quality of high- or low-ranked teachers differs across districts. To answer these questions, we began by specifying a value-added model similar to those used by Chetty et al. (2014) and Kane et al. (2013):

The outcome of interest was current-year test scores,
In order to test the sensitivity of value-added categorizations to within- versus across-district comparisons, it was important to use a test of student achievement common across districts. Therefore, we utilized the achievement test administered by the project to all students in the study. First, we calculated value-added scores using Equation 1, ranking teachers across all districts. Second, by estimating Equation 1 but adding district fixed effects, we also calculated a value-added score that ranked teachers within their own district. Then, we examined the extent to which categorizations changed across these two specifications. We also calculated value-added scores using state assessment data, running models separately for each of the four districts.
Relating Value-Added and Observational Metrics
In our second set of analyses, we examined whether there were differences in observation scores within and across districts for those teachers identified as high or low value added when compared to other teachers within their same district. Here, we considered three samples: teachers ranked in the highest or lowest value-added quartile using the state assessment, teachers ranked in the highest or lowest value-added quartile using the project-administered assessment, and teachers ranked in the highest or lowest value-added quartile using both the state and project-administered assessments. We considered all three samples given evidence on the sensitivity of value-added scores to different achievement tests (Lockwood et al., 2007; Papay, 2011). Then, we examined differences in instructional quality across districts of high- or low-ranked teachers using ordinary least squares (OLS) regression:

We regressed each individual observation score for teacher j on a set of district by value-added group dummy variables. In order to estimate the average instructional quality score for each district and value-added group, we did not include a constant term.
We note three important caveats about these analyses. First, sample sizes in each district by value-added quartile were small, particularly when focusing on teachers identified in the top or bottom quartile on both assessments. As such, we looked for broad patterns in results across samples, relying as well on qualitative analyses. Second, despite attempts to increase the precision of our observation scores and value-added estimates, both were measured with error. In turn, measurement error would introduce uncertainty into cross-district comparisons. Therefore, in a sensitivity analysis, we focused on teachers whose value-added estimates were very likely to rank them above or below the mean of teacher quality. Third, this analysis sought to identify differences in instructional quality measured by formal observation instruments. Even though the two observation instruments include a broad range of content-specific and general teaching practices, they cannot and are not supposed to capture every aspect of the classroom environment that influence learning (Pianta & Hamre, 2009).
Observations of Lessons and Teachers
In light of the limitations of formal observation protocols noted previously, we capitalized on the availability of lesson videos to paint a more detailed picture of the nature of these instructional differences. We hypothesized that re-viewing of classroom video might allow us to capture additional areas of convergence or divergence that were not included in the MQI and CLASS instruments.
Therefore, building on a tradition of mixed-methods in education research (Johnson & Onwuegbuzie, 2004) and analysis of classrooms and teaching in particular (Turner & Meyer, 2000), we observed instruction from a subsample of high- and low-ranked teachers across these districts. Specifically, we randomly selected 3 high- and 3 low-ranked teachers from each of the four districts for a total of 24 teachers. By randomly selecting a subset of teachers, we hoped to capture typical instructional practice within each district and value-added group. When selecting teachers, we only considered those ranked in the highest or lowest value-added quartile on both the state and project-administered assessment in order to ensure that rankings were not specific to a given test. For each of these teachers, we randomly selected three lessons for observation, the minimum number identified by Hill, Charalambous, and Kraft (2012) for moderately high levels of predictive reliability on the MQI. Then, we randomly assigned two authors to each video, ensuring that each watched a sample of lessons from all 24 teachers.
We utilized a broad observation protocol while observing each lesson. We identified the lesson topic, provided a brief narrative, and discussed any specific strengths or weaknesses. After watching all lessons for a given district and value-added group (e.g., teachers from the high value-added quartile in District 1), we met to review the lesson summary protocols and identify common instructional practices across lessons. We followed this process first for each teacher and then for the district by value-added group as a whole. After each meeting, we wrote detailed memos that summarized salient features of instruction for each teacher and district by value-added group, noting any points of convergence or divergence. After observing lessons for all districts and value-added groups, we coded these memos collaboratively to identify similarities and differences in instruction across groups. For this analysis, we purposefully did not blind ourselves to district or value-added group given that we wanted to uncover themes in instruction that were specific to a given group of teachers and how they differed, if at all, from those themes present in other groups. As described previously, we acknowledge that even this sort of analysis is limited in what we can capture. For example, selection of just three lessons means that we observed a subsample of a teacher’s instruction and may have missed elements such as test preparation that occurred on different days or times of the year.
Exploring Mechanisms for Instructional Differences of High- or Low-Ranked Teachers Across Districts
Previously, we described two possible mechanisms for differences in teacher effectiveness and instruction across districts: teacher labor market sorting and district policies to support instruction. This second mechanism was not easily testable with our data. However, our rich set of teacher survey data allowed us to explore the extent to which potential differences in instructional practices of high- or low-ranked teachers across districts might be related to observable background characteristics of teachers and therefore to teacher labor markets and sorting to districts.
Broadly, the education production function literature indicates that observable characteristics generally do not differentiate performance across teachers (Wayne & Youngs, 2003). As such, these measures may do a poor job of identifying labor market sorting of more skilled workers. At the same time, mathematics coursework (Boyd, Grossman, Lankford, Loeb, & Wyckoff, 2009; Wayne & Youngs, 2003), math knowledge (Hill, Rowan, & Ball, 2005; Metzler & Woessmann, 2012), and some forms of alternative certification (Clark et al., 2013; Decker, Mayer, & Glazerman, 2004) have been found to relate to teacher effectiveness. Further, statewide and nationally representative data indicate that teachers with these backgrounds and skills are unequally distributed across schools and districts (Hill, 2007; Lankford et al., 2002). Therefore, we re-estimated Equations 1 and 2 controlling for math coursework, math knowledge, certification, and other background characteristics and examined whether patterns of results remained the same. To the extent that they differed, this would provide suggestive evidence that our findings were driven by differences in teacher labor markets and potential sorting of teachers to districts, at least on the observable characteristics available in our data.
Results
Sensitivity of Value-Added Categorizations to Within- Versus Across-District Comparisons
We found that value-added categorizations were sensitive to within- versus across-district comparisons and the specific set of teachers to whom an individual teacher was compared. In Figure 1, we show the distribution of value-added scores calculated from the project-administered test when comparing teachers both within and across districts. By construction of the value-added model, within-district distributions were centered roughly at zero. However, this was not the case when teachers were compared across districts. In Districts 1 and 4, the across-district distributions were centered slightly above zero, while in District 3 the distribution was centered below zero. Further, we observed clear shifts in the tails of these distributions. In particular, in District 3, the 25th and 75th percentiles (i.e., the lower and upper edges, respectively, of the boxes in Figure 1) were lower than they were in the other districts, indicating that on average, teachers in District 3 were less effective at raising student achievement on this common assessment than teachers in the other districts. In Districts 1 and 4, the upper ends of the distributions were higher than they were for the other two districts, indicating that the most effective teachers in these districts were more effective than comparable teachers in Districts 2 and 3.

Distributions of value-added scores calculated from the project assessment, comparing teachers within and across districts.
Another way to look at this finding is to consider the percentage of teachers in each quartile when compared across districts. When we compared teachers across districts, by design, 25% of the full sample fell into each quartile. This also should have been the case if within-district value-added scores were not sensitive to district context. However, this was not true when we examined the cells in Table 2. Compared to teachers in all four districts, 44% of teachers in District 3 were in the lowest quartile, while only 13% were in the top. The former estimate was statistically significantly different from 25%. In addition, 35% of teachers in District 2 were in the second quartile, and 31% of teachers in District 4 were in the top quartile, both of which were statistically significantly different from 25%. Together, these findings suggest that teachers in Districts 2 and 3 likely were less effective at raising student achievement on the common assessment than teachers in Districts 1 and 4. 6
Percentage of Teachers in Each Value-Added Quartile When Compared Across Districts

Note. The p values denote statistically significant differences from 25%, which is the percentage of teachers in each quartile when compared within district.
p < .10. *p < .05.
Another possible explanation for these findings may be that the sample of teachers who agreed to participate in the study was not representative of teachers in the district as a whole. That is, we might have seen these results if sampled teachers in District 1 happened to be among the most highly effective in that district and those in District 3 happened to be among the least. We explored this possibility by comparing the distribution of value-added scores calculated on state tests for all fourth- and fifth-grade teachers in each district to that for the project sample (see Figure 2). In Districts 3 and 4, these samples appeared roughly equivalent at the ends of the interquartile range (i.e., the whiskers in Figure 2) and at the 25th, 50th, and 75th percentiles; the fact that there were more outliers in the full district sample may have been a function of a larger sample of teachers. In District 2, the samples were roughly equivalent except at the top end of the interquartile range. Finally, in District 1, the 25th percentile was slightly higher in the project sample than for the entire district, and the ends of the distribution were more truncated. Testing formally for equality of quantiles between the project sample of teachers and those in the rest of the district, we only found a marginally significant difference in value-added scores between the project sample and district populations (p = .070) at the 25th percentile in District 1. This leads us to conclude that the project sample of teachers is not markedly different from the entire district in a way that would distort within- versus across-district comparisons.
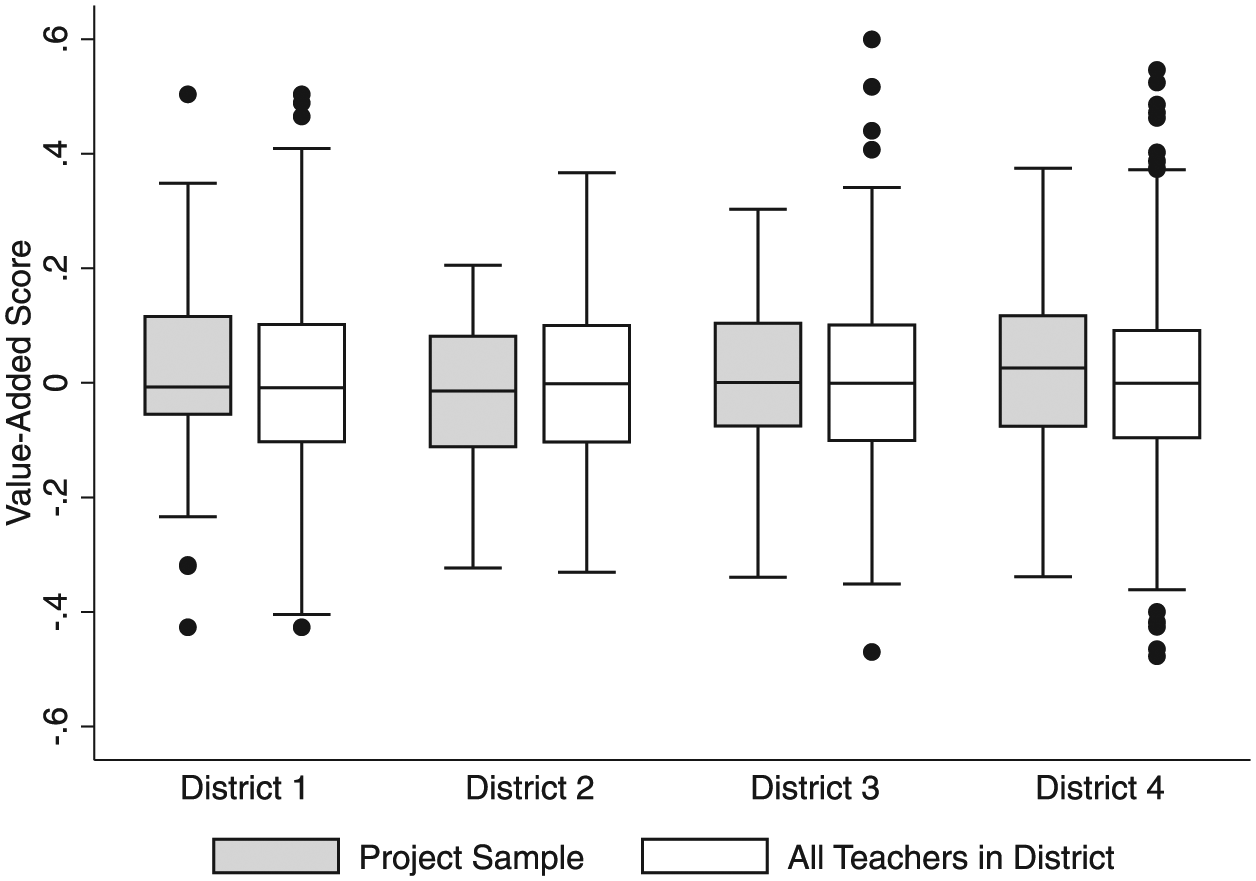
Distributions of value-added scores calculated from state standardized assessments for the project sample and all fourth- and fifth-grade teachers in each district.
Quantitative and Qualitative Differences in Instruction of High- or Low-Ranked Teachers
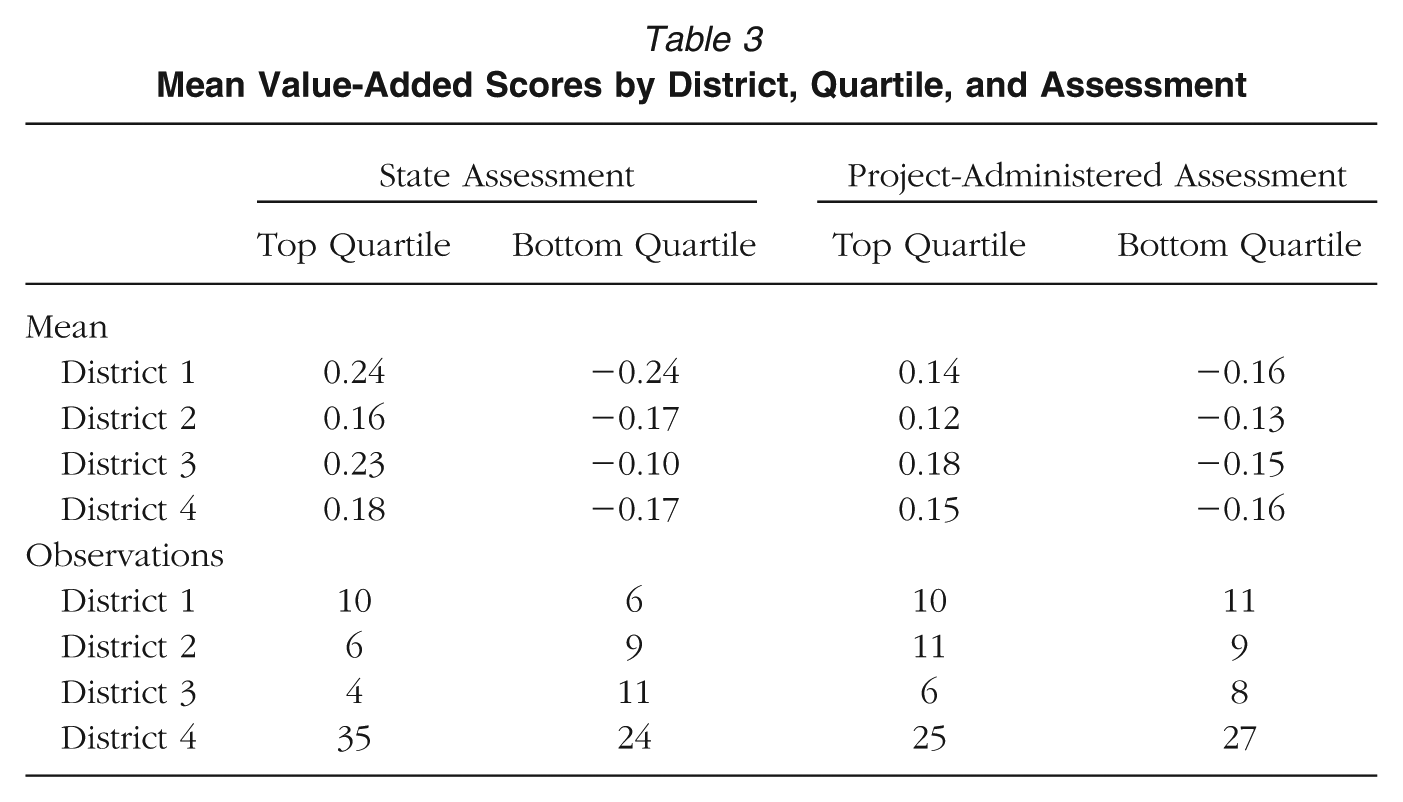
We begin this section by presenting mean value-added scores for teachers in the top and bottom quartiles of effectiveness within their respective districts (see Table 3). Specifically, we examined whether in some districts average teacher effectiveness in a given quartile corresponded to larger or smaller student achievement growth than in another district, which could have influenced comparisons of instructional quality scores across districts. When using the project-administered assessment, mean value-added scores within each quartile were fairly similar across districts. Mean scores diverged slightly when using the state assessment to calculate value added, which was not surprising given that we included only top- and bottom-quartile teachers from the larger district populations who also participated in our study. We interpret our findings comparing instructional quality scores of top- and bottom-quartile teachers in light of these differences.
Mean Value-Added Scores by District, Quartile, and Assessment
We also explored the distribution of instructional quality on the MQI and CLASS instruments across districts using all 220 teachers (see Figure 3). Relative to all teachers in the sample, those in District 1 generally scored above average on Ambitious Mathematics Instruction. Despite using the same set of curriculum materials as teachers in District 1, teachers in District 2 were distributed more evenly around the mean of zero. However, District 2 teachers lay slightly above the mean on Mathematical Errors and Imprecisions; given that we reverse coded this dimension, these higher scores indicate fewer errors made in instruction. Teachers in District 3 scored below average on both of these domains. For Classroom Emotional Support and Classroom Organization, distributions were more consistent across districts. This indicates that within our project sample, instruction generally looked stronger in District 1 than in some of the other districts, namely, District 3.
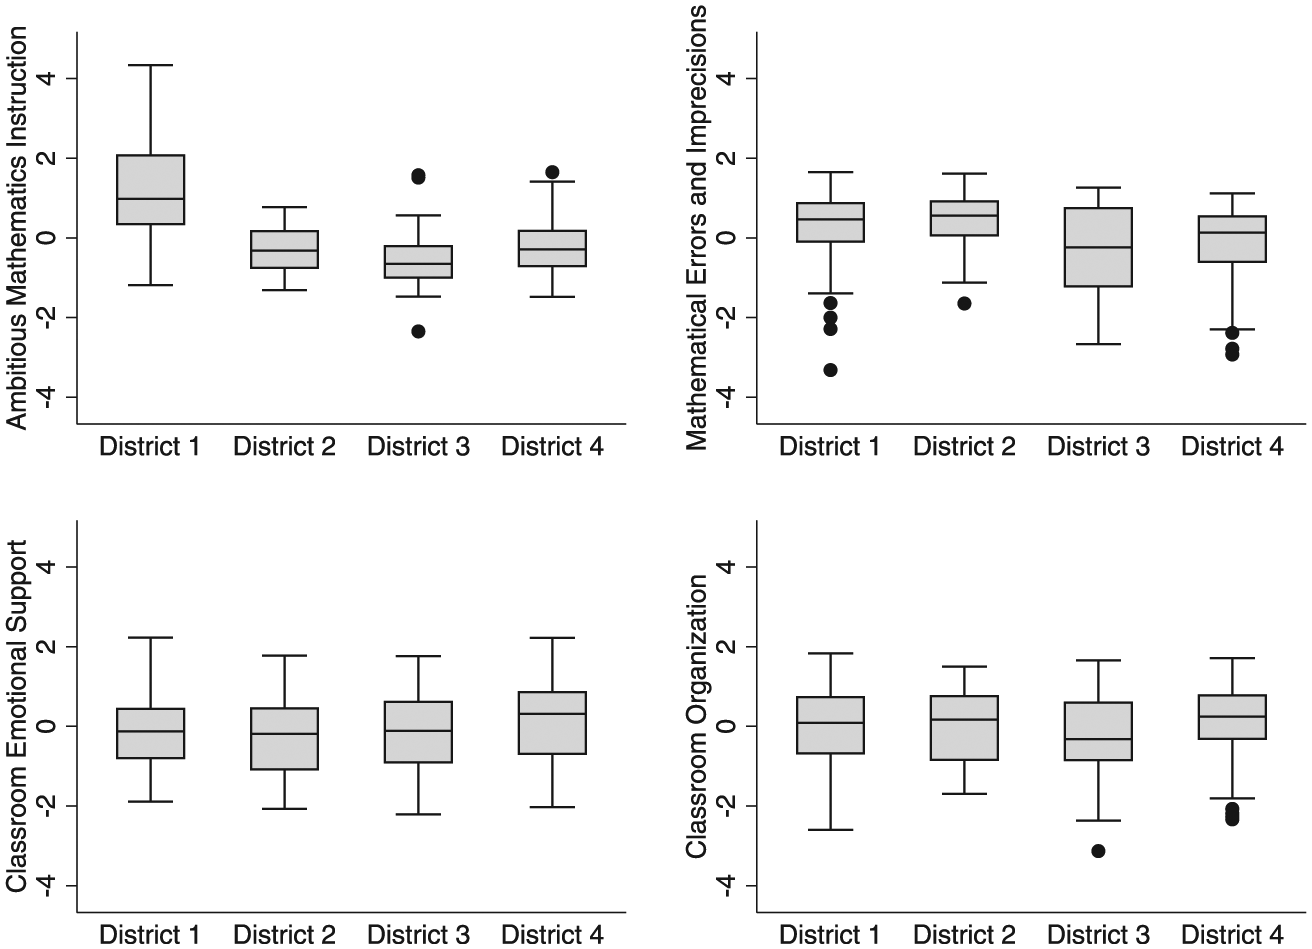
Distributions of Mathematical Quality of Instruction (MQI) and Classroom Assessment Scoring System (CLASS) dimension scores by district.
Comparison of the Gap in Instructional Quality Between High- and Low-Ranked Teachers Across Districts
Next, we made formal comparisons of the instructional quality of high- or low-ranked teachers across districts (see Table 4). We calculated estimates from a regression framework without any constant in order to present mean values on the MQI and CLASS instruments for all district and value-added groups. We also conducted a set of post hoc Wald tests to look for differences between these groups both within and across districts. Although we ran analyses for teachers identified as high- or low-ranked on the high-stakes state test, the low-stakes project-administered test, and both tests, we found that patterns of statistical significance generally were consistent across these three. This is noteworthy given that each assessment identified slightly different sets of high- or low-ranked teachers. Further, although small samples within each district by value-added quartile is a limitation of this study, the consistency of our findings across samples suggests that we may be less concerned that sampling idiosyncrasies were driving results. Therefore, we focus our discussion on the group of high- or low-ranked teachers on both assessments and present findings for each assessment separately in an online appendix (see Supplementary Table S1 available in the online version of the journal). We also note that findings were robust to comparisons of teachers whose value-added scores were estimated most precisely (i.e., teachers whose 90% confidence interval around their value-added estimate placed them decidedly above or below the mean of zero) (see Supplementary Table S2 in the online journal).
Differences in Observation Scores for High- and Low-Ranked Teachers on Both Assessments by District
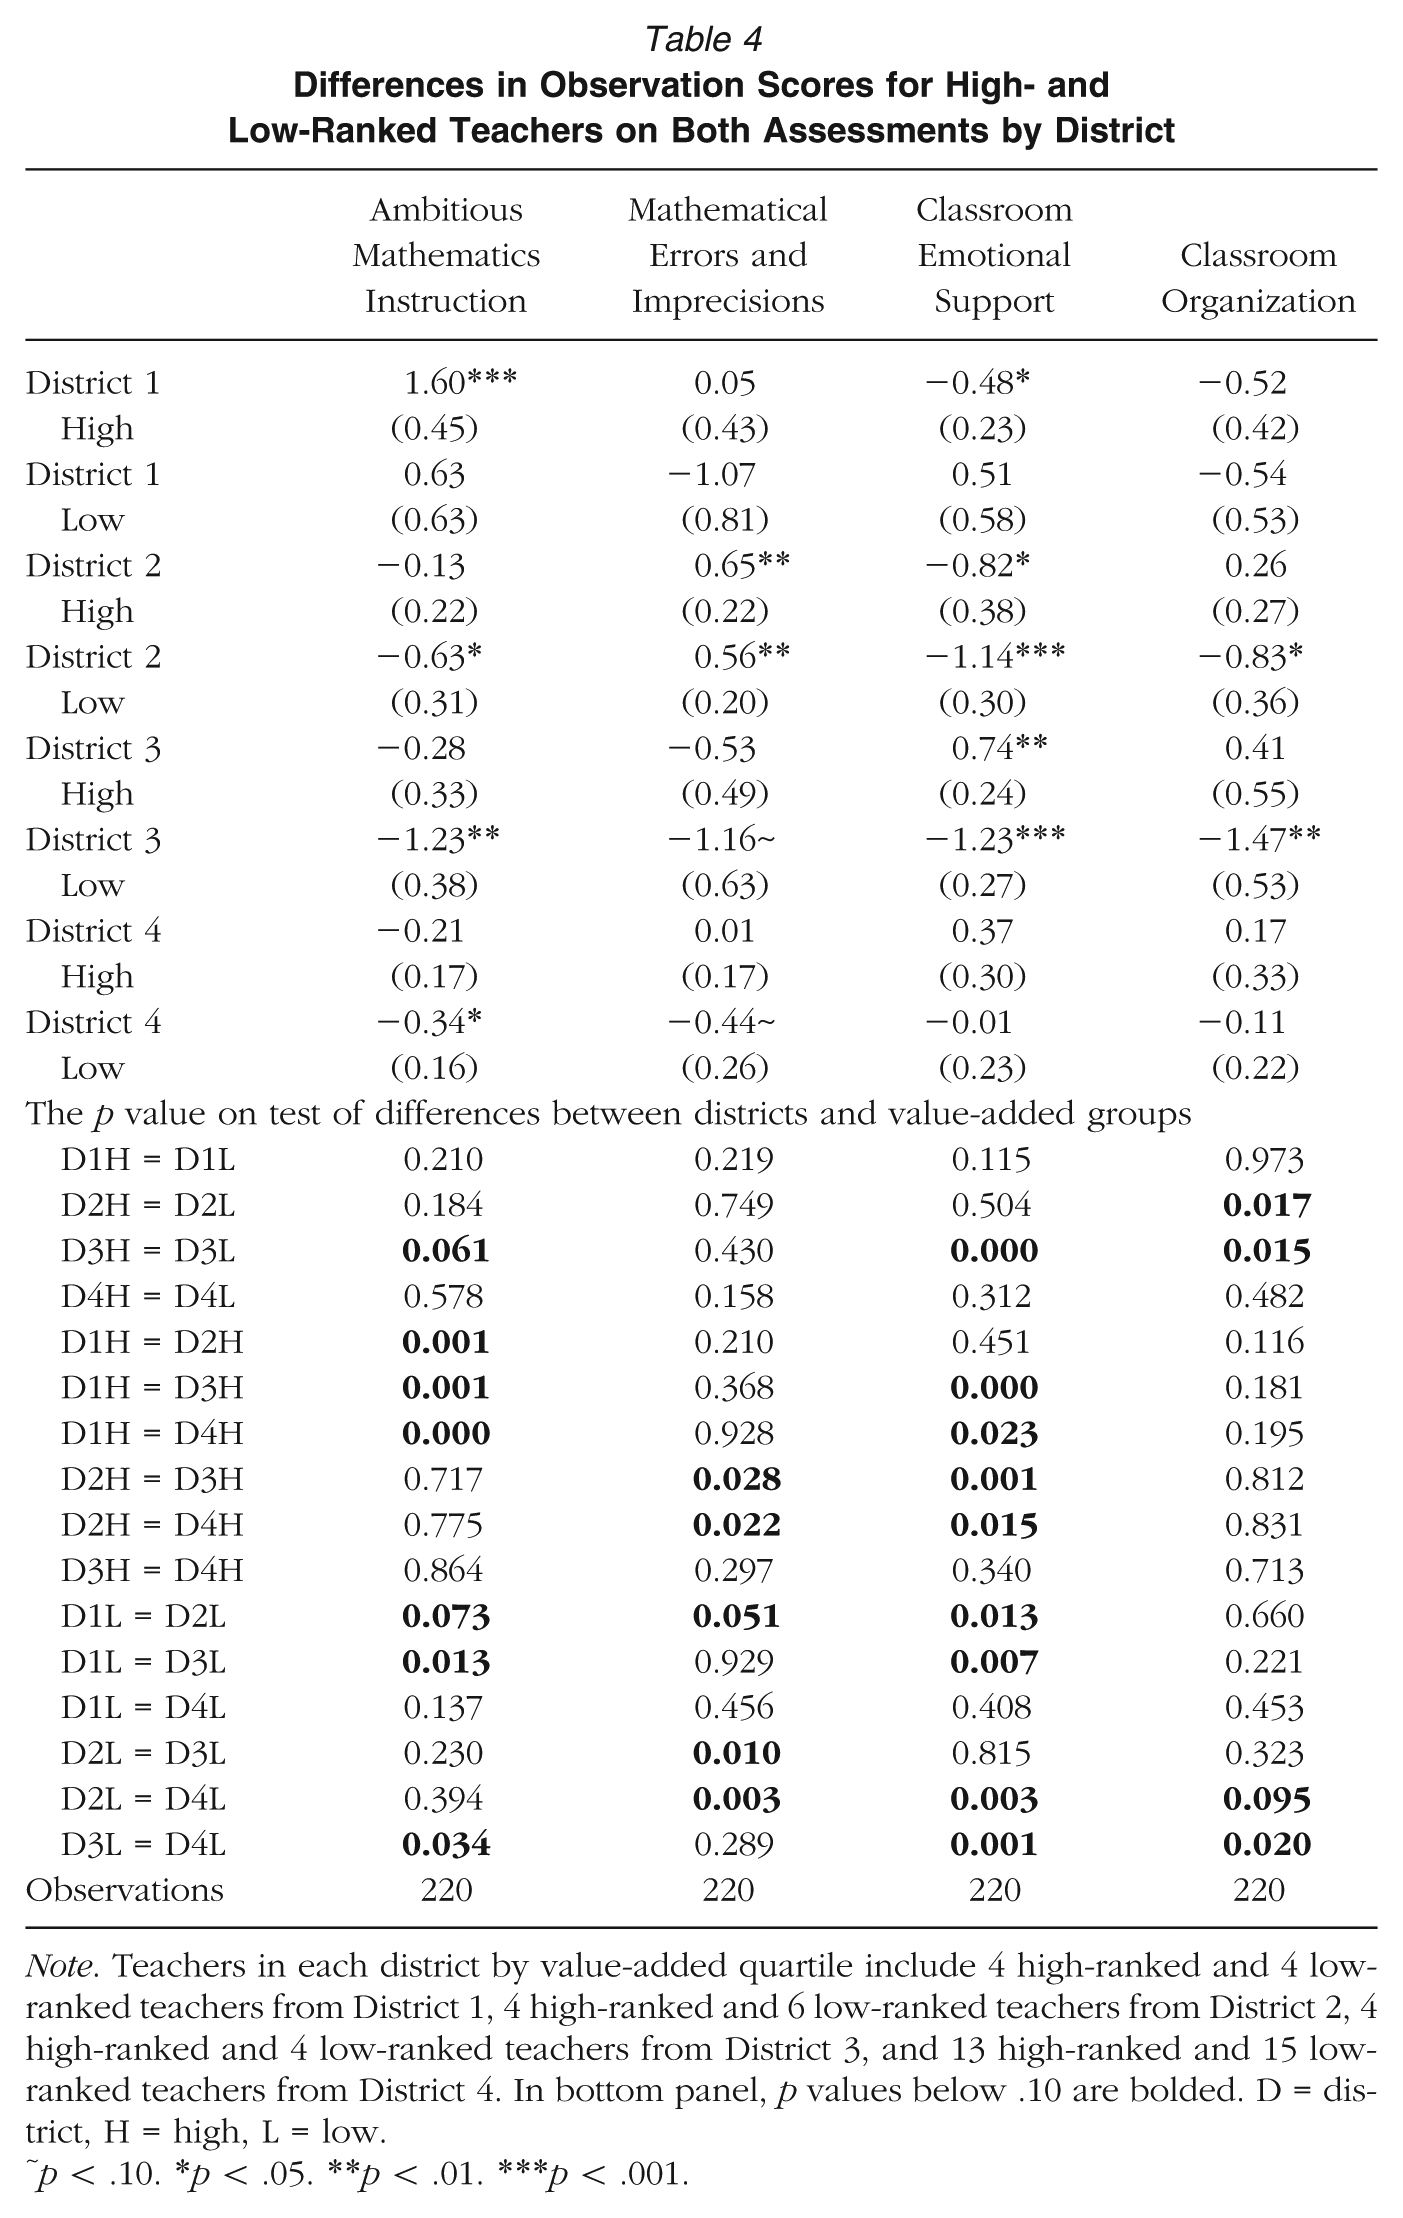
Note. Teachers in each district by value-added quartile include 4 high-ranked and 4 low-ranked teachers from District 1, 4 high-ranked and 6 low-ranked teachers from District 2, 4 high-ranked and 4 low-ranked teachers from District 3, and 13 high-ranked and 15 low-ranked teachers from District 4. In bottom panel, p values below .10 are bolded. D = district, H = high, L = low.
p < .10. *p < .05. **p < .01. ***p < .001.
Comparing high- versus low-ranked teachers within districts, we generally found that instructional quality scores of the former scored higher than the latter. This was expected and was consistent with the positive correlations between value added and observation scores found in other studies (Bell et al., 2012; Hill et al., 2011; Kane & Staiger, 2012). One exception was in District 1 for Classroom Emotional Support, where the average score for high-ranked teachers was substantively lower than the average score for low-ranked teachers (and statistically significantly different when comparing teachers using only the project-administered test; see Supplementary Table S1 in online journal).
At the same time, the gap between these average scores differed across districts. We consistently found differences between high- and low-ranked teachers in District 3. Most starkly, low-ranked teachers in District 3 scored almost 2 standard deviations (SD) below high-ranked teachers in this district on both Classroom Emotional Support and Classroom Organization (p < .001 and p = .015, respectively). For average Ambitious Mathematics Instruction scores in this district, the gap between high- and low-ranked teachers of 1 SD was marginally statistically significant (p = .061). We also observed gaps of similar magnitude in District 1 on Ambitious Mathematics Instruction and Mathematical Errors and Imprecisions. However, differences between high- and low-ranked teachers only were statistically significant on the second domain when using larger samples of teachers identified as high or low value added on the state assessment or the project-administered assessment (see Supplementary Table S1, available online). Comparatively, gaps in District 2 for all dimensions except for Classroom Organization and in District 4 for all four dimensions were much smaller, between roughly 0.1 SD and 0.5 SD. We illustrate these results in Figure 4 by plotting the distance between high- and low-ranked teachers on each dimension of instruction by district. We excluded District 1 for Classroom Emotional Support, given that high-ranked teachers scored lower than low-ranked teachers.
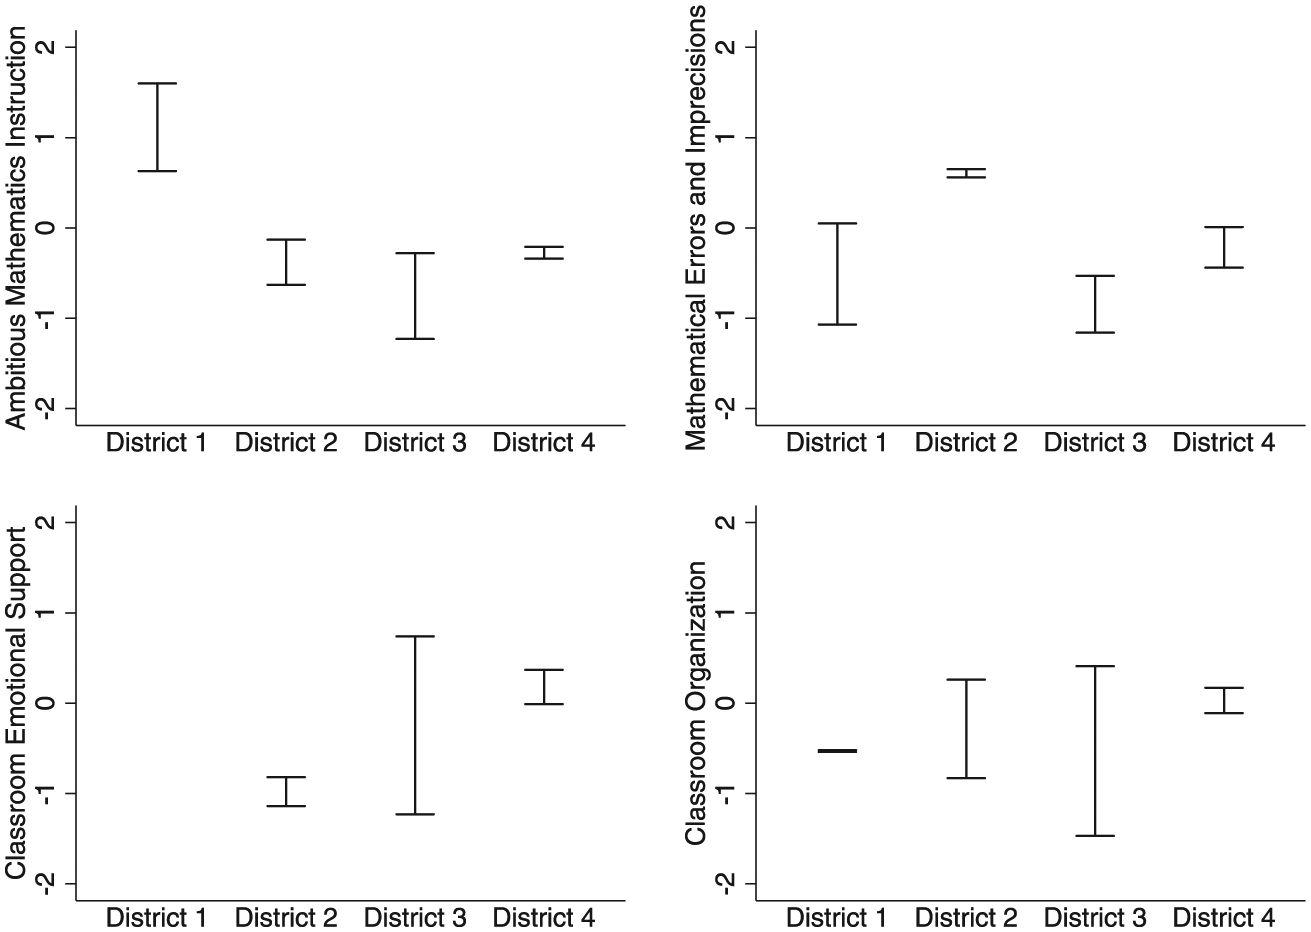
Average Mathematical Quality of Instruction (MQI) and Classroom Assessment Scoring System (CLASS) scores for high-ranked teachers (top bar) and low-ranked teachers (bottom bar) using both the state standardized and common assessments by district.
Similar to the quantitative results presented previously, lesson observations and coding of memos also revealed variability across districts in the gap between high- or low-ranked teachers. In District 1, instruction by high-quartile teachers based on within-district value-added scores was characterized by a focus on conceptual understanding, purposeful sequencing of tasks, and frequent student contributions. Instruction by teachers in the low value-added quartile in District 1, on the other hand, was quite different, characterized by low-level tasks and lessons without a coherent direction or mathematical purpose. We observed similar variability between high- and low-ranked teachers in District 3, though the overall level of instructional quality was lower. High-ranked teachers engaged largely in procedural instruction, with some focus on remediation of student errors. In contrast, instruction from low-ranked teachers lacked mathematical depth in all classrooms and included frequent errors.
Conversely, in Districts 2 and 4, the instructional differences between teachers ranked in the highest quartile by within-district value-added scores and those ranked in the lowest quartile were far less stark. In District 2, we observed a mixture of strong and weak features in the instruction of both groups. Lessons were decently structured and generally free of major errors but often lacked depth to the mathematical content and were characterized by teacher talk at the expense of substantive student contributions. A notable commonality across high- and low-ranked teachers in District 2 was consistent review and preparation for the state standardized test. In District 4, teachers in both value-added groups engaged students in the mathematical content but also tended to offer lower-level tasks. While we observed fewer mathematical errors in the instruction of teachers in the high value-added quartile than those in the low valued-added quartile, errors still were present in both sets of lessons. This suggests that being ranked in the highest value-added quartile versus the lowest quartile may not carry as strong a signal of instructional quality in these two districts as it does in the others.
Comparison in Instructional Quality of High- or Low-Ranked Teachers Across Districts
We also compared instructional quality scores of high-ranked teachers across districts and similarly for low-ranked teachers. Beginning with a comparison of high-ranked teachers, we found differences between some districts for both mathematics and general teaching practices. For example, high-ranked teachers in District 2 scored between 0.7 SD and 1.2 SD higher than similarly ranked teachers in Districts 3 and 4 on Mathematical Errors and Imprecisions (p = .028 and .022 for Districts 3 and 4, respectively), indicting fewer errors made in instruction. However, these high-ranked teachers in District 2 also scored between 1.1 SD and 1.6 SD lower than high-ranked teachers in Districts 3 and 4 on Classroom Emotional Support (p = .001 and .015, respectively), indicating weaker relationships and interactions with students. Lesson observers also provided evidence of these differences, particularly around mathematical errors, though coding of memos indicated that other elements of instruction were more salient.
Most notable in these comparisons, high-ranked teachers in District 1 scored substantially higher than high-ranked teachers from the other three districts on Ambitious Mathematics Instruction. Specifically, high-ranked teachers in District 1 scored 1.6 SD above the sample mean on this dimension, compared to 0.1 SD, 0.3 SD, and 0.2 SD below the mean for Districts 2 through 4, respectively (p = .001 comparing District 1 to Districts 2 and 3, and p < .001 comparing District 1 to District 4). These differences indicate a greater focus on concepts and a stronger ability to work with students around the content from high-ranked teachers in District 1 than from high-ranked teachers in other districts. One possible explanation for this finding may be that high-ranked teachers in District 1 had higher state value-added scores, on average, than similarly ranked teachers in Districts 2 and 4 (see Table 3). However, these moderate differences in value-added scores are unlikely to explain the large differences in average instructional quality scores we observed.
Observer memos also highlighted substantive differences in the nature of Ambitious Mathematics Instruction from high-ranked teachers in District 1 relative to high-ranked teachers in other districts. For high-ranked teachers in District 1, lessons were characterized by a consistent focus on conceptual understanding of mathematics. In one lesson, the teacher pushed students to find multiple ways to subtract four-digit numbers without using the standard algorithm. In a different teacher’s lesson, the class investigated the “silhouette” of 3D solids, making conjectures about what some might look like and identifying patterns they noticed. In contrast, the instruction offered by high-ranked teachers in District 3 was largely procedural. While students in these lessons consistently worked on mathematics, the instruction had little focus on conceptual understanding and few instances of ambitious mathematical practices. In addition, all three teachers made at least one content error (e.g., confusing 0.5% with 50%, incorrectly solving a problem on permutations), with two teachers also consistently exhibiting imprecisions in their mathematical language.
For low-ranked teachers, we also found a number of statistically significant differences between districts for both mathematics and general teaching practices. Low-ranked teachers in District 2 made fewer errors than similarly ranked teachers in all other districts (p = .051, .010, and .003, comparing District 2 to Districts 1, 3, and 4, respectively). Low-ranked teachers in District 4 scored higher than low-ranked teachers in Districts 2 and 3 on Classroom Emotional Support (p = .003 and .001, respectively) and on Classroom Organization (p = .095 and .020, respectively). Finally, low-ranked teachers in District 1 still provided more Ambitious Mathematics Instruction than low-ranked teachers in Districts 2 and 3 (p = .071 and .013, respectively). This difference was particularly stark in District 3, where low-ranked teachers scored over 1.8 SD lower on this domain, on average, than low-ranked teachers in District 1. This is especially noteworthy given that the average state value-added score of low-ranked teachers in District 1 of −0.24 SD was considerably lower than similarly ranked teachers in District 3 of −0.10 SD (see Table 3).
Coding of observer memos highlighted differences across districts of low-ranked teachers with regard to the nature of Ambitious Mathematics Instruction, errors, and classroom organization but less so for teachers’ relationships and interactions with students. In particular, we observed that instruction of low-ranked teachers in District 3 was especially low quality. Across all three teachers observed, there was no evidence of mathematical depth in the lessons offered to students. This was due in some cases to a largely procedural focus of instruction, a lack of clarity when inquiry-oriented instruction was attempted, or, in a few instances, a lack of focus on mathematics. For example, one teacher spent a full class having students design rooms for their homes, focusing on the design itself with only brief mention of dimensions. Many students were off task for all or part of the lesson. When teachers attempted more ambitious activities, they often struggled with the content. Two teachers in particular exhibited a consistent lack of content knowledge, imprecisely defining key terms and struggling to convey central material.
This was quite different from the instruction observed in the lowest ranked teachers from Districts 1 and 4. In these districts, low-quartile teachers’ lessons were characterized by procedural instruction centered on mathematical content. In District 4, there often were attempts to develop mathematical ideas in meaningful ways, either through math language or tools and manipulatives that had the potential for conceptual understanding. At the same time, the cognitive demand of tasks was low. In District 1, tasks were similarly low level; however, we observed few errors in the presentation of the math and consistent attention to student difficulty.
Surprisingly, we found that this type of instruction from low-ranked teachers in District 1 was stronger than the instruction of high-ranked teachers in other districts. Specifically, the lowest ranked teachers in District 1 scored roughly 0.8 SD to 0.9 SD higher than high-ranked teachers in the other three districts on Ambitious Mathematics Instruction (see Figure 4). Formal comparisons between these scores did not reveal statistically significant differences for those teachers identified as high or low quality on both assessments. However, we did observe statistically significant differences when drawing from larger samples of high- or low-ranked teachers either on the state or project-administered assessments (see Supplementary Table S1 in online journal). Focusing on the state assessment, low-ranked teachers in District 1 scored statistically significantly higher on Ambitious Mathematics Instruction than high-ranked teachers in District 3 and District 4 (p = .069 and p = .039, respectively). Using the project-administered assessment, low-ranked teachers in District 1 scored statistically significantly higher on this dimension than high-ranked teachers in Districts 2 and 4 (p = .018 and p = .010, respectively). Observations of instruction led to similar conclusions. We found that instruction from low-ranked teachers in District 1 appeared most similar to the instruction of high-ranked teachers in District 3. Taken together, these results indicate significant variability in the instructional quality of teachers ranked high or low value added in one district compared to similarly ranked teachers in another. 7
Teacher Sorting on Observables as a Possible Mechanism for Cross-District Differences
Finally, we examined whether observable background characteristics explained some of the patterns and cross-district differences described thus far. If so, this might be related to teacher labor markets and potential sorting to districts. For example, if some districts were able to hire a pool of teachers with much stronger knowledge of math content, we might also expect these teachers to provide stronger mathematics instruction, even before receiving specific supports from schools and districts.
However, when we re-ran models controlling for observable background characteristics of teachers—including math content knowledge, math coursework, certifications, gender, and race—these variables did not appear to alter original findings. First, we recalculated across-district value-added scores using the project-administered assessment controlling for these characteristics. We did not control for teaching experience or indicators for a teacher having earned a master’s degree, as these variables may describe teacher characteristics after entering the profession. Math content knowledge also was measured after teachers entered the classroom but was unlikely to be influenced markedly by district-level development programs (Garet et al., 2011). Here, we still found an unequal share of teachers in each quartile across districts (see Table 5). Forty-one percent of teachers in District 3 were in the lowest quartile of value added and 13% of teachers were in the top, compared to 44% and 13% when we did not control for these teacher characteristics. Further, when we used our original within-district value-added scores but reexamined cross-district differences in MQI and CLASS scores of high- or low-ranked teachers controlling for these observable teacher characteristics, most patterns described earlier remained (see Table 6). Of the four statistically significant differences in instructional quality scores of high- versus low-ranked teachers (using both assessments) within a given district (e.g., Ambitious Mathematics Instruction for high- versus low-ranked teachers in District 3), all persisted. Of the 9 differences of high-ranked teachers across districts (e.g., Ambitious Mathematics Instruction of high-ranked teachers in District 1 versus District 3), 8 persisted. Finally, of the 12 differences for low-ranked teachers across districts (e.g., Ambitious Mathematics Instruction of low-ranked teachers in District 1 versus District 3), 10 persisted. Magnitudes of cross-district differences also were quite similar. While our analyses here are exploratory in nature, we interpret these results as suggestive evidence that observable background characteristics of teachers did not drive cross-district differences in instructional practices and that factors beyond labor market sorting likely played a larger role.
Percentage of Teachers in Each Value-Added Quartile When Compared Across Districts, Controlling for Teacher Characteristics
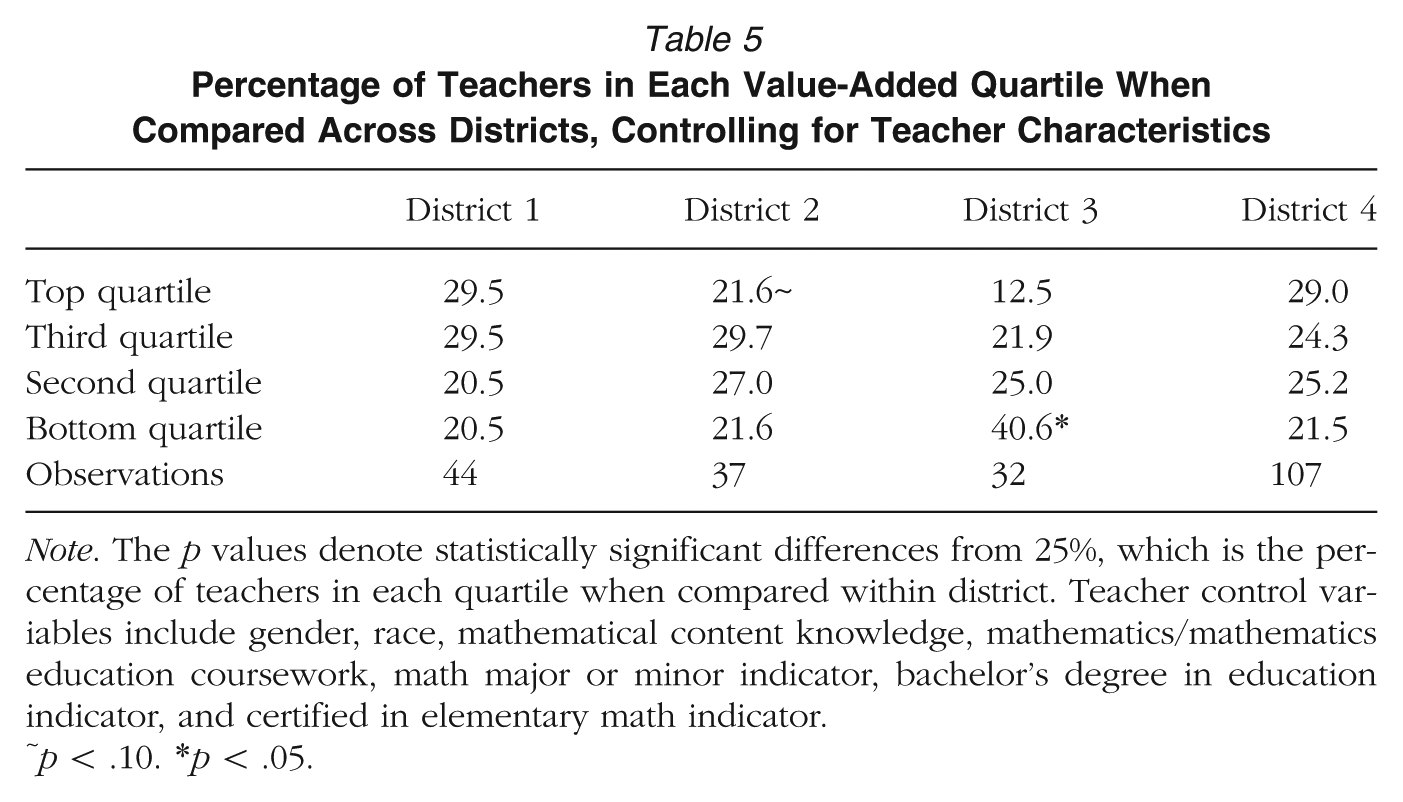
Note. The p values denote statistically significant differences from 25%, which is the percentage of teachers in each quartile when compared within district. Teacher control variables include gender, race, mathematical content knowledge, mathematics/mathematics education coursework, math major or minor indicator, bachelor’s degree in education indicator, and certified in elementary math indicator.
p < .10. *p < .05.
Differences in Observation Scores for High- and Low-Ranked Teachers on Both Assessments by District, Controlling for Teacher Characteristics
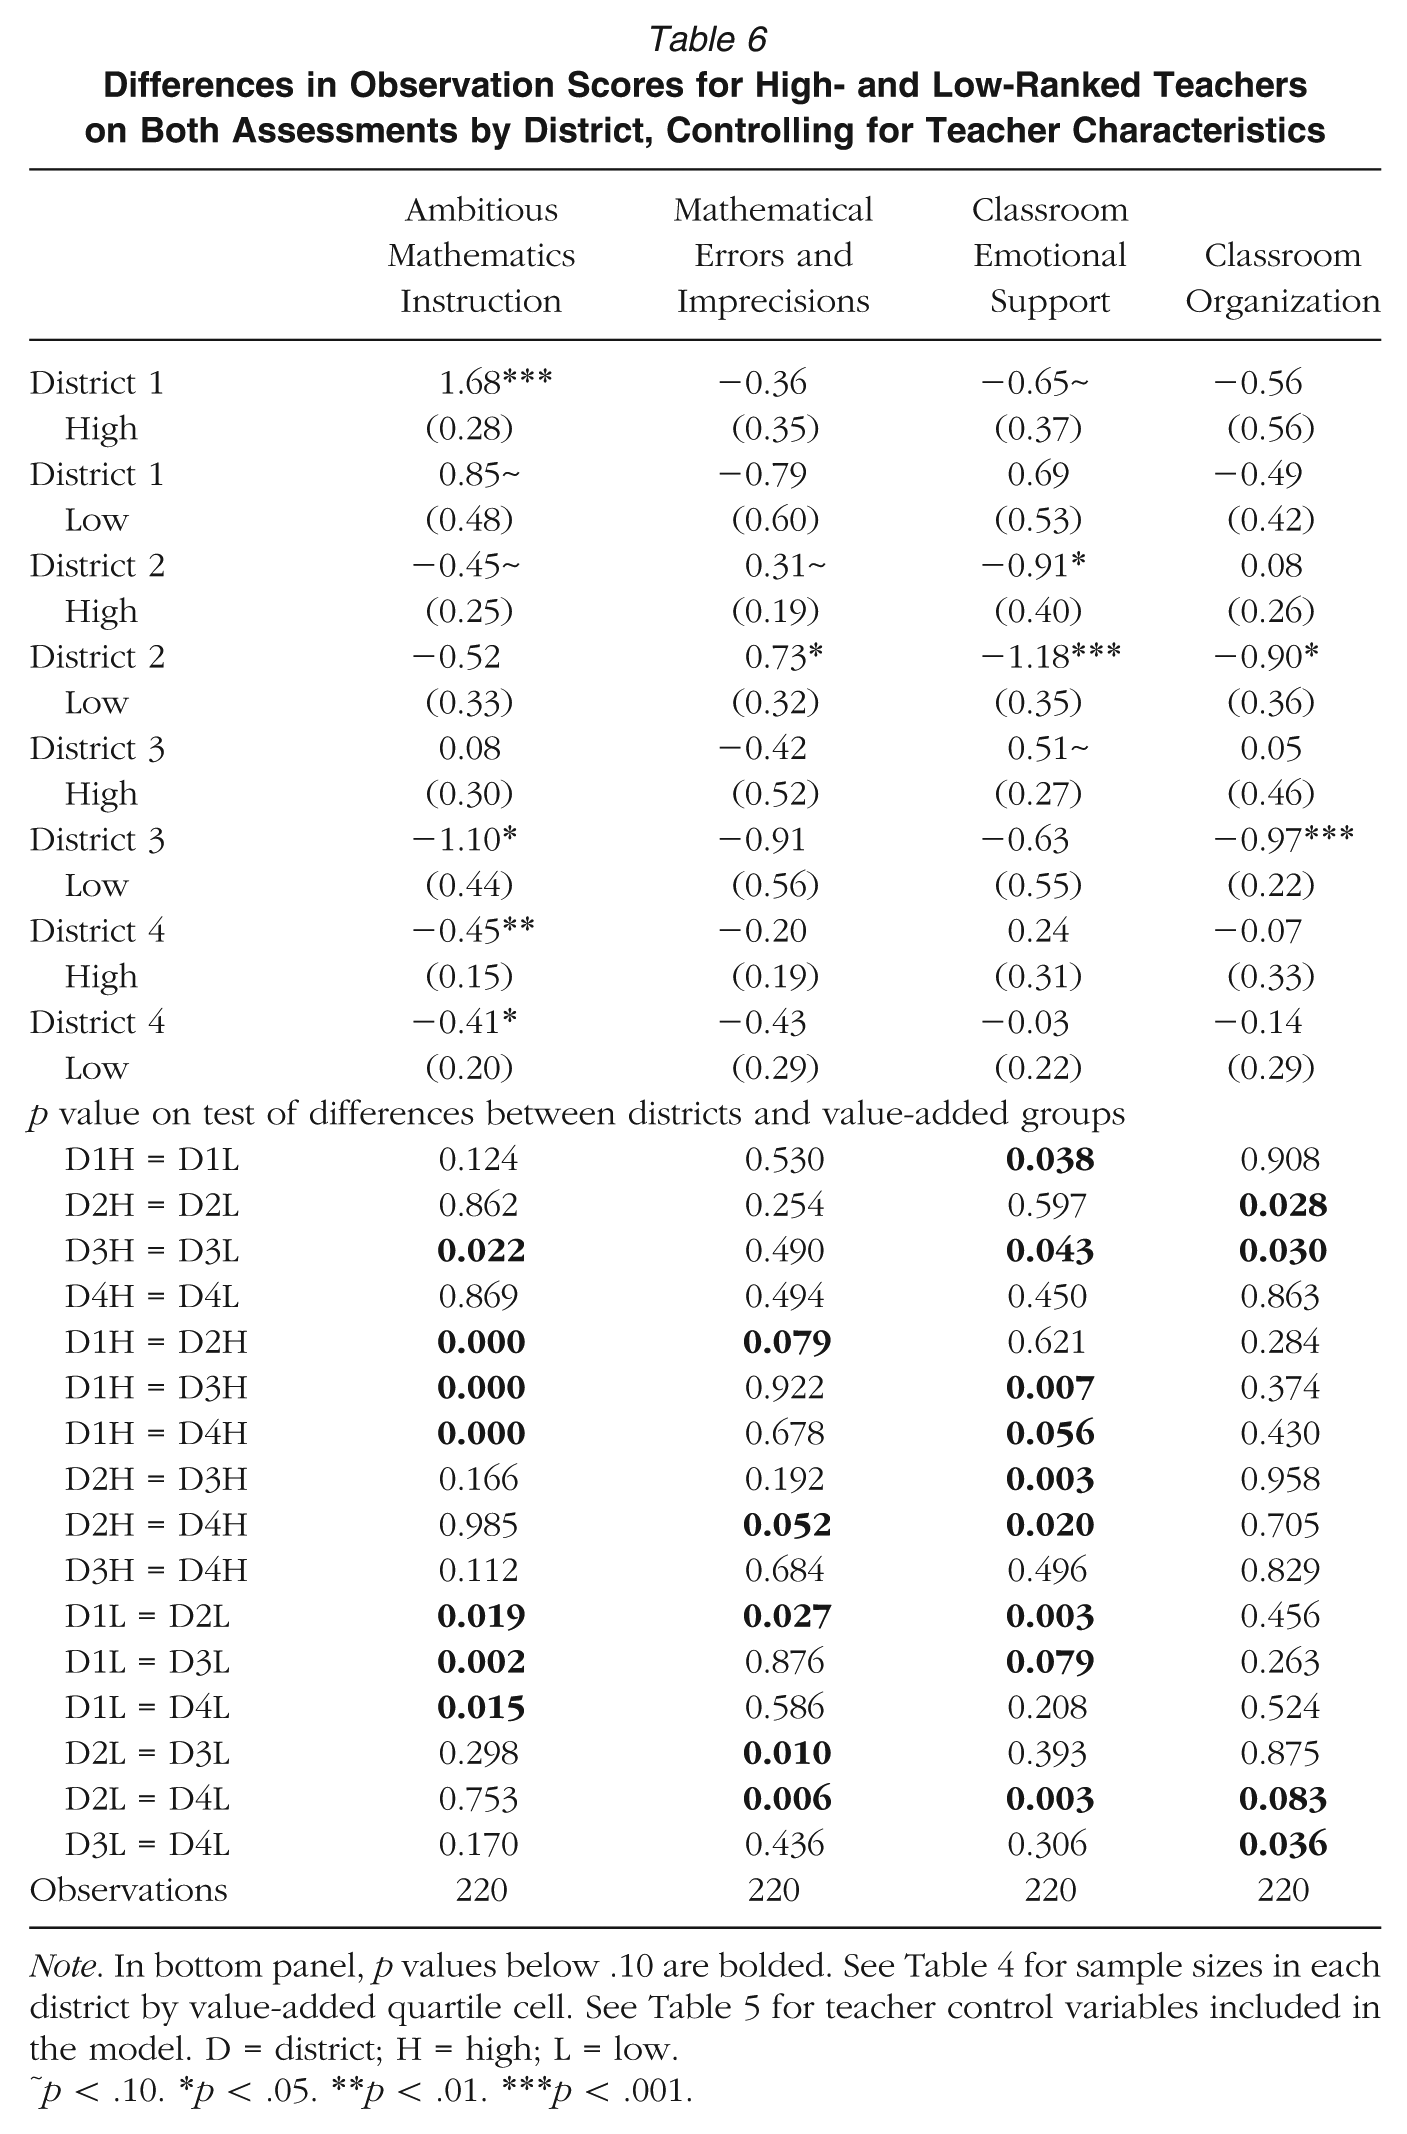
Note. In bottom panel, p values below .10 are bolded. See Table 4 for sample sizes in each district by value-added quartile cell. See Table 5 for teacher control variables included in the model. D = district; H = high; L = low.
p < .10. *p < .05. **p < .01. ***p < .001.
Conclusion
Discussion of Key Findings
Our study contributes to a growing body of evidence on the sensitivity of value-added rankings to context (Goldhaber & Theobald, 2012; Hill et al., 2011; Newton et al., 2010) and the extent to which test-based measures of effectiveness signal specific sets of instructional practices (Bell et al., 2012; Grossman et al., 2013; Hill et al., 2011; Kane & Staiger, 2012; Stronge et al., 2011). To our knowledge, this article is the first to examine the sensitivity of value-added categorizations to within- versus across-district comparisons and the extent to which differences might be related to instructional quality.
There are a variety of limitations to our work. Our study included a relatively small sample of teachers from only four districts. Relatedly, while the project sample of teachers appeared similar to the rest of the teachers in their respective districts with regard to state value-added scores, they may have differed in other ways. Consistency of results across sets of teachers identified as high or low value added based on separate assessments provides suggestive but not conclusive evidence that patterns reflect true population differences rather than sampling idiosyncrasies. In addition, our measures of teacher effectiveness and instructional quality were measured with error. We took a variety of efforts to increase precision (i.e., using multiple years of test score and observational data); we also explored the sensitivity of results to a sample of teachers whose value-added estimates were measured most precisely. However, we acknowledge that measurement error introduces an element of uncertainty. Finally, while we sought to explain the sensitivity of value-added estimates to within- versus across-district comparisons through the lens of instruction, we recognize our limited knowledge about the production function that converts classroom behaviors into student learning. Observation instruments and qualitative analysis of videotaped lessons likely allowed us to capture some but not all factors that were important to student outcomes. It also is possible that these instruments are differentially sensitive to teaching practice across districts or that instruction that generates student achievement differs across settings. At the same time, our results are strongly suggestive of themes that, if confirmed, have a number of important implications for policy.
First, despite new discourse around quality teachers and quality teaching at a national level (Duncan, 2009), it is clear that labels such as highly effective or ineffective based on value-added scores do not have fixed meaning. In our sample, teacher rankings were sensitive to within- versus across-district comparisons. When compared to teachers across all districts, those in Districts 1 and 4 were ranked notably higher than those in the other districts, and those in District 3 were ranked notably lower. This finding is similar to research indicating the sensitivity of value-added categorizations to school fixed effects (Goldhaber & Theobald, 2012). Our work also is consistent with related research that highlights differences in observable teacher characteristics across districts (Lankford et al., 2002).
Second, when comparing teachers within districts, value-added rankings signaled differences in instructional quality in some but not all instances. Like Stronge et al. (2011), we found that classroom organization differentiated high- and low-ranked teachers in District 3; content-specific elements of instruction also differentiated high- and low-ranked teachers in District 1, similar to findings from Grossman et al. (2013) in English language arts classrooms. However, in Districts 2 and 4, these signals did not appear as strong. In other words, the gap between the quality of instruction from teachers ranked high and low by value-added scores appeared notably wider in Districts 1 and 3 than it did in Districts 2 and 4. Inconsistent relationships between observations and value-added scores across districts may be one reason for the weak relationships between these metrics identified in other work (e.g., Kane & Staiger, 2012).
Relatedly, value-added categorizations did not signal common sets of instructional practices across districts. In particular, our sample of high- and low-ranked teachers in District 1 scored substantially higher, on average, on Ambitious Mathematics Instruction than counterparts in other districts. In fact, we observed that instruction of low-ranked teachers in District 1 was notably stronger than that of both low- and high-ranked teachers in other districts. Qualitative analyses corroborated these patterns.
Finally, we found evidence that these cross-district differences were not explained away by a host of observable background characteristics, including math coursework, math content knowledge, and certification. Given evidence relating these characteristics to teacher effectiveness (Boyd et al., 2009; Clark et al., 2013; Decker et al., 2004; Hill et al., 2005; Metzler & Woessmann, 2012; Wayne & Youngs, 2003), these analyses suggest that labor market differences and sorting of higher-quality teachers to districts are unlikely to account for the large differences in instructional quality that we observed.
A possible alternative explanation is that differences stem from district-specific resources and capacity to support instruction. Our analyses lend empirical support to decades’ worth of theory and smaller-scale case studies highlighting the role that districts play in educational reform efforts (Elmore & Burney, 1999; Firestone et al., 2005; Hightower, 2002; Little, 1989; Spillane, 2000). Although we did not have a systematic way to test this hypothesis with our data, interviews with district leaders emphasized a number of key differences between districts in their approaches to instructional improvement (Hill et al., 2015). For example, in District 1, where instruction of both high- and low-ranked teachers was the highest quality, teachers utilized curriculum materials and a state assessment that were considered more cognitively demanding than those in other districts. At the same time, District 2 also utilized these resources yet had weaker instruction across a range of teacher practices. Another factor may be related to professional development. We suggest this in light of District 1’s long history of intensive efforts to provide teachers with professional development around Ambitious Mathematics Instruction. Determining the causal mechanisms for differences in instructional practices of high- or low-ranked teachers across districts will be an important area for future research.
Policy Implications
Given these results, we, like others (Grossman et al., 2013; Hill et al., 2011), argue that value-added scores on their own are limited in their ability to inform job decisions and improvement efforts. The challenge of interpreting value-added scores may be most salient for recruitment and hiring decisions when veteran teachers apply for a teaching position in a new district. In these instances, school leaders may not be able to use prior value-added scores as a proxy for a teachers’ underlying effectiveness or the quality of their instruction. The fact that we observed variability across districts in the gap between the quality of instruction of high- and low-ranked teachers also raises concern about using these rankings for within-district job decisions. For example, in District 4, we found some differences between the quality of instruction in classrooms of teachers from the high and low quartiles of value-added rankings; however, these differences were small and made us question whether it would be appropriate to consider one group for firing and another for career advancement or rewards. Even when the gap was wider, as it was in our sample in District 1, administrators and policymakers may still want to proceed with caution when using value-added categorizations to make job decisions. Here, the instructional quality of the lowest ranked teachers was not particularly weak and in fact was as strong as the instructional quality of the highest ranked teachers in other districts. In similar contexts, it may make sense to invest in improvement efforts over recruitment from outside the district.
In order to make value-added scores more interpretable across contexts, districts and states may consider calculating a number of estimates for each teacher, namely, within school, within district, within state, and possibly even across state. Together, these rankings would provide a package of information to assess a teacher’s effectiveness relative to a variety of comparison groups. Although this will require coordination between education agencies, recent implementation of Common Core State Standards–aligned assessments in many states and districts around the United States makes this proposal feasible. In light of limitations of this study due to small sample sizes, researchers may also be interested in using these common assessments to determine whether results from this study extend to other districts and settings.
Like other researchers and many education agencies (Center on Great Teachers and Leaders, 2013; Hill et al., 2011; Papay, 2012), we also maintain that value-added scores should be used in conjunction with additional measures of teacher and teaching quality, including observation instruments. Pairing these measures will help provide a clearer picture of each teacher’s effectiveness that can be used to make decisions on appropriate professional development to offer that teacher or whether to exit that teacher from the system.
Strategic use of these measures may be equally important for education agencies to assess the quality of teaching in the district as a whole. In this study, we observed stark differences in instructional quality across four urban school districts, particularly with regard to the nature of ambitious, inquiry-oriented mathematics instruction. This was true both on average— where the mean Ambitious Mathematics Instruction score in District 1 was substantively higher than in other districts—and in the tails of the achievement distribution. The ambitious and inquiry-oriented mathematics practices that we observed in many classrooms of teachers in District 1 are not endorsed by all but do align with benchmarks set by leading scholars and professional organizations (Lampert, 2001; National Council of Teachers of Mathematics, 1989, 1991, 2000); further, they predicted student outcomes in analyses conducted on these same data (Blazar, 2015). Thus, broad scale observation of teaching practice may help districts identify areas for common improvement. One way to accomplish this may be to leverage evaluation systems that utilize observation instruments, presuming these instruments capture pertinent dimensions of teaching and raters are equipped to assess teachers on them.
Lastly, in order to be able to provide high-quality education to all students, it is important that researchers and practitioners understand why these stark differences in teaching practice exist across districts. Our research provides suggestive evidence that these differences are unlikely to be related to teacher labor markets; instead, they may be related to the combination of resources and policy interventions and how districts mediate reform efforts. These findings provide a unique opportunity to understand what local education agencies such as District 1 do to support instruction and how these efforts may be implemented in other settings.
Footnotes
Notes
D
E
J
References
Supplementary Material
Please find the following supplemental material available below.
For Open Access articles published under a Creative Commons License, all supplemental material carries the same license as the article it is associated with.
For non-Open Access articles published, all supplemental material carries a non-exclusive license, and permission requests for re-use of supplemental material or any part of supplemental material shall be sent directly to the copyright owner as specified in the copyright notice associated with the article.
