



Abstract
Despite growing international interest in the use of data to improve education, few studies examining the effects on student achievement are yet available. In the present study, the effects of a two-year data-based decision-making intervention on student achievement growth were investigated. Fifty-three primary schools participated in the project, and student achievement data were collected over the two years before and two years during the intervention. Linear mixed models were used to analyze the differential effect of data use on student achievement. A positive mean intervention effect was estimated, with an average effect of approximately one extra month of schooling. Furthermore, the results suggest that the intervention especially significantly improved the performances of students in low socioeconomic status schools.
Keywords
Introduction
Today, data play an important role in informing decisions in all sectors of society: from commercial organizations adjusting their sales strategy based on the analysis of customer behavior, to hospitals evaluating their treatment effectiveness, and teachers adapting their instruction to well-defined student needs (Lai & Schildkamp, 2013). In education, there is a growing emphasis on the use of data to base decisions on, assuming that this will lead to increased student achievement. Although only a few studies provide empirical evidence for the effect of data-based decision making (DBDM) on the achievement of students, there is considerable empirical evidence for the elements DBDM can be decomposed into, such as the impact of feedback, setting goals, and improving instructional quality.
In line with an increasing interest all over the world, the government in the Netherlands promotes the use of data to improve education. At the University of Twente, an intervention aimed at data-based decision making has been developed. A multiple single-subject design was used to investigate the effect of this DBDM intervention on student achievement growth and explore patterns in DBDM effectiveness based on background variables at both the school and the student levels.
Theoretical Framework
The Background of DBDM
The increasing interest in data use in education is twofold. On the one hand, there is the accountability context in which school leaders and teachers are held accountable for the quality of the education they provide (Lai & Schildkamp, 2013). Data, such as student achievement scores on standardized tests, are used in a summative way for the purpose of accountability to external parties such as parents and (in the Netherlands) the Inspectorate of Education. On the other hand, there is a growing recognition that data should not only be used for compliance and accountability but also for continuous improvement (Kingston & Nash, 2011; Lai & Schildkamp, 2013; Mandinach, 2012). In that context, data use is seen as a way to inform teachers about students’ needs and adapt and adjust instruction based on such information. School leaders can use data as the basis for their decisions at the school level (Lai & Schildkamp, 2013). Although there is growing emphasis on data use, Mandinach (2012) argues that data use to inform instructional decisions is nothing new. Teachers collect information about their students all the time: They ask questions, observe students, and examine students’ work. Mostly, teachers process this information to help them make informed decisions. However, this may not always be done systematically. Technological developments enable educators to collect, analyze, interpret, and distribute data in increasingly efficient and systematic ways (Mandinach, 2012). For example, a student monitoring system allows schools to monitor students’ progress throughout their entire school careers (Kamphuis & Moelands, 2000). In such a system, student achievement data can be easily stored, manipulated, and retrieved. Furthermore, data can be represented in such a way that the data are easy to interpret (e.g., in graphs and growth models). Moreover, the increased use of national standardized tests makes it possible to compare student performance against national benchmarks.
Growing interest in data use is reflected by the growing body of literature on this topic. Recently, several special journal issues and edited volumes have been dedicated to this topic (e.g., Coburn & Turner, 2012; Schildkamp, Ehren, & Lai, 2012; Schildkamp, Lai, & Earl, 2013; Turner & Coburn, 2012). Hamilton et al. (2009) make recommendations regarding the use of student achievement to support instructional decisions based on the available evidence regarding data use. However, they also conclude that few studies draw firm conclusions on the effects of data use and that recommendations are based primarily on case studies, descriptive studies, and expert opinions (Hamilton et al., 2009). In her literature review of data use in education, Marsh (2012) recognized a similar trend: The majority of studies regarding data use are descriptive (e.g., case study design, interviews, focus groups, observations, document analysis). However, some studies show that the use of data to reflect on and adapt education can improve student achievement (Campbell & Levin, 2008; Carlson, Borman, & Robinson, 2011; Faber & Visscher, 2014; Lai & McNaughton, 2013).
Defining DBDM
Ikemoto and Marsh (2007) use the following broad definition of DBDM: “teachers, principals, and administrators systematically collecting and analyzing data to guide a range of decisions to help improve the success of students and schools” (p. 108). At the class, school, and board levels, student and school performance data are supposed to be analyzed, and decisions are supposed to be based on these data. Since the aim of DBDM is to systematically maximize student achievement of all students, the focus is explicitly on evaluating and analyzing student performance data. Standardized test results are the starting point, but ideally additional information also is gathered because no single assessment can provide all the information necessary to make informed decisions (Hamilton et al., 2009). Based on standardized test results, teachers come to understand their students’ strengths and weaknesses, and they can use curriculum-based tests, classwork, homework, and classroom observations to help determine students’ instructional needs.
In the DBDM literature, the term decisions implies a variety of actions that can be undertaken on the basis of data, such as: setting goals, adapting instruction, adapting the curriculum, evaluating the effectiveness of programs and practices, improving policy, and reallocating time and resources as necessary (Earl & Katz, 2006; Hamilton et al., 2009; Ikemoto & Marsh, 2007; Mandinach, Gummer, & Muller, 2011). In the schematic overview of DBDM (Figure 1), decisions are decomposed into setting goals based on the data and determining strategies in order to achieve those goals.
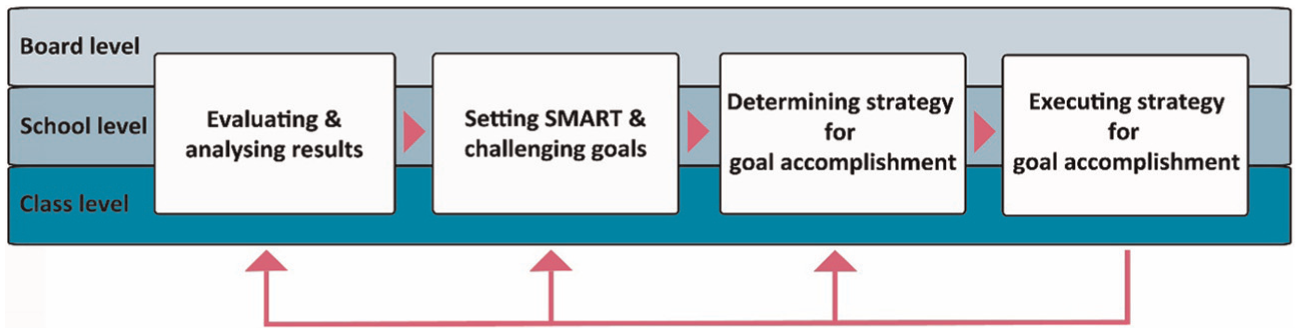
Schematic overview of data-based decision making.
The goals set and the strategies chosen for goal accomplishment vary according to the level of decision making. At the group level, teachers can use student performance data to differentiate instruction (Dunn, Airola, Lo, & Garrison, 2013). Teachers first set goals in terms of desired achievement gains or skill attainment. To accomplish those goals, they can (for example) decide to use a specific instructional strategy or form a separate group of students to work on improving a specific skill. At school and board levels, data are used to highlight specific areas for improvement in the school(s), and the strategies chosen often comprise policy decisions or (for example) the allocation of resources or the modification of the curriculum.
The final step is to implement and execute the chosen strategies. As Bennett (2011); Anderson, Leithwood, and Strauss (2010); and others have argued, the effects of these implementation activities are closely related to the quality of the inferences drawn on the basis of the data, the chosen approach to addressing the identified problems, and the instructional expertise of those working in schools. If, for example, teachers draw incorrect conclusions about students’ learning needs, they are likely to implement a strategy that is unlikely to lead to the desired outcomes.
Since DBDM is intended to be implemented as a systematic approach, data are also supposed to be used for monitoring and evaluating the effects and outcomes of the implemented strategies, evaluating the extent to which goals have been achieved, and making new data-informed decisions.
DBDM—Why Should It Work?
As mentioned earlier, there is little empirical evidence demonstrating the desired effects of data use as a “package” of the four components as shown in Figure 1. However, research has demonstrated the effects of the separate components of DBDM. In this section, the scientific basis for each of those components of data-based decision making is discussed.
The first component in the DBDM model is the use of performance data to analyze and evaluate student results. This can be regarded as using performance feedback: Student monitoring systems provide feedback to schools and teachers; in fact, they reflect how students, teachers, and schools perform in comparison with the national average performance level; whether students’ progress is adequate; and how students perform on subject matter content elements. The positive, performance improving effects of using feedback have been shown in several reviews and meta-analyses (Black & Wiliam, 1998; Fuchs & Fuchs, 1986; Hattie, 2009; Hattie & Timperley, 2007; Kluger & DeNisi, 1996), although recently the evidence has come to be questioned (Kingston & Nash, 2011). Studies investigating the use of performance feedback in an educational setting (e.g., Coe, 2002; Gray, 2002; Oláh, Lawrence, & Riggan, 2010; Vanhoof, Verhaeghe, Van Petegem, & Valcke 2013) identified critical features of effective student performance feedback in schools. Among other things, the degree to which the feedback recipients obtain an idea of how they can improve is very important. Information that one is underperforming without an idea of the cause of underperformance and about how performance may be improved makes demotivation more likely than improving performance. Furthermore, clear graphical representation of data is crucial for improving understanding and using the performance feedback (Verhaeghe, 2011).
The second element of DBDM—setting SMART and challenging goals—also has a proven effect on performance. Locke and Latham (2002), who developed their goal setting theory for various types of tasks, have shown that setting challenging and SMART (Specific, Measurable, Attainable, Relevant, Time-Bound) learning, or performance goals significantly helps in improving performance. Goal setting in combination with the use of feedback improves performance even more (Locke & Latham, 2002). The mechanism that explains such goal setting effects is that difficult but attainable goals in general motivate people. Explicit SMART goals also make people focus their activities more than otherwise (leading to less variation in the definition of goals, reducing activities that do not contribute to goal accomplishment, and increasing time on task) and promote the search for and utilization of task-relevant knowledge leading to improved performance (Morisano & Locke, 2013).
The third and fourth elements of DBDM concern choosing and executing a strategy for goal accomplishment. Although the type of strategy chosen is dependent on the level of decision making (group, school, or board), in general, all strategies are aimed at improving instruction and consequently at improving student achievement. It is generally accepted that what teachers do in the classroom is the most important malleable factor influencing student performance. Although the impact of student characteristics is considered to be greater, such factors can only be influenced to a limited degree, and instruction is in any case essential for such influence (Hanushek, 2011; Hattie, 2009; Nye, Konstantopoulos, & Hedges, 2004). Therefore, it makes sense to search for ways to improve the quality of teacher behavior since ultimately it is the quality and execution of the chosen instructional strategies that are decisive for increasing student achievement.
Since DBDM includes several elements of which the effects were described in the previous paragraphs, the question remains whether the effect of the whole DBDM “package” is greater than the sum of its parts. In the following section, the available scientific evidence for DBDM as a whole will be discussed.
Research on Data Use
In their introduction to their data use special issue, Turner and Coburn (2012) state that all interventions to promote data use are “rooted in the conviction that if the right data are collected and analyzed, they will provide answers to key educational questions and inform actors’ decisions, and better educational outcomes will follow” (p. 2). However, as described earlier, few causal studies on the effects of data use are available, and the existing literature does not always provide us with the answer to the question when and under what conditions data use interventions lead to the ultimate outcomes: improved student achievement.
However, four aspects of the available studies on data use are important in this context (Coburn & Turner, 2012; Hamilton et al., 2009). First, studies are often descriptive: The nature and background of interventions are described, but the implementation or effects are not analyzed. For example, Wayman and Cho (2008) advocate that teachers should be prepared to use data systems and also which approach could be suitable and what preconditions should be met but do not go beyond making recommendations. In other studies, only practical aspects regarding the implementation of DBDM are described. Supovitz (2012), for example, investigated how tests can be designed that can maximize feedback to teachers, and Wayman, Stringfield, and Yakimowski (2004) and Vanhoof et al. (2013) focused on technical and graphical aspects of performance representations in school performance feedback systems.
Second, the outcomes or the process of data use interventions are examined, but there is no published research that had looked into both of these effects together. Based on Desimone (2009), one may argue that the introduction of DBDM will lead to increased teacher quality, which will lead to improved teaching, and that this will finally lead to better student results. Information on the changes and effects on all subsequent stages in this process is necessary in order to be able to design effective interventions that lead to desired outcomes via effective processes.
Third, the focus of studies is often on aspects of the organizational context, such as leadership, school characteristics, policy environment, and political context, although little is known about the interactions between all those contextual factors.
Fourth and finally, in many studies, causal claims are made without a research design that justifies such claims; data use was often not examined in real school contexts, and scholars relied mainly on self-reports and retrospective forms of data collection (Turner & Coburn, 2012).
Based on insights from the literature on data use, professional development, and comprehensive school reform, a DBDM intervention was designed. After a pilot study and the first project run in 43 schools in the Netherlands (Staman, Visscher, & Luyten, 2013, 2014), the intervention was optimized on the basis of experiences and new insights and was implemented as the Focus intervention in 53 schools during the school years 2011–2012 and 2012–2013.
The Intervention
The Focus intervention is a two-year training course for entire primary school teams (all teachers as well as the members of the management team such as the school leader and deputy director) aimed at acquiring the knowledge and skills related to DBDM and implementing and sustaining DBDM in the school organization on the basis of the training activities as depicted in Figure 2. The training course and accompanying protocols and documents were developed by the University of Twente, but participating schools were stimulated to adapt these in order to fit their specific context. School leaders were supported in fulfilling the conditions in terms of school leadership, school culture, and professional networks and collaboration.

Overview of the intervention.
First, practical preconditions needed to be fulfilled in order to make DBDM possible. Therefore, the availability of assessment tools (standardized tests) and technological tools (a student monitoring system) was a requirement for participation in the training. Furthermore, prior to the first meeting, a meeting with the school leader and school board was organized to stress the importance of their role in encouraging, motivating, and supporting their team members. This meeting was also organized to assure that they would allocate sufficient time to their team members to work on DBDM activities such as analyzing data and planning and evaluating instruction and that other practical preconditions (e.g., the availability of a SMS) were also fulfilled.
During the first year of the training, the subsequent steps of DBDM (Figure 1) were introduced one by one. The first four meetings were primarily dedicated to working on the knowledge and skills related to DBDM: using the student monitoring system, analyzing and interpreting test score data, diagnosing learning needs, setting goals, and developing instructional plans. Next to the knowledge and skills at the user level, beliefs, attitudes, and motivation also play a role when introducing and implementing DBDM. Also at the level of the organization these factors are important for success: a vision on what is considered important, performance norms, goals to be accomplished, a culture of collaboration, and a culture of trust. There were no meetings that were especially dedicated to overcoming resistance and creating motivation, but attention was paid to explaining and stressing the (expected and experienced) benefits of DBDM according to the scientific literature and based on the experience of participants in the pilot study and the first tranche of the intervention training course.
During Meeting 5 in the first year of the intervention, the cycle of DBDM was fully completed for the first time when student achievement results were discussed in a team meeting. It was stressed by the trainers, school leaders, and participants that data were supposed to be used for improvement and not for judging colleagues. This was supposed to contribute to a culture of trust and collaboration in which the school team as a whole felt the responsibility for their students’ performance. Meeting 6 focused on collaboration among team members by observing each other’s lessons, either to learn from the colleague they visited or provide him or her with feedback on specific topics.
As of Meeting 7 in the first intervention year, the meetings were aimed at internalizing, sustaining, and broadening the scope of DBDM in the school and supporting participants with carrying out their decisions in practice, for example, by coaching sessions (Meeting 2 and sometimes also in Meeting 4 in the second intervention year) in which the trainers were observing teachers in their classrooms and providing them with feedback. During team meetings, attention was paid to issues that were raised by the school and based on their requests for help.
Next to the team meetings, the trainers met with school leaders and school boards twice a year (indicated with S in Figure 2) to discuss their role in the innovation process, the school’s progress, and the goals to be set for the upcoming period. During these meetings, the importance of encouragement and support from school leaders and school boards were stressed.
All schools started with DBDM for mathematics. After the first intervention year, participating schools either chose to continue with DBDM for mathematics or to broaden the scope of DBDM to spelling. Halfway the second intervention year, schools that chose to continue with DBDM for mathematics could again choose to continue with mathematics or to broaden to spelling.
The training was provided by trainers who had been appointed by the University of Twente specifically for this project, and the project was supervised by the first author, who was not directly involved in working with the schools. To ascertain that the training was as much as possible the same across schools and trainers, the planning for all schools corresponded to the timeline as depicted in Figure 2, and each meeting had a central topic, which was the same for every participating school (see Figure 3). The content of the meetings was fixed for all schools, the same Power Point slides were used, and the same exercises were done in all schools. Before every meeting, the trainers discussed the content for that specific meeting intensively with each other and the project supervisor to assure that each of them would present the information in the same way. Because of variation in school teams’ prior knowledge, team members’ needs, and the subject chosen by a school, the time a trainer spent on a specific topic within a meeting varied somewhat over schools.

Overview of the content of the intervention, per meeting.
The Link With the Literature on Professional Development
The training activities were based on the literature on professional development. In the following paragraphs, those aspects are described.
Time
It takes time to learn and change. Desimone (2002) states “it can take anywhere from 5 to 10 years for a school to completely reform.”Duration therefore is a structural feature of professional development in two ways: the number of contact hours and the time span over which the professional development activity is spread (Birman, Desimone, Porter, & Garet, 2000; Desimone, 2009; Garet, Porter, Desimone, Birman, & Yoon, 2001). According to Timperley (2008), it takes typically one to two years for teachers to fully understand the promoted beliefs and practices and to change practice. Due to many other obligations teachers face in their work, they should be provided with enough time to master the learning goals (Timperley, 2008; Van Veen, Zwart, & Meirink, 2011). The time span of the intervention is two subsequent school years, a total of 22 months. Fourteen contact moments (each of approximately 4 hours) were planned, and in addition to these meetings, participants were expected to apply what they had learned in practice, for example, by carrying out analyses, developing instructional plans, and finally, adapting their instruction. Teachers gradually practiced and implemented what they had learned, which is also an important aspect of effective professional development activities (Timperley, 2008; Van Veen et al., 2011).
The entire school team has to participate
Collective participation (e.g., as a school team) is positively correlated with active participation in professional development activities. Garet et al. (2001), Lumpe (2007), Van Veen et al. (2011), as well as Timperley (2008) argue that interaction with and collaboration between colleagues is important when implementing and mastering an innovation. In the Focus intervention, entire school teams participated in the intervention.
The use of protocols and documents
The implementation of comprehensive school reform is easier and faster in case of externally developed reform designs, often because they provide specific and detailed guidelines for implementation (Desimone, 2002). When external experts involve teachers in discussing and developing understanding and support teachers as they develop the understanding, the used tools (protocols and documents) are more effective (Timperley, 2008). In the Focus intervention, schools are therefore provided with protocols, documents, and planning aids to help them incorporate DBDM in their organization and practice. During training sessions, these protocols and documents are discussed and adapted to the local school context because staff seems to support reform better when they are actively engaged in co-constructing the changes in their schools in such a way that the changes fit their local context (Datnow, Hubbard, & Mehan, 1998). Datnow and Castellano (2000) describe the adaptations teachers made to the Success for All program, especially when they felt that their students’ needs were not met by the prescribed program. Although these adaptations could affect program fidelity, some flexibility was needed to ensure continuing teacher support.
A Hypothetical Model of DBDM and Student Achievement
In Figure 4, the general model for this study is presented. It builds on previous studies on data-based decision making that find the use of data can improve student achievement (Campbell & Levin, 2008; Carlson et al., 2011; Lai & McNaughton, 2013). In this multilevel model, it is hypothesized that implementing DBDM will lead to (unmeasured) changes in a teacher’s classroom practices, which in turn will lead to student achievement growth in mathematics (Hypothesis 1), and furthermore that intervention effects differ between schools (Hypothesis 2). In particular, it is investigated to what extent the intervention effect will differ across schools and what the common effect is over schools. Furthermore, observed student and school characteristics are used to explain realized differences in intervention effects.
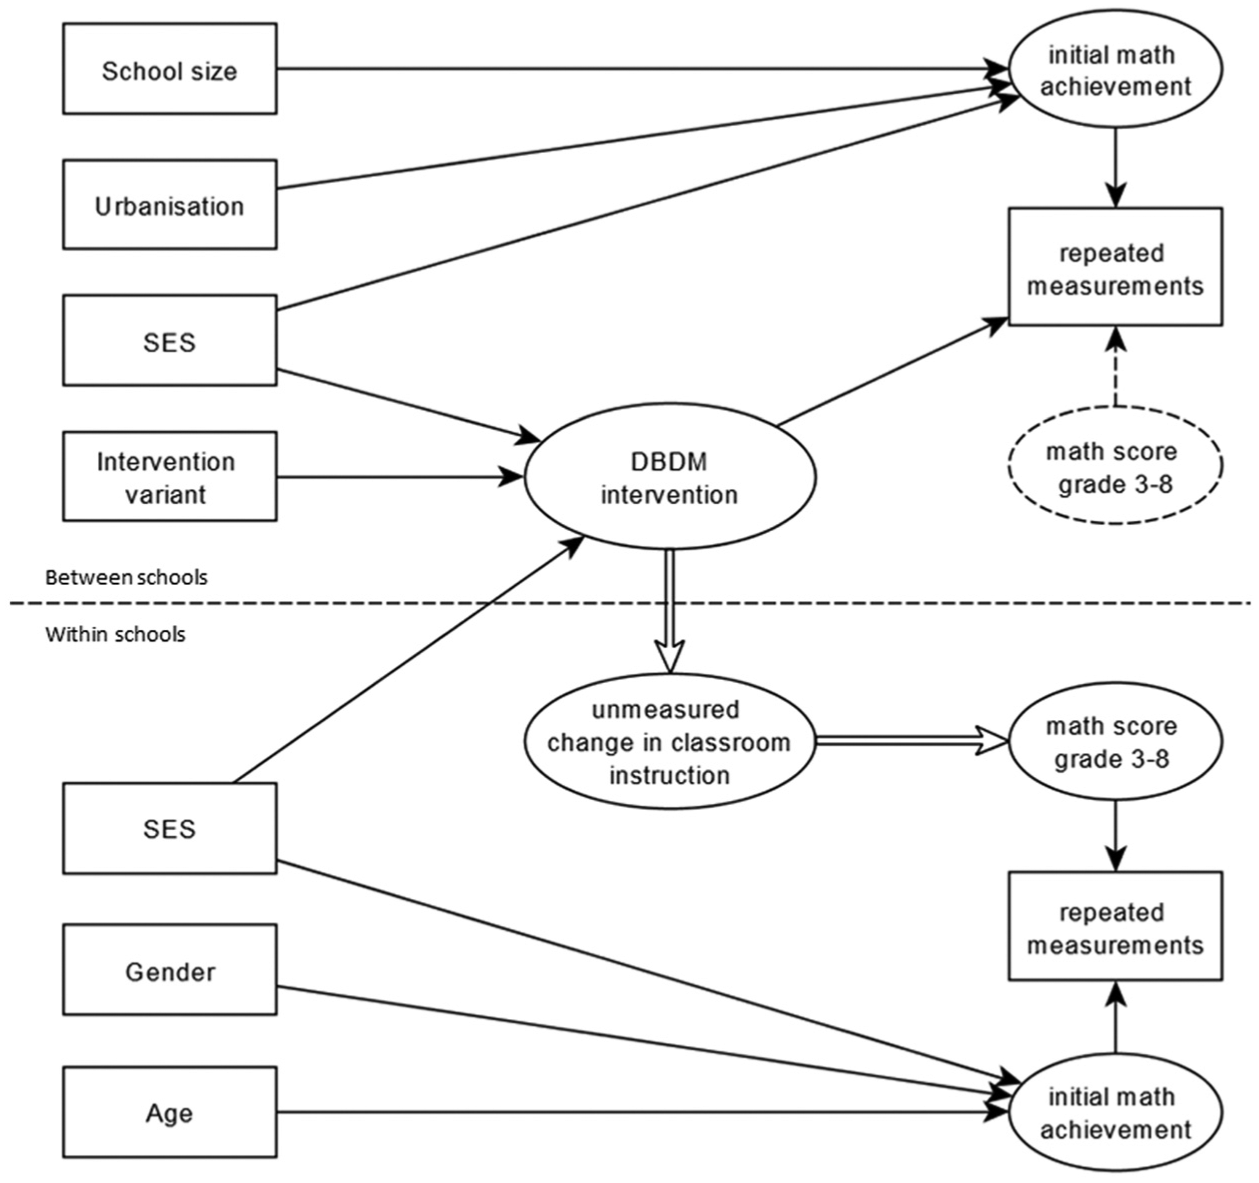
Conceptual model of the relationship between data-based decision making and student achievement growth.
At the school level, the effect of the implementation of DBDM was expected to vary as a result of average student socioeconomic status (SES). Schools with a higher percentage of students with a lower socioeconomic background on average score less well than schools with a high-SES student population (Carlson et al., 2011; Inspectie van het Onderwijs, 2012). Since teachers are more likely to underestimate the potential of students from a low-SES background, an interaction between intervention and average school student SES is expected (Hypothesis 3) because the intervention is aimed at ambitious goal setting by teachers and improving the educational achievement of all students.
At the student level, achievement might differ based on students’ gender, SES, initial achievement, and the grade they are in at the moment of testing; therefore, achievement will be controlled for these background characteristics. At the student level, comparable with Hypothesis 3, at the school level an interaction effect is expected for SES and the intervention: The intervention effect is expected to be higher for low-SES students (Hypothesis 4).
Furthermore, as mentioned earlier, at the end of the first intervention year, schools choose between continuing with DBDM for mathematics or broadening the scope of DBDM to the subject spelling. Halfway through the second intervention year, schools that chose to continue with mathematics again could choose whether they wanted to continue with mathematics or broaden to spelling. This leads to three possible trajectories: mathematics-mathematics-mathematics (M-M-M), mathematics-mathematics-spelling (M-M-S), and mathematics-spelling-spelling (M-S-S). We would like to stress that schools that chose to broaden the scope of DBDM to spelling were also still implementing DBDM for mathematics. We hypothesize that choosing to broaden the scope of DBDM to spelling is related to successful implementation of DBDM for math since schools where DBDM for math was not implemented sufficiently would probably not have felt ready to broaden the scope of DBDM within their schools. Therefore, the intervention effect on mathematics achievement will probably be greatest for schools following the mathematics-spelling-spelling variant, smaller for the mathematics-mathematics-spelling trajectory, and smallest for schools that decided they needed the full two intervention years to implement DBDM for mathematics (Hypotheses 5a and 5b).
Furthermore, at the school level, initial achievement was controlled for school characteristics such as school size (Gershenson & Langbein, 2015), average student SES (Carlson et al., 2011), and the level of urbanization.
Following the conceptual model, as given in Figure 4, a multilevel growth model can be specified for the repeated measurements, which are nested in grades, students, and schools. Let
It is assumed that a student’s scores in each grade year are independently normally distributed given the population-average occasion-specific score and the grade-year average student’s performance, representing the student’s deviation from the population average in grade g. Then, the Level 1 part of the multilevel model for the grade-g measurements can be represented as

where
The student-level modeling part is a function of the school-average performance (i.e., deviation from the population average) and a random error term. The school-average performance consists of a random component and an additional random intervention effect, which represents the school-average change in performance due to the intervention. The random effect of this intervention is assumed to be a school-specific effect but homogenous over grades and over the intervention period. Let the intervention variable, denoted as

where
Finally, the school-level part of the model is represented by

where
The explanatory variables, as represented in Figure 4, can be incorporated in the multilevel model for repeated measurements to explain variation in the random student, school, and intervention effects. Furthermore, when relevant background variables are not included, which relate to student achievement and/or the intervention, the measured intervention effect can be biased due to confounding.
Each school is repeatedly measured over time before the intervention period (the control phase) and during the intervention period (the treatment phase). The purpose is to measure the change in scores (i.e., performance of each school) and assess the impact of the intervention for each school. Jenson, Clark, Kircher, and Kristjansson (2007) and Van den Noortgate and Onghena (2003) advocated the use of hierarchical linear models to improve the statistical inferences. The present design research extends the hierarchical linear model modeling approach of single-subject design studies by extending the Level 1 model for the repeated measurements of a single-subject study. Through the joint modeling of multiple single-subject designs, each single-subject study of a school concerns multivariate repeated measurements of students (representing the school), who are followed over time.
The proposed multilevel modeling approach overcomes the common problems to make accurate statistical inferences from a single-subject design study. The typical serial correlation between single-subject observations are modeled with random student effects such that the correlation will not bias the residual errors, parameter estimates, and standard errors. In contrast to the typical small sample sizes, which are used in single-subject studies, much more reliable and accurate school-specific intervention effects can be obtained by pooling the information from all schools and combining the results from multiple single-subject design studies (e.g., Gage & Lewis, 2014). The results can also be more easily generalized through the proposed multilevel modeling approach.
Methodology
The data used in this study were collected before, during, and after the implementation of DBDM by means of the intervention in 53 Dutch primary schools. In this section, first the participants, measures, and data collection are described, after which the section ends with a description of how the data were analyzed.
Participants
In November 2010, over 500 primary schools in the northern and central parts of The Netherlands were invited to attend a project briefing in their region in order to determine whether they would like to participate in the project. In total, 11 project briefings were organized, which led to 55 participating schools. Two schools chose not to continue with the intervention after completing the first year; their school leaders argued that their teams already implemented the DBDM way of working for other subject areas and therefore did not see added value in participating for another year.
In total, 53 schools (1,190 team members) fully participated in the study. Their characteristics are presented in Table 1. School teams included on average 22 team members, with a range from 5 to 67. School size was on average 245 students (range = 55–806) and was categorized into small, medium, and large. School SES (categorized in high, medium, and low) was based on the percentage of students who had been assigned extra weight based on parental educational level indicating low SES. 1 Approximately half of the schools (23) were suburban schools, 11 were situated in big cities (urban), and 19 were located in rural areas.
Sample Characteristics of Schools (N = 53)
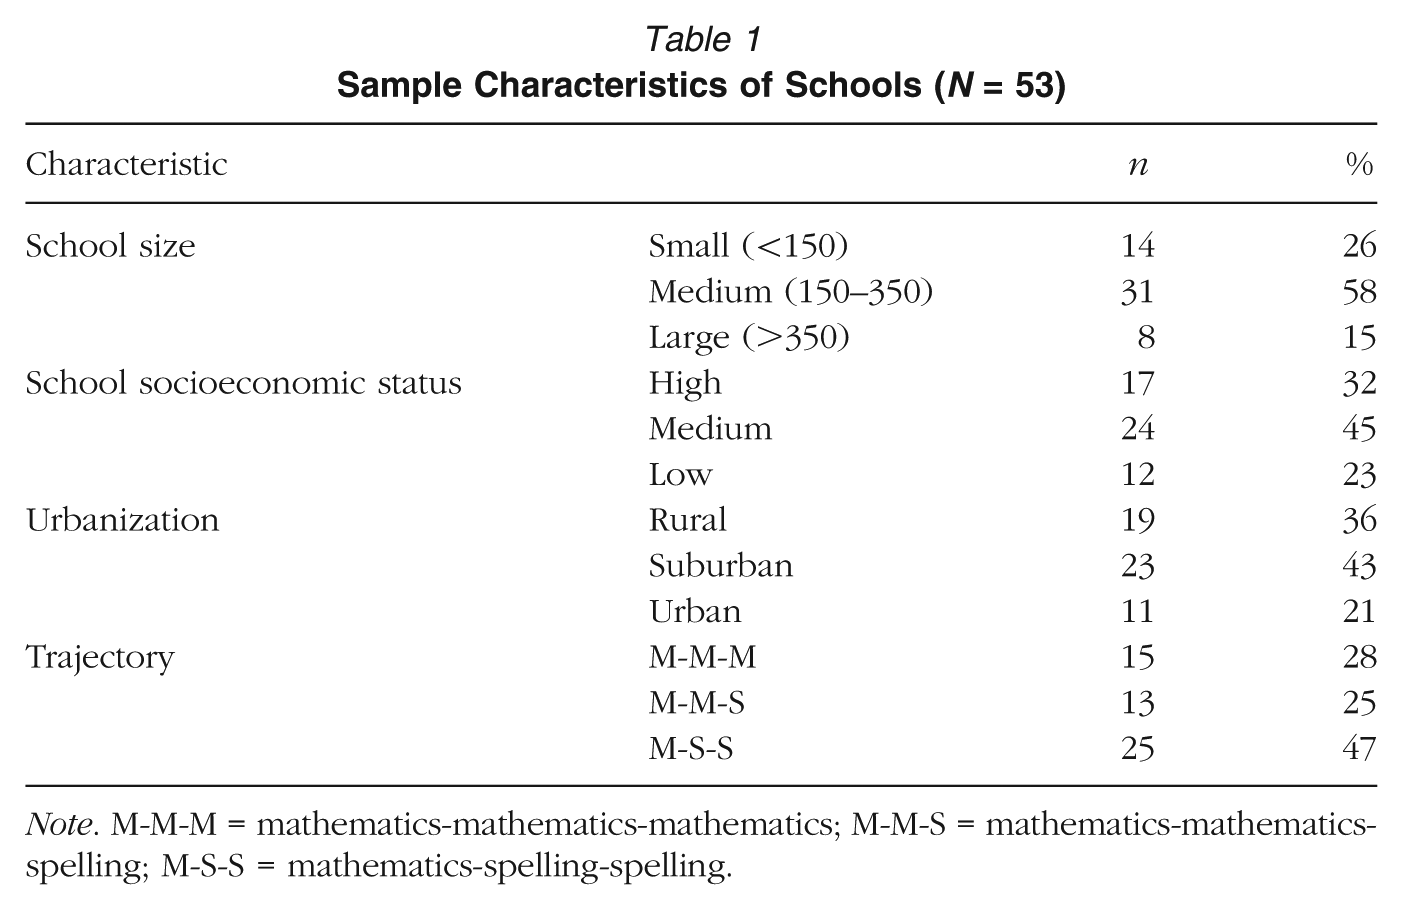
Note. M-M-M = mathematics-mathematics-mathematics; M-M-S = mathematics-mathematics-spelling; M-S-S = mathematics-spelling-spelling.
With regard to the intervention trajectory variants: 15 schools chose to work on DBDM for mathematics in both intervention years (version M-M-M), 25 schools chose to work on DBDM for spelling in the second intervention year (version M-S-S), and 13 schools chose to broaden the scope of DBDM to spelling in the final months of the second year (M-M-S).
Measures and Data Collection
The intervention took place from August 2011 until July 2013. In order to compare achievement growth during the intervention with mathematics achievement growth before implementing DBDM, student achievement data were collected from August 2009 until July 2013. The data were retrieved from the student monitoring systems of the schools participating in the intervention.
The student achievement on standardized math tests were scored on an ongoing ability scale per subject, from Grades 3 to 8 (students aged 6 to 12 years old, all primary school grades). Students take these tests twice a school year (mid and end of school year) with an exception for Grade 8, where the test at the end of the school year is scaled differently. The test at the mid-occasion, however, can also be taken at the beginning of the school year, but students can only take this test once. This means that there are 11 standardized assessments per student per subject over the course of their primary school career. Over the two years before the intervention and the two intervention years, most students took 8 tests, leading to 8 ability scores per subject, which makes it possible to follow student cohorts and to compare achievement of grades across years. An overview of test occasions is depicted in Figure 5. With approximately 1,500 observations per grade per test moment per school year, the total of observed achievement scores was 66,486.
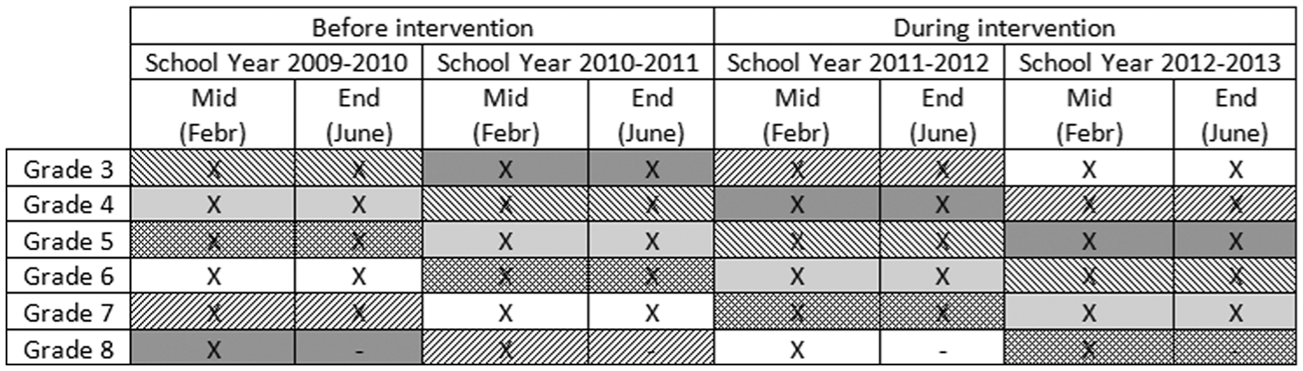
Overview of measurement occasions.
Next to students’ mathematics ability scores, the following data were collected at the student level: gender, student weight category indicating SES, and date of birth. Age was centered based on the expected age in months at the time of the test, based on the average age for students who do not accelerate or repeat grades, and thus indicating how many months younger or older a student was than expected.
At the school level, data were collected on school size, degree of urbanization, average SES, and intervention trajectory variant. Sample characteristics are depicted in Table 1.
Data Analysis
Given the multilevel structure of the data, with measurements nested within students and students nested within schools, the lme4 package (Bates, Mächler, Bolker, & Walker, 2014) in R (RCoreTeam, 2013) was used to perform linear mixed effects analyses to investigate and assess effects of the intervention on student achievement.
For each student, an incomplete set of measurements was observed. In the four years of the study, a maximum of 8 measurements was observed of the total 11 measurements (from Grades 3 to 8, see also Figure 5). The complete set of measurements would consist of 11 measurements, with 3 measurements per grade year for the Grade Years 3 to 7 and 1 for Grade Year 8. Therefore, it was only possible to observe part of the performance data of each child in each selected primary school. In a full latent growth analysis, a latent trajectory of performance growth in primary education is estimated using a random effect for each grade. Due to the incomplete test design, for each child, observations of at least three test occasions were missing, which seriously complicated the estimation of all random effects. In fact, we needed to estimate 95,788 random effects using 66,396 observations, which was simply not feasible. So, it was not possible to estimate a random performance effect for each student in each grade and model the change in performance from Grade 3 to Grade 8 for each student.
Therefore, the number of individual random effects, referred to as
The differences in population-average achievements over measurement occasions were modeled as fixed effects such that the general mean represents the average performance of students over schools at measurement occasion midyear Grade 3. Student and school achievements were allowed to vary across the general mean, which was accomplished by the individual-specific and school-specific random effects. At the level of schools, a random effect was introduced to model the average differences in achievements between schools over grades.
The three individual random effects were used to model each student’s (average) deviation from the population average scores in mid-Grade 3, Grade Years 3 to 5, and Grade Years 6 to 8. This led to three separate latent measurements over time, representing growth in student performance given the population average scores. The individual random effects capture the heterogeneity in average achievements in the lower and upper grades over students given differences in population average achievement over students and schools between test occasions.
A second school random effect was introduced to model the difference in average performance of schools before the intervention and during the intervention. By modeling the differential effect of this intervention effect, school-specific intervention effects were estimated, and schools benefiting from the intervention were identified. This mixed effects model for the individual scores is given by
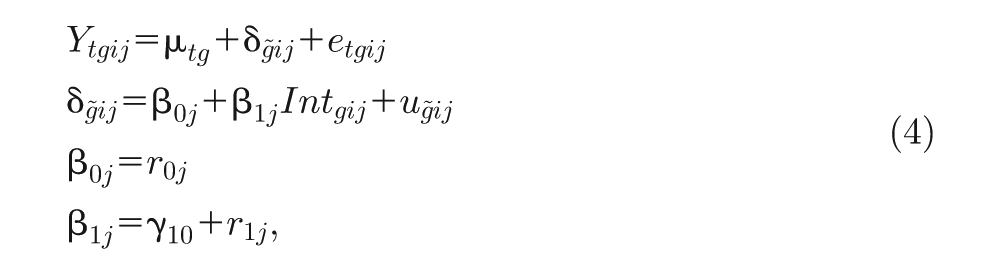
which corresponds to the model in Equations 1 to 3, except for the reduction in Level 1 random effects.
The presented multilevel growth model has the advantage that students with a few or just one test score can be included in the analysis. Furthermore, changes in student scores are not explicitly modeled using a functional form (e.g., linear, quadratic) as in latent growth curve modeling, where time is a continuous variable. This modeling strategy avoids the complex functional modeling of many student growth trajectories. Time is included as a discrete variable, where the time-specific student and school measurements model changes in performances over time. May, Huff, and Goldring (2012) and Grissom, Loeb, and Master (2013) used this modeling strategy to link principals’ instructional leadership to student performances using large-scale longitudinal data on schools, principals, and students.
To test the specific hypotheses and explore the effects of the intervention, several multilevel models were fitted. In the null models (Models 0a and 0b), student and school achievements were modeled through random effects while accounting for differences in average achievements over assessments. Subsequently, heterogeneity in intervention effects among schools were estimated, given the growth specification of student achievements. In the subsequent models, the average intervention effect (Model 1), student background characteristics (Model 2), school characteristics (Model 3), intervention trajectory (Model 4), and interaction effects (Model 5) were added. Nonsignificant effects were not included in the next model. A detailed explanation of the models is provided in the appendix in the online journal.
Results
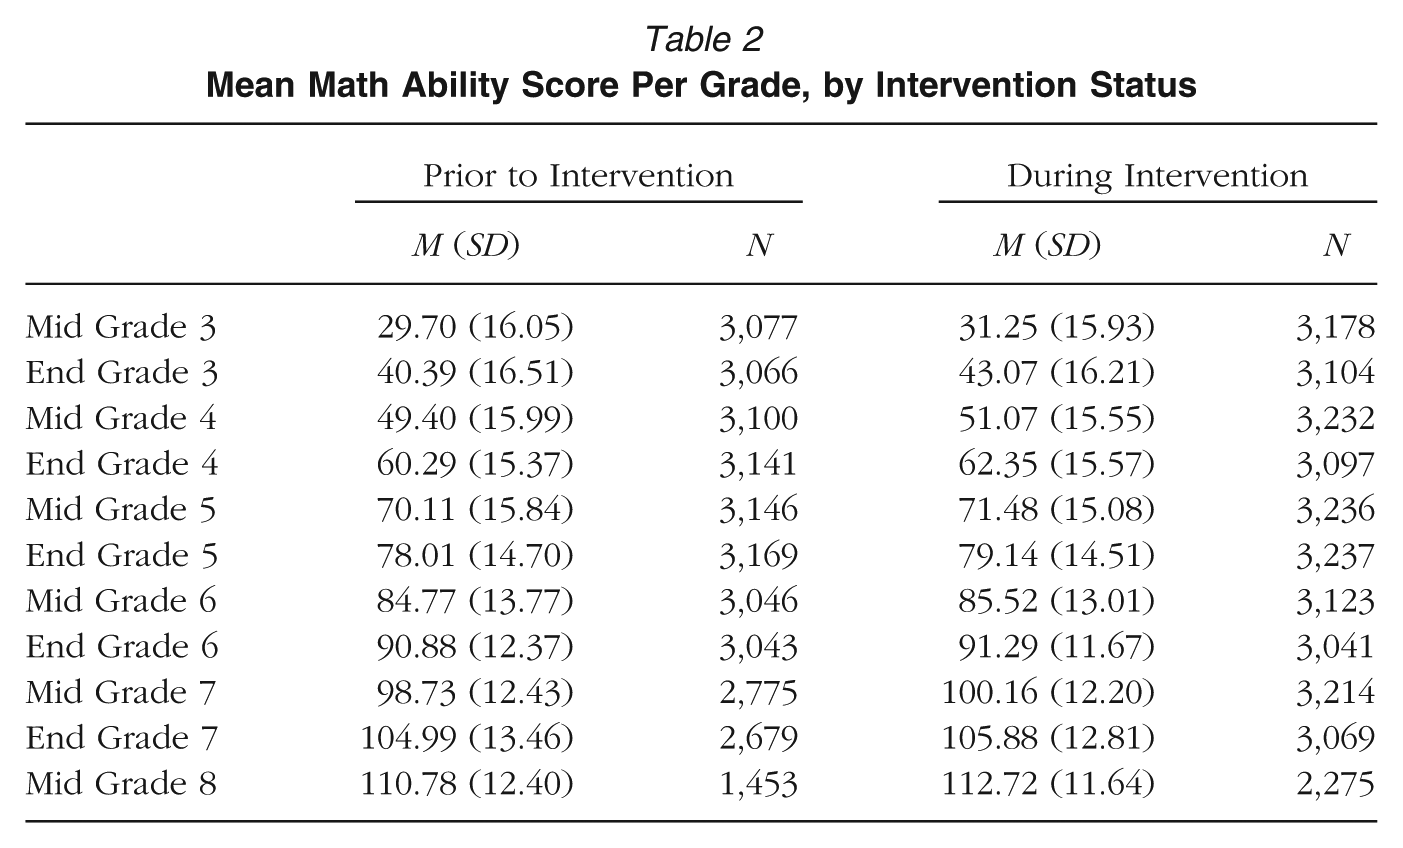
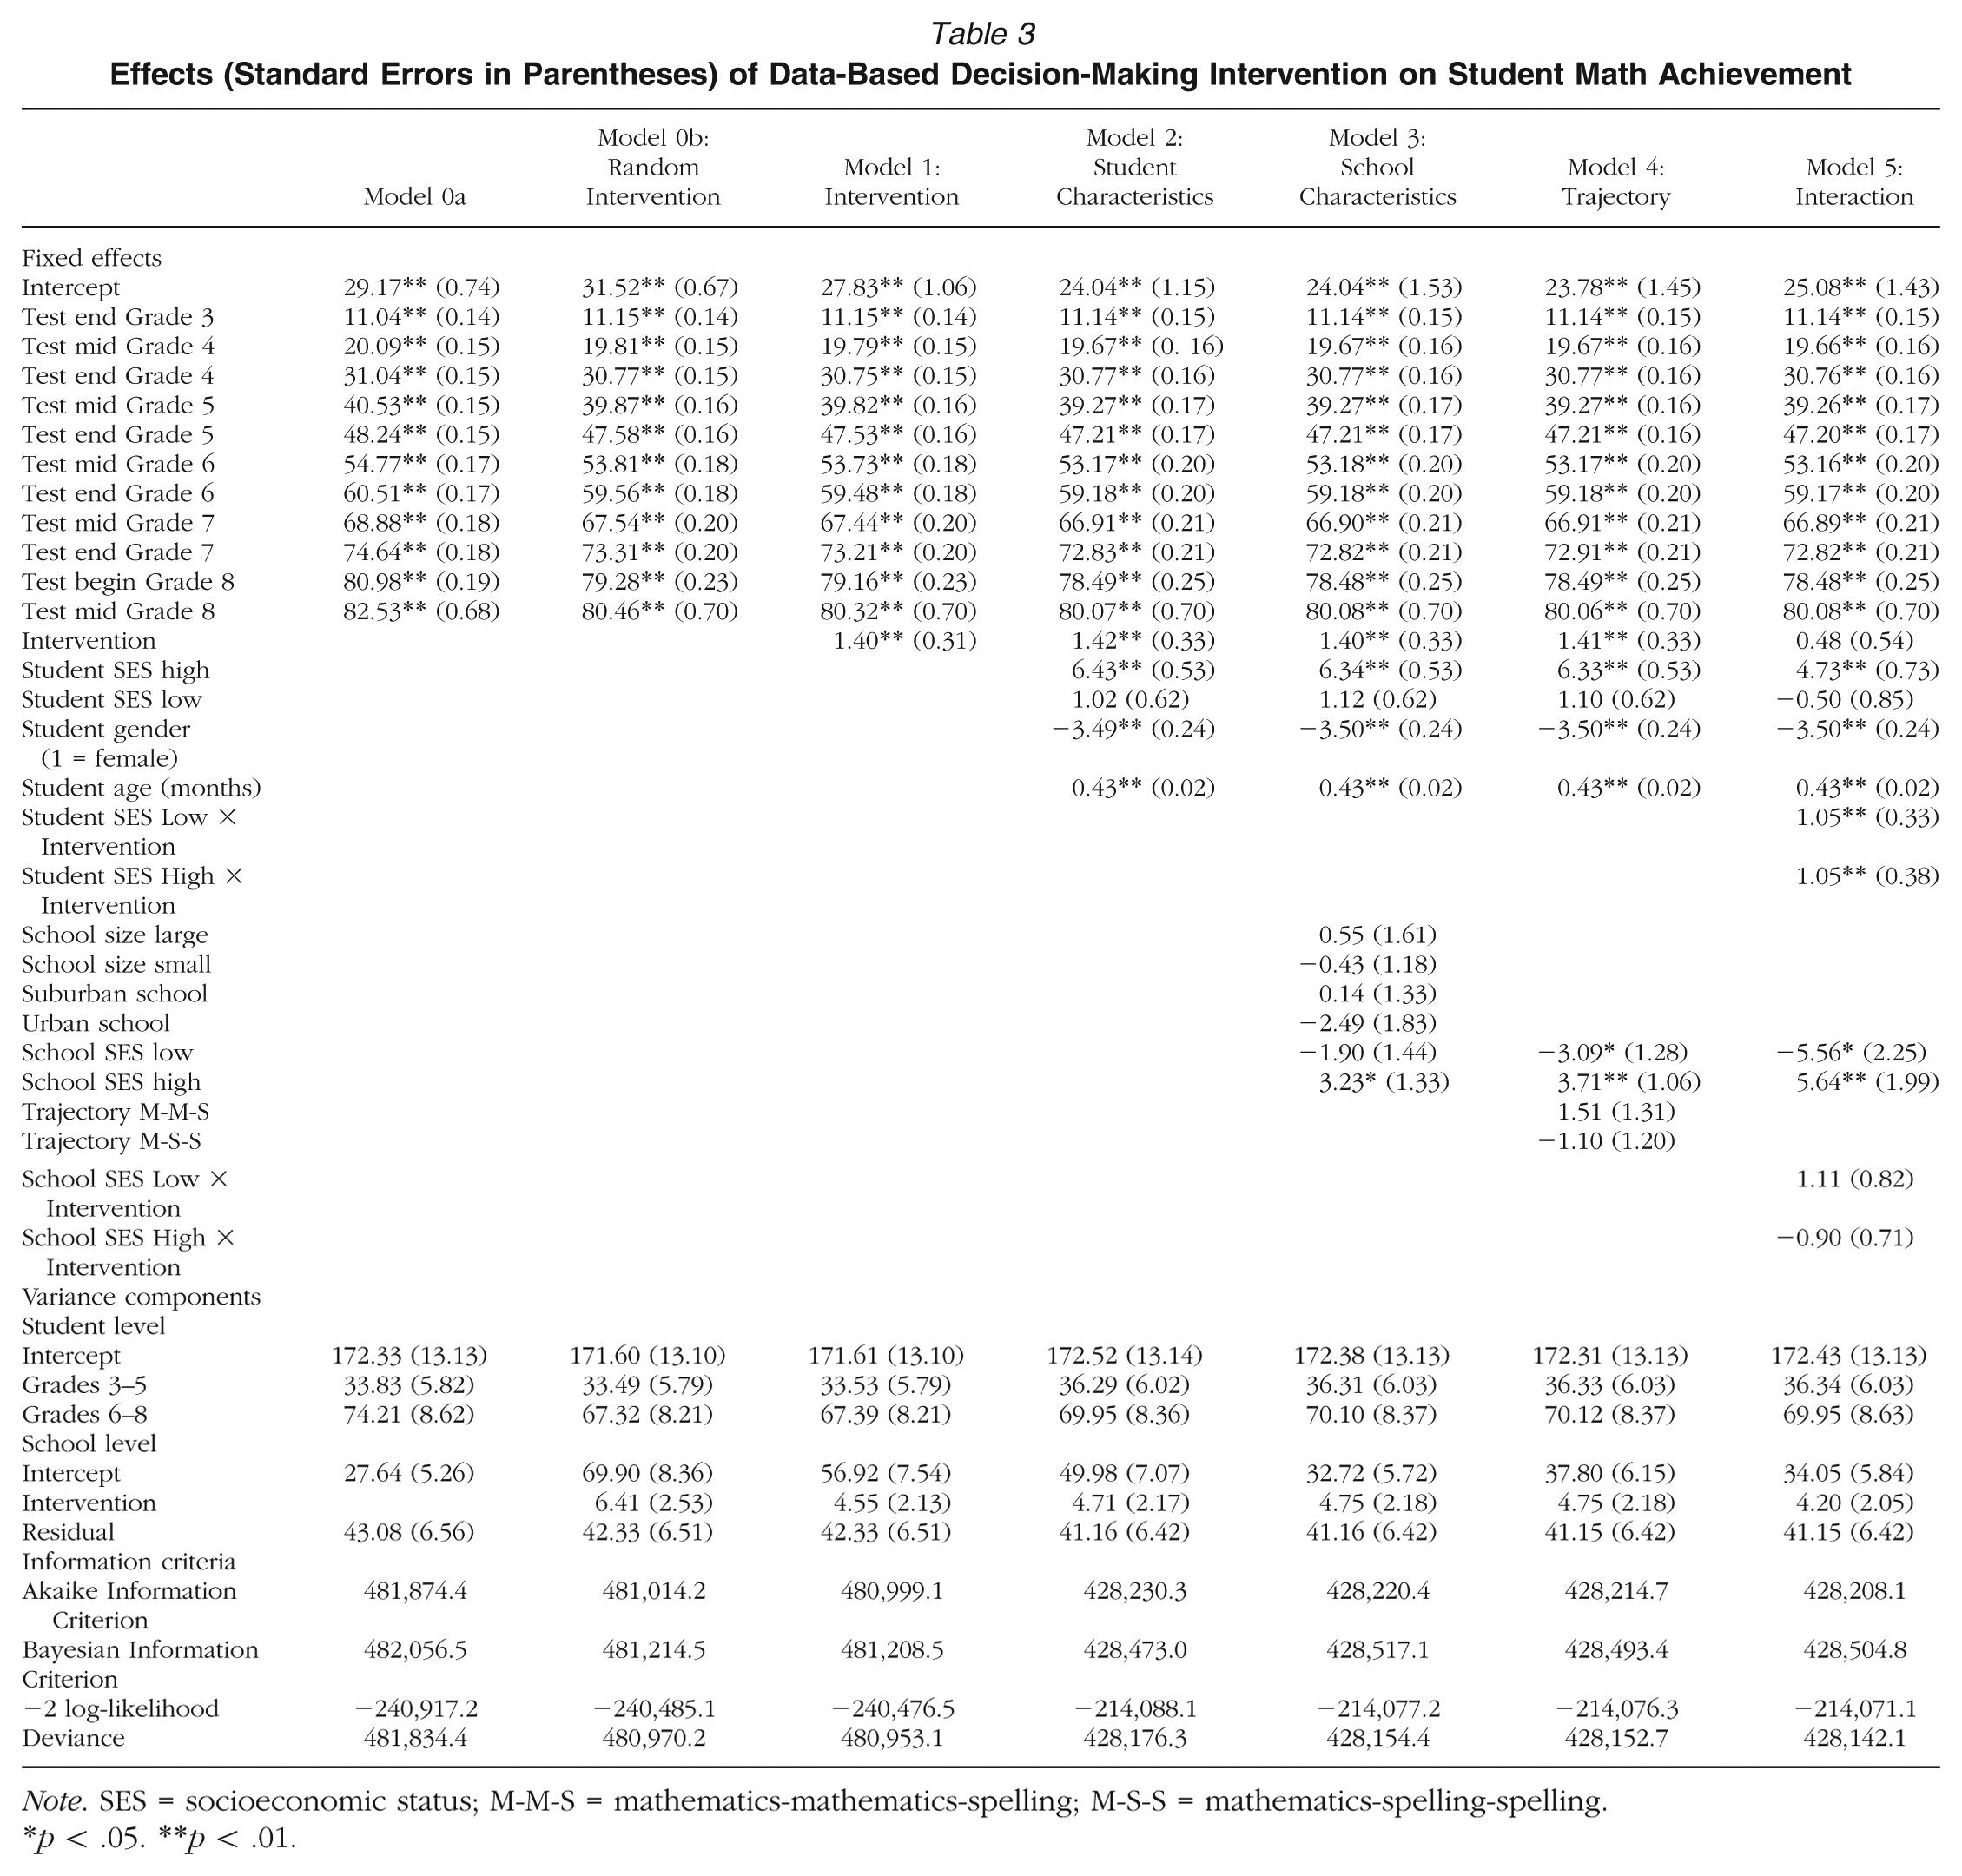
Basic descriptives of ability scores per grade and by intervention status are presented in Table 2. The results of the analyses of the relationship between student math achievement and the implementation of a DBDM intervention are presented in Table 3. Based on decrease in information criteria values (i.e., Akaike Information Criterion [AIC], Bayesian Information Criterion [BIC], deviance), each subsequent model was a significant (p < .001) improvement compared to the previous one, except for Model 4 as compared to Model 3.
Mean Math Ability Score Per Grade, by Intervention Status
Effects (Standard Errors in Parentheses) of Data-Based Decision-Making Intervention on Student Math Achievement
Note. SES = socioeconomic status; M-M-S = mathematics-mathematics-spelling; M-S-S = mathematics-spelling-spelling.
p < .05. **p < .01.
Student math achievement was measured using standardized tests with a national benchmark. Based on the benchmark data, the estimated average difference between student scores at two subsequent test moments is approximately 7.7 (Cito, 2009). From Tables 2 and 3, it follows that differences in average scores of the same magnitude were found between subsequent assessments. Since there are approximately five school months between two test occasions, an effect of 1.54 (average of 7.7 ability points, divided by 5 months of schooling) on average can be interpreted as the expected increase in performance due to one additional month of schooling. This expected effect of an additional month of schooling will differ slightly between lower and higher grades since the estimated differences in ability scores between two test occasions are larger in the lower grades (Cito, 2009).
Baseline Model
The achievement scores are measured on one common ability scale, and students are expected to grow in ability between every two assessments. This average growth in achievements over test occasions is represented by the growth in average scores over students from Grade 3 to Grade 8. The random intercepts show a significant variability in achievements over students at the first assessment. There is less variability between students in average achievements in Grades 3 to 5 and Grades 6 to 8 when comparing them to the variability in achievements at the first assessment. It follows that the variability in achievements over students diminishes when students receive education over a longer time period. This corresponds to the fact that student achievements from the same school are more alike than those from different schools.
Intervention Effects
In Model 0b, the random intervention effect at the school level was introduced, leading to a significant decrease in deviance (Δχ2 = 864.16, 2 df, p < .001). It can be concluded that the intervention effect varied significantly across schools. These findings support Hypothesis 2 (the intervention effect will differ between schools).
By modeling achievement differences between schools through a random intervention effect, the variance of the student random effects only slightly decreased. In Model 0b and Model 1, the random intercept at the student level represents differences in mid Grade 3 student achievements while accounting for differences between school-average performances prior to the intervention and during the intervention. Accounting for differences in school performances during and prior to the intervention did not influence the variability in student performances.
However, in comparison to Model 0a, the school-level random intercept variance increased in Model 0b. This occurred due to the fact that the random intercept variance represents the variability in average mid Grade 3 achievements across schools prior to the intervention and not over all measurement occasions. In Model 0a, this random intercept variance represents the school-average achievements over time, where in Model 0b a distinction is made between the school-average achievements prior and during the intervention.
From Model 1 it can be concluded that the general average intervention effect differed significantly from zero and equals 1.40. The random intervention effect is assumed to be normally distributed in the population of schools. Given the estimated random effect variance of 4.55, the 95% confidence interval of intervention effects in the population ranges from −2.78 to 5.58 (
The estimated intervention effects are possibly biased due to missing confounding (background) variables. Therefore, it is important to include student and school background variables, which are known to be related to student achievement and possibly also to the intervention. These background characteristics were added in Model 2 and Model 3. In the following, the estimated intervention effects will be explored, and more profound explanations are given to explain variability in intervention effects.
Exploring Student Effects
Four schools did not provide data on student date of birth, and therefore information on student age related to the average age in their grade was missing for these schools. These schools were excluded from the further analyses, leading to a total of 49 schools for this model.
Student background characteristics were added in Model 2. As is known from previous research such as TIMSS (Mullis, Martin, Foy, & Arora, 2012), girls on average score lower than boys for mathematics. In this study, the fixed effect for gender was −3.49 points on the ability scale, which can be interpreted as a lag of 2.3 educational months.
Another important factor in explaining variability in student achievement is student SES. The Dutch student SES weights are based on parental education, and previous studies, for example, TIMSS (Mullis et al., 2012), show that there are strong positive relations between the level of parents’ education and their children’s educational attainment. These findings are partially confirmed in the present study: High SES students on average score 6.43 points higher than medium SES students (Table 3). It is remarkable that low SES students on average also score higher than medium SES students, although this effect is not significant.
Student age, centered around the expected age (in months) at each measurement occasion, represented the difference between the actual age and the average student age. The significant effect of age indicates that students above expected age score 0.43 points higher on the ability scale per month. Note that age is a time-varying variable and its effect represents average latent growth in student achievement. This effect cannot be interpreted as an argument for repeating grades. Students who repeat grades are older and therefore according to this model will score higher than their non-repeated classmates; however, test performances of students who repeat grades can be lower than the performance of students of the same age not repeating the grade.
When considering the random effects at the student and the school level, the student predictors explained variability at both levels. The differences in average student math achievement at the lower and higher grades were reduced significantly. Note that including student characteristics did not lead to a change in the estimated average intervention effect, indicating a constant, positive main effect for intervention on student achievement. That is, differences in the achievements of students in the study prior to intervention and during intervention were not attributable to differences in observed student background variables.
School Characteristics
In Model 3, the school-level characteristics school size, urbanization, and SES were added (all were categorical variables). No significant effects were found for school size or level of urbanization. The effect of school SES, however, is significant. Recall that school SES is categorized into high, medium, and low and that medium is used as the reference category. Students in medium SES schools score on average lower than schools with high SES, and students in low SES schools on average have lowest scores. All schools included in the analysis participated in the whole study. As expected, it followed that the observed background information of schools (in the period prior to intervention and in the intervention period) did not explain any variability in intervention effects.
According to Model 3, correlation between random intercept and random intervention effect was –.84 (see Table 3), indicating that the intervention effect is smaller for schools with high average achievement. The random intervention effect was plotted against random intercept in Figure 6, illustrating these findings. For illustrative purposes, shapes indicate school SES. Surprisingly, schools with the highest intercept are not high SES schools.

Random intervention effects plotted against random intercepts (Model 3).
Intervention Trajectory
The chosen intervention trajectory was not significant as a main fixed effect (Model 4). It was tested (not shown in Table 3) whether there was an interaction effect for trajectory and intervention, which was positive for the M-M-S trajectory and negative for the M-S-S trajectory, but these effects were far from significant. Hypotheses 5a (the intervention effect will be larger for schools that chose the M-S-S trajectory than for schools that chose the M-M-S trajectory) and 5b (the intervention effect will be larger for schools that chose the M-M-S trajectory than for schools that chose the M-M-M trajectory) therefore have to be rejected. Student achievement did not differ significantly between schools choosing different trajectories, and no interaction effect with intervention was found.
Interaction Effects
In Model 5, interaction effects were introduced for school SES and the intervention and for student SES and the intervention. It was hypothesized that the intervention effect would be larger for schools with a large population of students with low SES (Hypothesis 3). The findings of this study support this hypothesis: The interaction effect for school SES and intervention was positive but not significant for schools with low SES and negative but not significant for high SES schools.
Hypothesis 4 concerned the interaction between intervention effect and student SES. It was stated that the intervention effect would be larger for low SES students. The interaction effect for intervention and low SES student was significant and positive (effect of 1.05), but surprisingly the effect found for high SES students and the intervention was also positive and significant (also an effect of 1.05).
Given that the interaction effect for student SES and intervention is conditional for the interaction effect of school SES and intervention, it is interesting to compare effects for the combination of student and school SES even though the latter were not significant. These combinations indicate that the effect of the intervention will only lead to a negative effect on student achievement for medium SES students in high SES schools and is positive and quite large for low and high SES students, regardless of their school’s average SES.
It was assumed that school and student background characteristics would not influence the effect of intervention, and it is interesting to monitor the stability of the estimated intervention effect across models. The estimated positive main intervention effect and the random effect variability over schools are stable across Models 1 to 4. Furthermore, the random intervention effect could not be attributed to differences in background information or differential growth in student and school achievement. Therefore, it is concluded that the random intervention effects are identified based on differences in achievement of students in the prior to intervention group and during intervention group.
The main intervention effect only decreased after including interaction effects in Model 5. These findings provide partial support for Hypothesis 1 (the implementation of DBDM will lead to higher student achievement; there is a positive intervention effect).
Although the model fit results are not presented, the multilevel models were investigated with respect to model fit. For each model, a residual analysis was carried out to identify outliers and investigate distributional assumptions of the residuals. The Level 1 residuals showed nine outliers, which most likely stemmed from incorrectly entered observations in the student monitoring system. Some of the scores did not fall within the possible score range of the administered test. Some bias in the fitted values were detected because of observed scores of zero. Since the scores were assumed to be normally distributed, by ignoring this lower-bound, some negative fitted scores were obtained. This lower-bound problem was ignored since the few negative predicted scores did not influence the parameter estimates, which were based on a total of 66,486 observed scores.
The student random effects were approximately normally distributed, but the random student effect distribution for Grade 6 to 8 scores was very peaked. The variability in random latent student scores in Grades 6 to 8 was less than expected since the correlation between random effects (Grades 3–5 and Grades 6–8) was high. The variance in effects across students was relatively low, leading to a more peaked distribution of the random effect distribution of student scores in Grades 6 to 8. However, this random effect was needed to properly represent the scores of students in Grades 6 to 8 despite the high correlation with the scores Grades 3 to 5.
The residual analyses at Level 2 showed that large residuals were obtained for the school coded as 2310, where all students scored exceptionally high. The school could be marked as an outlier, but there was no more information available. Finally, the assumption of homoscedasticity of Level 1 variances was tested using the chi-square test (Snijders & Bosker, 1999). It was found that the assumption of equal Level 1 variances was rejected, where significance was easily obtained through the high number of students per school. A further investigation of the Level 1 variances showed that for almost all schools the assumption of a common residual variance was acceptable. The extension to deal with heteroscedastic Level 1 variances would complicate the model analysis significantly and would only improve the error distribution of a few schools.
Conclusion and Discussion
There is a worldwide interest in the use of data in order to help improve education. Many studies focus on the preconditions for successful data-based decision making, or describe the process of DBDM in schools, but only a very few empirical studies are available on the effects of DBDM on student achievement. The present study is intended to contribute to the international knowledge base on DBDM effects by investigating heterogeneity in the effects of a DBDM intervention on student achievement for mathematics in 53 primary schools in The Netherlands. Tables 2 and 3 present the results of the analysis.
The findings of this study indicate that DBDM can improve student achievement (Hypothesis 1, confirmed), although effects differ across schools (Hypothesis 2, confirmed). The fixed effect of intervention without introducing interaction effects is 1.40, indicating an effect of almost an extra month of schooling during the two intervention years. Interaction effects suggest that DBDM is especially effective for schools with a large proportion of low SES students (Hypothesis 3, confirmed). Interestingly, the effects for interaction between student SES and intervention were not completely in line with expectations (Hypothesis 4, partially confirmed): The interaction effect was positive and significant for low SES, but this was also the case for high SES students. Combining the interaction effects of intervention and student SES and school SES leads to the conclusion that the effect of intervention will lead to a positive effect for both low and high SES students, regardless of their school’s SES, and will only lead to a negative effect on student achievement for medium SES students in high SES schools. An explanation might be that medium SES students in high SES schools often belong to the lower-scoring students. Since the intervention was aimed at raising achievement for all students, it is possible that teachers decreased the amount of time dedicated to the lowest scoring students in order to devote attention across all students more equally. However, this does not seem to hold for low SES students. Further analysis of the data may provide more insight into this effect.
The present study investigated the effects of a DBDM intervention that was focused on all four components of data-based decision making, as shown in Figure 1: analyzing results, setting goals, determining a strategy for goal accomplishment, and executing the chosen strategy.
Based on the results of another, quite similar intervention project, it is known that this intervention can lead to a considerable improvement in the correct interpretation of student achievement data (Staman et al., 2013). However, especially teachers still proved to make some misinterpretations after the intervention. These misinterpretations can lead to less adequate goals and a less effective instruction strategy, resulting in lower student achievement growth than is possible.
Furthermore, the meta-analysis of the effects of the use of digital student monitoring systems (DSMSs) on student achievement by Faber and Visscher (2014) shows that the use of a DSMS was especially effective when it was implemented by small groups of teachers (up to 30 teachers) and when DSMS use was aimed at improving instruction for small groups of children. An explanation for this may be that the intervention intensity will be smaller when addressing all teachers in a school at the same time. Furthermore, adapting instruction for all students will be more difficult for teachers than adapting instruction to the needs of a selection of students (Faber & Visscher, 2014). The small intervention effect found in the present study is in line with their research, since the use of data (e.g., by using the DSMS) was implemented schoolwide and aimed at improving education for all students at the same time.
Moreover, according to this review, the effect of the use of digital student monitoring systems was greater when the systems provided teachers with suggestions for adapting their instruction (Faber & Visscher, 2014). However, in the present study, the student monitoring systems used by the participating schools did not provide teachers with this kind of instructional suggestion. Based on anecdotal evidence from trainers in the project, the quality of analyses and instructional plans certainly increased during the intervention. The question remains, however, of whether all teachers can master the professional skills needed to implement DBDM in daily practice and whether they are all able to adapt their instruction to the needs of all students in their classroom. From the reports of the Dutch Inspectorate of Education, it is known that half to two-thirds of the teachers in primary schools do not master complex skills as differentiation (Inspectie van het Onderwijs, 2013). Exploratory classroom observations by the trainers during the intervention in this study confirmed those findings and suggest that the execution of instructional plans can still be significantly improved. Due to the large number of participating teachers in this project, it was not possible to explicitly include the coaching of teachers in their classrooms.
The Netherlands’s government promotes the use of data to improve education, but policymakers must be aware of the preconditions for implementing DBDM in practice. Acquiring skills related to the analysis of data, setting goals, and developing plans such as in the Focus intervention, combined with coaching and support in the classroom, is costly but is expected to lead to larger intervention effects than found in the present study (Faber & Visscher, 2014). For successful large-scale implementation, the combination of DBDM with classroom support or coaching is therefore recommended.
Previous research calls for more empirical studies in real school contexts (Turner & Coburn, 2012). It proved practically to be infeasible to find schools who were willing to participate in an experimental setting for two subsequent school years, risking the chance of being assigned to a control group. In this study, the effect of implementing DBDM was therefore compared to student achievement in the same schools during school years before the intervention.
Design Limitations: External and Internal Validity
The study design can be recognized as a single-subject design. Each school is repeatedly measured over time before the intervention period (the control phase) and during the intervention period (the treatment phase). The object was to measure the change in scores (i.e., performance of each school) and assess the impact of the intervention for each school. In the single-subject design, multiple schools can be measured repeatedly, but interest is focused on the intervention effect for each school and not for a (sub-)population of schools. This typical advantage of the single-subject design was used to measure school-specific intervention effects. Therefore, the fact that schools applied to participate in the study and that schools were not randomly assigned (to a control or treatment group) did not influence the validity of the school-specific measurement of the intervention. The intra-school measurements showed that the intervention effect was real and the method was reliable also through the use of standardized tests and the common scale analysis over grades.
Furthermore, several measures were taken to meet criteria of internal validity. Repeated measurements were taken at the pre-intervention period to take control over different threats to internal validity. The repeated measurements in the pre-intervention period did not show clear patterns illustrative for threats as testing, maturation, instrumentation, and statistical regression (Kratochwill et al., 2010). Furthermore, the repeated measurements for each school were not single-subject observations but were aggregate measurements constructed from multiple student scores. Therefore, it was not likely that extreme (low or high) school performances were measured due to for example sampling error or measurement error, which could highly influence the estimated intervention effect.
The student population for each school changed over time such that school measures were not based on a fixed student population. This diminished the possibility that some other event influenced the results. Schools in the study did not report any event that could influence a substantial amount of student performances to influence the estimate of the intervention effect. Furthermore, the average (between-school) intervention effect was based on the multiple within-school intervention effects, which can be considered to be robust to bias from event effects (e.g., Ferron, Moeyaert, Van den Noortgate, & Beretvas, 2014).
Finally, there was a threat of selection bias due to the self-selection of schools to participate in a specific trajectory. Systematic differences between schools before the study could possibly relate to the different trajectories within the intervention. During the intervention period, schools were not allocated to intervention trajectories at random but were allowed to choose the trajectory of their preference after the first intervention year. The choice to continue with DBDM for mathematics or broadening the scope of DBDM to spelling during the second intervention year was allowed to be made by schools in order to increase motivation and commitment. It was expected that this choice would be related to achievement gain during the first intervention year. However, analyses showed that there were no significant differences in achievement or intervention effects across trajectories (Hypotheses 5a and 5b, both rejected). Therefore, it may be assumed that schools did not base their choice of an intervention trajectory on the student achievement results during the first intervention year. Furthermore, it was unlikely that the self-selection of schools to participate in the study influenced the results. Besides the intervention trajectories, there were no different intervention conditions used.
In contrast to this design, in a completely randomized design, schools would be assigned to a control or a treatment group. This would provide insight in the effect of the intervention on the group of schools but ignore each school’s experience with the intervention. Although this would support measuring the general intervention effect for the population of schools, the school’s population-average intervention effect might not be that interesting since it is to be expected that the intervention effect will differ substantially over schools. The average intervention effect will simply not apply to most of the schools since schools show different changes in performances due to the intervention. Furthermore, it is not realistic to assume that schools can be assigned to a control phase for several years, which forbids them to participate in any other program to improve their performances.
However, the strength of the single-subject design is also its main limitation since results cannot be easily generalized beyond the schools that were included in the study. From this perspective, the multilevel modeling of the multiple single-subject studies (i.e., multiple schools were followed over time) can be seen as the joint modeling of all these studies to generalize the results. In our approach, by introducing a random intervention effect, the outcomes of the single-subject studies can be combined. This leads to an estimate of the average intervention effect and of the variation in the effects across the schools in the study. In fact, the joint multilevel modeling approach overcomes typical issues associated with the single-subject design in providing scientific evidence (Gage & Lewis, 2014; Jenson et al., 2007).
The schools in the study were self-selected and not sampled from a population of schools, and they might not be representative of all primary schools in The Netherlands. Compared to the total number of schools, schools from big cities were disproportionally represented, and participating schools had a higher than average proportion of students from a lower SES background. Since the effect of intervention was greater for low SES schools, the effect might be smaller for a sample containing more high SES schools. In future work, student achievement data of a national representative sample will be collected to compare student achievement growth of schools participating in this intervention with actual average growth of all students in The Netherlands.
The support from the project team finished after the two intervention years, and therefore the continuing implementation and sustainability were schools’ own responsibility. Since full implementation of schoolwide reform can take up to five years (Desimone, 2002), it will be interesting to monitor student achievement and DBDM implementation in the schools that participated in the intervention. Student achievement data in the first school year after completing the intervention will be collected in the summer of 2014 in order to estimate retention effects, and school leaders will be interviewed about the sustainability of DBDM in their school organizations.
Further research within this project will focus on the relationship between DBDM effectiveness and the preconditions for successful DBDM, such as school leadership, an achievement-oriented culture, and collaboration within the school team. A follow-up project includes the coaching of teachers on the effective use of DBDM in their classrooms.
Footnotes
Notes
M
T
A
J
References
Supplementary Material
Please find the following supplemental material available below.
For Open Access articles published under a Creative Commons License, all supplemental material carries the same license as the article it is associated with.
For non-Open Access articles published, all supplemental material carries a non-exclusive license, and permission requests for re-use of supplemental material or any part of supplemental material shall be sent directly to the copyright owner as specified in the copyright notice associated with the article.
