
Abstract
When students choose where to attend college, they often stay in close proximity to home and work. Much of the college choice literature, however, does not engage with the importance of geography in shaping educational destinations. Using county and commuting zone data from various federal sources, this study finds that the number of local colleges varies along lines of race and class. Communities with large Hispanic populations and low educational attainment have the fewest alternatives nearby, while White and Asian communities tend to have more. These can result in education deserts, or places where opportunities richly available for some communities are rare (or even nonexistent) in others.
Introduction
Geography and “place” are among the most salient factors shaping opportunity in the United States (Chetty, Hendren, Kline, & Saez, 2014). The neighborhood where people live can affect their upward mobility, health outcomes, educational attainment, and other life chances (Briggs & Wilson, 2005; Rothwell & Massey, 2015; Stewart, Stewart, & Simons, 2007). To engage with this literature, this study examines the geography of opportunity as it relates to postsecondary education by measuring the number, sector, and selectivity of colleges within every commuting zone in the country (n = 709). Commuting zones are clusters of rural, suburban, and urban counties that have a high degree of economic and social integration where people live and work within this geographic proximity (Tolbert & Sizer, 1996). These zones can be used as a proxy for the local geographic region from which prospective students might search for a college.
For students of color and students who work full-time, care for dependents, or have close social ties to their local communities, the proximity between home and college are important factors to weigh when considering college (Kim & Rury, 2011; Perna, 2010; Stewart et al., 2007). For these students and others who need to stay close to home for college, simply having a college nearby is one of the strongest forces shaping educational opportunity (Turley, 2009). However, not all communities have equal chances of having a college nearby; there are many places across the country where no colleges are located or where the options are scarce. These “education deserts” are disproportionately located in the nation’s poorest and most racially minoritized communities. Consequently, geography can be destiny when opportunities richly available for some communities are rare or even nonexistent in others.
The geographic location of colleges is one of the most basic and obvious dimensions of opportunity, yet policymakers and researchers often overlook how place shapes students’ educational destinations. Ignoring this context simultaneously ignores structural inequalities built into the postsecondary landscape and fails to prioritize one of the most important forces shaping opportunities for working-class students and students of color. After all, children born into poor neighborhoods have far lower chances of securing upward mobility than children born into more affluent ones (Chetty et al., 2014; Rothwell & Massey, 2015). If an accessible college is located nearby, then one’s chances of mobility should improve (Griffith & Rothstein, 2009; Turley, 2009), but this study shows that many communities across the country have no (or few) accessible options.
A brief example will illustrate this point. Two communities located a few hundred miles apart in west Texas—the Big Spring and Uvalde commuting zones—have similar population sizes (approximately 100,000 residents) but very different opportunity structures with respect to the number of colleges nearby. Big Spring, which is primarily White, has three community colleges and one public four-year institution. Uvalde, which is primarily Hispanic, has only one community college. Prospective students living and working in Big Spring have more opportunities and choices for pursing upward mobility than those in Uvalde, which likely sustains and can exacerbate existing inequalities between the two communities.
Why Place Matters
Similar differences occur across the country, and geographic inequalities are not unique to the field of education. The distribution of other public services such as medical doctors, K–12 schools, hospitals, and even access to nutritious food are stratified along spatial lines (Block & Kouba, 2006; Lamichhane et al., 2013; Tate, 2008; Walker, Keane, & Burke, 2010). These are the “visible outcome of a deeper process of spatial discrimination” that are socially constructed through policy and planning in ways that establish and maintain a social geography of class (Soja, 2010). To ignore the spatial dimensions of educational opportunity not only ignores some of the root causes of inequality but also fails to deliver a nuanced explanation of how and why students choose among colleges. In many places, that choice is likely to be less a function of “college knowledge” or “better information” about one’s options and more a function of geography. By surfacing the importance of geography and place, this article can help researchers build a more nuanced explanation of why students might choose one particular college over another.
Some observers may be quick to dismiss the importance of place because of the transportation and technological innovations that have occurred over the past several decades. Indeed, the higher education marketplace has converged, and students are more mobile than ever before—it is less expensive to travel long distances than it was 30 years ago, so students may be more likely to travel farther for college (Hoxby, 2009; B. Long, 2004). But mobile students tend to be White and wealthier than the average college student; they are also more likely to enroll in highly selective private colleges (Niu, 2015; Shaw, Kobrin, Packman, & Schmidt, 2009). Most students are not mobile; in fact, most do not enroll in private colleges: Approximately 70% of all college students enroll in public colleges and universities (U.S. Department of Education, 2014c). Among these public sector students, the average distance between home and school is 52 miles, while the median is 11 miles (National Center for Education Statistics, 2013). Similarly, most students do not participate in distance education; the U.S. Department of Education (2014a) reports that fewer than 1 in 10 undergraduates (6.5%) enroll exclusively online. Even with these transportation and technology innovations, place still matters in the 21st century.
Nevertheless, policymakers still discuss college choice in isolation of geography and place. For example, federal reforms like the College Scorecard, Financial Aid Shopping Sheet, and the proposed college ratings system all aim to get more information into the hands of students so they can search for the college that is right for them (Espinosa, Crandall, & Tukibayeva, 2014; Morgan & Dechter, 2012). This market logic may work well for mobile students or for those living in communities that have several college alternatives nearby, but not all students have the luxury of “shopping around” for a college. Consequently, federal policy reforms might play to the advantage of privileged students’ choice-making process while ignoring the needs and challenges facing students who search locally for college. Considering the rising costs of attending college, some have argued place is more important today than ever before (Roscigno, Tomaskovic-Devey, & Crowley, 2006; Shaw et al., 2009; Tate, 2008). By living close to home or within proximity to a college, students can save on transportation costs and other living expenses in order to make college more affordable (Briscoe & De Oliver, 2006; Dillon & Smith, 2013).
Research Questions
By identifying the number of accessible colleges that are located within commuting distance of the nation’s total population, this study examines how the structures of educational opportunity vary by geography. Considering that students—many of whom are low-income, minority, and otherwise “nontraditional”—choose college according to convenience and proximity, geography can be the most important factor shaping educational destinations (Jepsen & Montgomery, 2009; Turley, 2009). Accordingly, this study asks two main research questions.
Research Question 1: To what extent does the number of local colleges vary by the racial/ethnic and socioeconomic profile of the community?
Research Question 2: Are these characteristics associated with having more public or private colleges within a commuting zone?
Conceptual Perspectives: Geography and College Choice
Geography of opportunity is a key concept in understanding the nature and extent of educational inequality in America (Miller, 2012; Tate, 2008). For prospective students living in communities where there are few colleges nearby, educational opportunities are constrained not simply by their own preferences and dispositions but also by their community’s educational infrastructure. If there is only one accessible college nearby, then the choice of where to enroll is predetermined for students who need to stay close to home—many of whom are underrepresented in higher education. For these students, geography matters most when deciding whether and where to attend college. To truly understand students’ college choices, we must understand the environment in which their choices occur.
However, traditional theories of college choice focus on the process of opportunity instead of the geography of opportunity. Traditional process-oriented theories believe students make educational decisions in temporal stages: Students first develop predispositions about college at very early ages, then they search for colleges based on their educational preferences and expectations, and they eventually choose where to enroll after weighing the perceived and real costs/benefits (Cabrera & La Nasa, 2000; Hossler & Gallagher, 1987; Manski, 1983).
From this perspective, the reason students do not attend is due to a breakdown in the choice-making process, presumably a result of informational or financial constraints. By framing access problems from this deficit-oriented perspective, where students simply lack the information to make optimal choices, policymakers may design simplistic solutions that do not address underlying structural inequalities. For example, getting money or information into the hands of students is becoming the preferred way to address educational inequalities, which rests on the assumption that information asymmetry is the root cause of inequality (Dynarski & Scott-Clayton, 2013; Hoxby & Avery, 2013; Page & Scott-Clayton, 2015).
By applying a spatial lens to college opportunity, we can see that the root cause of inequality in many communities is driven by the simple fact that no accessible college is located nearby. No matter how well informed a student might be, their choices are still constrained by their local environment. This is why Turley (2009) urges researchers to “stop treating the college choice process as though it were independent of location and start situating this process within the geographic context in which it occurs” (p. 126). And as Soja (2010) explains, geographical differences are created and sustained through policy action and political negotiations where spatial inequality is concentrated in areas facing high levels of unemployment, poverty, and social exclusion. A popular example of this type of social exclusion occurs with food deserts, where there are low concentrations of healthy or affordable food options in some of the nation’s most impoverished and segregated communities (Walker et al., 2010).
The structural inequality that exists in food deserts is but one example of how geography of opportunity shapes life chances. Chetty et al. (2014) draw on geography of opportunity theories to describe how the unequal resources available in communities contribute to social immobility. Briggs and Wilson (2005) examine how affordable housing is vastly unequal depending on where one lives, Kennedy (2004) finds unequal access to transportation that is largely defined by geographic boundaries, and Smedley, Stith, and Nelson (2009) find that high-quality and affordable health care is clustered along spatial domains. In each example, it is clear that place matters and that individual choices are affected by the quantity and quality of goods and services available near where one works and lives.
These inequalities ultimately shape social interactions, where social classes are spatially segregated from one another. Massey (2005) explains that the social division of labor is created through geographic inequality, that is, working classes are spatially segregated from middle and upper classes. Similarly, communities are becoming increasingly segregated along lines of race and ethnicity (Massey, Rothwell, & Domina, 2010). If a working-class community has no accessible college nearby, then they will have few opportunities for upward mobility, which in turn maintains their social position. From this perspective, it is not surprising that Chetty et al. (2014) and Rothwell and Massey (2015) find the lowest levels of upward mobility are concentrated in communities with low educational attainment levels and few colleges nearby.
Consequently, geography of opportunity can be a useful lens from which we can understand the source of inequalities in educational attainment. By prioritizing the role geography plays in shaping and maintaining educational inequality, we not only gain new perspectives on the source of inequality but also develop new ways to understand why students choose their colleges. To the extent someone has close familial or social ties to their local community, then it seems unlikely for them to uproot and attend college hundreds of miles away. Having “better information” about a college hundreds of miles away may be irrelevant for a student who prefers to (or needs to) stay close to home, regardless of how well another college might be a good academic fit. The challenge is that many students who need to stay close to home may have very few opportunities nearby, which only serves to reinforce and reproduce inequality. Ignoring the geography of college opportunity overlooks these important nuances, yet these nuances are what can be most important for many prospective students.
Literature Review
By viewing college opportunity through the lens of geography, we can see how choices are constrained according to what is available in the built environment. Ignoring this context will lead researchers and policymakers to perpetuate models of choice making that are incongruent with the experiences of students most affected by geography. Working-class students and students of color are likely to have unequal opportunity structures around them and to be more influenced by geography; therefore, prioritizing place over process can help policymakers and researchers develop more inclusive and nuanced responses to educational inequality. A growing body of literature reviewed in the following has prioritized the spatial dimensions of college access, though there is still much work to be done.
The Role of Broad-Access Institutions
A helpful starting point is with the emerging literature on “broad-access institutions” that play a unique role in serving their local communities. Community colleges and nonselective four-year colleges and universities are deliberate in their efforts to serve the public through open-admissions policies, lower tuition charges, and service to local and regional needs (Fryar, 2015). These institutions are also where the majority of the nation’s working adults, Hispanic and Black students, and low-income students attend college (Flores, Horn, & Crisp, 2006; Kirst, Stevens, & Proctor, 2010). Many broad-access colleges are Minority Serving Institutions, such as Historically Black Colleges and Universities (HBCUs), Hispanic Serving Institutions (HSIs), Tribal Colleges and Universities (TCUs), and Asian American and Native American Pacific Islander-Serving Institutions (AANAPISIs), that play a vital role in expanding opportunities to students of color (John & Stage, 2014). Recognizing the importance of place, the federal government provides additional funding and institutional support for colleges serving geographically isolated, racially segregated, and underserved communities (Conrad & Gasman, 2015). However, many of the most racially segregated and low-income areas do not have these colleges nearby (Dache-Gerbino, 2014).
For students who stay close to home, broad-access institutions may be the only viable option nearby. While there are many success stories of broad-access institutions serving their communities well (Fryar, 2015), there are also challenges with respect to how these institutions are financed and whether they have the capacity to meet growing enrollment demands (Jenkins & Rodriguez, 2013). For example, Bound, Lovenheim, and Turner (2012) find broad-access colleges have lower expenditures per student and higher faculty-student ratios, making it difficult for these colleges to serve and retain students. This is why some researchers argue “high-achieving, low-income” students should attend more selective schools as a way to increase their likelihood of degree completion (Bowen, Chingos, & McPherson, 2009; Dillon & Smith, 2013; Hoxby & Avery, 2013). From this perspective, students should bypass their local or regional colleges in favor of more selective colleges that may be located several hundreds of miles away. But considering the average student attending a highly selective college lives approximately 600 miles away (Avery & Hoxby, 2004), this is not only an unreasonable expectation for students who search locally for college, but it fails to provide a nuanced understanding of how students of color and working-class students select colleges.
Choices are made not simply as a function of academic preparation or information asymmetries; rather, they are intentional decisions to stay close to family, go where students from one’s own high school have been successful in the past, or to be around other working-class students and students of color (Black, Cortes, & Lincove, 2015; Núñez & Bowers, 2011). Choices are also shaped by the basic geographic features like whether a college is located nearby and whether it is within commuting distance between home and work. Accordingly, the following discussion synthesizes three themes from the literature that helps us understand how geography affects students’ colleges choices, beginning with a synthesis of the distance elasticity literature, which consistently finds the further (closer) one lives to a college, the less (more) likely one is to enroll. It then highlights research on the spillover effects of geography, drawing on studies that show simply having a college nearby is strongly associated with enrolling and attaining a degree. It concludes with literature on the role of community ties as a strong force keeping students close to home for college.
Distance Elasticity
Borrowing from a concept commonly used in economics, distance elasticity examines how sensitive enrollment patterns are relative to proximity from college. Studies have consistently identified a “deterrent effect” between distance and enrollment, where the further one lives from a college, the less likely they are to enroll (Alm & Winters, 2009). For example, case studies of public colleges in Georgia (Alm & Winters, 2009), Texas (Jones & Kauffman, 1994), Washington (Ullis & Knowles, 1975), and West Virginia (K. Ali, 2003) find a 1% change in distance from a nearby college reduces the likelihood of enrolling by a low of 0.4% to a high of 2.2%. These elasticities differ for in-state and out-of-state students, where in-state students are more elastic and out-of-state are more inelastic. For mobile students, distance takes a nonlinear relationship; that is, enrollment demand rises when colleges are far away from home. From this perspective, demand is “u-shaped” where it declines and eventually rises with distance (DesJardins, Ahlburg, & McCall, 2006; B. Long, 2004; Niu & Tienda, 2008).
This nonlinear relationship is consistent with Hoxby’s (2009) argument that the market structure (for four-year colleges) is converging in ways that make distance a less relevant factor in college choices. However, this marketplace is converging only for the most mobile students. It is not converging for the “marginal student” who is unable to live far away from home to attend college (B. Long, 2004). Interestingly, students are likely to apply to colleges that are far away from home but ultimately enroll closer to home (DesJardins et al., 2006; Dillon & Smith, 2013; Do, 2004; Fuller, Manski, & Wise, 1982). This is especially relevant for students of color and working-class students who need to stay close to home—many may desire to attend a college far away, but the realities of work, family, and other commitments require they stay close to home (Ovink & Kalogrides, 2015; Perna, 2010).
Spillover Effects
Simply having a college nearby can shape individuals’ enrollment decisions because the more convenient a college is to one’s work or home, the more likely people will participate. This relationship is especially true for community colleges, as Rouse (1995) finds living closer to a community college is associated with being more likely to start college there. This is similar to what Card (1993) and later Kling (2001) found, where young men living near a four-year college appear to achieve more years of education and that these effects are “concentrated among men with poorly-educated parents—men who would otherwise stop schooling at relatively low levels” (Card, 1993, p. 25).
These spillover effects exist because having a college nearby “makes the transition to college logistically, financially, and emotionally easier” (Turley, 2009, p. 138). When these costs are high, students are less likely to enroll, as documented in case studies of University of San Antonio (UTSA). At UTSA, commuter students pay two times more in transportation costs and spend more than three times longer commuting than those who live closer to the university (Briscoe & De Oliver, 2006; De Oliver, 1998). In addition to convenience, spillovers exist because communities with colleges may have a raised collective consciousness regarding the importance of education (Griffith & Rothstein, 2009). They also exist because colleges have a visible presence in their communities, especially those that are more civically engaged, so prospective students will be more aware that a college is nearby (Do, 2004). Whether spillovers occur out of convenience or out of a raised collective consciousness of a community, the literature consistently finds that places with more college options have greater educational participation and attainment rates (Franklin, 2013; Hoxby & Avery, 2013; Stoering, 2000; Turley, 2009; Weiler, 1994). These results are noteworthy because they suggest having colleges nearby can build an environment conducive to college attendance, positively influencing local young adults and particularly those from lower socioeconomic status backgrounds (Perna, 2006).
Notably, these spillover effects will vary by state and region. Some states, like California, designed statewide master plans in the 1960s with the goal of having a large “tripartite” system of public higher education that includes community colleges, regional comprehensive colleges, and selective research universities located throughout the state (Douglass, 2007). Alternatively, some small New England states developed relatively small systems of public higher education due to the large number of private nonprofit institutions in the region (Goldin & Katz, 1998). Still other states, such as Ohio, designed their systems primarily around community colleges and regional broad-access campuses with the goal of putting colleges within reach of more students (Cohen & Brawer, 2008; Doyle & Gorbunov, 2011). And many Southern states are still combatting the legacy of racial segregation and the vestiges of dual systems of public higher education (Olivas, 2005). These structural differences matter because each state has its own public education history and nuance that shape today’s systems. Nevertheless, the literature reviewed here shows spillover effects exist in a variety of different contexts.
Community Ties
Several studies have focused on the importance of place with respect to “why” students limit their college options. Many community college students, for example, work full-time and seek educational opportunities that are convenient to their work or commuting patterns (Somers et al., 2006). Strong community ties and familial commitments shape enrollment decisions among ethnic minority groups (particularly Hispanic youths) and rural students (S. Ali & Saunders, 2009; Baum & Flores, 2011; Byun, Meece, & Irvin, 2012). Similarly, tight social networks can shape where students decide to apply and ultimately enroll since familial commitments and obligations (e.g., care for siblings and elders) can shape the choice preferences for Black and Hispanic youths (Hurtado, Inkelas, Briggs, & Rhee, 1997; McDonough, Antonio, & Trent, 1997; Perez & McDonough, 2008). These networks are not only from social peers but also built into the high school’s curriculum where guidance counselors often channel Hispanic students into Hispanic Serving Institutions (Núñez & Bowers, 2011).
Across this literature, it is clear that a college’s selectivity and proximity to students shapes enrollment choices. Selectivity and proximity are particularly important factors for students who need to stay close to home, yet we know little about whether or to what extent local geographic areas even have accessible options nearby.
Research Design
This study uses a unique panel data set from multiple federal sources to examine how the number and selectivity of colleges varies according to local geographic characteristics. It employs a generalized Poisson regression analysis and controls for local population, socioeconomic, and labor market conditions in order to identify whether certain communities have systematically more (or fewer) accessible colleges nearby. Since these controls vary over time, the analysis measures these local conditions annually for five years from 2009 to 2013 and includes both state and year fixed effects. This research design, which accounts for both cross-sectional and time-series variation, improves the model’s internal validity and helps us detect significant differences in the number of colleges in every commuting zone of the United States.
Measures
To measure a local geographic area, this analysis uses predefined commuting zones developed by Tolbert and Sizer (1996). A commuting zone (CZ) is a statistically derived cluster of counties that share similar labor markets and economic activity to measure the local geographic region where people live, work, and commute. Similar to a metropolitan/micropolitan statistical area (MSAs), commuting zones aggregate county-level data into a single geographical unit: All 3,147 counties in the United States are statistically grouped into one of 709 unique CZs. 1 Commuting zones offer two advantages over MSAs, namely, that they are defined not by population size but by the flow of people between counties. Additionally, CZs include rural counties that are often too small to be included in metro/micropolitan statistical areas. Because of these two advantages, they are preferred over metro/micropolitan areas.
The Tolbert and Sizer (1996) classification is becoming increasingly useful in studies of regional and local economies, as seen with Autor and Dorn’s (2013) study of local labor market wage inequality and Chetty et al.’s (2014) studies on intergenerational mobility. In higher education research, the Tolbert and Sizer commuting zone classifications have been used to study the effects of local labor market conditions on community college enrollment (Kienzl, Alfonso, & Melguizo, 2007). All data are analyzed in Stata statistical software, though the maps are generated using Tableau.
Figure 1 displays these geographic areas for the continental United States, where lighter shaded regions have fewer colleges and darker have more. Heavily populated commuting zones tend to have more colleges, though as we will see later, there is wide variation by sector and selectivity. This figure shows how the number of colleges differs considerably depending on the state and region where one lives. For example, Turley (2009) found that residents in Eastern states have the most four-year colleges in proximity (only 4% live where there are no four-year colleges), while the West and South have the fewest (19% and 20% have no four-year colleges nearby, respectively).
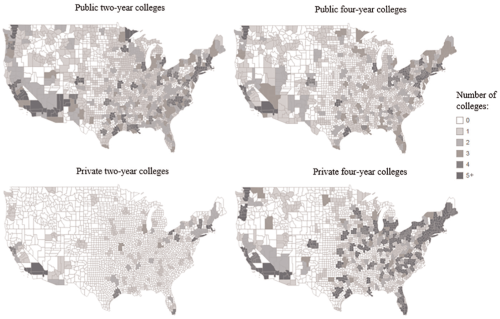
Number of colleges (by sector) per commuting zone
Outcome Variables
To locate colleges in the United States, the data set utilizes U.S. Department of Education’s Integrated Postsecondary Education Data System (IPEDS) records. This includes two-year and four-year degree-granting colleges that operate in the public (n = 1,781) or private nonprofit (n = 1,898) sectors of higher education. These two sectors account for 90% of the nation’s total college enrollments (U.S. Department of Education, 2013b). In IPEDS, each college has a unique county code, which is used to match colleges to their appropriate commuting zone. Colleges that operate solely online (many of which are for-profit colleges) are excluded. The IPEDS data also provide information on the selectivity of each college. If a community’s only college is highly selective, then it is not a viable option for all members of that community. Accordingly, the analysis follows the U.S. Department of Education’s (2014b) selectivity convention: highly selective (less than 50% admitted), selective (50% to 75%), moderately selective (75% to 90%), and open-access (90% or more accepted). These data are collected for every college in each of the following five years, 2009–2013. 2
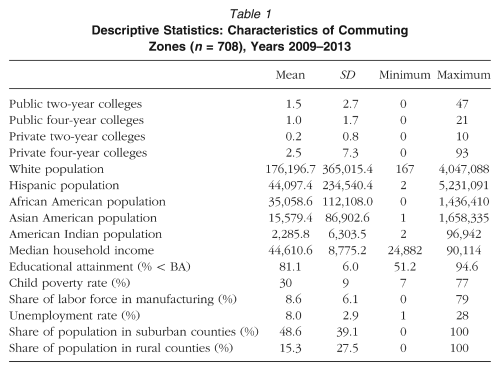
Table 1 provides descriptive statistics of all variables used in the analysis. The average commuting zone has 5.2 colleges, where private four-year colleges are the most common (2.5), followed by public two-year (1.5) and four-year (1.0) colleges. Least common are private two-year colleges, having only 0.2 per commuting zone. There is a wide degree of variation in the number of colleges per commuting zone, as displayed previously in Figure 1. There are several communities with few colleges, while other communities have many, so the research design accounts for the population size of these commuting zones to detect whether the structural environments differ by community characteristics.
Descriptive Statistics: Characteristics of Commuting Zones (n = 708), Years 2009–2013
Control Variables
To measure the population, socioeconomic, labor market, and geographic characteristics of each CZ, several county-level variables from federal data sets are merged (using county FIPS codes) and assigned to their respective Tolbert and Sizer (1996) commuting zone. Population data are from the U.S. Census Bureau and National Center for Health Statistics bridged-race estimates, which includes Hispanic/Latino groups and the following non-Hispanic/Latino groups: American Indian or Alaskan Native, Asian or Pacific Islander, Black or African American, and White.
Socioeconomic controls include measures of income, educational attainment, poverty rates, and the local labor market. Income is measured by the median household income (2013 dollars using the Consumer Price Index), which comes from the Bureau of Economic Analysis Regional Economic Accounts. Educational attainment is measured by the percentage of adults 25 years or older with less than a bachelor’s degree, from the U.S. Census Bureau’s American Community Survey. Poverty rates are measured by the percentage of children under 18 years old below federal poverty levels, from the U.S. Census Bureau’s Small Area Income and Poverty Estimates.
Local labor market conditions are measured by the percentage of jobs in manufacturing and the local unemployment rate, which comes from the Bureau of Economic Analysis and Bureau of Labor Statistics, respectively. And to account for geographic dispersion, it uses the USDA’s Rural-Urban Continuum zones to measure the percentage of each commuting zone’s population living in rural and suburban counties. It also controls for each commuting zone’s census divisions: Northeast (New England and Middle Atlantic), Midwest (East and West), South (Atlantic, East, and West), and West (Mountain and Pacific). These data are collected for every county and commuting zone for five years, 2009–2013.
Analytical Method
Each commuting zone has a limited number of colleges, with the lowest possible number being zero, so a Poisson distribution is used to model these data. Poisson regression models are designed to handle count data and can be implemented in panel data structures if fixed effects are used, where the number of colleges varies by each commuting zone (i) and over time (t) (Allison & Waterman, 2002; Hilbe, 2011). In this data set, the variance for colleges per commuting zone is greater than the mean, resulting in overdisbursed data that yield inefficient parameter estimates. Accordingly, the analysis estimates the models using a negative binomial distribution, which is a generalization of the traditional Poisson distribution that accounts for overdispersion (J. Long & Freese, 2005):
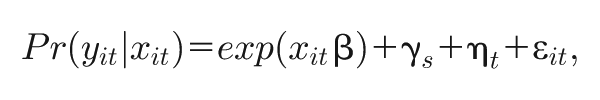
where y is the count of colleges per commuting zone and x is a vector of control variables discussed previously, with β representing each of their parameter estimates. Fixed effects for each state (γ s ) and year (η t ) are included to reduce bias, and the error term, ϵ, is uncorrelated with the x’s and clustered at the commuting zone to improve model efficiency due to serial autocorrelation. These state fixed effects capture unobserved state-level heterogeneity that is relatively stable over time, while year fixed effects capture unobserved temporal changes that change over time.
The analysis includes counts for the total number of colleges per commuting zone but also provides subanalyses counting the number of public and private colleges per commuting zone. Each model is disaggregated between two-year and four-year sectors and (for four-year colleges) their selectivity. Results are presented in incidence rate ratios (IRRs), which is similar to the more familiar odds ratio used in logistic regression. An IRR value greater than one is associated with having more colleges per commuting zone, and less than one is associated with fewer. Similar to an odds ratio, the IRR is the exponentiated Poisson coefficient and can be interpreted as the rate of change in the number of colleges per commuting zone, when other variables in the model are held constant. This allows us to estimate the discrete count of colleges according to various commuting zone characteristics.
Limitations
Despite these research design strategies, there are noteworthy limitations to consider. First, this study is correlational and not designed to draw causal inference. For example, a commuting zone might have more colleges because of a growing population, but having more colleges could also create population growth. This study is designed to assess whether differences exist across communities; it is not designed to identify causal relationships between community characteristics and the number of colleges nearby.
Second, some commuting zones are very large catchment areas (e.g., Chicago’s surrounding counties are a single CZ), suggesting that there could be heterogeneity within large commuting zones. The models control for population size, but an even more granular unit of analysis (e.g., census tract) could offer more insights into the patterns reported in this study. Third, the analysis excludes for-profit colleges and any online public or private college (e.g., University of Maryland University College) since its emphasis is on “brick and mortar” institutions. Although the data used in this study account for 90% of the nation’s total undergraduate enrollment, it does not allow me to examine the hometown (or commuting zone) of students who enroll online. Further research could examine if communities with few “brick and mortar” colleges have more for-profit or exclusively online colleges. All references to private colleges mean private nonprofit, not for-profit, institutions. Finally, the study uses common federal measures to serve as proxies for various social and economic characteristics of communities, but these measures can be incomplete. Poverty rates, for example, do not capture the full extent of economic hardship for families, nor are they sensitive to differences in cost of living (Blank, 2008; Johnson & Smeeding, 2012). Accordingly, further research should examine more closely how education deserts differ on alternative social and economic measures.
Results
The first research question examines whether the total (both public and private) number of local colleges varies by the racial/ethnic and socioeconomic characteristics of the commuting zone. Table 2 displays these results in six columns, where estimates with values greater (lower) than one designate an increase (decrease) in the rate of observing an additional college nearby. The first and second columns of this table show the estimated total number of two-year and four-year colleges, respectively. It does not distinguish between public and private sectors, yet we see as the White population rises by 1%, the rate of adding an additional two-year college rises by 44.9%, and there is not a detectable difference in the total number of four-year colleges. When stratifying the sample according to four-year college selectivity in Columns III through VI, we see the rate of having a moderately selective college nearby (those admitting between 75% to 90% of applicants) rises as the White population rises. On the other hand, commuting zones with larger Hispanic populations tend to have more two-year colleges but fewer four-year colleges. As a commuting zone’s Hispanic population rises, the number of selective (50% to 75%) and moderately selective (75% to 90%) four-year colleges would change by a factor of 64.1% and 83.7%, respectively. This indicates that fewer four-year colleges are nearby in larger Hispanic communities.
Regression Estimates, Count of Total Colleges Per Commuting Zone (Incidence Rate Ratios)
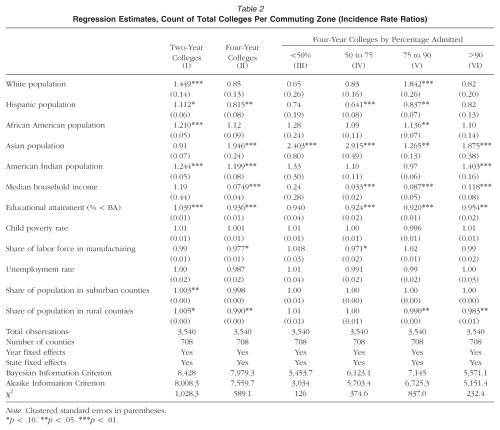
Note. Clustered standard errors in parentheses.
p < .10. **p < .05. ***p < .01.
This table also shows that the rate of having a local four-year college is largest for communities with large Asian populations. A 1% increase in population is associated with more than doubling the rate of having a four-year college nearby. But as the African American population rises, there are greater rates of having either two-year colleges or moderately selective (75% to 90%) four-year colleges nearby. Communities with larger American Indian populations have more two-year colleges; when they have more four-year institutions, these tend to be open-access (greater than 90% admitted). Importantly, while most TCUs are located on tribal lands, most Native Americans live off tribal lands, suggesting the results are not solely a function of tribal college locations (U.S. Department of Interior, 2014). These results show opportunity structures clearly vary by the racial/ethnic population of a commuting zone. Table 2 also shows differences along socioeconomic factors where higher-income communities have fewer nonselective four-year colleges, while those with lower educational attainment have more two-year colleges. Similarly, when communities have larger manufacturing labor forces and greater shares of the population in rural counties, they tend to have fewer four-year colleges and more two-year colleges nearby.
Results from Table 2 show national trends across both public and private sectors, so Tables 3 and 4 examine whether these patterns are maintained after stratifying the sample by sector. This allows us to answer the second research question while helping to identify patterns across all three tables. Doing so results in two primary findings. First, the racial/ethnic population size of a commuting zone is consistently associated with the number and mix of colleges nearby. Second, communities with lower educational attainment tend to also have fewer four-year colleges nearby. These findings are discussed in more detail in the following, drawing observations from across all three tables.
Regression Estimates, Count of Total Public Colleges Per Commuting Zone (Incidence Rate Ratios)

Note. Clustered standard errors in parentheses.
p < .10. **p < .05. ***p < .01.
Regression Estimates, Count of Total Private Colleges Per Commuting Zone (Incidence Rate Ratios)
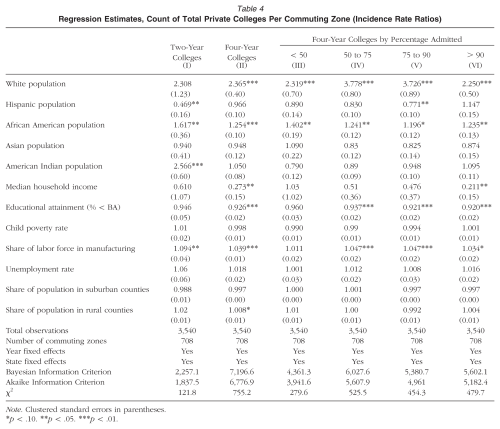
Note. Clustered standard errors in parentheses.
p < .10. **p < .05. ***p < .01.
Uneven Proximity by Race/Ethnicity
Across Tables 2, 3, and 4, there are systematic patterns with respect to the number of colleges nearby and the commuting zone’s racial/ethnic population. Commuting zones with larger White populations are not just associated with having more colleges—they tend to have more public two-year colleges and more private four-year colleges of all selectivity levels nearby. For each percentage increase in the White population, the number of private four-year colleges nearby more than doubles in rate. A similar pattern holds with the Black population, which is more likely to have public two-year and private four-year colleges nearby, but the rate of change is much smaller. As the Black population rises, the rate of having a public two-year college rises by 19.0% (as opposed to 44.7% for White population). Similarly, the rate of private four-year colleges increases by 25.4% and 136.5% for each unit increase in Black and White population, respectively.
While Black and White commuting zones tend to have higher rates of colleges nearby, those with larger Hispanic populations tend to only have public two-year colleges as the nearby option while being less likely to have public four-year colleges nearby. In Table 3, each unit increase in the Hispanic population is associated with increasing the rate of having a public two-year college by only 12.4%; the rate of having a public four-year college nearby actually declines by a factor of 84.8%. Not only do larger Hispanic communities have fewer public four-year colleges nearby, but Columns IV and V of Table 3 shows there are fewer selective and moderately selective public four-year colleges nearby. Larger Hispanic communities not only have fewer public four-year options, but they also have fewer private two-year and moderately selective four-year colleges. The primary access point in Hispanic commuting zones is likely to be a public two-year institution.
Commuting zones with larger Asian populations tend to have more public four-year colleges of all selectivity levels nearby, while larger American Indian communities tend to have more two-year and open-access public four-year colleges nearby. Interestingly, commuting zones with larger Asian and American Indian populations tend to have more public institutions rather than private institutions. Table 4 reveals only one instance where there are more private institutions for these two groups: As a community’s American Indian population rises, the rate of having a private two-year college nearby nearly triples. But there are no other significant patterns with respect to the number of private sector colleges, suggesting that when these two communities have colleges nearby, they tend to be public.
Across these tables, the rate of having a public or private college nearby varies considerably across racial/ethnic groups. After controlling for a number of local socioeconomic and economic factors, a 1% increase in a commuting zone’s White or Asian population often yields larger coefficients (when significant) than a 1% increase in Hispanic, Black, or American Indian population. While the number of nearby alternatives may increase for all groups in some tables, the size of increase varies according to the racial/ethnic profile of the commuting zone. These results will be discussed in more detail in the following, but it is clear that the opportunity structure varies across geographic areas, where a striking result is that White communities tend to have the most alternatives nearby while Hispanic communities have the fewest.
Uneven Proximity by Educational Attainment
The second main theme from these findings is that commuting zones have very different opportunity structures according to the educational attainment of the local population. This relationship is likely endogenous: People move to areas that have colleges, but areas that have colleges can also produce higher educational attainment levels. Nevertheless, establishing a relationship between these two variables is important for understanding fundamental opportunity structures in postsecondary education. Across all models, areas with low educational attainment levels (i.e., share of adults with less than a bachelor’s degree) have fewer four-year colleges nearby.
That this pattern holds even after controlling for a range of other socioeconomic conditions (e.g., child poverty, income, etc.) suggests two things. First, it suggests people stay close to home when deciding where to attend. If people were highly mobile, then we would expect to find little to no pattern with respect to the number of local colleges and the local educational attainment rates. Second, this suggests evidence of spillover effects where communities with higher educational attainment levels may be a result of having more colleges nearby. This study cannot disentangle the nature of the migratory patterns involved, but the fact that the pattern holds so well across all models suggests simply having a bachelor’s degree granting institution nearby may be a way to improve educational attainment.
This finding is consistent with Soja’s (2010) and Massey’s (2005) work on the spatial division of labor and the way opportunities are structured for people who have less power and privilege in society. It suggests communities with lower educational attainment levels stay that way not due to their own decisions but to the decisions of policymakers who determine site selection and the location of colleges. Instead of having access to four-year colleges nearby, communities with low educational attainment have more community colleges nearby and are more likely to be education deserts. Further research is necessary to explain the nature of this relationship and examine the program offerings of these colleges, but the results are indicative of systematic differences along lines of race and class that shape the college opportunity structure of a community’s population.
Conclusions and Discussion
Although there is a market of highly mobile students who are willing and able to travel far distances to attend college, most students stay relatively close to home. Students who work full-time, have families, are older, or are members of racial/ethnic minority groups tend to be more affected by geography. Place matters when deciding whether or where to attend college, so this study takes a close examination of the geography of college opportunities. If equal opportunities exist geographically, then we would find no significant patterns in terms of the number or types of colleges and a community’s characteristics. However, this study finds systematic patterns along lines of race and class, where communities with larger Hispanic populations and lower educational attainment levels tend to have more two-year colleges but fewer four-year colleges nearby. For these two populations, the opportunity to pursue a postsecondary education is constrained to what is nearby.
This finding is consistent with that critical geographers have found in many other domains of public life, where opportunities to basic services like health care, nutritious food, transportation, and compulsory education are stratified by race, class, and income (Soja, 2010). These inequalities do not happen at random but are created and sustained through policy decisions. Basic needs like food, housing, employment, and education are stratified along spatial dimensions, yet policymakers and researchers often overlook this important context, which only makes it more difficult to reverse spatial inequalities. One consequence of sustaining this inequality is that it can curtail upward mobility and life chances for individuals living in the most isolated and unequal communities (Chetty et al., 2014; Rothwell & Massey, 2015). Access to college is one of the key mechanisms to reverse social inequality, yet in many of the nation’s least educated and racially minoritized communities, there are few (or no) colleges nearby from which one can improve their life chances. Soja (2010) argues that the spatial distribution of resources (in this case, colleges) matters because it is one of the most obvious expressions of spatial injustice.
By applying the concept of geography of opportunity to these results, we can see that the educational built environment is unequal across commuting zones. Much like food deserts, this study finds “education deserts” where the number of college opportunities nearby is constrained along lines of race and class. Consequently, individuals’ choices about where to attend college are likely conditioned by their built environment and not simply their preferences, academic ability, or informational constraints. This finding can help researchers develop more nuanced theories of college choice that prioritize place over process, where geography becomes a central factor in explaining why students attend different colleges. Traditional models of college choice do not offer enough nuance for explaining why students who search locally for college choose their particular college. And considering that few students have the luxury of “shopping around” for college or accessible alternatives nearby, geography should play a much more central role in college choice literature.
To illustrate these points even further, the following figures convert the regression coefficients into average marginal effects where we can predict the number of colleges according to how many Hispanics live in a commuting zone (Figure 2) or by educational attainment level (Figure 3). Figure 2 illustrates that communities with the lowest Hispanic population have large numbers of four-year colleges nearby. But as a community’s Hispanic population grows, the number of four-year colleges quickly drops while the number of two-year colleges steadily rises. However, even when the Hispanic population is large, they are estimated to only have around two public two-year colleges nearby and only one or zero public four-year colleges.

Estimated number of public colleges per commuting zone, by Hispanic population

Estimated number of public colleges per commuting zone, by educational attainment rate
Similarly, Figure 3 shows that communities with the lowest educational attainment level have an increasing number of public two-year colleges nearby. Moving along the x-axis shows that as the percentages of adults with less than a bachelor’s degree rises, the number of public four-year colleges nearby declines. Communities with high educational attainment levels are estimated to have between four and eight public four-year colleges nearby and only one public two-year college. But as a community’s educational attainment level declines, so too does the number of four-year institutions. As the number of four-year colleges declines, the number of two-year colleges increases where communities with the lowest educational attainment levels are estimated to have no public four-year colleges nearby. Instead, they have multiple community colleges from which to choose.
Further Research
How Does the Location of College Reinforce Inequality?
Results from this article lead to at least three distinct areas for further research relating to the spatial inequality of postsecondary education. First, when discussing the reasons why students stay close to home, it is helpful to connect to literature on the spatial division of labor where opportunity structures are often vastly different for working-class and minority groups. Massey’s (2005) concept of “spatial division of labor” can be instructive here as it explains how working classes are socially and spatially segregated from middle and upper class. It is perhaps unsurprising that marginalized groups have fewer opportunities nearby, which in turn constrains their avenues for upward mobility. To the extent four-year colleges provide paths to upward mobility, communities without them will surely sustain their low educational attainment levels. This spatial division of labor is but one mechanism through which geography can shape educational destinations, which in turn reinforce existing social structures where lower socioeconomic groups have fewer pathways to upward mobility.
Soja (2010) refers to this phenomenon as spatial restructuring, where policymakers and planners sustain existing social conditions through the “competitive struggle to control the forces which shape material life” (p. 159). To illustrate this point, the campus of University of Texas-San Antonio mentioned previously could have been built near the fastest growing part of the city that is home to many Hispanic and working-class families. But as Briscoe and De Oliver (2006) document, the campus was built far away from the Hispanic and working-class community, which only reinforces the social division of labor and the restructuring of segregation. Further research can examine the intersections between the location of colleges and local racial/ethnic or class segregation because inequalities in where colleges are located are likely to map with inequalities in the social division of labor. This is especially important in light of the findings for Hispanic communities. The nation’s greatest population growth is among Hispanic families: The majority of children born today are Hispanic, and by 2043, the United States is projected to be a “majority-minority” country where Whites will no longer be the largest racial/ethnic group (U.S. Census Bureau, 2012). This growth is occurring across the country, in both rural and metropolitan areas (Tienda & Fuentes, 2014). Considering that Hispanic families tend to have close familial ties and students stay close to home for college (Desmond & Turley, 2009; Ovink & Kalogrides, 2015), it is important to know whether Hispanic communities have equal local opportunity structures and how to equalize those opportunities.
How Does the Supply of Colleges Affect Choice?
Second, further research should discuss colleges as part of a community’s “built environment,” which in turn shapes college choices. By thinking about where colleges are located and how they play a role in shaping local opportunity structures, we might gain a more nuanced understanding of why students decide where to attend college. Instead of focusing on demand-driven ways to change the behaviors of thousands of prospective students by providing informational interventions and financial aid, the built environment perspective focuses on the supply of where colleges are located and their capacity to serve their local communities. College choice literature has discussed the importance of distance and location between a student’s home and college, but probing further into this relationship will help us develop more comprehensive understanding of the environment in which choices are made (Perna, 2006). Not all environments are equal, suggesting there needs to be several college choice models for different built environments.
By focusing on where colleges are located and how their location bears on choice, it is likely that we can reveal inequalities in the built environment that can be corrected through policy interventions. For example, if federal higher education policy designated communities as “education deserts” like they currently do with “food deserts,” then this would be an important first step for reversing the geographic inequalities found in this study. After locating these deserts, federal policies could target financial resources, provide technical assistance, or develop new programs and interventions to help equalize opportunities for communities that currently have the fewest colleges nearby. Without such an effort, policy interventions will continue to encourage students to “shop around” for college even when there are no viable alternatives nearby, which in turn will only reinforce existing inequalities.
Skeptics of this approach may argue that not all communities need four-year institutions nearby because two-year colleges serve as a transfer point. In the case of Hispanic communities, for example, one might argue that the presence of more two-year colleges is sufficient for expanding opportunities since students can transfer from here to four-year colleges. But having many two-year colleges nearby could actually increase inequality since researchers regularly find penalties for starting at community colleges, like losing credits that may slow down time to degree (Monaghan & Attewell, 2015); chances of earning a degree drop (B. T. Long & Kurlaender, 2009); and students actually accumulate more loan debt because of the additional time and expenses incurred in the process (Canché, 2014). When working-class communities and communities of color only have community colleges nearby, then this reinforces their social position and places a ceiling on upward mobility. This again illustrates Massey’s (2005) spatial division of labor where communities with high concentrations of unemployment and social exclusion are the same that have unequal opportunities for upward mobility.
Even when communities have broad-access four-year institutions nearby, these colleges often have far fewer resources for serving students, which in turn affects students’ likelihood of degree completion (Bound et al., 2012). Broad-access colleges located in education deserts likely have resource and capacity constraints that make it difficult to meet the variety of educational needs of the area. Again, these unequal resources can reinforce social stratification rather than reversing them. Therefore, state and federal policymakers interested in reversing educational inequality might look at building the capacity of broad-access institutions as a way to promote upward mobility and equalize opportunities for underserved communities.
If capacity building is not a politically viable policy solution, some policymakers may argue that distance education is a more cost-effective way to serve geographically isolated students. However, less than 1 in 10 students (6.5%) enroll exclusively online, and there is limited evidence that distance education delivers equal or greater quality over place-based learning (Jaggars, Edgecombe, & Stacey, 2013). In fact, the most rigorous research on the effects of distance learning show negative effects for minority students (Xu & Jaggars, 2013, 2014) and for students who commute or work while enrolled (Joyce, Crockett, Jaeger, Altindag, & O’Connell, 2014). There is good reason to be skeptical that online education can solve the structural problems found in this article. While online learning may be a helpful tool in delivering content, it should not be viewed as a panacea for the structural inequalities that remain in our current postsecondary system.
What Are Alternative Ways to Examine “Place”?
Third, this study clusters counties together into commuting zones in order to measure the local area where a prospective student is likely to enroll in college. However, there could very well be pockets within counties or cities that are underserved or that have no college options nearby. This study did not examine that granular of geographic detail, but further research could extend this analysis by focusing on alternative ways to define place. For example, further research could utilize comparative case studies to assess whether the broad patterns found in this article are consistent in different geographical contexts. Doing so would offer an even more nuanced and fuller explanation of how place matters and the mechanisms that affect opportunity.
By redefining place, researchers could identify the specific mechanisms that mediate or moderate inequalities discussed in this article. One could extend this work by focusing on how travel time, accessibility of public transportation, broadband access, or even transportation costs interact with college choices. Similarly, one could see how the mix of colleges nearby shapes students’ choices. For example, if a community has several two-year but no four-year institutions nearby, then how does this mix affect individuals’ choices? One cannot answer this by looking at the count of colleges per commuting zone; it can only be answered by examining how individuals interact with their local opportunity structures. In so doing, we might find there are several new models of college choice depending on how one defines place. By focusing on these areas and extending many of the concepts discussed in this article, researchers can uncover new explanations and solutions for inequality in postsecondary education.
Further research is needed to understand the full extent to which geography and place shape educational opportunities. Nevertheless, this study’s main conclusion is straightforward yet too often overlooked in policy and research: Environments shape educational opportunities. Simply put, place matters, and any policy solution that ignores spatial inequality will do little to reverse it. Similarly, college choice theories that ignore the centrality of place will fail to develop a full understanding of how and why students who search locally for college make college choices. Moving forward, research on the geography of college opportunity will help scholars and policymakers gain a more nuanced and complete understanding of the causes and consequences of educational inequality.
Footnotes
Notes
N