
Abstract
Given concerns with the performance and attrition of novice teachers, North Carolina allocated $7.7 million from Race to the Top to create the New Teacher Support Program (NTSP), an induction model developed and implemented by the state’s public university system and targeted at low-performing schools. In this study, we assess the associations between participation in the university-based program and the performance and retention of novice teachers. Overall, NTSP teachers were more likely to return to the same school. Outcomes varied by NTSP region, cohort, and dosage, with positive performance and retention results for teachers in the region and cohort with the most intensive participation and teachers receiving more coaching. These findings contribute to efforts to develop and retain teachers.
Keywords
Introduction
In many states, one persistent challenge in K–12 education is the “greening” of the teacher workforce and concerns about the performance and retention of novice teachers (Alliance for Excellent Education, 2014; Ingersoll & Merrill, 2012; Papay & Kraft, 2015). Although evidence suggests that induction/mentoring programs can benefit these teachers (Ingersoll & Strong, 2011; Smith & Ingersoll, 2004), states and districts still need to find and scale approaches to better develop and retain their beginning teachers, particularly in the low-performing schools where novice teachers are concentrated (Clotfelter, Ladd, & Vigdor, 2005; Lankford, Loeb, & Wyckoff, 2002). Toward this end, North Carolina used $7.7 million of its Race to the Top (RttT) funds to create and implement the New Teacher Support Program (NTSP), an induction model aimed at helping novice teachers in the state’s lowest-performing schools acquire the knowledge and skills necessary to raise the quality of their instruction, increase student achievement, and persist in teaching in their lowest-performing schools.
Unlike many beginning teacher induction programs that are run by districts, schools, or outside agencies, the NTSP was developed by faculty from Colleges of Education at University of North Carolina (UNC) system institutions and is run by the UNC General Administration (UNCGA) and four UNC system institutions. Faculty and staff from these Colleges of Education deliver the program’s three-part induction model to participating teachers: (a) face-to-face and virtual instructional coaching, (b) six professional development sessions, and (c) institutes (multiday training sessions) held prior to and early in the school year. Although the NTSP is implemented by four UNC system institutions, the program serves all novice teachers in participating schools (rather than only supporting teachers prepared by these institutions). Altogether, the NTSP served 377 novice teachers in 59 lowest-performing schools in 2012–2013 and 846 novice teachers working in 91 lowest-performing schools in 2013–2014.
To aid beginning teacher practice and retention, we need to know whether a university-based induction model can improve the outcomes of novice teachers. This is particularly true for low-performing schools given the concentration of novice teachers in these environments (Lankford et al., 2002) and concerns that these schools may lack the fiscal and human resources to provide high-quality induction supports. University-based induction models may entail key advantages that benefit the performance and retention of participating teachers. These include knowledge of beginning teacher strengths and challenges, connections to local schools/districts, access to research-based resources, and an ability to provide mentors who are independent from K–12 schools (Colbert & Wolff, 1992; Desimone et al., 2014; Feiman-Nemser, Carver, Schwille, & Yusko, 2000; Stanulis & Floden, 2009). Universities are often the last touch point before entering the profession, and as such, helping teachers develop and succeed in their early-career period is a natural extension of teacher education programs’ mission. Conversely, given concerns about the quality and rigor of some teacher education programs and limitations to university-based induction programs’ scope of influence—these programs may be unable to directly impact school culture, offer certain induction components, or mandate participation—university-based induction models may struggle to effectively support novice teachers (Boyd, Goldhaber, Lankford, & Wyckoff, 2007; Labaree, 2004; National Council on Teacher Quality [NCTQ], 2014a, 2014b; Smith, 2007).
With policy mechanisms incentivizing teacher education programs to take a more active role in beginning teacher support—for example, Teacher Quality Partnership grants, strengthened teacher education accountability standards—we assess the potential of university-based novice teacher support programs by asking whether participation in the NTSP is associated with teachers’ performance and retention. Specifically, we examine whether teachers participating in a university-based, multicomponent induction program have significantly higher value-added estimates, evaluation ratings, and rates of retention than their peers in other low-performing schools. While answers to these questions entail the greatest policy relevance—overall, are NTSP teachers more effective and persistent—there is also a pressing need to understand under what circumstances a program works (Bryk, 2015). This is particularly salient for the NTSP given variation in program implementation across regions and cohorts and interest in determining whether specific components of the program were more beneficial. Therefore, we separately assess the value-added estimates, evaluation ratings, and retention of NTSP teachers in each of the four program regions, in each of the two program cohorts, and for teachers with varying levels of program participation.
Isolating the associations between NTSP participation and teacher outcomes is challenging since North Carolina’s RttT grant required the program to be implemented in the state’s lowest-performing schools, which were concurrently receiving other RttT services. We address this confounding by comparing outcomes for NTSP teachers with those of two comparison groups of novice teachers working in other low-performing schools. Each of these comparison groups has limitations, but together, they help identify the associations between NTSP participation and teacher outcomes. Overall, there are no differences in teacher performance—value-added estimates or teacher evaluation ratings—between NTSP and comparison sample teachers; however, NTSP teachers were significantly more likely to return to the same low-performing school. Teacher outcomes vary by NTSP region and cohort, with some positive results for NTSP teachers in the region with the most intensive instructional coaching and in the cohort with higher levels of program participation. Dosage models suggest that additional NTSP instructional coaching visits are positively associated with teacher value-added and retention.
In the remaining sections, we first discuss pertinent literature around new teacher induction, present potential advantages and concerns with a university-based induction model, and describe the NTSP structure and components. Next, we detail our analytical sample, outcome measures, covariates, and analysis plan. Lastly, we present NTSP results—overall, by region and cohort, and by dosage—and discuss the contributions of this work to policy/practice and the beginning teacher induction literature.
Background
Outcomes for Beginning Teacher Induction Programs
Twenty-five years ago, the modal category of experience in the U.S. teacher workforce was 15 years. Today, the modal experience category is 1 year, and over one-quarter of the teacher workforce has less than 5 years of experience (Ingersoll & Merrill, 2012). This greening of the teacher workforce raises concerns given the relatively lower performance and retention outcomes for novice teachers (Clotfelter et al., 2007, 2010; Henry, Bastian, & Fortner, 2011; Ingersoll & Smith, 2004; Papay & Kraft, 2015) and the concentration of novice teachers in high-need schools (Bastian, Henry, & Thompson, 2013; Clotfelter et al., 2005; Lankford et al., 2002). Fortunately, research indicates that novice teachers have a tremendous capacity for on-the-job development, which policymakers may capitalize on to increase novice teacher effectiveness and retention (Henry et al., 2011; Papay & Kraft, 2015).
Comprehensive teacher induction programs are one approach to take advantage of this ability for teacher improvement. Previous studies have found positive relationships between induction programs and teacher retention (DeAngelis, Wall, & Che, 2013; Kelly, 2004; Smith & Ingersoll, 2004), the quality of teaching practices (Evertson & Smithey, 2000; Stanulis & Floden, 2009), and student achievement gains (Fletcher, Strong, & Villar, 2008; Rockoff, 2008). Furthermore, evidence suggests that strong induction programs and/or more intensive induction program participation can benefit teacher outcomes (DeAngelis et al., 2013; Fletcher et al., 2008; Fletcher & Strong, 2009; Kapadia, Coca, & Easton, 2007; Rockoff, 2008; Smith & Ingersoll, 2004). For example, Smith and Ingersoll (2004) show that having a mentor in the same subject area, combined with collaborative activities with other novice teachers, significantly lowers first-year teacher attrition rates. Rockoff (2008) finds that novice teachers spending more time with their mentors have higher student achievement gains in mathematics and reading than peers with fewer hours of mentoring. While induction programs do not always have measurable impacts (Glazerman et al., 2010), investing resources into novice teachers appears to be a promising way to increase their performance and retention (Ingersoll & Strong, 2011).
Despite these findings, there are two gaps in the teacher induction literature that we aim to address. First, it is unknown whether certain induction providers (e.g., school districts, state agencies, outside nonprofits) are more effective than others. Most relevant to the present study, there are several potential advantages for university-based induction programs, yet only a few studies have investigated the relationships between university-based induction programs and teacher outcomes. These studies returned promising findings but were small in scale, did not always include a comparison group, and did not examine impacts on student achievement (Colbert & Wolff, 1992; Davis & Higdon, 2008; Kelly, 2004; Schaffer, Stringfield, & Wolfe, 1992; Stanulis & Floden, 2009). Second, despite the critical need for high-quality beginning teacher supports in low-performing schools, we do not know outcomes for programs targeted to such environments or whether there are specific aspects of induction that may work best in these environments. The present study addresses many of these concerns by focusing on a university-based induction program for lowest-performing schools, including a large study sample, and analyzing three policy-relevant teacher outcomes (value-added, evaluation ratings, and retention).
University-Based Induction Programs: Potential Advantages and Disadvantages
Examining the performance and retention outcomes for teachers participating in university-based induction programs is particularly important because such programs may entail several advantages over other induction providers. First, given the natural connections between universities and beginning teachers, university-based induction programs may have a greater understanding of the strengths and weaknesses of beginning teachers and be able to provide more targeted supports. While this is particularly true for university-based induction programs that support their program graduates, this can also be true of programs, like the NTSP, that support teachers with all forms of preparation. Related to this, induction programs from university settings may be better able to direct research-based strategies and resources to beginning teachers (Stanulis & Floden, 2009). This may be particularly true for the NTSP given that it is supporting lowest-performing schools that may lack the fiscal and human resources for high-quality induction. 1 Second, university-based teacher education programs are often very familiar and have partnerships with the districts and schools in their surrounding area. These partnerships—frequently borne out of student teaching and field placements—mean that university-based induction programs know the context of these schools and can offer supports to help teachers succeed and persist in their school environments (Colbert & Wolff, 1992; Smith, 2007). Furthermore, these connections between universities and districts/schools allow for a reciprocal relationship—that best practices from the field can come back to improve teacher education and university-based induction (Zeichner, 2010). Finally, university-based induction programs can provide mentors who are independent from K–12 schools and districts. This independence may help beginning teachers and mentors develop stronger relationships since the role of mentors is not to evaluate or assess but rather to support and improve the practices of beginning teachers (Desimone et al., 2014; Feiman-Nemser et al., 2000).
Despite these potential advantages, there are also two potential concerns with university-based induction programs. First, recent research questions the quality and rigor of teacher education programs (Brouwer & Korthagen, 2005; Labaree, 2004; NCTQ, 2014a, 2014b) and the performance of program graduates (Boyd et al., 2007). Here, the concern is straightforward: If teacher education programs are not doing a good job of preparing teachers, will they do a good job in providing early-career supports? Second, because university-based induction programs are not embedded in districts/schools, there are limitations to their scope of influence. Specifically, university-based induction programs cannot directly impact school culture or offer certain induction components (e.g., reduced teaching loads for first-year teachers or time to observe master teachers), and it may be challenging for them to interact with novice teachers on a daily/frequent basis (Smith, 2007). Additionally, university-based induction programs cannot mandate teacher participation in induction components—this is important since research suggests that more intensive program participation benefits teacher outcomes (Fletcher et al., 2008; Ingersoll & Strong, 2011; Rockoff, 2008).
Description of the New Teacher Support Program
As part of North Carolina’s $400 million RttT grant, faculty from UNC system Colleges of Education designed and implemented the NTSP with the following components: (a) in-person and virtual instructional coaching throughout the school year, (b) ongoing professional development sessions (six in each academic year), and (c) multiday, off-site institutes held prior to and early in the school year. These induction supports were designed to increase teacher knowledge of and competency in the Common Core State Standards, academic goal setting, backwards planning, assessment, classroom management, successful instructional strategies, reflection/data-driven decision making, and integrating into the school community. Importantly, the NTSP did not supplant existing school-based induction services or RttT programs; rather, it layered on the status quo of teacher supports in participating schools.
Unlike some other university-based induction programs that only serve graduates of their respective institutions, the NTSP provided induction supports to first-, second-, and third-year teachers, regardless of their preparation, working in the state’s lowest-performing schools—as identified by the North Carolina Department of Public Instruction (NCDPI) for the state’s RttT grant (RttT-eligible schools). 2 Participation in the NTSP was not mandatory, and not all of these lowest-performing schools opted to participate. While there are concerns about this selection bias, this offers a suitable comparison group that we discuss in the analytical sample section.
Given both the geographic concentrations of these lowest-performing schools and the capacity of UNC system institutions to run the NTSP, administrators at the UNCGA selected four UNC system institutions as regional anchor sites to implement the program—East Carolina University (ECU), the UNC Center for School Leadership Development (UNC-CSLD), UNC Charlotte (UNCC), and UNC Greensboro (UNCG). These institutions include the largest teacher preparation program in North Carolina (ECU), two large institutions located in urban centers (UNCC and UNCG), and an extension of the UNCGA that administers other statewide K–12 education programs for teachers and school leaders (UNC-CSLD). Program administrators and College of Education faculty planned the NTSP during the 2010–2011 and 2011–2012 school years, piloted elements of the program in the latter half of the 2011–2012 school year (for 35 teachers), and then fully implemented the program in 2012–2013 and 2013–2014. With this rollout, we focus on outcomes for participating teachers in the 2012–2013 and 2013–2014 school years.
For the K–12 schools/teachers in their respective geographic regions, these four anchor sites provided face-to-face and virtual instructional coaching and organized six professional development sessions in each academic year. To carry out these responsibilities, the institutions recruited, hired, and trained practicing and retired master teachers to serve as full-time NTSP instructional coaches. This full-time status may be important given positive outcomes for beginning teachers supported by full-time rather than part-time mentors (Fletcher & Strong, 2009). These coaches were assigned to novice teachers in participating NTSP schools and tasked with modeling effective teaching strategies, providing resources, assisting with student behavioral issues, engaging in lesson and unit planning, analyzing student achievement data, promoting teachers’ self-efficacy, and encouraging teacher reflection. In addition, these instructional coaches, in collaboration with faculty at each regional institution, organized and implemented the NTSP professional development sessions. Lastly, program administrators at a central NTSP office, in conjunction with the instructional coaches and faculty at the regional anchor sites, planned and implemented the NTSP institutes. 3 Together, this organizational structure was intended to provide a common framework for teacher supports while allowing regions to differentiate services based on the needs of their teachers.
The empirical warrant for these program components provides a foundation for a thoughtfully planned and executed induction model. The evidence base for the inclusion of instructional coaching is clear: A range of studies show positive relationships between mentoring and beginning teacher outcomes (Fletcher & Strong, 2009; Rockoff, 2008; Smith & Ingersoll, 2004; Stanulis & Floden, 2009). Regarding professional development, research indicates that sporadic and disconnected workshops often fail to lead to changes in teachers’ beliefs, practices, and effectiveness (Wei, Darling-Hammond, Andree, Richardson, & Orphanos, 2009; Yoon, Duncan, Lee, Scarloss, & Shapley, 2007). However, high-quality professional development, characterized by its duration, coherence, active-learning opportunities, collective participation, and expert facilitation, is associated with positive teacher outcomes (Garet, Porter, Desimone, Birman, & Yoon, 2001; Penuel, Fishman, Yamaguchi, & Gallagher, 2007). The structure of the NTSP institutes and professional development—ongoing professional learning that is led by instructional coaches and faculty, connected to program coaching, and differentiated according to group needs—meets many of these guidelines.
Overall, the components of the NTSP are not new—many induction programs offer mentoring and professional development. Rather, the NTSP stands out for four reasons. First, it was designed and implemented by faculty and staff at university-based teacher education programs and full-time instructional coaches hired by those programs. Thus, the potential advantages of university-based induction may be infused into these common induction components. Second, the NTSP serves all novice teachers regardless of their preparation. This may allow the NTSP to have a broader impact than university-based models targeted at program graduates. Third, the NTSP targets induction supports to low-performing schools. This provides fiscal and human resources to schools in need and tests whether university-based induction can succeed with teachers working in more challenging environments. Finally, the NTSP is part of a statewide university system—rather than a single university or group of universities working collectively. Although the initial implementation of the NTSP was orchestrated through four universities, the structure of the UNC system—with 15 institutions across North Carolina—enhances the capacity of the NTSP to provide a cohesive yet differentiated program and to scale up and provide induction services to novice teachers across all regions of the state.
Data and Sample
Analytical Sample
Under the requirements of North Carolina’s RttT grant, the UNC system made the NTSP available to the 108 lowest-performing schools in the state—schools identified as the lowest 5% of all schools in terms of student achievement in the 2008–2009 school year and/or high schools with graduation rates below 60% in the 2008–2009 school year. 4 This focal cohort of schools remained static throughout the RttT grant—schools above the lowest 5% or graduation rate threshold were not eligible for RttT resources in later years. In 2012–2013, the first full year of program implementation, the NTSP analytical sample includes all of the first- and second-year teachers who worked in schools that were eligible for RttT services and agreed to participate in the program. For the 2013–2014 school year, the NTSP expanded in size by providing induction supports to (a) a second cohort of teachers, (b) third-year teachers in both cohorts, and (c) an additional set of lowest-performing schools that had chosen not to participate in the NTSP during the 2012–2013 school year. The NTSP also continued to provide services to the novice teachers from the first year of the program. Therefore, our 2013–2014 NTSP analytical sample includes all of the first-, second-, and third-year teachers who worked in schools that were eligible for and participated in the NTSP. This NTSP analytical sample excludes schools and/or teachers who began receiving NTSP supports in the second half (after December) of each school year since we contend that NTSP results should be based on a sample of teachers who received program supports for a majority of the school year. Of the 108 eligible lowest-performing schools, 59 participated in the NTSP for the full 2012–2013 school year, 5 and 91 participated for the full 2013–2014 school year. Overall, our 2012–2013 NTSP analytical sample includes 377 teachers working in 59 lowest-performing schools and 16 school districts; in 2013–2014, the NTSP sample includes 846 teachers working in 91 lowest-performing schools and 25 school districts.
Isolating the relationships between NTSP participation and teacher outcomes is challenging since North Carolina implemented the program in the state’s lowest-performing schools that were also receiving other RttT supports. Most notable among these was the District and School Transformation (DST) initiative, which provided regular professional development and coaching designed to turn around the achievement of the state’s lowest-performing schools. To address this confounding, we created two different comparison groups.
For our primary comparison group, we identified lowest-performing schools that were eligible for but did not participate in the NTSP. In the 2012–2013 school year, this group, labeled NTSP-eligible comparison, consists of all the first- and second-year teachers working in these schools; in the 2013–2014 school year, this group consists of all the first-, second-, and third-year teachers working in these schools. To examine the comparability of samples just prior to NTSP rollout, Appendix Table A1 (available online) shows that in the 2011–2012 year, schools that would go on to participate in the NTSP had higher percentages of minority students, higher short-term suspension rates, and lower performance composites (percentage of state assessments passed) than schools that would be in the NTSP-eligible comparison sample. Overall, the 2012–2013 NTSP-eligible comparison sample consists of 205 teachers working in 32 lowest-performing schools and 18 school districts; in 2013–2014, the NTSP-eligible comparison sample includes 176 teachers working in 17 lowest-performing schools and 12 school districts.
For a secondary comparison group, we used data from 2011–2012—the school year immediately preceding the NTSP rollout—to identify schools in the bottom decile of performance that were not eligible for RttT services. 6 We focused on this more recent data (2011–2012) rather than the 2008–2009 data the state used to identify RttT-eligible schools because (a) schools participating in the NTSP were still very low-performing in 2011–2012 and (b) we wanted to identify a set of comparison schools that were low-performing in a period more proximal to the time the NTSP was being implemented. Appendix Table A1 shows that in 2011–2012, schools that would go on to participate in the NTSP had higher percentages of economically disadvantaged and minority students, lower performance composites, and greater concentrations of novice teachers than schools in this second comparison sample. In the 2012–2013 school year, this comparison group, labeled non-RttT comparison, consists of all the first- and second-year teachers working in these schools; in the 2013–2014 school year, this comparison group consists of all the first-, second-, and third-year teachers working in these schools. Overall, the 2012–2013 non-RttT comparison sample includes 1,144 teachers working in 148 low-performing schools and 48 school districts; in 2013–2014, the non-RttT comparison sample includes 1,635 teachers working in 149 low-performing schools and 48 schools districts. As with the NTSP analytical sample, we exclude comparison sample teachers—from both the NTSP-eligible and non-RttT samples—who began working in the second-half of the school year (after December).
Like the NTSP analytical sample, both of these comparison groups consist of novice teachers working in low/lowest-performing schools. 7 We prefer the NTSP-eligible sample since it allows for direct comparisons between NTSP teachers and other novice teachers receiving RttT supports. Essentially, we can better isolate the associations between NTSP participation and teacher outcomes with the NTSP-eligible sample. However, there are two concerns with the NTSP-eligible sample. First, it is unknown why these schools declined to participate in the NTSP and why some schools chose to enter the program in 2013–2014 (after not participating in 2012–2013). As such, these comparisons may not take in to account factors related to nonparticipation; differences in outcomes may be attributable to these unobserved school characteristics. 8 Second, the NTSP-eligible sample is small and provides less statistical power for detecting differences in outcomes. The non-RttT comparison group helps address this concern by providing a much larger sample for analyses. However, comparisons to this group do not allow us to isolate the impact of NTSP from other RttT programs—we compare NTSP teachers to their peers in other low-performing schools receiving business-as-usual supports—and therefore, positive results for NTSP versus non-RttT comparison sample teachers may be due to other RttT services that NTSP teachers receive. In the results section, we primarily focus on the differences in performance and persistence between NTSP and NTSP-eligible teachers. To the extent that the nonparticipation of the NTSP-eligible sample is due to factors positively (negatively) associated with novice teacher outcomes, these estimates may be a lower (upper) boundary of NTSP influence.
Table 1 displays select individual and school characteristics for the NTSP treatment sample and the NTSP-eligible and non-RttT comparison samples during our study years. Across both 2012–2013 and 2013–2014, the teacher characteristics panel shows that a significantly higher percentage of NTSP teachers are in their first year of teaching and entered the profession alternatively. 9 Additionally, a significantly higher percentage of NTSP teachers are a racial or ethnic minority. The school characteristics panel indicates that schools served by NTSP have significantly higher concentrations of economically disadvantaged and racial/ethnic minority students, higher short-term suspension rates, lower performance composites, and higher concentrations of novice teachers (in 2012–2013). Essentially, despite efforts to identify similar schools—schools designated as lowest-performing (NTSP-eligible) and schools in the bottom decile of performance in the year prior to NTSP rollout (non-RttT)—Table 1 shows the challenge in constructing comparison groups that are fully comparable to the lowest-performing schools served by the NTSP. For the purpose of assessing outcomes for NTSP teachers, however, we contend that the direction of these teacher- and school-level differences may mask rather than inflate program results. That is, the NTSP sample has a greater prevalence of characteristics associated with negative teacher outcomes. As detailed in the following, we include teacher and school covariates in our teacher outcome analyses to address some of these concerns.
Characteristics of NTSP and Comparison Sample Teachers and Schools
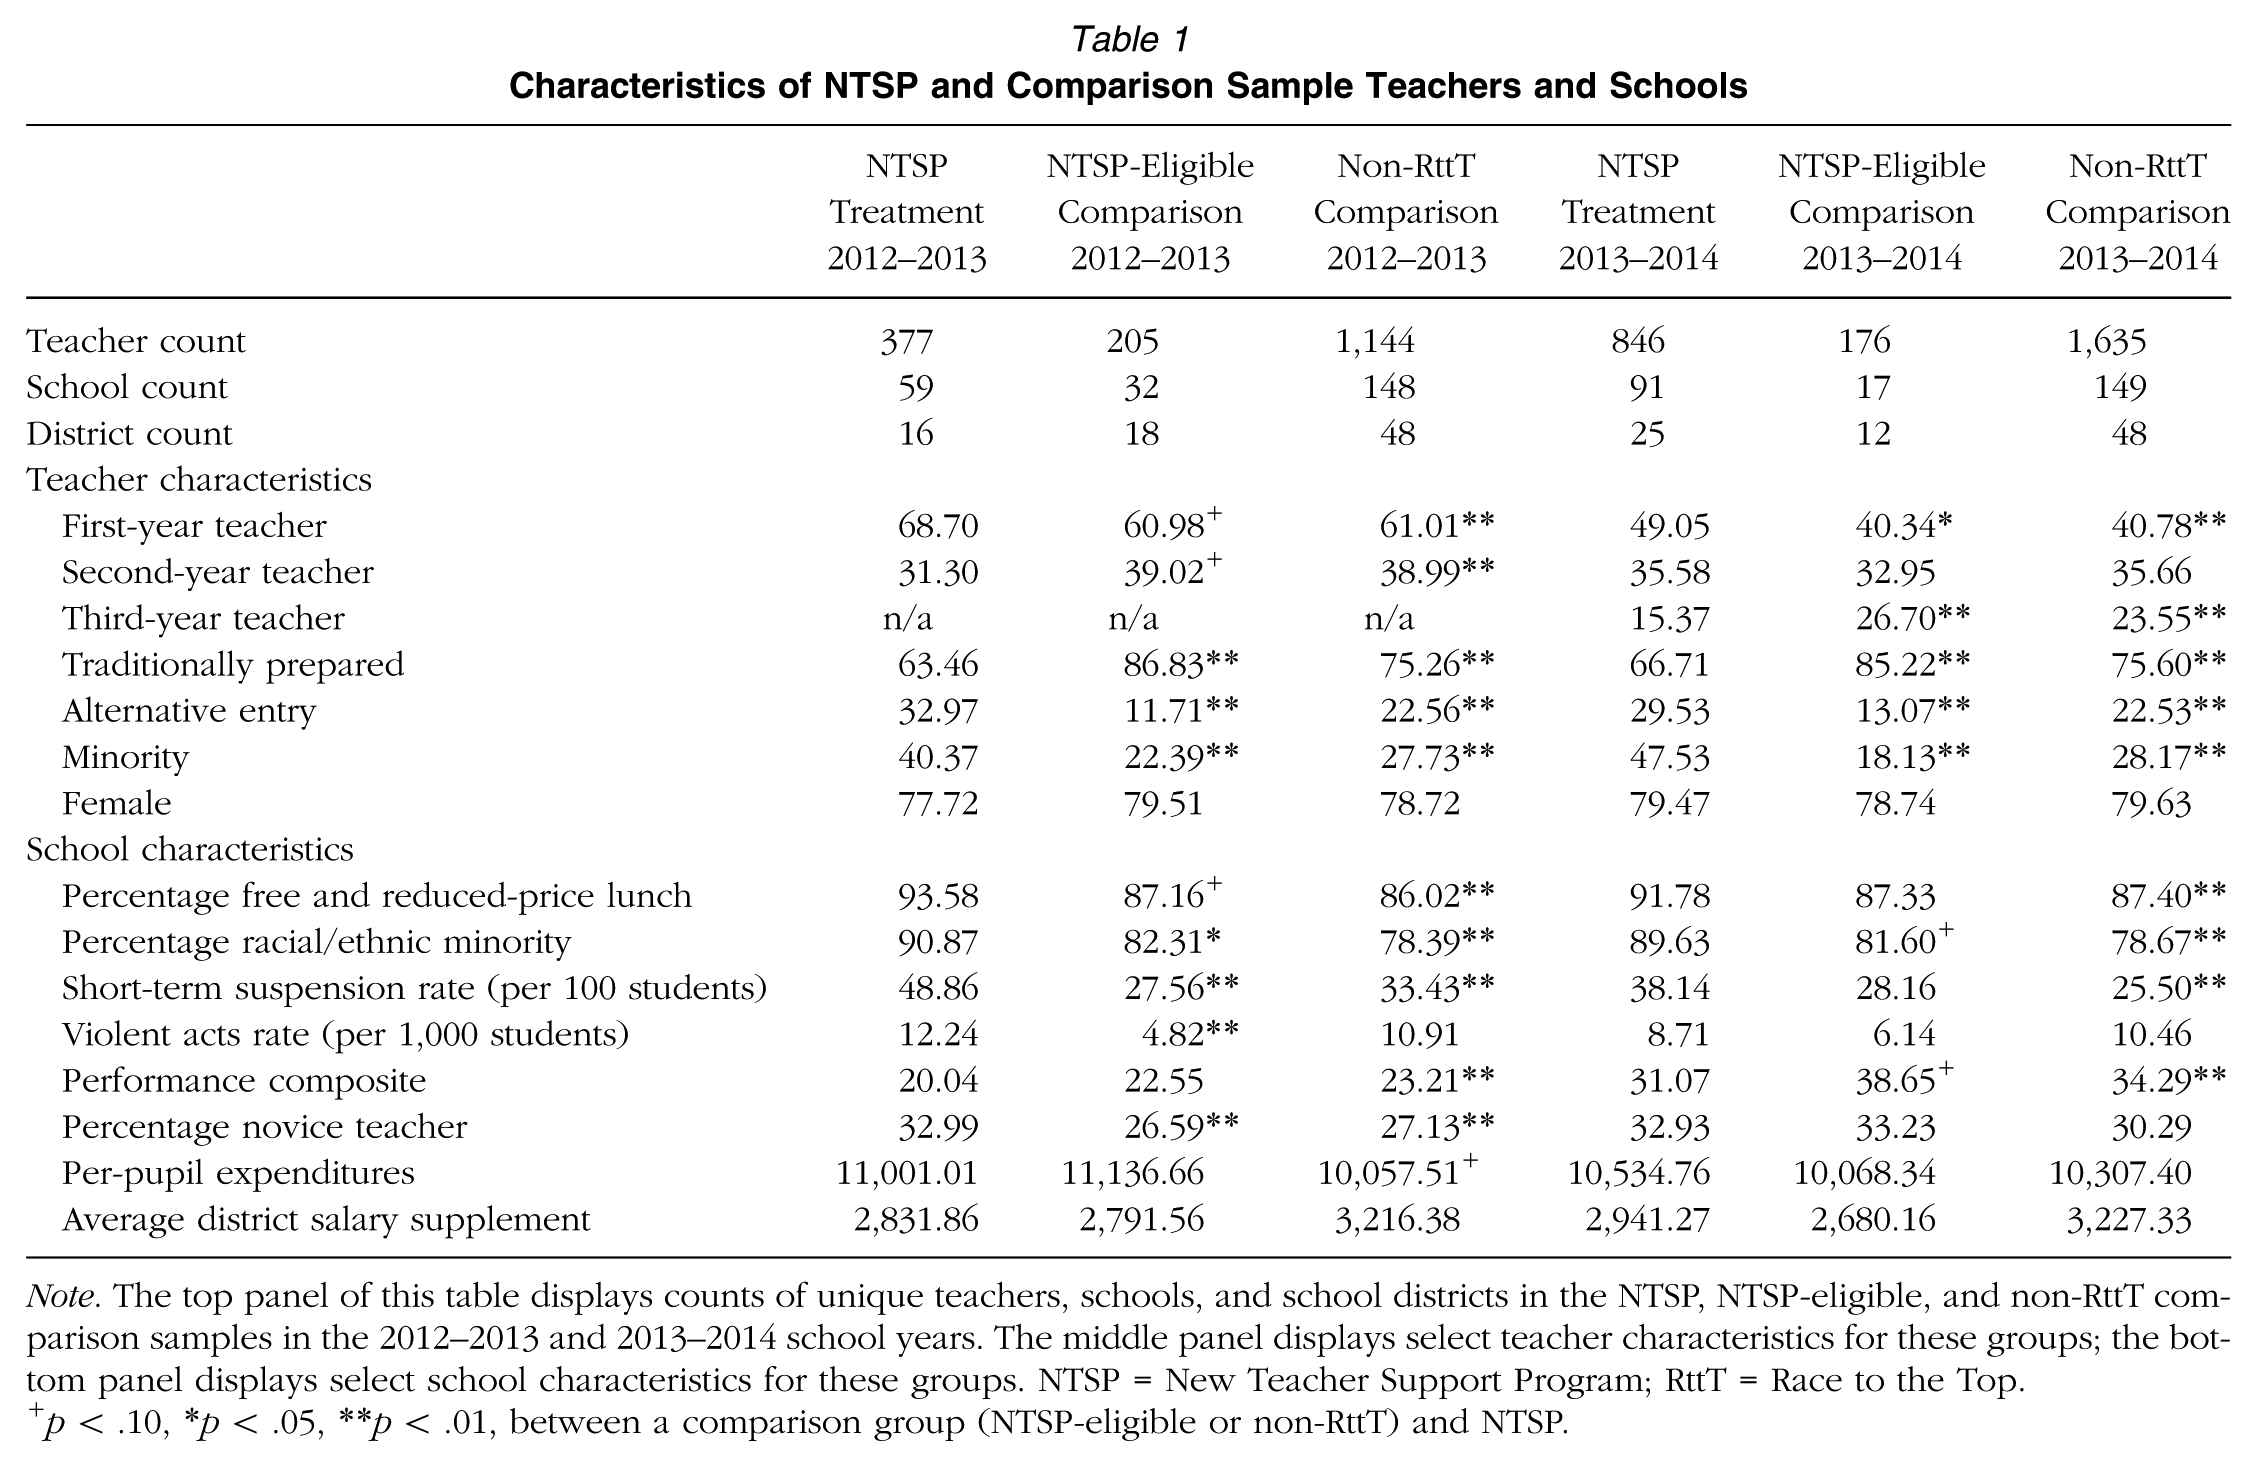
Note. The top panel of this table displays counts of unique teachers, schools, and school districts in the NTSP, NTSP-eligible, and non-RttT comparison samples in the 2012–2013 and 2013–2014 school years. The middle panel displays select teacher characteristics for these groups; the bottom panel displays select school characteristics for these groups. NTSP = New Teacher Support Program; RttT = Race to the Top.
p < .10, *p < .05, **p < .01, between a comparison group (NTSP-eligible or non-RttT) and NTSP.
Outcome Measures
Teacher Value-Added
To assess whether the NTSP is associated with novice teacher value-added, we used teachers’ Education Value-Added Assessment System (EVAAS) scores estimated by the SAS Institute—the official measure of value-added used for teacher evaluation in North Carolina Public Schools (NCPS). 10 In NCPS, there are two types of EVAAS models: (a) the multivariate response model (MRM), a random effects model that estimates teacher value-added to student achievement on the state’s end-of-grade (Grades 3–8) (EOG) mathematics and reading exams, and (2) the univariate response model (URM), a hybrid random and fixed effects model that estimates teacher value-added to student achievement on the state’s end-of-course (EOC) exams (Algebra I, biology, and English II), fifth- and eighth-grade science exams, and all other secondary grades courses with common final exams (e.g., chemistry, U.S. history, Algebra II) (Wright, White, Sanders, & Rivers, 2010). The MRM accounts for the impact of past and future teachers on student achievement by adjusting for students clustering within teachers and students and their peers clustering within different teachers in different years. The URM accounts for the clustering of students within teachers and incorporates two years of students’ prior test scores but no other student, classroom, or school characteristics. In our analyses, we combined EVAAS estimates from elementary and middle grades to run models in mathematics and reading (Grades 4–8) and science (fifth and eighth grades). At the secondary grades level, we combined EVAAS estimates from EOC and final exams to estimate a single value-added model. In the Appendix (available online), we present results from EOC/final exam models for STEM (mathematics and science) and non-STEM (English and social studies/history) subjects separately. Because some of these EVAAS estimates are expressed in normal curve equivalency units while others are expressed in student scale score points, we standardized the EVAAS estimates (based on the statewide population of teachers) within test and year (e.g., fourth-grade mathematics, biology). This creates a common metric for interpreting value-added results—a percentage of a standard deviation in teacher effectiveness (effect size).
Teacher Evaluation Ratings
Given that value-added estimates are only available for teachers in tested grades and subject areas and do not identify performance on distinct teaching practices, a strength of this analysis is our focus on teacher evaluation ratings (Goldring et al., 2015). These ratings are available for more than 90% of NCPS teachers, while approximately 42% of these teachers have value-added estimates. In North Carolina, principals use classroom observations and other teaching artifacts to rate teachers as either not demonstrated, developing, proficient, accomplished, or distinguished on five professional teaching standards: (a) leadership, (b) classroom environment, (c) content knowledge, (d) facilitating student learning, and (e) reflecting on practice. Not demonstrated may refer to situations in which the teacher is performing below expectations and is not making adequate growth toward proficiency on the standard or when the principal is unable to observe or rate the indicators for the standard. With this lack of consistency in the meaning of not demonstrated and the limited use of the rating (<0.15% of our sample), we exclude cases from our analyses where a teacher was rated as not demonstrated. Therefore, for these analyses, the outcome variable is a 2–5 ordinal value (developing to distinguished).
Given concerns with the lack of variation in evaluation ratings (Toch & Rothman, 2008; Weisberg, Sexton, Mulhern, & Keeling, 2009), Appendix Table A2 (available online) displays the mean and distribution of evaluation ratings on the facilitating student learning standard for NTSP teachers, overall and by region, and for NTSP-eligible and non-RttT comparison sample teachers (other evaluation standards have comparable values). Across analysis groups, the mean/modal evaluation rating is proficient (Level 3), with approximately 7% to 13% of teachers rated below proficient and 13% to 19% rated above proficient. While acknowledging potential concerns with subjective ratings, these descriptive values, coupled with the benefits of evaluation ratings—larger sample, more distinct teaching practices, significant correlations with value-added (Henry & Guthrie, 2015)—help make evaluation ratings an important, policy-relevant outcome for NTSP teachers. Overall, results from these models indicate whether NTSP teachers have higher levels of instructional practice quality, as judged by school principals, than novice teachers in the NTSP-eligible and non-RttT comparison samples.
Teacher Retention
With the academic and financial costs of teacher attrition, a major goal of the NTSP is to retain early-career teachers in the profession, particularly in the lowest-performing schools and districts served by the program (Alliance for Excellent Education, 2014; Ronfeldt, Loeb, & Wyckoff, 2013). Therefore, using salary data provided by the NCDPI, we created two dichotomous variables for teacher retention. Our preferred coding tracks whether teachers return to the same (low-performing) school in the following year—1 indicates returning to the school and 0 indicates exiting. Since teachers can be reassigned within districts due to factors outside their control—for example, school consolidation/closure, district staffing needs—our second approach tracks whether teachers return to the same school district in the following year. 11
Covariates
To account for differences in school characteristics (as shown in Table 1) and better isolate the associations between NTSP participation and teacher outcomes, we include a set of current-year (2012–2013 or 2013–2014) school characteristics in our value-added, evaluation rating, and retention models. These include school size and school size squared, 12 total per-pupil expenditures, average teacher salary supplements, short-term suspension rates (per 100 students), violent acts rates (per 1,000 students), the percentage of free and reduced-price lunch students, and the percentage of racial and ethnic minority students. While most of these school covariates are outside the control of the NTSP, we acknowledge that program supports could influence the short-term suspension and violent acts rate variables. Therefore, as a specification check, we estimated value-added, evaluation rating, and retention models excluding these two measures of school orderliness. Results are qualitatively similar with and without these covariates. 13 Models also include teacher experience indicators and year fixed effects; we insert subject area indicators (e.g., biology, U.S. history, Algebra II) into value-added analyses in secondary grades.
Analyses
Comparisons
In the present study, we use two years of administrative data across two NTSP cohorts and four NTSP regional sites. While the NTSP administrators used a structured program model, there was variation in program implementation, across cohorts and regions, due to different needs/context in regions and the substantial scaling up of the program in 2013–2014 (see Appendix B, available online, for program participation details). To account for these differences, we estimate four sets of models.
First, in our overall models, we pool data from the 2012–2013 and 2013–2014 school years and compare outcomes for NTSP teachers versus those of NTSP-eligible and non-RttT comparison sample teachers. Specifically, in these overall models, we make NTSP teachers the reference category and test for significant performance and retention differences between NTSP and comparison sample teachers (NTSP-eligible and non-RttT). As a supplement to these analyses, we estimate two additional overall models to assess whether (a) alternative entry teachers in the NTSP have outcomes that differ from those in the comparison samples and (b) differential teacher attrition biases our overall results. We include these alternative entry analyses given research showing that alternative entry teachers are initially less effective but narrow effectiveness gaps over time (Boyd, Grossman, Lankford, Loeb, & Wyckoff, 2006). This suggests that alternative entry teachers may have more to gain from an induction program. Likewise, we estimate a set of value-added and evaluation rating analyses controlling for a teacher’s retention outcome (will or will not return to the school in the following year) since the attrition of more or less effective teachers may over- or understate the performance differences between NTSP and comparison sample teachers. Appendix Table A3 (available online) also displays descriptive data on exiting teachers in our NTSP, NTSP-eligible, and non-RttT samples.
Second, in our regional models, we pool data from 2012–2013 and 2013–2014 and compare outcomes for the subset of NTSP teachers within each regional site (ECU, UNC-CSLD, UNCC, and UNCG) to the full sample of NTSP-eligible and non-RttT comparison teachers. Specifically, in these regional models, we iteratively make teachers from the NTSP-eligible and non-RttT comparison samples the reference category and include indicators for NTSP teachers in each region (with an additional indicator for the comparison group that is not the reference category). In these models, we also include a set of regional indicator variables for both NTSP and comparison sample teachers (e.g., a “Charlotte” variable for NTSP and comparison sample teachers working in Charlotte-Mecklenburg schools and the surrounding area). These indicators help us better adjust for regional differences common to NTSP and comparison sample teachers—for example, in teacher labor markets, student population—that may influence teacher outcomes. As a specification check, we also estimate regional models that limit the analytical sample to NTSP and comparison sample teachers working in the same region (e.g., a model limited to NTSP and comparison sample teachers working in the ECU region only).
Third, in our cohort models, we compare outcomes for teachers who entered NTSP in 2012–2013 (Cohort 1) and 2013–2014 (Cohort 2) versus those of NTSP-eligible and non-RttT comparison sample teachers. Specifically, for the 2012–2013 school year, we make Cohort 1 NTSP teachers the reference category and test for significant performance and retention differences between NTSP and comparison sample teachers (NTSP-eligible and non-RttT). For the 2013–2014 school year, we iteratively make teachers from the NTSP-eligible and non-RttT comparison samples the reference category and include indicators for Cohort 1 and Cohort 2 NTSP teachers (with an additional indicator for the comparison group that is not the reference category).
Finally, in our dosage models, we limit the sample to NTSP teachers only and assess the associations between program participation and teacher performance and retention. Specifically, we enter each of our three dosage measures—attending a NTSP institute, the total number of NTSP professional development sessions attended (out of six), and the average number of NTSP instructional coach visits per month—into separate teacher performance and retention models.
Given the need to understand the conditions in which programs work and not just whether programs work, these regional, cohort, and dosage analyses may be particularly important (Bryk, 2015).
Value-Added Models
To assess whether NTSP teachers have higher value-added scores than their comparison sample peers, we specified an ordinary least squares regression model with teachers’ standardized EVAAS estimates as the outcome variable. These value-added models cluster standard errors at the school level and control for teacher experience, year fixed effects, and a set of school covariates. Controlling for model covariates, focal coefficients (from overall, regional, cohort, and dosage models) indicate whether participation in the NTSP is associated with teachers’ value-added estimates. The basic estimation equation is as follows:

where
Evaluation Rating Models
To examine teacher performance for a larger sample and for a broader set of teaching competencies, we estimate relationships between NTSP participation and teachers’ evaluation ratings on the five North Carolina Professional Teaching Standards directly assessed by school administrators. With a 2–5 outcome variable (developing to distinguished), we started with an ordered logit model to test the proportional odds assumption—that the relationship between each pair of outcome groups and model covariates was the same (Brant, 1990; O’Connell, 2006). For each of the five teaching standards, the overall likelihood ratio test strongly rejected the null hypothesis; however, a closer examination of the results showed that the proportional odds assumption was met by the focal NTSP variables and violated by the school covariates. With these results, we changed our analytic approach to an ordered logistic regression with partial proportional odds (Fullerton, 2009), where the focal NTSP coefficients are fixed across the evaluation rating outcomes and regression coefficients for the other model covariates are not constrained to be the same. Controlling for model covariates and clustering standard errors at the school level, focal coefficients (from overall, regional, cohort, and dosage models) indicate whether participation in the NTSP is associated with teachers’ evaluation ratings. The equation for the partial proportional odds evaluation rating models is as follows:

where for each teaching standard,
Teacher Retention Models
Given that novice teachers are more likely to exit the profession and that low-performing schools struggle to retain their teaching workforce, we assess the relationships between NTSP participation and teacher retention (Boyd, Lankford, Loeb, & Wyckoff, 2005; Hanushek, Kain, & Rivkin, 2004). For these analyses, we specify logistic regression models with controls for teacher experience and school covariates and standard errors clustered at the school level. Our preferred approach examines returning to the same school (low-performing) in the following year; additional analyses examine returning to the same school district. Controlling for model covariates, focal coefficients indicate whether participation in the NTSP is associated with the odds of returning to teach. The equation for teacher retention is as follows:

where
Results
Is NTSP Participation Associated With Teacher Performance and Retention?
Overall, the left and middle panels of Table 2 indicate that performance outcomes—value-added and evaluation ratings—for NTSP teachers are no different than those for teachers in the NTSP-eligible (our preferred reference category receiving other RttT treatments) and non-RttT (not receiving other RttT treatments) comparison samples. While the teacher value-added estimates are positive in elementary and middle grades, the coefficients are negative for secondary grades exams, particularly in comparison to the NTSP-eligible sample. In the top panel of Appendix Table A4 (available online), we show that NTSP teachers are significantly less effective than NTSP-eligible comparison sample teachers in non-STEM (English and social studies/history) secondary grades exams; there are no differences in teacher effectiveness in STEM subject areas. 14 The right panel of Table 2 shows that there are significant differences in retention between NTSP teachers and teachers in both comparison samples. Controlling for model covariates, NTSP teachers have a 72.43% predicted probability of returning to the same low-performing school in the following year. By comparison, the predicted probabilities for NTSP-eligible and non-RttT comparison sample teachers are 64.24% and 65.08%. To contextualize the magnitude of these retention differences, we note that (a) the unadjusted school retention rate in our sample was 66.89 and (b) if the comparison groups were the same size as the NTSP sample (1,206 teacher-year observations), NTSP schools would need to replace 332 novice teachers, NTSP-eligible schools would need to replace 431 novice teachers, and non-RttT schools would need to replace 421 novice teachers during our study period.
Overall Results for NTSP Teachers

Note. The left panel displays differences in adjusted-average Education Value-Added Assessment System (EVAAS) estimates (standardized) for NTSP teachers versus NTSP-eligible and non-RttT comparison sample teachers. Cells report coefficients with standard errors in parentheses. The middle panel displays odds ratios for earning higher evaluation ratings for NTSP teachers versus NTSP-eligible and non-RttT comparison sample teachers. Cells report p values in parentheses below odds ratios. The right panel displays odds ratios for returning to the same school in the following year for NTSP teachers versus NTSP-eligible and non-RttT comparison sample teachers. Cells report p values in parentheses below odds ratios. NTSP = New Teacher Support Program; EOC = end-of-course; RttT = Race to the Top.
p < .05. **p < .01.
As a supplement to these overall models, we performed two different specification checks. First, given the sizable proportion of alternative entry teachers in the NTSP sample (Table 1) and prior research indicating that alternative entry teachers may make more rapid on-the-job effectiveness gains (Boyd et al., 2006)—suggesting that they may benefit more from comprehensive induction—we assessed whether alternative entry teachers supported by the NTSP have outcomes that differ from those in the comparison samples. Here, interaction coefficients in Appendix Table A5 (available online) reveal no significant differences between alternative entry teachers in the NTSP and comparison samples. Second, to assess whether the attrition of more or less effective teachers may over- or understate the performance differences between NTSP and comparison sample teachers, we re-ran our value-added and evaluation rating models including an indicator for whether a teacher will return to the same school in the following year. These results, shown in Appendix Table A6 (available online), indicate that teachers who will return in the following school year have significantly higher value-added estimates and evaluation ratings than their peers who will leave. However, NTSP results in Table 2 are comparable to those in Appendix Table A6, suggesting that differential teacher attrition does not meaningfully influence our overall estimates. To complement these analyses, we also display teacher and school characteristics (in Appendix Table A3) for exiting teachers in the NTSP, NTSP-eligible, and non-RttT samples. In comparison to NTSP-eligible teachers, this table indicates that a lower percentage of first-year, third-year, alternative entry, and minority NTSP teachers exit their schools. Given the descriptive characteristics in Table 1, it is not surprising that NTSP teachers exit schools with slightly higher percentages of economically disadvantaged and minority students and slightly lower performance composites.
Do Results for NTSP Teachers Vary by Region and Cohort?
While the NTSP had a common framework for supporting teachers, differences in the four university anchor sites (ECU, UNC-CSLD, UNCC, and UNCG) and the schools/school districts they served led to variation in program participation across regions. Likewise, the dramatic scale-up of the program—more than doubling in size from 377 to 846 teachers—was associated with a decrease in program participation in the 2013–2014 school year. Appendix B depicts these regional and cohort participation differences. For example, Appendix Figures B1–B4 (available online) show that: (a) a higher percentage of NTSP teachers attended a program institute in 2012–2013 versus 2013–2014 and that across both years NTSP teachers in the ECU region had the highest institute attendance rates; (b) the average number of instructional coach visits per month was highest in the ECU region and that across regions there were fewer instructional coach visits in 2013–2014; 15 and (c) there was a steep decline in NTSP professional development attendance in 2013–2014, with few teachers in the UNCC and UNCG regions attending any program professional development. These participation differences across regions and cohorts motivate further analyses to determine whether NTSP teachers in the regions and cohort with more intensive program participation have better performance and retention outcomes. This is particularly important since the knowledge gained in understanding under what circumstances a program works may benefit the future performance of the program or similar programs.
Our primary regional analyses compare outcomes for the NTSP teachers within each regional site versus the full sample of NTSP-eligible and non-RttT comparison teachers. These models also include a set of regional indicator variables (for both NTSP and comparison sample teachers) to adjust for differences across regions—for example, in teacher labor markets, student populations—that may influence teacher performance and retention. For these analyses, Table 3 indicates that NTSP teachers in the ECU region have higher value-added estimates than NTSP-eligible comparison sample teachers in elementary and middle grades mathematics and reading; results versus non-RttT teachers are generally comparable to those versus NTSP-eligible teachers. To put the magnitude of these value-added results into perspective, we note that statewide, the average difference in standardized EVAAS estimates between first- and second-year teachers in elementary and middle grades mathematics is 33% of a standard deviation; in elementary and middle grades reading, the average difference is 17% of a standard deviation. Contrary to the positive results in elementary and middle grades, NTSP teachers in the ECU region, along with those in the UNC-CSLD region, have significantly lower value-added estimates than NTSP-eligible teachers for the state’s secondary grades EOC and final exams. Appendix Table A4 indicates that the negative ECU results are concentrated in STEM subject areas; negative results for UNC-CSLD teachers are concentrated in non-STEM subject areas. While our regional analyses reveal no significant differences in evaluation ratings (middle panel of Table 3), the right panel of Table 3 indicates that NTSP teachers in the ECU region have significantly higher within-school retention rates than NTSP-eligible and non-RttT comparison sample teachers. Controlling for model covariates, the predicted school retention probabilities are 77.96, 67.28, 72.04, and 71.70 for NTSP teachers in the ECU, UNC-CSLD, UNCC, and UNCG regions, respectively. Finally, when comparing within region only (e.g., comparing NTSP teachers in the ECU region to comparison sample teachers in the same geographical area), Appendix Table A7 (available online) shows that NTSP teachers in the ECU region maintain significantly higher value-added estimates in elementary and middle grades mathematics and reading and significantly higher within-school retention rates.
Regional Results for NTSP Teachers
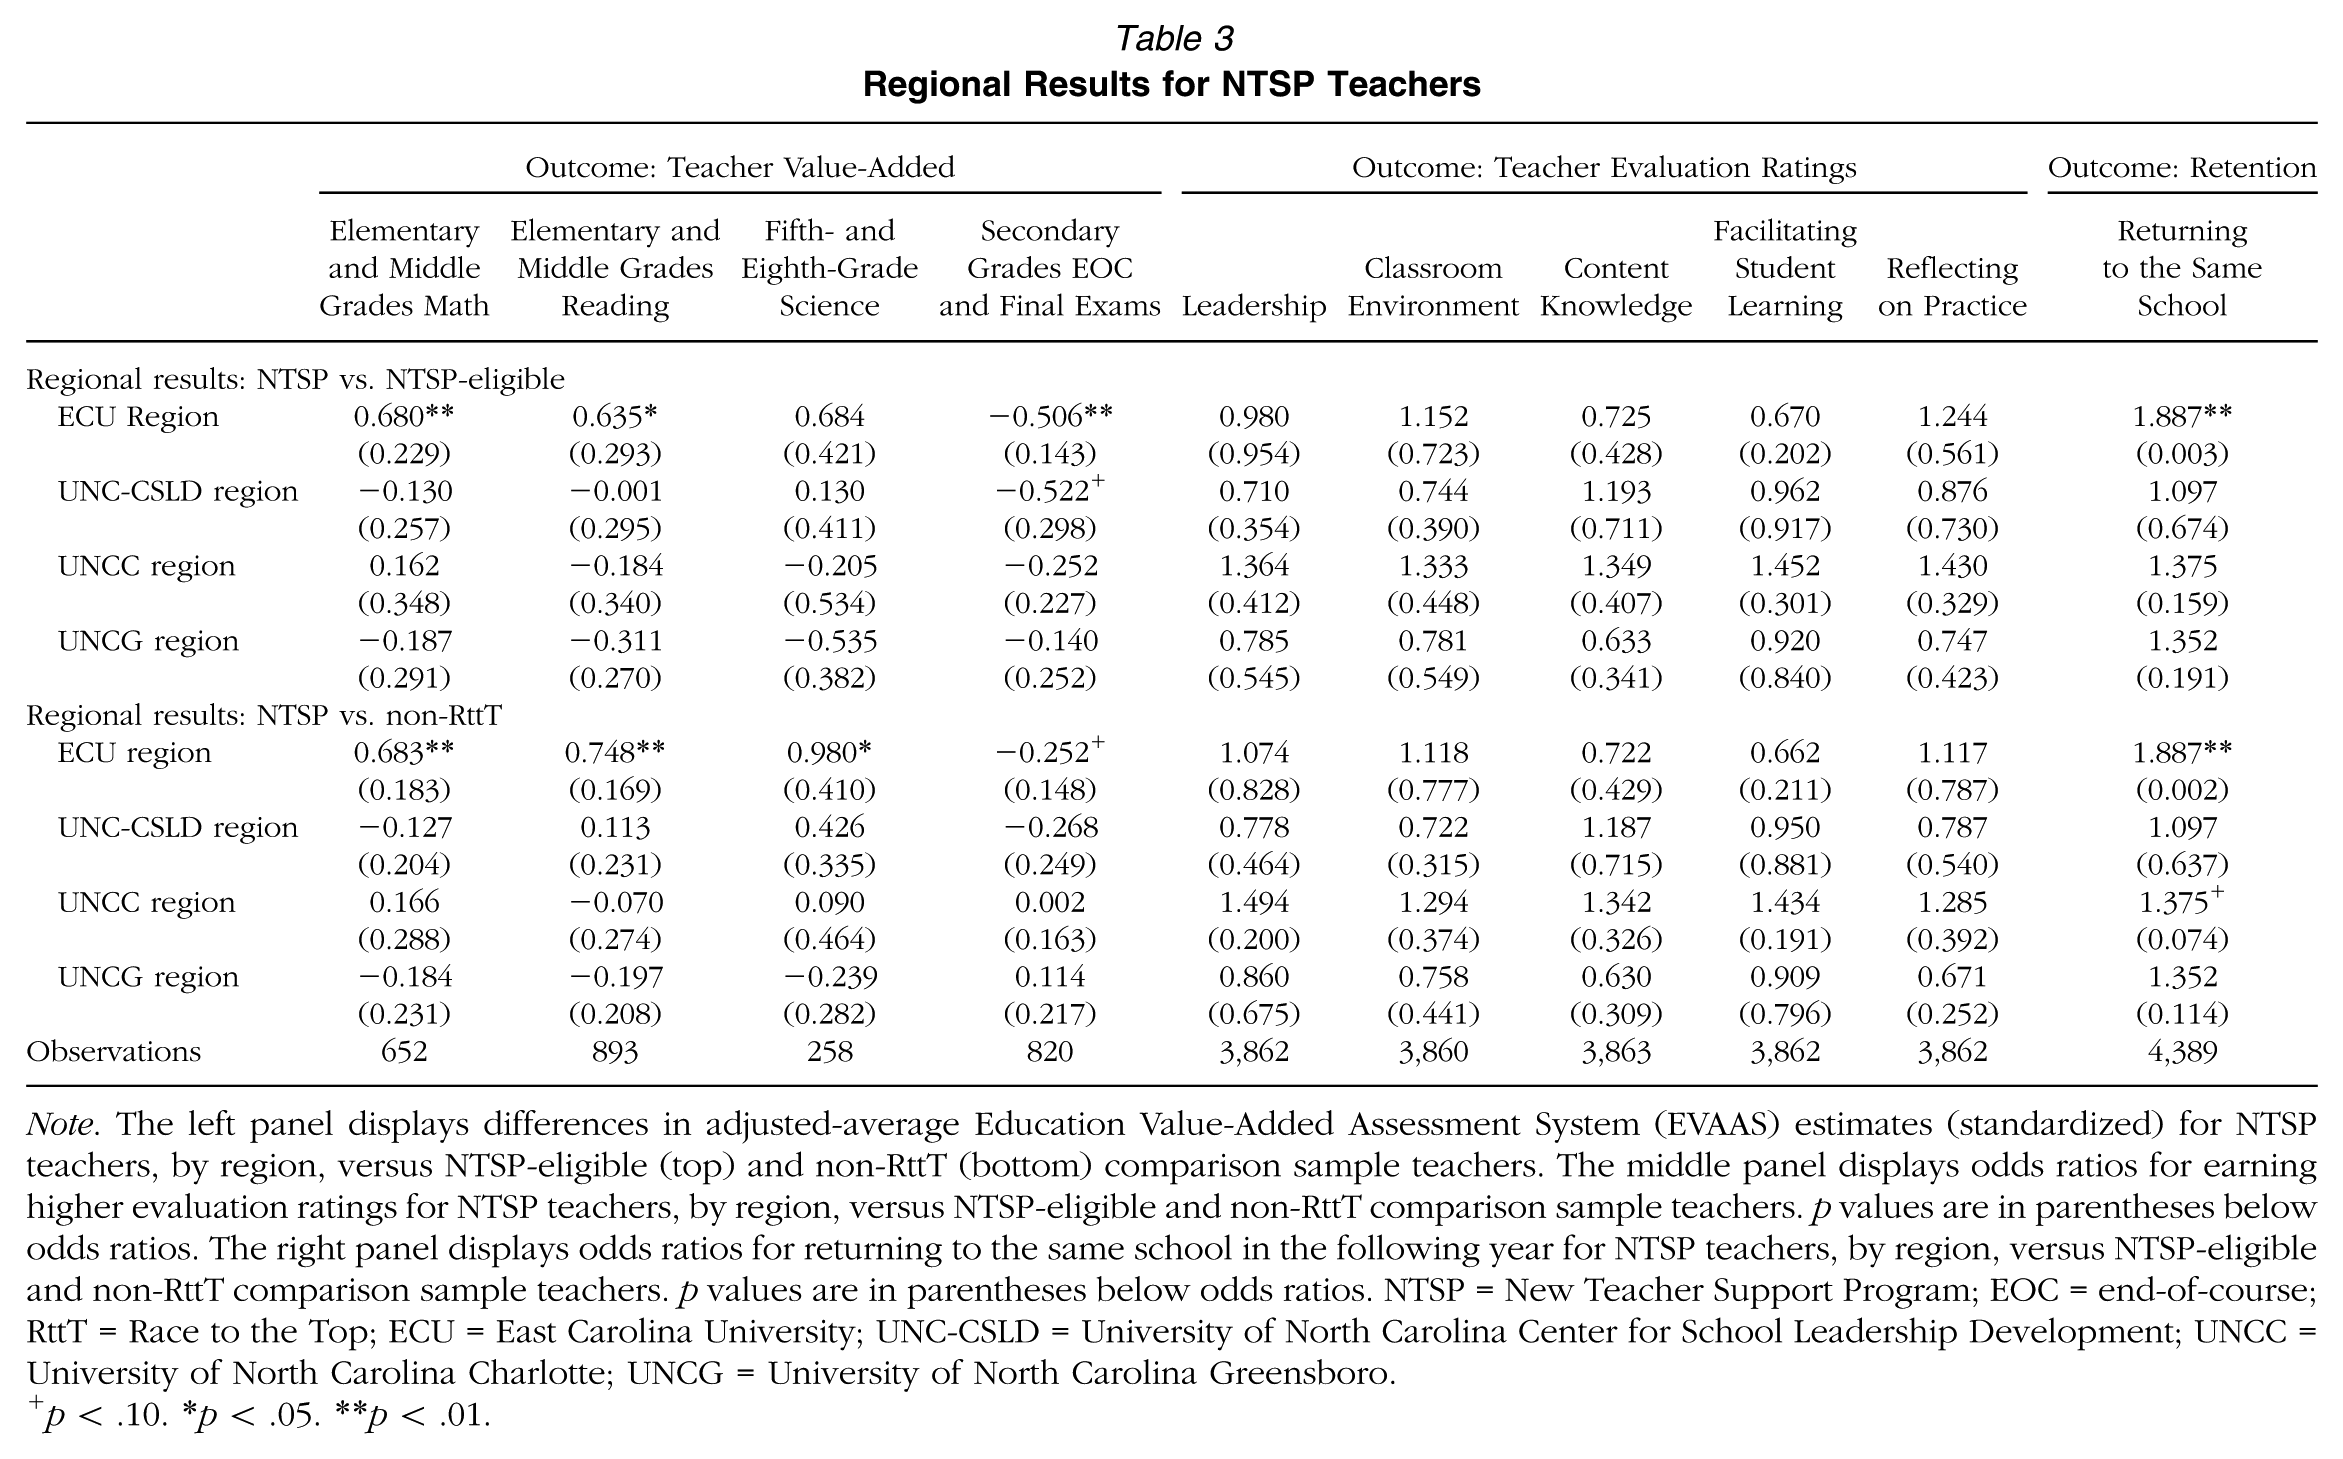
Note. The left panel displays differences in adjusted-average Education Value-Added Assessment System (EVAAS) estimates (standardized) for NTSP teachers, by region, versus NTSP-eligible (top) and non-RttT (bottom) comparison sample teachers. The middle panel displays odds ratios for earning higher evaluation ratings for NTSP teachers, by region, versus NTSP-eligible and non-RttT comparison sample teachers. p values are in parentheses below odds ratios. The right panel displays odds ratios for returning to the same school in the following year for NTSP teachers, by region, versus NTSP-eligible and non-RttT comparison sample teachers. p values are in parentheses below odds ratios. NTSP = New Teacher Support Program; EOC = end-of-course; RttT = Race to the Top; ECU = East Carolina University; UNC-CSLD = University of North Carolina Center for School Leadership Development; UNCC = University of North Carolina Charlotte; UNCG = University of North Carolina Greensboro.
p < .10. *p < .05. **p < .01.
Turning to cohort analyses, Table 4 indicates that NTSP teachers in the first program cohort—entering in the 2012–2013 school year—have significantly higher value-added estimates than NTSP-eligible and non-RttT comparison sample teachers in elementary and middle grades mathematics and reading in the 2012–2013 school year. Conversely, Cohort 1 NTSP teachers have significantly lower value-added estimates than non-RttT comparison sample teachers on secondary grades EOC and final exams. In 2013–2014, both cohorts of NTSP teachers are significantly less effective than NTSP-eligible teachers in elementary and middle grades reading; Cohort 2 NTSP teachers are also significantly less effective for secondary grades exams. Both NTSP cohorts have higher value-added estimates than non-RttT comparison sample teachers in fifth- and eighth-grade science.
Cohort Results for NTSP Teachers (Value-Added)
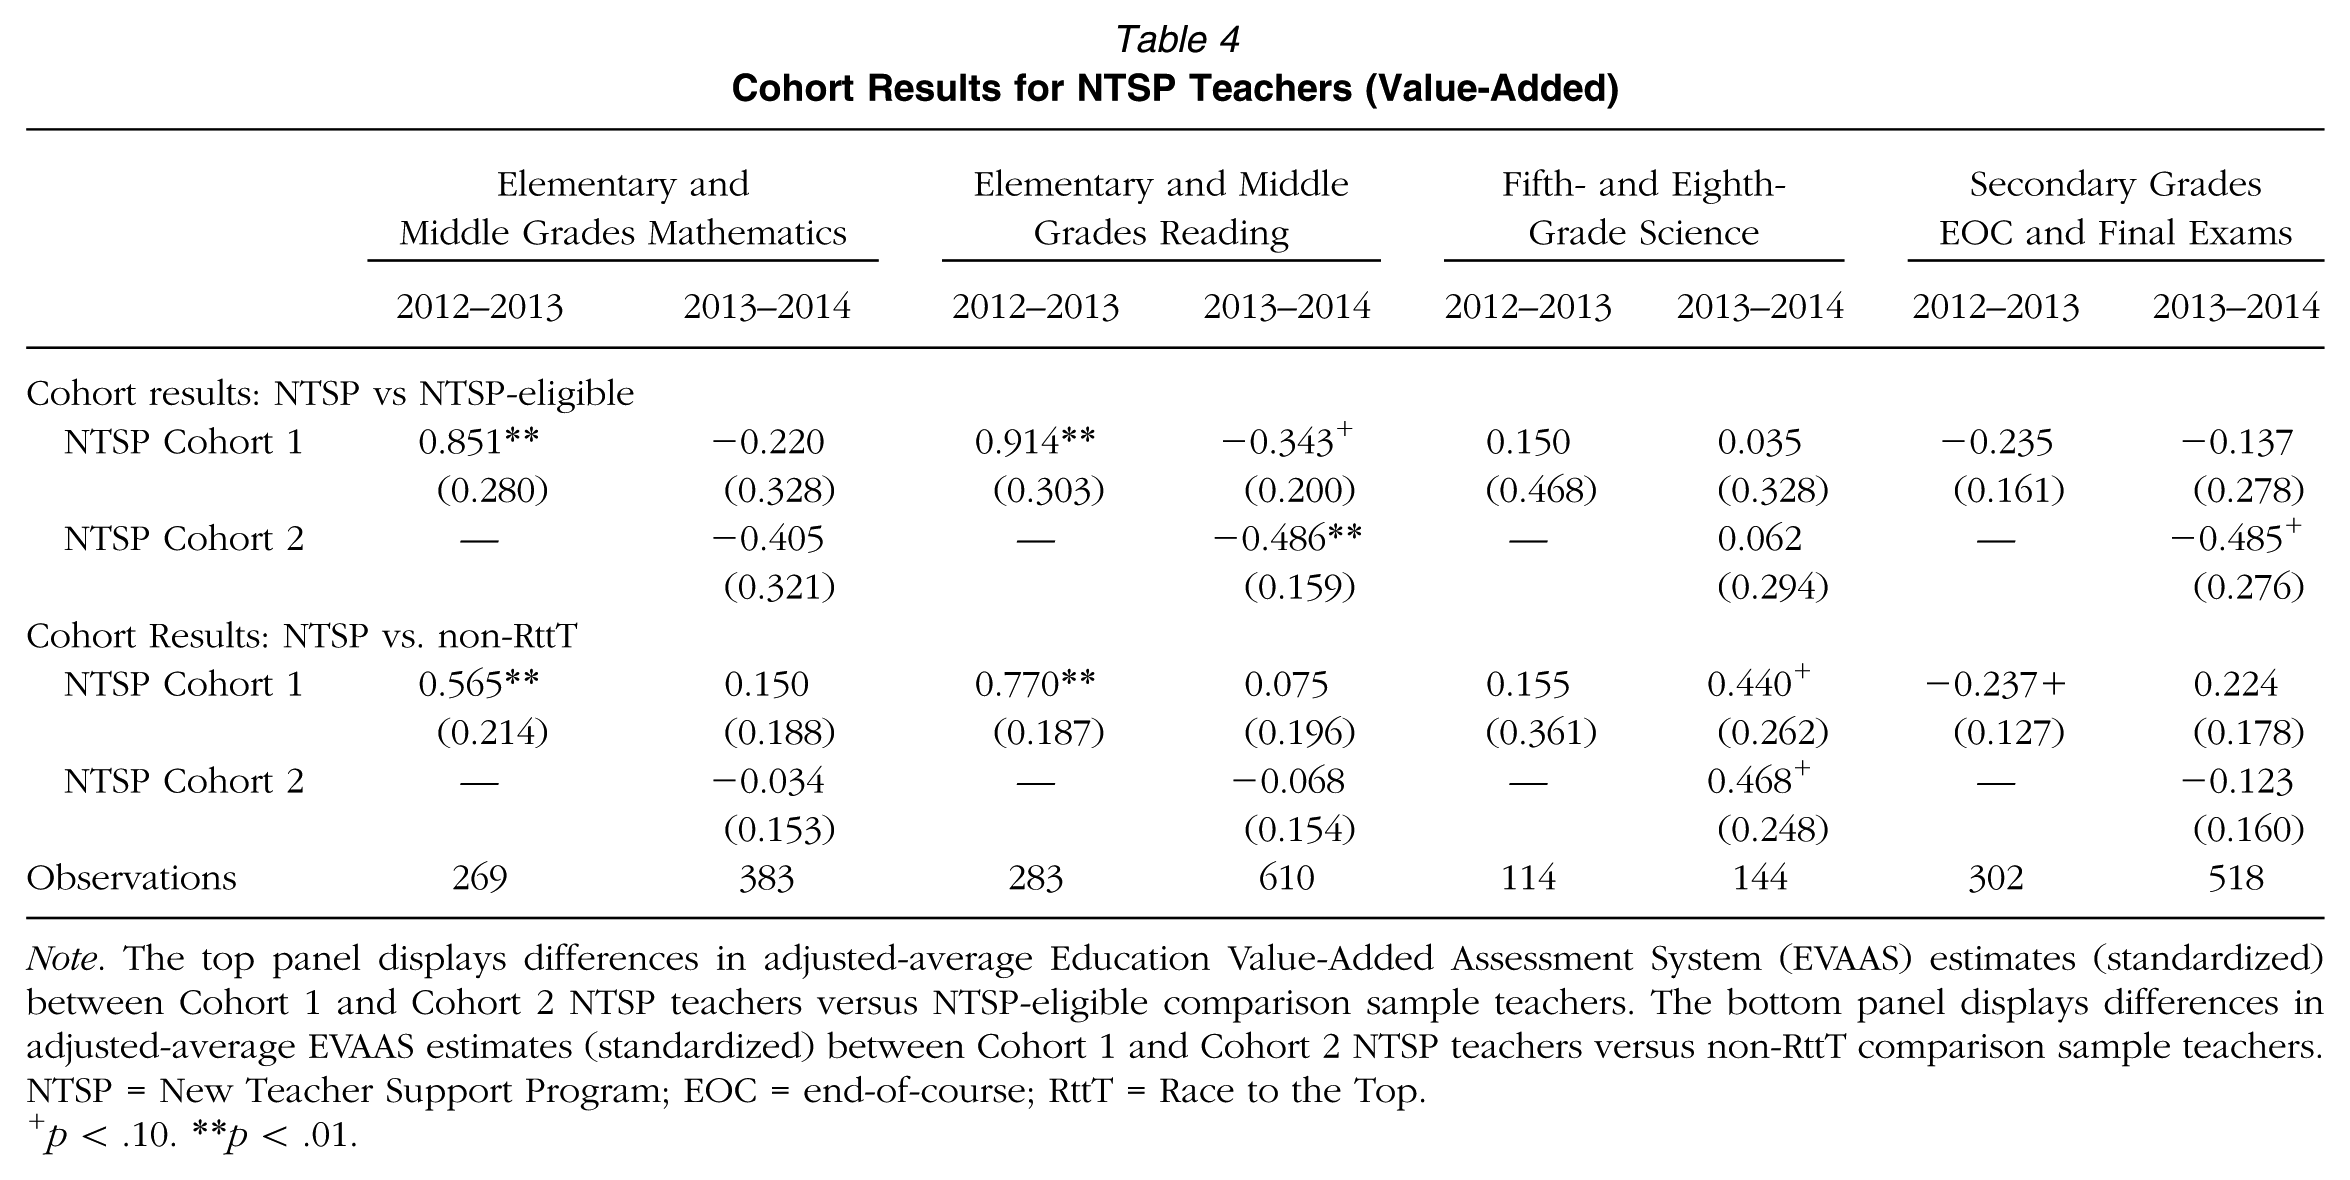
Note. The top panel displays differences in adjusted-average Education Value-Added Assessment System (EVAAS) estimates (standardized) between Cohort 1 and Cohort 2 NTSP teachers versus NTSP-eligible comparison sample teachers. The bottom panel displays differences in adjusted-average EVAAS estimates (standardized) between Cohort 1 and Cohort 2 NTSP teachers versus non-RttT comparison sample teachers. NTSP = New Teacher Support Program; EOC = end-of-course; RttT = Race to the Top.
p < .10. **p < .01.
For teacher evaluation ratings, cohort results in Table 5 do not reveal any significant differences for Cohort 1 NTSP teachers in 2012–2013—when there were significant value-added results. In 2013–2014, evaluation ratings for Cohort 1 NTSP teachers are comparable to the NTSP-eligible sample. Conversely, evaluation ratings for Cohort 2 NTSP teachers are significantly lower for four standards versus NTSP-eligible teachers and two standards versus non-RttT teachers. During their second year in the program (2013–2014), we find that Cohort 1 NTSP teachers have significantly higher evaluation ratings than non-RttT comparison sample teachers on four evaluation standards.
Cohort Results for NTSP Teachers (Evaluation Ratings)
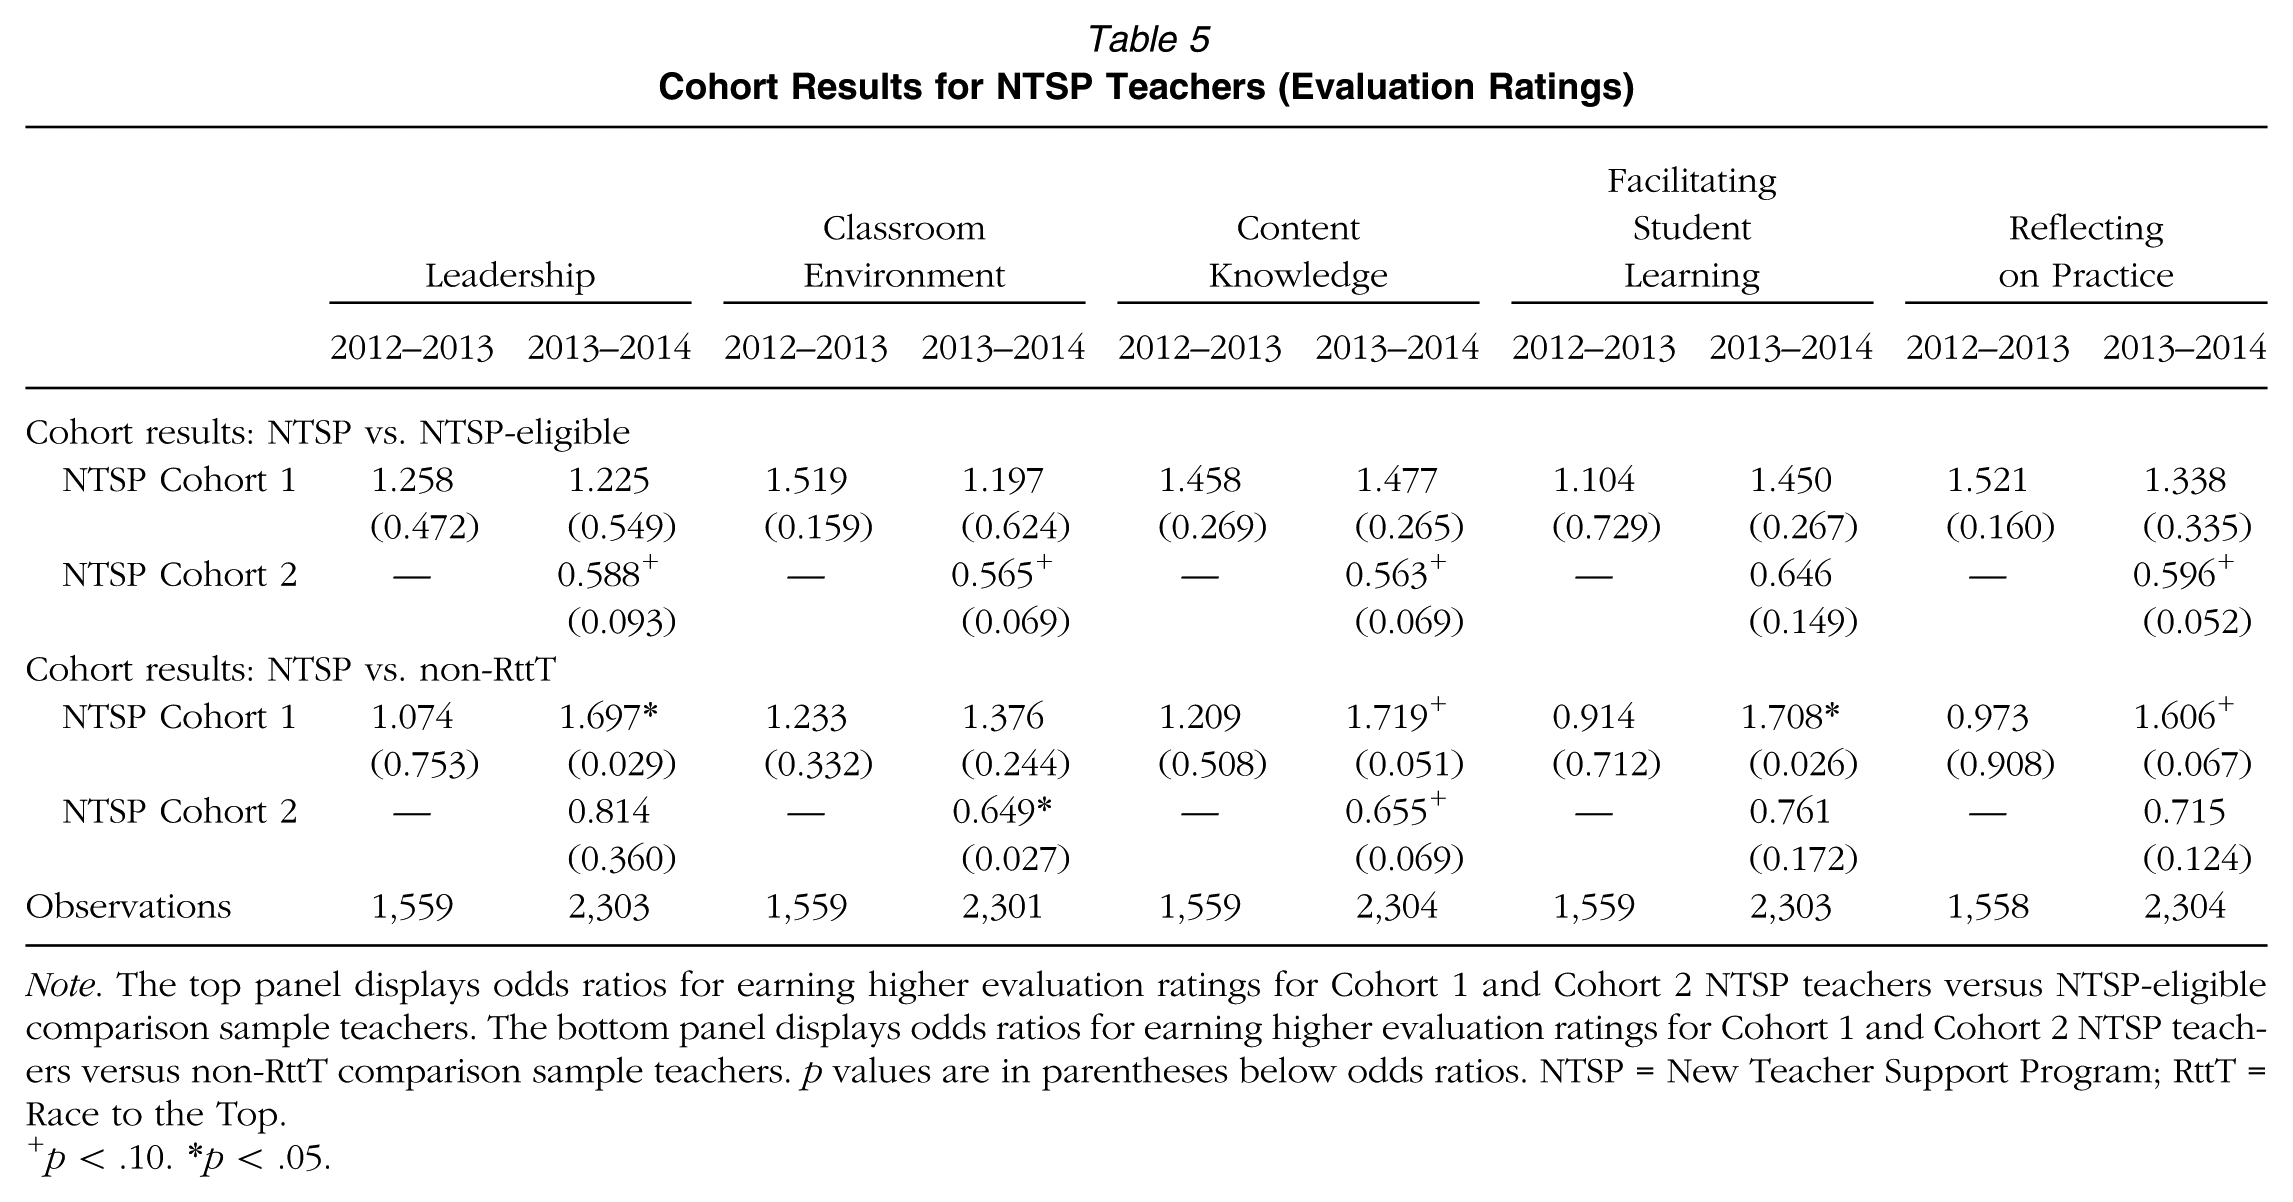
Note. The top panel displays odds ratios for earning higher evaluation ratings for Cohort 1 and Cohort 2 NTSP teachers versus NTSP-eligible comparison sample teachers. The bottom panel displays odds ratios for earning higher evaluation ratings for Cohort 1 and Cohort 2 NTSP teachers versus non-RttT comparison sample teachers. p values are in parentheses below odds ratios. NTSP = New Teacher Support Program; RttT = Race to the Top.
p < .10. *p < .05.
Finally, in Table 6, we present cohort retention results. Here, in comparison to NTSP-eligible and non-RttT comparison sample teachers, Cohort 1 NTSP teachers have significantly higher within-school retention rates—returning in 2013–2014 and 2014–2015. Within-school retention is no different between Cohort 2 NTSP teachers and NTSP-eligible teachers (although the result approaches statistical significance); Cohort 2 NTSP teachers have significantly higher within-school retention rates than non-RttT comparison sample teachers. The predicted retention probabilities for returning to the same low-performing school in 2014–2015 are as follows: 75.06 for Cohort 1, 70.76 for Cohort 2, 63.55 for NTSP-eligible comparison sample teachers, and 64.03 for non-RttT comparison sample teachers.
Cohort Results for NTSP Teachers (Retention)
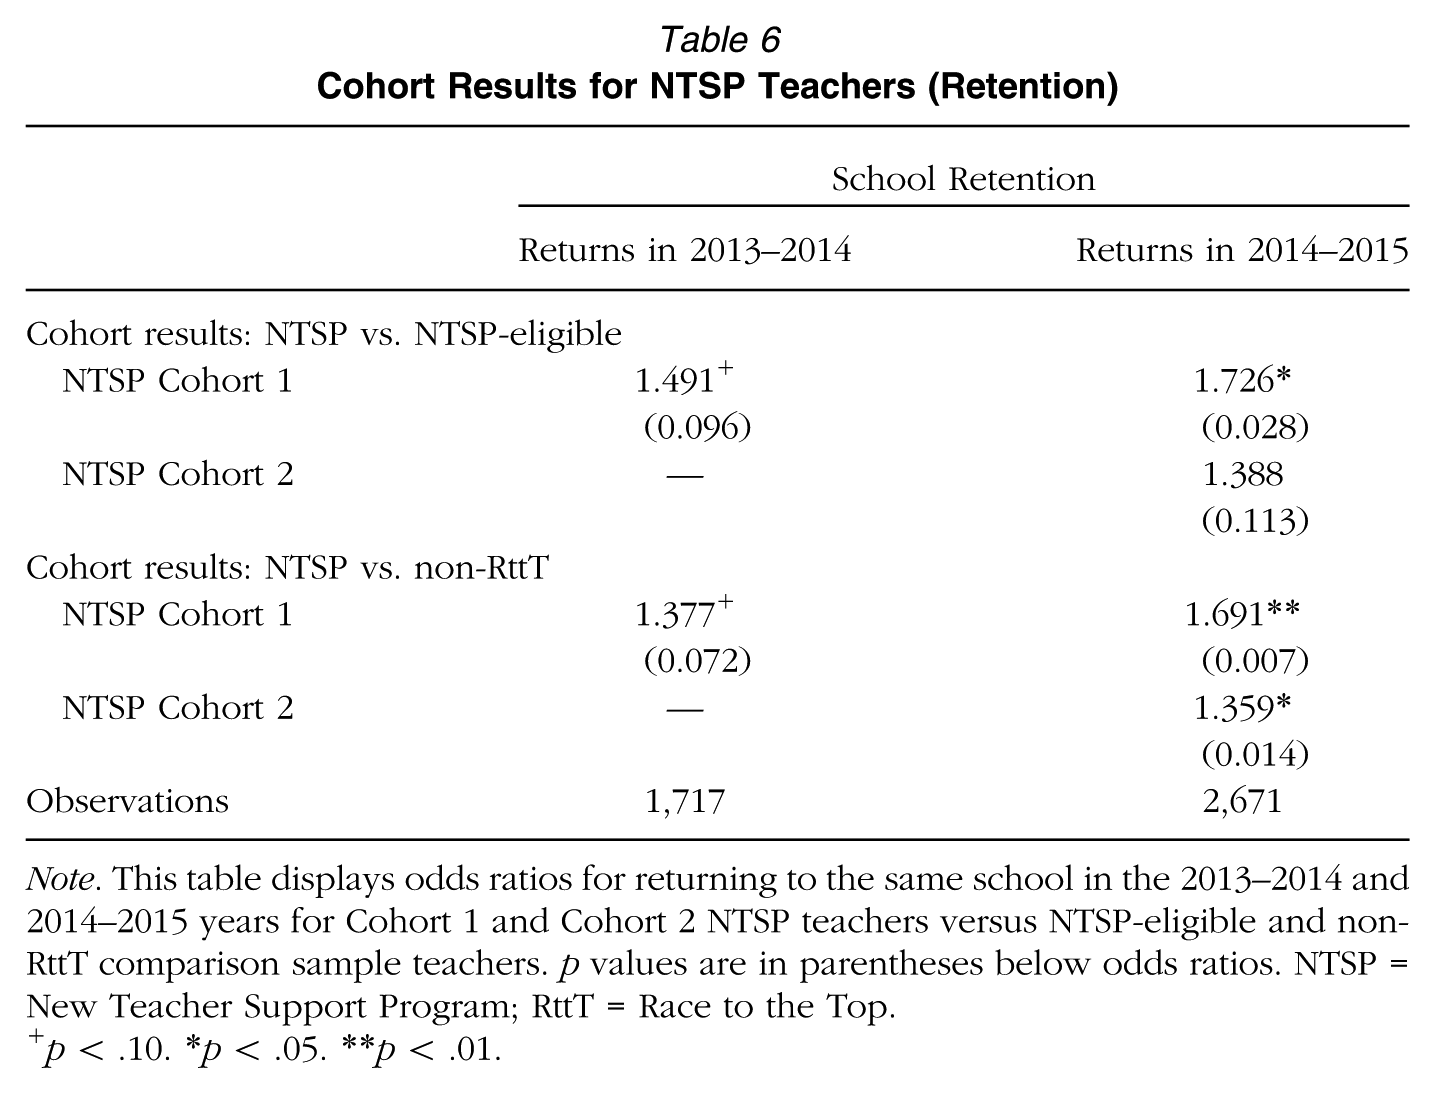
Note. This table displays odds ratios for returning to the same school in the 2013–2014 and 2014–2015 years for Cohort 1 and Cohort 2 NTSP teachers versus NTSP-eligible and non-RttT comparison sample teachers. p values are in parentheses below odds ratios. NTSP = New Teacher Support Program; RttT = Race to the Top.
p < .10. *p < .05. **p < .01.
Is Intensity of NTSP Participation Associated With Outcomes?
Results from the previous section indicate that NTSP teachers in the region and the year/cohort with the most intensive program participation have positive outcomes. This suggests that dosage may matter. To more formally test this and assess whether certain NTSP components are significantly associated with teacher outcomes, we limited our sample to NTSP teachers and estimated dosage models controlling for levels of participation in the NTSP institutes, professional development, and instructional coaching—entered into separate regression models. While we acknowledge selection concerns—for example, instructional coaches may frequently visit teachers who are struggling, teachers decide whether to attend program institutes and professional development—these models may identify components that benefit teachers and help NTSP implementers target resources toward more effective programmatic practices.
Dosage results in Table 7 show that an average of one more instructional coaching visit per month is associated with significantly higher teacher value-added estimates in mathematics (Grades 4–8) and secondary grades EOC and final exams. 16 The frequency of instructional coach visits is not significantly associated with value-added in reading or science or teacher evaluation ratings. An additional coaching visit per month is also associated with significantly higher levels of school retention. Specifically, one more instructional coaching session per month—approximately nine more visits throughout the school year—is associated with a 2 percentage point increase in retention for NTSP teachers.
Dosage Results for NTSP Teachers
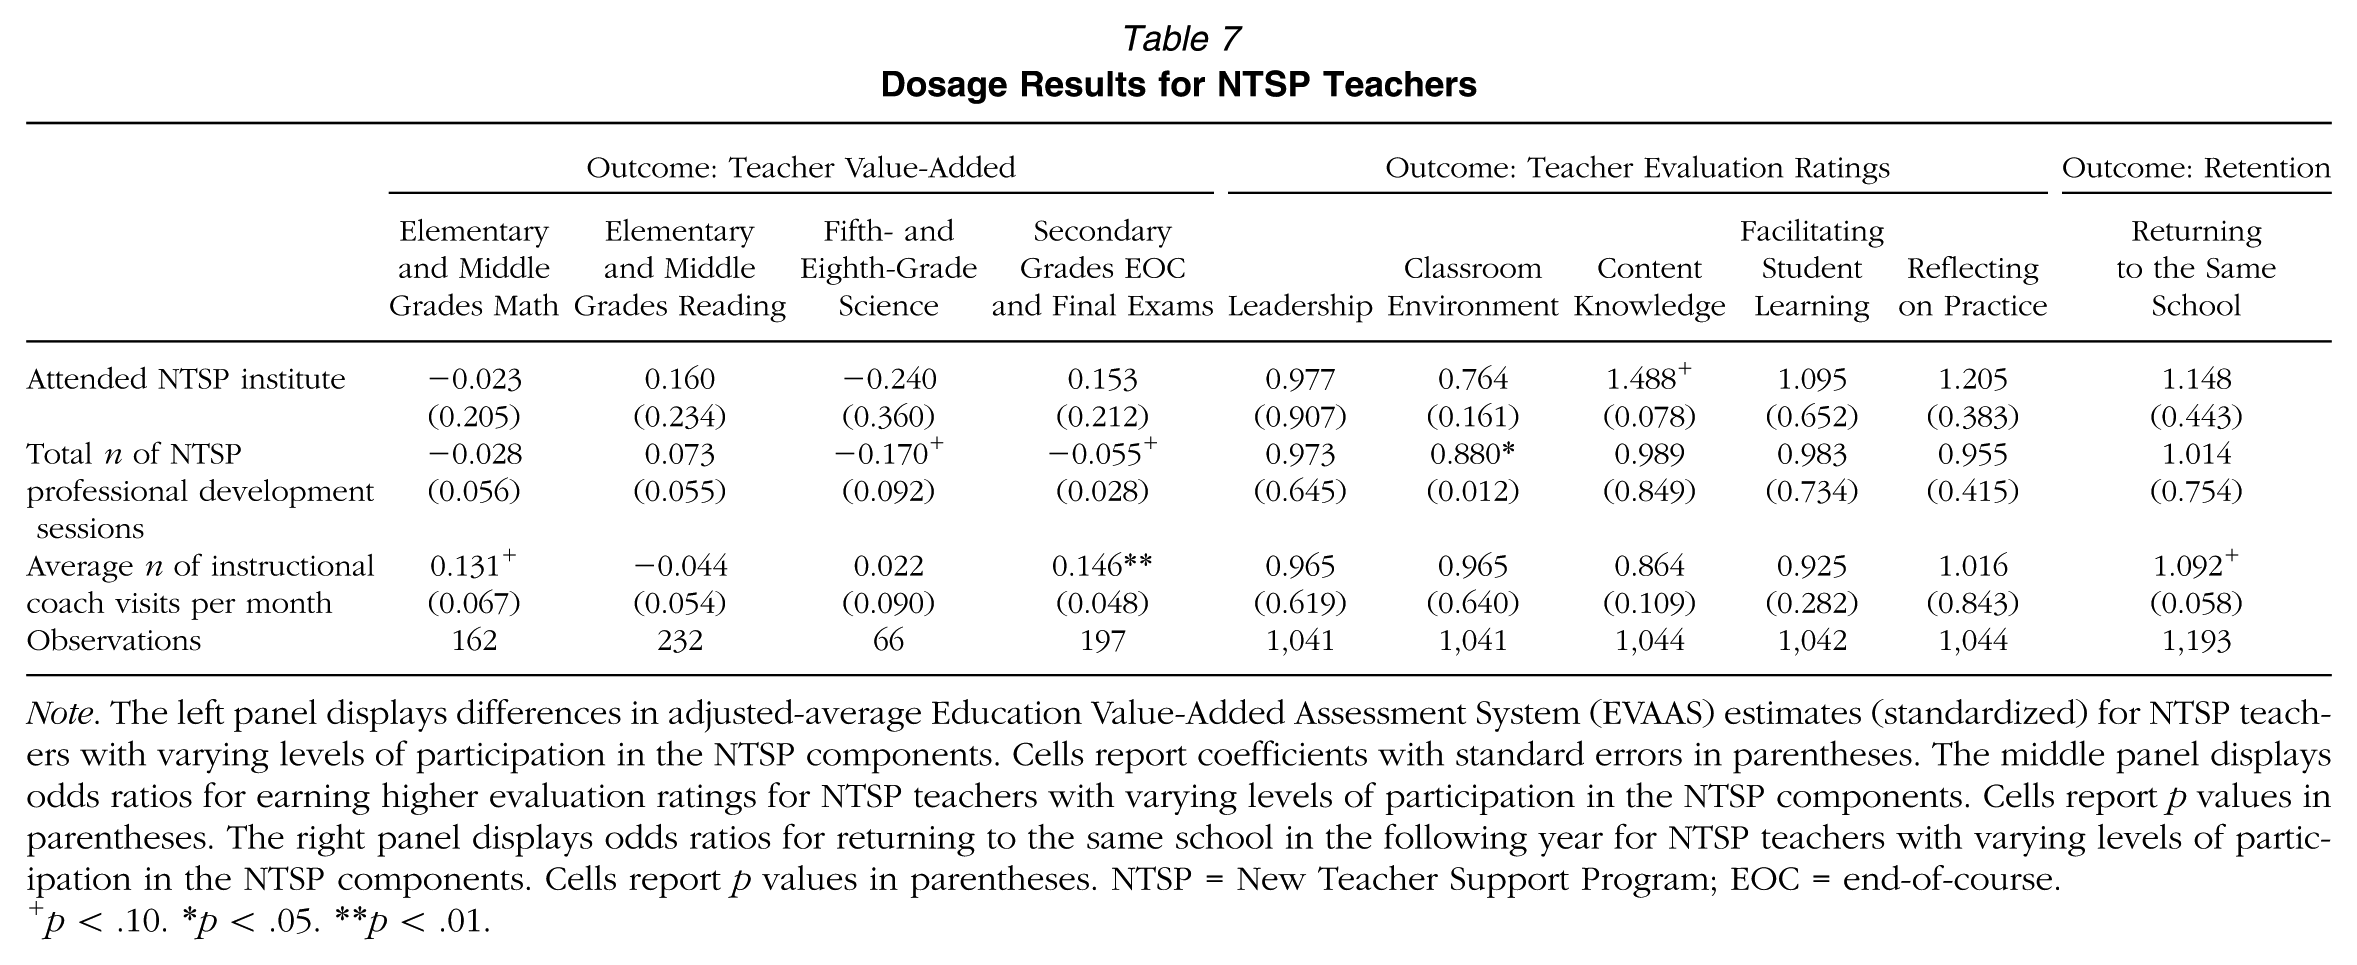
Note. The left panel displays differences in adjusted-average Education Value-Added Assessment System (EVAAS) estimates (standardized) for NTSP teachers with varying levels of participation in the NTSP components. Cells report coefficients with standard errors in parentheses. The middle panel displays odds ratios for earning higher evaluation ratings for NTSP teachers with varying levels of participation in the NTSP components. Cells report p values in parentheses. The right panel displays odds ratios for returning to the same school in the following year for NTSP teachers with varying levels of participation in the NTSP components. Cells report p values in parentheses. NTSP = New Teacher Support Program; EOC = end-of-course.
p < .10. *p < .05. **p < .01.
Beyond the frequency of instructional coaching, there is one positive association between institute attendance and higher evaluation ratings on the content knowledge standard. Conversely, the total number of professional development sessions attended is negatively associated with two value-added estimates—fifth- and eighth-grade science and secondary grades exams—and one evaluation rating—classroom environment. Due to selection concerns, these results should not be overinterpreted; nonetheless, they suggest that the frequency of instructional coaching may matter, while other program components may be less important to teacher success.
Discussion
In this study, we compared the performance and retention outcomes of novice teachers participating in the NTSP—a university-based induction program targeted at North Carolina’s lowest-performing schools—with two groups of comparison sample peers working in other low/lowest-performing schools. Interpreting results from this study necessitates a clear understanding of two key points about the comparison samples. First, each comparison group has strengths and limitations. Our preferred comparison group is the NTSP-eligible sample since it allows for direct comparisons between NTSP teachers and other novice teachers receiving RttT supports. However, the NTSP-eligible sample is much smaller, and it is unknown why these schools elected to not participate in the NTSP. The non-RttT sample is much larger but comprised of schools that did not receive any RttT services, thus limiting our ability to net out the influence of the NTSP from other RttT supports. In many analyses, results are similar versus NTSP-eligible and non-RttT comparison sample teachers; this should increase confidence in the validity of the findings. Second, as illustrated by the school and teacher characteristic differences in Table 1 and Appendix Table A1, the lowest-performing schools served by the NTSP are unique. Relative to comparison sample teachers, teachers in the NTSP work in schools with higher concentrations of economically disadvantaged and minority students and lower percentages of standardized exams passed. These differences may make it more challenging for NTSP teachers to have positive performance and retention results.
Overall, there were no significant performance—value-added and evaluation ratings—differences between NTSP and comparison sample teachers. However, NTSP teachers were significantly more likely to return to their lowest-performing schools than both NTSP-eligible and non-RttT comparison sample teachers. These retention results are particularly important given the need to help low-performing schools slow their teacher attrition rates and keep a more experienced (and effective) workforce (Hanushek et al., 2004; Papay & Kraft, 2015).
Within these overall results, there were differences in outcomes for NTSP teachers across regions and cohorts. Quite simply, teacher performance and retention outcomes were generally positive for NTSP teachers in the region (ECU) and cohort (Cohort 1) with the most intensive program participation. Importantly, many of these regional and cohort results were consistent versus both the NTSP-eligible and non-RttT comparison samples. Building from these regional and cohort intensity findings, dosage results indicate that more NTSP instructional coach visits were positively associated with teacher value-added in mathematics and secondary grades and teacher retention. As to why coaching may matter more than other NTSP components, there are several reasonable hypotheses—the frequent contacts between coaches and teachers, the individualized support that coaches can provide teachers, and the coherence in coaching supports throughout the school year.
There were several negative results for NTSP teachers—for secondary grades value-added and in evaluation ratings for Cohort 2 NTSP teachers. To begin explaining the negative secondary grades results—which are in contrast to positive results in elementary and middle grades—we note that the NTSP is a general rather than content- or school level–specific induction program. Theoretically, the program should benefit beginning teachers, regardless of their teaching assignment; however, it is possible that the structure of the program is not well aligned with the needs of secondary grades teachers or that the quality of instructional coaching and professional development was lower for secondary grades teachers. There are several other potential factors that may have contributed to these negative results. First, program participation was lower for secondary grades teachers—they were less likely to attend an institute and averaged 0.60 fewer instructional coach visits per month. The reduced number of instructional coaching visits may be important since coaching frequency was positively associated with secondary grades value-added. Lower levels of program participation may have also contributed to the negative evaluation results for Cohort 2. Second, it is possible that there were lower levels of human capital/ability in the NTSP secondary grades sample. For example, NTSP teachers have lower licensure exam scores than their peers in the NTSP-eligible and non-RttT samples—acknowledging that many teachers do not have scores because exams are not required for all licensure areas. While these lower scores for NTSP teachers are across school levels (not just in secondary grades), it is possible that licensure exam performance is more closely tied to secondary grades teacher effectiveness. Furthermore, while evaluation ratings were comparable in the full sample, secondary grades NTSP teachers have lower evaluation ratings than their secondary grades peers in the comparison samples. This may signal problems with program quality and/or that secondary grades teachers in the NTSP were less effective before entering the program. Finally, we note the findings in Appendix Table A4: The negative results in secondary grades are generally concentrated in non-STEM subject areas (particularly English courses). This may suggest that concerns with program quality, levels of program participation, and teacher human capital are more acute in certain secondary grades subject areas.
So what does this study contribute to the university-based induction literature, narrowly, and to the teacher induction literature, more broadly? We add to the suite of previous studies that have shown promise for university-based induction models (Colbert & Wolff, 1992; Davis & Higdon, 2008; Kelly, 2004; Schaffer et al., 1992; Stanulis & Floden, 2009) by having much larger treatment and comparison samples and focusing on a set of policy-relevant teacher outcomes. Specifically, previous university-based induction research included only a small number of teachers in the induction program (some of these studies did not include comparison groups), and most of these previous studies only examined classroom practices. We assessed teacher value-added, teacher evaluation ratings, and teacher retention for nearly 1,000 NTSP teachers and 2,350 comparison sample teachers (323 NTSP-eligible and 2,002 non-RttT teachers). Additionally, we examined a university-based program that was targeted at lowest-performing schools, provided to all novice teachers (not just graduates of the preparation program), and coordinated within a statewide university system (rather than a single university). More broadly, the results for NTSP teachers compare favorably with those of teachers in other induction programs. Specifically, studies focusing on non–university based induction programs often find positive teacher retention results (Smith & Ingersoll, 2004) and that program intensity/participation matters (Fletcher et al., 2008; Kapadia et al., 2007; Rockoff, 2008; Smith & Ingersoll, 2004). As with the NTSP findings, other induction studies often return positive retention and value-added results when teachers are in intensive programs and spending more time with mentors. This indicates that university-based induction programs face some of the same barriers to success as other induction models.
Moving forward, our results suggest that more schools/districts and universities may want to explore partnerships for the provision of teacher induction services. In particular, there may be an opportunity for universities to provide induction services for low-performing schools that lack the necessary fiscal and human resources. Nascent research supports the promise of university-based induction programs, and helping early-career teachers develop and succeed is a natural extension of teacher education programs’ mission to prepare effective beginning teachers. The potential benefits for universities that provide induction programs are threefold: (a) strengthened partnerships with districts and schools for student teaching placements and hiring of graduates, (b) opportunities to refine and innovate teacher education programs based on promising practices in K–12 schools, and (c) opportunities to extend teacher education and have greater control over the performance of beginning teachers. This last point may be particularly important given the rise in evaluation systems that hold teacher education programs accountable for the performance and retention of program graduates. Furthermore, our findings add to a decade of results showing that induction providers must create a set of high-quality supports and find ways to ensure teachers’ participation. Whether run by universities, states, or school districts, providers need to allocate sufficient resources to induction programs and structure policies—for example, the selection and training of mentors, frequency of coaching visits—that signal the importance of induction (Youngs, 2007).
Overall, this study contributes to the university-based teacher induction literature with a greater level of rigor and depth—in sample, outcomes analyzed, and methods—and a focus on induction within lowest-performing schools. We hope that this contribution stimulates discussions between K–12 schools and universities and encourages research efforts to both assess other university-based induction programs and conduct studies that warrant more causal interpretation of university-based induction results.
Footnotes
Notes
K
J
References
Supplementary Material
Please find the following supplemental material available below.
For Open Access articles published under a Creative Commons License, all supplemental material carries the same license as the article it is associated with.
For non-Open Access articles published, all supplemental material carries a non-exclusive license, and permission requests for re-use of supplemental material or any part of supplemental material shall be sent directly to the copyright owner as specified in the copyright notice associated with the article.