
Abstract
We investigated whether the content pre-service teachers studied in elementary teacher preparation mathematics courses was related to their performance on a mathematics lesson planning task 2 and 3 years after graduation. The relevant mathematics knowledge was studied when the teachers were freshmen, 5 to 6 years earlier. Results showed that when there were differences in how completely graduates attended to the key mathematics concepts when planning lessons, the differences favored the topics studied in the courses, especially topics emphasized most heavily. We conjecture that teacher preparation can matter for lesson planning, an important task for teaching, if enough opportunities are provided to acquire the relevant content knowledge for teaching. We consider what this might mean for teacher preparation, more generally.
Schools of Education are coming under increasing scrutiny for how effectively they prepare teachers. In the absence of reliable evidence, and given the current attacks on public education and the relatively low level of U.S. student achievement, politicians and policy makers are levying harsh critiques on teacher preparation programs (e.g., Greenberg, McKee, & Walsh, 2013). On October 9, 2009, Former Secretary of Education Arne Duncan delivered a speech in which he suggested Schools of Education were not sufficiently rigorous to prepare high-quality teachers. What is worse, said Secretary Duncan, is that if he was wrong, we would have no way of knowing: “In all but a few states, education schools act as the Bermuda Triangle of higher education—students sail in but no one knows what happens to them after they come out. No one knows which students are succeeding as teachers, which are struggling, and what training was useful or not” (Duncan, 2009, http://www.ed.gov/news/speeches/call-teaching). Shortly after Former Secretary Duncan’s speech, the National Research Council (2010) echoed his concern about the absence of a more robust database on the impact of teacher preparation on graduates’ teaching competence.
The purpose of this exploratory study is to add to educators’ knowledge of the relationship between teacher preparation and teaching competence. We focus on one piece of a much larger puzzle of the relationships between teacher preparation and the quality of classroom teaching (Diez, 2010). Specifically, we compared the quality with which graduates of one preparation program planned mathematics lessons for topics they studied in their program several years earlier with lessons for a topic they did not study. Our primary question was whether a relationship would be found between what graduates studied in their mathematics content courses and the knowledge they used to create lesson plans as beginning teachers.
Relationships Between Teacher Preparation and Teaching Competence
Despite years of research, the effects of teacher preparation on the quality of teaching and, in turn, students’ learning remain unspecified (Arbaugh, Ball, Grossman, Heller, & Monk, 2015; Cochran-Smith et al., 2015; Cochran-Smith & Zeichner, 2005). Although researchers have documented the comparative effectiveness of some programs over others (Boyd, Grossman, Lankford, Loeb, & Wyckoff, 2009; Gansle, Noell, & Burns, 2012; Lincove, Osborne, Mills, & Bellows, 2015), it has been more difficult to explain what features of teacher preparation make a difference (Diez, 2010; Cochran-Smith et al., 2015).
Boyd et al. (2009), for example, compared the effectiveness of elementary teachers from 31 preparation programs that supplied teachers to the New York City schools. Effectiveness was defined as teachers’ value added to student test score performance (VAM). Information was gathered from each program about five general features of teacher preparation: “program structure; subject specific preparation in reading and math; preparation in learning and child development; preparation to teach racially, ethnically, and linguistically diverse students; and the characteristics of field experiences” (Boyd et al., 2009, p. 419). In addition, researchers collected data on graduates’ licensure exam scores. Results showed variation among programs, and the reasons for the better performance of some programs’ graduates were not consistent. The authors conclude that some programs appeared more effective because of the higher talent of their teacher candidates, not because of program features. One feature that did seem to make a difference was a focus on “the work of the classroom” (p. 434), the kind of activities teachers actually will be doing during their first year of teaching.
In general, research to date has documented more consistently the positive effects of clinical experiences than content knowledge on graduates’ classroom performance (Arbaugh et al., 2015; Cochran-Smith et al., 2015; Henry et al., 2013). The effects of learning content during teacher preparation, including mathematics, have been mixed. Using data from the Longitudinal Study of American Youth, Monk (1994) found the number of content courses taken by secondary mathematics and science teachers during teacher preparation was significantly related to their students’ learning, but the relationship was modest and nonlinear. In some analyses, beyond a threshold level, mathematics methods courses boosted the relationship to students’ achievement more than additional content courses. In contrast, Henry et al. (2013) reported a significant negative relationship between mathematics methods courses and teachers’ VAM scores. Adding to the complication, Boyd et al. (2009) observed that “content knowledge is likely important for teaching but may not distinguish more and less effective teachers until the 2nd year” (p. 434). In what seems to us an appropriate summary, Floden and Meniketti (2005) concluded that, overall, researchers have found only small correlations between subject matter coursework taken during a preparation program and graduates’ performance in the classroom.
Our goal in this study was to explore the relationships between the mathematical concepts elementary pre-service teachers (PSTs) studied during their preparation and the mathematical concepts they used when creating lesson plans for teaching the same topics. We reasoned that, given the challenge of finding relationships between teacher preparation and teaching competence, creating specific measures of teaching competence that aligned with the specific kinds of knowledge PSTs studied during their preparation would increase our chances of documenting significant relationships (Lincove et al., 2015). Because designing lessons signals what teachers intend to teach, a lesson planning task would demonstrate how graduates used their knowledge in a teaching-related situation.
Mathematical Knowledge for Teaching (MKT)
The framework we used to analyze the mathematical knowledge PSTs studied during their preparation and the mathematical knowledge they displayed in their lesson plans several years later built on the idea of MKT (Ball, Thames, & Phelps, 2008), an elaboration and specification for mathematics of Shulman’s (1986) pedagogical content knowledge. MKT is the kind of knowledge teachers use when they teach mathematics. It is related to, but different from, conventional knowledge of the subject matter.
Empirically, the relation between MKT and mathematics teaching and/or students’ learning has been mixed. Those who initially defined the construct of MKT have reported significant relationships of MKT with quality of mathematics teaching and, in turn, with school students’ learning (Ball & Bass, 2000; Ball et al., 2008; Hill et al., 2008; Hill, Rowan, & Ball, 2005; Hill, Sleep, Lewis, & Ball, 2007). However, others have found fewer significant relationships between MKT and both the quality of teaching and students’ learning (Kersting, Givvin, Sotelo, & Stigler, 2010; Kersting, Givvin, Thompson, Santagata, & Stigler, 2012). Although the empirical relation between MKT and teaching and learning still must be clarified, we chose to use MKT as a framework because it was designed explicitly to capture the knowledge needed to perform the tasks of teaching.
In their definition of MKT, Ball et al. (2008) dissect the knowledge teachers need into several types, such as common content knowledge, knowledge of content combined with knowledge of student thinking, and specialized content knowledge (SCK). We are especially interested in SCK because this is content knowledge specialized for the work of teaching. It includes, among other things, (1) developing meaning for concepts involved in achieving the mathematics learning goal of a lesson; (2) choosing representations, like concrete models or pictures, for finding solutions to problems that involve these concepts; and (3) justifying and explaining standard arithmetic procedures and problems that involve these concepts. Because it is content knowledge, not dependent on knowledge of the classroom, it is knowledge that could be learned by PSTs, even before they begin clinical classroom experiences. This makes SCK appealing as a framework for mathematics content courses in teacher preparation programs. The three categories of SCK identified above align closely with the kinds of activities emphasized in the mathematics content courses taken by the participants in this study and elements of the scoring rubric created to assess their lesson plans.
Theory of PST Learning
In our view, past difficulties in finding relationships between content preparation and teaching competencies have been due, in part, to an absence of specific hypotheses about the nature of content knowledge studied and its use several years later, in teaching-like contexts. Three (related) hypotheses underlie the design of the content courses and the methodology used in this study; these three hypotheses constitute a theory of the nature of learning opportunities needed for PSTs to learn mathematics content that is remembered and used as graduates begin teaching.
Underlying the hypotheses is the well-established finding that knowledge learned in instructional settings is frequently not used outside of these settings. Whitehead (1929) described knowledge as “inert” when its application is more or less confined to instructional contexts (e.g., schools, universities). A fundamental challenge for PST education is to help PSTs construct knowledge that can be applied in their future professional lives. In general, many factors have been identified that can interfere with knowledge application (Bereiter & Scardamalia, 1985; Rendl, Mandl, & Gruber, 1996). These include holding the knowledge in a form that does not allow for its application, defects in the knowledge-to-be-applied (e.g., insufficient topic-specific knowledge), and a lack of similarity between the context in which the knowledge was learned and the context in which it should be applied (Rendl et al., 1996). The theory of PST learning attends to factors like these that can prevent the development of useable and applicable knowledge.
A first hypothesis is that PSTs must learn content knowledge in a form that allows them to apply it to teaching situations. In our view, the best form of knowledge is a “decompressed” or “unpacked” version of the material to be taught (Ball et al., 2008), not more advanced material. For example, to help fourth graders understand why the standard procedure works for multiplying multidigit whole numbers, teachers need to help them understand the meaning of multiplication as repeated addition, the way in which the distributive property produces partial products, and why multiplying by factors of 10 yields zeros in smaller place-value positions. This unpacked knowledge of multidigit multiplication is more useful than, for example, knowledge of multiplying matrices.
To elaborate the idea of unpacked knowledge, one could think of the concepts that feed into a larger topic as clusters of understandings surrounding the topic (Ball et al., 2008; Ma, 1999). These understandings include those within each of the three SCK categories—knowledge of the meanings of the specific concepts that make up the topic, knowledge about models for representing and solving problems involving the concepts, and knowledge of explanations and justifications for procedures and problems that involve the concepts (Ball et al., 2008). For example, the first category of SCK for the topic of subtracting fractions would include meanings for the following cluster of concepts: numerator and denominator, equivalence, subtraction, and units of measure. We will use the term key concepts to refer to concepts within each of the SCK categories we identified that are fundamental to learning and teaching the topic. To reiterate, Hypothesis 1 says that acquiring tightly linked but unpacked knowledge within each of the three categories of SCK for each topic is more important than understanding more advanced material.
A second hypothesis in the theory of PST learning of usable knowledge for teaching is that knowledge for teaching is topic-specific. We propose PSTs will most likely use knowledge they acquire about a topic if the later context calls for knowledge about that topic. In other words, if PSTs learn to explain how and why the standard algorithm for subtracting fractions works as it does, they will retain and use this knowledge when planning to teach subtracting fractions, but it will be less useful for planning lessons for other topics, like multiplying whole numbers. This hypothesis is based on the well-known difficulties of transferring knowledge from one domain to another, unless the two domains share salient common elements noticed by the user (National Research Council, 2000; Rendl et al., 1996; Salomon & Perkins, 1989). Because the SCK underlying a mathematical algorithm for subtracting fractions, for example, is different from that underlying multiplying whole numbers, they do not share common elements so we do not expect participants to transfer their SCK about one topic to another. Consequently, we expect participants’ performance on a task to be influenced most directly by the opportunities they had to study that topic.
The final hypothesis in the theory of PST learning is that knowledge for teaching is context-specific. We propose that PSTs will most likely use knowledge they acquire if the context in which they need to apply the knowledge is similar to the context in which they learned it. For example, if they learn particular mathematical concepts by studying student work or by creating concrete models for representing actions on quantities, they will be more likely to use this knowledge when they are in similar teaching-like situations. This hypothesis overlaps with the previous hypothesis because it is based on a similar principle: to access and apply knowledge, the user must notice similar elements across its acquisition and its use (National Research Council, 2000). However, in this case, the elements are those of context, including the particular kind of task. As in many professional fields (March, 2002), transferring specialized knowledge (e.g., SCK) from the laboratory (e.g., teacher preparation programs) to the field (e.g., classrooms) can be especially challenging because the contexts are different (Hiebert & Morris, 2012). To the extent that knowledge for teaching is acquired in a similar context to the one in which it will be used, PSTs are more likely to apply and use their acquired knowledge when they begin teaching (Grossman, Hammerness, & McDonald, 2009). This seems to be true for teaching-related skills like specifying and developing key ideas involved in achieving learning goals (Morris, Hiebert, & Spitzer, 2009) and planning lessons (Blömeke et al., 2008), the skills assessed in this study.
In summary, we predicted we would be more likely to find relationships between early learning of SCK by PSTs and later use in applying this knowledge if the knowledge about a topic was learned in its unpacked form and included key concepts for that topic within each of the three SCK categories; if the mathematics topic, and thus the SCK required, was the same across settings; and if PSTs acquired SCK in contexts similar to those used to assess their later performance. These three hypotheses provided the rationale for the design of the preparation courses involved in the study reported here, for many elements of the methods used to study the relationships between the SCK taught in the courses and graduates’ use of this knowledge, and for our interpretation of the results. Table 1 shows the hypotheses and their consequences for the content of the preparation courses, the methods of the study, the predictions of outcomes, and the interpretation of results. Entries were included in the table only when our analyses suggested the hypothesis had direct consequences for a particular aspect of the study.
Theory of Pre-Service Teacher Learning of Usable and Applicable Knowledge for Teaching

Setting for This Study
In this article, we report data from a longitudinal study on the effects of the mathematics portion of a K-6 preparation program in a large mid-Atlantic university. This is a 4-year certification program in which all students earn K-6 certification and choose a second certification, often in a middle school subject area. The program graduates about 130 students per year. The coursework in the mathematics portion of the K-6 program consists of three mathematics content courses and one mathematics methods course. Multiple sections of these courses are offered each semester; all sections are taught by mathematics education faculty or doctoral students.
The three mathematics content courses develop content from the K-6 curriculum. The focus is on the mathematical key concepts determined by unpacking the major topics covered in each course (see Hypothesis 1 in the theory of PST learning). The particular key concepts are those that comprise the three categories of SCK we identified earlier. Consistent with Hypothesis 3 in the theory, much of the material is presented through activities that aim to simulate authentic teaching tasks. These activities include analyzing student work and mapping the work to concepts involved in learning the specific topic, creating concrete models for concepts and procedures along with modeling solution strategies students might use, and critiquing and writing explanations involving key concepts and standard algorithms.
The focus of this study is on the SCK PSTs studied during the first two of three mathematics content courses. Most PSTs take these courses as freshmen. The first course covers whole number and decimal numeration systems. The course includes a study of ancient numeration systems, place value concepts, counting and measuring quantities represented with whole numbers and decimal fractions, and the arithmetic operations with whole numbers and decimal fractions. Arithmetic operations are developed through writing story problems, modeling concretely decimal number sentences to create meaning for the four operations, making mathematical sense of students’ solution strategies and errors viewed on video clips by explicitly mapping them to the concepts involved in learning the topic, and examining the conceptual basis for intermediate and standard algorithms for whole numbers and decimal fractions.
The second mathematics content course focuses on common fractions and proportional reasoning. This course involves a detailed study of different meanings for and representations of fractions, the arithmetic operations on fractions, and different representations and methods for solving proportional reasoning problems. As in the first course, arithmetic operations on fractions are developed through writing story problems, modeling concretely operations on fractions (e.g., modeling the subtraction of two fractions using fraction strips), analyzing school students’ solutions to fraction and proportional reasoning problems and mapping the solutions to the concepts involved in learning the topic, and unpacking the conceptual basis for standard and nonstandard algorithms for operating on fractions.
The third mathematics content course and the K-6 mathematics methods course are not implicated directly in the lesson planning task used in the study reported here. In neither course did PSTs study the mathematics content of the task administered in this study; neither course included any development of SCK for the four topics involved in this study. The third content course focuses on algebra and geometry for elementary school. The mathematics methods course focuses on pedagogical approaches for teaching mathematics and includes an intensive field experience. Most PSTs take the third content course when they are sophomores and the methods course when they are juniors or seniors.
A unique and important design feature of the content courses is that all PSTs receive similar learning opportunities regardless of which course section they take. Over the past 15 years, the mathematics education group has created detailed lesson plans for each session of each content course and works to improve the lessons over time (Hiebert & Morris, 2009; Morris, 2012; Morris & Hiebert, 2015). The lesson plans include detailed descriptions of each instructional activity, and the associated materials include student problem sets (classwork and homework) for each session. All instructors who teach a particular course meet weekly to preview upcoming lessons. The goal of the detailed lesson plans and the weekly meetings is to ensure all PSTs receive instructional presentations and activities that reflect the group’s current conception of best practices. Although we cannot verify the lesson plans were implemented in exactly the same way by every instructor, we believe all PSTs received the same instructional activities that provided similar learning opportunities covering the same mathematics content.
Research Design
To tease out the effects of teacher preparation, we employed a design in which graduates serve as their own controls. Graduates were assessed on four mathematics topics from the K-6 school curriculum. Three target topics (Multiplying Two-Digit Whole Numbers, Subtracting Fractions, Dividing Fractions) were developed in the two courses to varying degrees, whereas the fourth topic (Finding the Mean of a Small Set of Whole Numbers) was not addressed and thus served as a control. All participants completed the same lesson planning task for each of the four mathematics topics.
We selected Multiplying Two-Digit Whole Numbers, Subtracting Fractions, and Dividing Fractions because they are topics in the elementary school curriculum, they have standard procedures based on important underlying concepts, and substantial time is spent in the first and second content courses developing them. It is not possible to select a control topic that is entirely analogous to one or more of the target topics. We selected Finding the Mean of a Small Set of Numbers as the control topic because it shares several features with the target topics, and no time is spent on this topic in any of the three content courses and one methods course.
Like the target topics, finding the mean is a topic in current elementary school curricula, and it has an associated standard procedure based on important underlying concepts. Looking deeper, finding the mean involves adding and dividing, arithmetic operations that also are part of the target topics. Finally, to develop a conceptually based lesson for finding the mean, participants could draw from the three categories of SCK described in Hypothesis 1—developing the meaning of concepts involved in learning the topic, representing with models solutions to problems, and justifying the standard procedure. Thus, the control task and the target tasks required the same three types of SCK. However, participants had spent no time studying finding the mean in their courses so they had not studied the details within each type of SCK—that is, the conceptual meaning of finding the mean, how to represent finding the mean with a concrete model, or how to justify the standard procedure for finding the mean.
We intentionally did not design a study that involves comparing graduates of the program with graduates of other programs. We were not interested in showing that one program is better than another. Rather, we were interested in understanding the relationship between studying SCK in a preparation program and using SCK when planning for teaching, several years later.
Research Questions
Following graduates into the field and searching for relationships between the SCK they studied and their use of this SCK motivated the following research questions.
When completing a lesson planning task, are there differences in the participants’ specification and development of key concepts for three mathematics topics they studied in the courses compared with a topic they did not study?
Is there a relationship between the emphases with which key mathematics concepts within each topic were treated in the courses and participants’ specification and development of these concepts when completing a lesson planning task for that topic?
Predictions of the answers to each question can be formulated based on the theory of PST learning we described earlier (see Table 1). With respect to Research Question 1, we expected to find differences across mathematics topics for two reasons. One is that the SCK we assessed is hypothesized to be topic specific. The SCK required to identify and develop the key concepts underlying each topic is different, so performance on the lesson planning task should differ depending on the SCK PSTs had an opportunity to learn.
A second reason to expect differences among topics is differences in opportunities to study the key concepts of the topics in the courses. Returning to the hypothesis that usable knowledge comes in the form of connected clusters of key concepts tightly surrounding the topic to be taught, the content courses engaged participants in somewhat different instructional activities for different topics, made some key concepts more explicit than others, spent more time on some key concepts than others, and so on. Because opportunities to develop understanding of the key concepts were not equivalent across the topics, we did not expect graduates to acquire understanding of concepts to the same depth, and consequently, we did not expect graduates to apply this knowledge equivalently across topics.
Regarding Research Question 2, we expected to find a relationship between the opportunities to develop an understanding of a key mathematical concept in the courses and graduates’ performance on the lesson planning task. Again, we can cite two reasons for this prediction. First, as noted with respect to the first research question, opportunities to learn a key concept are likely to affect the depth of understanding of the concept within each category of SCK for the topic. Second, because we believe all PSTs received similar emphases on the same key concepts, the variation among participants’ performance should be reduced so the likelihood of finding a relationship, if it exists, should be evident with this sample of participants.
Methods
Sample
Participants were 27 graduates of the elementary teacher preparation program. All members of their cohort (n = 132) who completed the program and graduated in 2009-2010 were invited to participate in the project. Of the 35 graduates who agreed to participate 1 year after graduation, 28 completed the Year 2 lesson planning tasks, and 27 completed the same tasks in Year 3. These 27 graduates were the participants in this study. Of the 27 participants, 18 were full-time classroom teachers in Year 1, 21 were full-time teachers in Year 2, and 26 were full-time teachers in Year 3.
The 27 participants were only 20% of their full cohort. Because we would like to generalize the results to graduates in this cohort who had taken the two content courses, we checked on the representativeness of the sample with respect to SCK. We compared the grades in the two relevant mathematics courses earned by the 27 participants with those earned by their 105 cohort peers who did not participate. There were no significant differences between the course grades for the first course (t = .249, p = .805) or the second course (t = 1.225, p = .223). Consequently, the mathematical performance of this relatively small group of participants seems to be representative of their full cohort, at least at the time the courses were taken.
Data Collection
The lesson planning tasks were given during the summer 2 years after graduation (Year 2 assessment) and again 3 years after graduation (Year 3 assessment).We collected data in both years to check on the stability of the findings. Educators have known for some time that beginning teachers struggle to manage the demands of classroom teaching and only reach a level of stability in their teaching after several years of practice (e.g., Nemser, 1983; Zeichner, Tabachnick, & Densmore, 1987). We wanted to see if this same trend was apparent in the graduates’ use of their SCK. In addition, Boyd et al. (2009) noted that content knowledge might not distinguish more and less effective teachers until at least their second year of teaching. These considerations suggest assessing participants at least 2 years after graduation.
To ensure the graduates created original responses to the same task after Years 2 and 3, we checked whether any participants simply submitted the same, or very similar, lesson plans in Year 3 as they had in Year 2. No participants did so; all participants created different lesson plans for Year 3 than for Year 2.
We also collected several other sets of data to test alternative explanations of potential differences in graduates’ performance on the lesson planning task. We obtained the syllabus for the mathematics methods course in which our participants had been enrolled and verified that the four topics were not addressed in their methods course. We administered the lesson planning task to a separate cohort of entering freshmen to check whether PSTs might enter the program already more skilled in some topics than others. We also collected data on the topics the graduates in our sample taught each of their first 3 years, experiences that might influence their performance on the lesson planning task, and we collected data on professional development (PD) experiences of the graduates on each of the four mathematics topics during their first 3 years after graduation.
Tasks
Why lesson planning?
For each mathematics topic, graduates were asked to plan a single lesson. Lesson planning has long been considered an essential skill for teachers (Blömeke et al., 2008; Shavelson, 1976; Tyler, 1950). Books on learning to teach often include chapters on how to plan lessons (e.g., Scrivener, 1994). Planning lessons also could be considered a high-leverage practice, a practice at which teachers must be competent or face significant obstacles in their efforts to teach effectively (Ball & Forziani, 2011). Although planning a lesson is not the same as teaching a lesson, the evidence suggests that how teachers plan lessons is related to how they teach lessons (Peterson, Marx, & Clark, 1978). Furthermore, teaching from well-developed lesson plans can boost a teacher’s effectiveness (Jackson & Makarin, 2016).
A teacher-created plan could be considered their intended lesson (Remillard, 2005). In this sense, the participants’ lessons provided insight into the mathematical concepts they aimed to develop with their students had they taught the lesson. In our view, developing a lesson plan focused participants’ attention on teaching but without the press of moment-to-moment responses to live classroom situations that are not always under a teacher’s control.
We chose to use a lesson planning task we designed rather than other, existing measures of teaching competence (e.g., edTPA or Praxis) because existing measures do not align as closely to the mathematics concepts encountered by the research participants during the mathematics courses. If we hoped to find relationships between teacher preparation and teaching competence, our best chance was to use an outcome measure and scoring rubric tightly aligned, both in topic and context, with the SCK studied in the two courses. This is consistent with all of the hypotheses in the theory of PSTs’ acquisition of usable and applicable knowledge (see Table 1).
Although the lesson planning task was not like tasks participants encountered in the content courses, it required SCK of the same topics and of the same kind. For example, the lesson planning task required applying concepts from the three categories of SCK, concepts with which PSTs were familiar (Hypothesis 1, Table 1). In addition, the scoring rubric for the task aligned with the SCK for each topic studied in the content courses (Hypotheses 1 and 2, Table 1).
What was the task?
The lesson planning task is best described by presenting an example. The task for Multiplying Two-Digit Whole Numbers was, verbatim, as follows:
Suppose you are going to teach a unit to help students achieve the following learning goal: Learning Goal: Students will understand the key concepts underlying the multiplication of two-digit numbers. (Note: Another way of saying this is that students will develop a conceptual understanding of multiplication of two-digit numbers.) Furthermore, suppose your textbook has proposed that the following would be a good “target” problem to begin with: Target Problem: Solve the problem 11 × 12 = ? You may assume that your students are ready to begin learning about multiplication of two-digit numbers. In other words, they have already studied multiplication with one-digit numbers, and they have already begun studying two-digit numbers. But, they have not yet begun to study multiplication of two-digit numbers.
We will refer to the above part of the task as the statement of the task. Following the statement of the task, four questions appeared:
“Question 1: Suppose you can afford to spend up to 30 minutes on the Target Problem. Provide a brief outline or overview describing how you would facilitate students’ work on the Target Problem. What would you do first, second, third, etc., and what would your students be doing at each point?” Participants wrote their responses in a two-column table where the columns were labeled “What I would do” and “During this time, my students would be . . . .”
“Question 2: What particular strategies or representations, if any, would you want to make sure that all your students saw at some point during the lesson?
Describe each strategy or representation in detail, or draw it by hand. If none, write ‘None.’ For each strategy or representation that you describe, explain why you would want to make sure that it was seen by all of your students. In other words, how would seeing this strategy or representation help your students achieve the learning goal?”
“Question 3: Recall that your learning goal was [the learning goal was restated here]. One way teachers assess whether students have achieved a learning goal is to watch them and/or listen to them carefully during class. Describe up to three specific things you would be on the ‘lookout’ for during the lesson that would help you figure out whether or not students were making progress toward achieving the learning goal. Explain specifically what each of these would tell you about your students’ achievement of the learning goal.”
“Question 4: Another way teachers assess whether students have achieved a learning goal is to give them an assessment at the end of class.
If you could give students ONE problem at the end of class to assess their achievement of the learning goal, what would that problem be? Explain why you chose this problem. Why would students’ work on this problem help you figure out whether they achieved the learning goal?”
Questions 1-4 were identical for all four topics. Only the statement of the task differed for each topic. Table 2 shows the statement of the task for the remaining three topics.
Statement of the Task for the Remaining Three Topics

Each task specified a target problem around which the participants were asked to design their lesson. The problems were chosen, not because they are the best problems with which to introduce each mathematics topic but because they would allow the graduates to display the SCK emphasized in the courses in a context similar (though not identical) to those used in the courses to learn SCK (Hypotheses 1 and 3, Table 1). We investigated whether the graduates would identify and develop in their plans the key concepts taught in the first two content courses and that underlie the solution strategies for each of these problems.
The lesson planning task was mailed to participants during the summer after their second and third years beyond graduation, and they were asked to return the task by mail by a pre-set deadline. They were free to use any resources they wished.
Coding and Reliability
Consistent with Hypothesis 1 in the theory of PST learning, we developed a rubric for each of the three topics covered in the courses that accounted for the SCK associated with each topic. We coded the participants’ lesson plans for whether they identified and developed key concepts from the categories of SCK described earlier. We did not code for the quality of the pedagogy described or implied in their lesson plans. Pedagogy is developed directly in the mathematics methods course; we were interested in the SCK developed in the two content courses. We hypothesized that if there were relationships between PSTs’ acquisition of SCK in the content courses and their use of this knowledge as graduates, the relationships would appear in the identification and development of these concepts in their lesson plans (see Table 1).
Key concepts for each topic
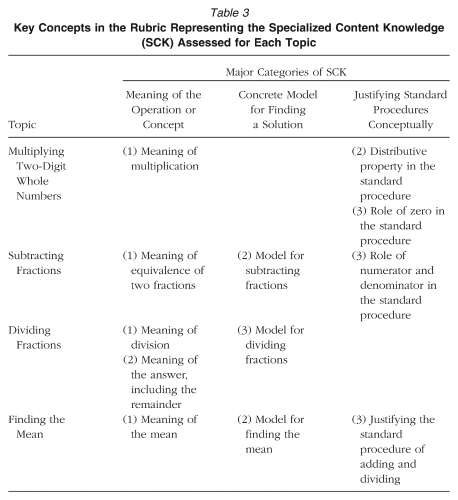
We began the process of developing the scoring rubric by using the three major categories of SCK that provide meaning for the target topics and are developed in the first two content courses: (1) developing the meaning of concepts involved in learning the topic; (2) choosing representations, like concrete models or pictures, for finding solutions to problems involving these concepts; and (3) justifying the standard procedure that usually is taught in U.S. elementary schools. Note that these categories are the same three categories used earlier to define SCK. For each topic, we then examined the curriculum of each course to identify three key concepts per topic—one key concept within each category of SCK—to create somewhat parallel demands for each topic’s task.
As mentioned above, the content courses engaged participants in somewhat different instructional activities for different topics, made some key concepts more explicit than others, and spent more time on some key concepts than others, so it was not possible to identify one key concept per category of SCK. For multiplication, no time was spent in the courses developing a concrete model for Multiplying Two-Digit Whole Numbers. Time was spent using concrete models for multiplication (e.g., single digit multiplication), but because concrete modeling of the algorithm is usually cumbersome when the multiplier and multiplicand are both multi-digit numbers, no time was spent with concrete models on these problems. Instead, more time was spent in the first content course developing a conceptual justification for the standard procedure for Multiplying Two-Digit Whole Numbers. For Subtracting Fractions, one key concept was identified within each category. For Dividing Fractions, the second content course was designed knowing that the standard procedure is not emphasized in K-6 school mathematics. Although the standard procedure was examined briefly in the second course, more time was spent developing meaning for division (e.g., division can take on several different meanings with fractions, and if a remainder is obtained when dividing, it has a particular meaning that emerges directly from the meaning of division) and representing division problems with concrete models. Rubrics were developed for each target topic that reflected these differences in course emphases. Again, the theory of PST learning (see Table 1) predicted relationships between those key concepts studied in the two content courses and use of those concepts in the lesson plans written by graduates of the program.
Because Finding the Mean is not covered in the courses, we needed to use a somewhat different procedure to create a rubric. To develop a rubric that placed similar demands on participants, we began as we did for the target topics, by considering the three major categories of SCK we identified: (1) meaning of the concepts, (2) concrete models for finding solutions to problems involving the concepts, and (3) justifying the standard procedure that usually is taught in U.S. elementary schools. We then filled out the rubric by triangulating across the following two data sources.
First, information from experts was gathered by asking eight mathematics educators to answer the question “What are the key concepts that underlie the standard procedure for finding the mean (i.e., add the numbers and divide by the number of numbers)?” Examining this information helped us develop our description of three key concepts. Second, further refinement was achieved by consulting the literature on finding the mean. We studied literature that identifies conceptual obstacles for students who are learning to find the mean, concepts of the mean that should be introduced to students, or concepts and models that have been shown to help students understand the procedure for finding the mean. Three primary sources were used: the popular standards-based curriculum Connected Mathematics Project (Lappan, Phillips, Fey, & Friel, 2013), the review on statistics education by Shaughnessy (2007), and a proposal on concepts underlying the mean that should be presented in the classroom (Watier, Lamontagne, & Chartier, 2011).
Table 3 summarizes the key concepts constituting the rubric for each topic. For all rubrics, features of SCK identified earlier were prominent (developing conceptual meaning for each topic, choosing representations for finding solutions, and justifying why standard arithmetic procedures work). In addition, we intended to create rubrics that, for the target topics, captured the key concepts for each topic and reflected the relative emphasis in the two content courses. For the control topic, Finding the Mean, we aimed to create a rubric that captured key concepts for Finding the Mean and made SCK demands on the participants similar to those of the target topics. We acknowledge, however, that developing completely parallel rubrics is not possible. That we have no course curriculum to draw from for Finding the Mean, together with the different emphases across topics taught in the courses, makes it difficult to create parallel rubrics. Nevertheless, we believe the rubrics fairly capture the SCK participants must use to develop lesson plans that help students achieve the learning goal.
Key Concepts in the Rubric Representing the Specialized Content Knowledge (SCK) Assessed for Each Topic
Scoring and reliability
We defined scores of 0, 1, and 2 to describe how fully or completely the participants described each of the three key concepts for each topic. In general, 0 meant the participant did not mention the concept or labeled the concept but did not develop it; 1 meant the participant partially developed the concept but left out important aspects; and 2 meant the participant attended to most or all of the central ideas in developing the concept in the lesson plan. The lesson plans were read several times by two coders to refine the scores of 0, 1, and 2 for each key concept. Complete descriptions of the rubrics and detailed definitions used for assigning 0, 1, and 2 for each key concept are shown in Appendix A. Examples of participants’ responses that illustrate the three major categories of SCK that were used in the rubrics (shown in Table 3) and the scoring of sample responses are shown in Appendix B.
For each topic, a participant’s responses to Questions 1-4 of the lesson planning task were coded as a set; that is, the participant’s entire lesson plan was read and then assigned a score of 0, 1, or 2 for each of the three key concepts. A total score for each topic was calculated for each participant. For each topic, total scores could range from 0 to 6 (0 to 2 for each of the three key concepts).
The first author carried out the final coding of the data. To calculate reliability, two coders coded at least 50% of the responses for each topic. Reliability for each of the 12 key concepts (3 per topic) was calculated as the number of agreements divided by the number of codes applied. Interrater reliability ranged from 87% to 100% for all key concepts.
Potential Bias Due to Authors’ Roles in the Preparation Program
Because the participants are graduates of a teacher preparation program in which we teach, it is important to understand our relationship to the participants and how this might have affected the results. The first author probably taught some of the participants in the first or second content course; the second author taught none of the participants during their program. The first author did not know the identity of the participants while coding the data because participants’ responses were blinded by project staff when they arrived by mail and assigned code numbers. All communication with participants (including asking graduates to participate, communicating with participants about completing this task, and communicating with participants about their teaching and PD experiences) was handled by project staff.
Although we included these safeguards against knowingly biasing the results, we are intimately involved in the preparation program so we considered how our personal subjectivity might have affected the research process and the results. As described by Peshkin (1988), subjectivity can be both a benefit and a detriment. It can provide researchers with unique knowledge that enables a more productive investigation, but it also can be a “trap” that seduces researchers into seeing what they want to see (Peshkin, 1988, p. 20).
In our case, a benefit of our knowledge is that we were aware of the theory of PST learning that guided the construction and evolution of the courses. The first author had also taught the two content courses multiple times and knew how each target topic was developed in the lesson plans for each course, what concepts were worked on with PSTs, and how much emphasis was given to each one in the lesson plans. This knowledge was used to develop the lesson planning task and to create the scoring rubrics built on the specification of the key concepts in the lesson plans.
The potential bias introduced by our subjectivity cannot be “exorcised”; it can only be managed (Peshkin, 1988, p. 20). As described earlier, if we hoped to find relationships between teacher preparation and teaching competence, our best chance was to use an outcome measure and scoring rubric tightly aligned, both in topic and context, with the SCK studied in the mathematics courses. This meant using a locally developed measure and rubric rather than an existing measure of teaching competence. We made an effort to manage our subjectivity related to this potential source of bias in several ways. First, we designed tasks and a scoring rubric for each topic that were as parallel as possible in terms of the demands they placed on participants’ SCK (Table 2, Table 3, and Appendix A). Second, we present the scoring rubric in full (Appendix A) and illustrate how it was applied (Appendix B) so readers can judge for themselves how potential inequities in the rubric could have influenced the results. Finally, we double-coded many of the responses and calculated intercoder reliability to ensure coding could be achieved by following the rubric, as presented (Appendix A), rather than by relying on implicit knowledge not publicly expressed.
Results
Results Addressing Research Question 1
When completing a lesson planning task, are there differences in the participants’ specification and development of key concepts for three mathematics topics they studied in the courses compared with a topic they did not study?
The results revealed graduates were more likely to develop key mathematical concepts for the learning goal in their lesson plans for the target topics than the control topic. The means of the total scores for each topic are shown in Table 4.
Participants’ Mean Scores on Lesson Planning Task by Topic (n = 27)
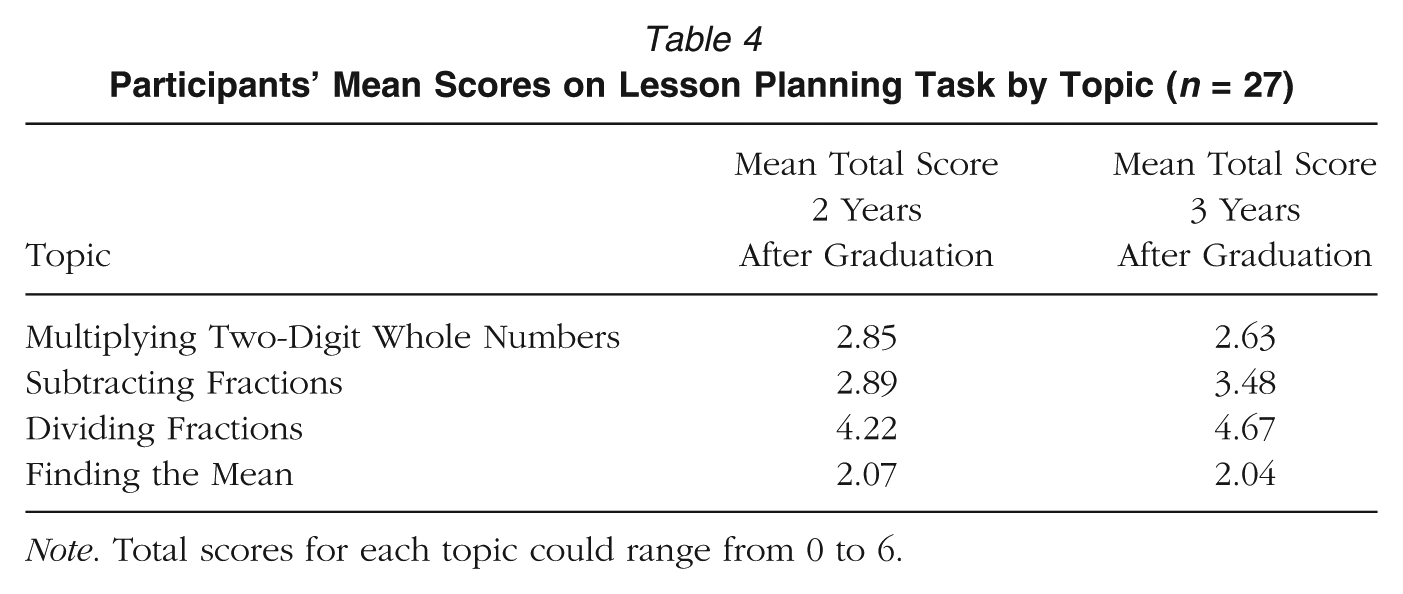
Note. Total scores for each topic could range from 0 to 6.
Two years after graduation, there were significant differences among participants’ total scores for the four topics (χ2 = 22.657, df = 3, p < .001; Friedman test). Using follow-up Wilcoxon signed rank tests with a Bonferroni correction to decrease the likelihood of a Type 1 error, the scores for the target topic of Dividing Fractions were significantly higher than the scores for the control topic of Finding the Mean (z = 3.848, p < .001). Three years after graduation, the overall comparison among the four topics was again statistically significant (χ2 = 30.926, df = 3, p < .001). The scores for the target topics of Dividing Fractions and Subtracting Fractions were significantly higher than the scores for Finding the Mean (z = 3.850 and z = 2.985, respectively, with p < .001 and p = .003, respectively). Thus, for both years, scores for at least one of the target topics were significantly higher than the scores for the control topic. As predicted, this finding suggests participants were more likely to use the key concepts to create their lesson plans if they had studied these concepts, even 5-6 years earlier, than if they had not studied the concepts.
Was there any evidence of a relationship between the emphasis on SCK in the two courses and graduates’ treatment of the control topic? The development of SCK in the two courses includes developing meaning for concepts, choosing and using concrete models, and justifying standard procedures conceptually (see Table 3). Was there evidence graduates attempted to incorporate these kinds of knowledge into the lesson plans for the topic not covered in the program? Or were there qualitative differences, as well as quantitative differences, in how they treated the control topic? For example, did they emphasize key concepts in the target topics but plan to teach in a rule-oriented way (e.g., teaching the standard procedure step-by-step) for the control topic?
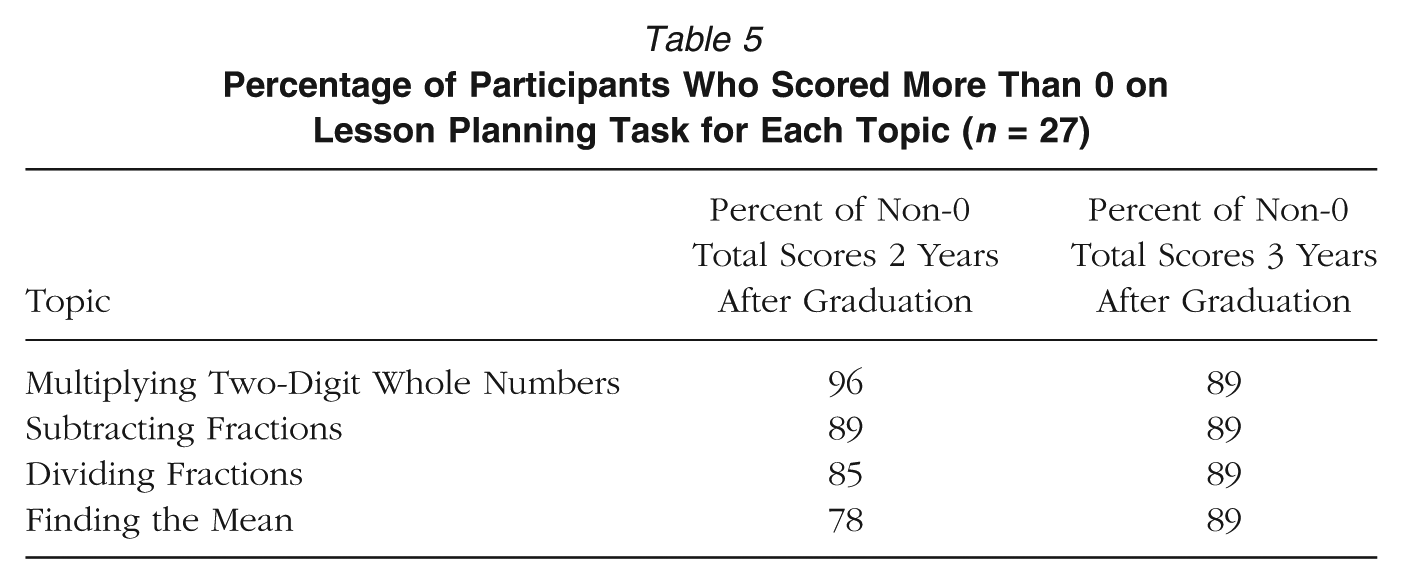
To investigate these questions, we examined the percentage of participants who did not score 0 for a topic. A total score of 0 indicated the participant wrote a lesson plan with no development of any of the key concepts. As shown in Table 5, in Years 2 and 3, respectively, 78% and 89% of the participants attempted to develop at least one of the key concepts for the control topic. This suggests they were not just planning to teach execution of the standard procedure for finding the mean. Indeed, the percentage of non-0 scores for the control topic was comparable to the percentages for the three target topics. Thus, although the significantly lower scores suggest graduates did not identify and develop the key concepts for the control topic as completely as for some of the target topics, the emphasis on SCK in the courses might have influenced their development of the control topic in the sense that graduates typically made some attempt to teach finding the mean conceptually.
Percentage of Participants Who Scored More Than 0 on Lesson Planning Task for Each Topic (n = 27)
Results Addressing Research Question 2
Is there a relationship between the emphases with which key mathematics concepts within each topic were treated in the courses and participants’ specification and development of these concepts when completing a lesson planning task for that topic?
As predicted by the theory of PSTs’ learning (see Table 1), graduates’ use of key concepts in creating the lesson plans should be related to opportunities to learn the concepts for each topic during the courses. It seems likely that how deeply graduates learned a concept is related to how intensively it was emphasized in the two mathematics content courses. Consequently, we were interested in the relationship between the opportunities to learn key concepts within each topic and graduates’ use of the concepts when planning a lesson. Recall that we can complete this analysis because, from examining the lesson plans for the two courses, we know in how many lessons participants encountered each key concept. For the three target topics, Table 6 compares participants’ scores for each of the key concepts with the opportunities to learn the concepts in the content courses. Recall that key concept scores can range from 0 to 2.
Participants’ Mean Key Concept Scores Within Each Topic on Lesson Planning Task and Level of Course Coverage of Those Concepts (n = 27)

Note. Key concept scores can range from 0 to 2. One asterisk means the concept was covered in one lesson within one course. Two asterisks indicate the concept was covered in several (three or more) lessons within one course. Three asterisks indicate the concept was covered in several lessons in both courses.
In the second column of Table 6, level of course coverage for each of the key concepts is indicated by one, two, or three asterisks. One asterisk means the key concept was covered in one lesson within one course (the first or second content course). Two asterisks indicate the concept was covered in several (three or more) lessons within one course. Three asterisks indicate the concept was covered in several lessons in both courses.
For the data in Table 6 for Multiplying Two-Digit Whole Numbers, Friedman tests revealed significant differences among key concept scores for each year (Year 2: χ2 = 32.449, df = 2, p < .001; Year 3: χ2 = 32.759, df = 2, p < .001). Wilcoxon signed rank tests revealed that 2 years after graduation, the Meaning of Multiplication and the Distributive Property key concept scores were both significantly higher than the Zero key concept scores (z = 4.291 and z = 4.347, respectively; both p < .001). That is, scores for the key concept that was covered in one lesson within a single course were significantly lower than the scores for a concept that was covered in several lessons within a single course and significantly lower than the scores for a concept that was covered in several lessons in two courses.
Three years after graduation, all pairwise comparisons of key concept scores for Multiplying Two-Digit Whole Numbers were significantly different (all p values were less than or equal to .001). The findings for both years signal a relationship within this topic between the amount of time spent on a key concept and the graduates’ development of the concept in their lesson plans.
The Friedman test comparing the Subtracting Fractions key concept scores was significant for Year 2 (χ2 = 6.636, df = 2, p = .036). In Year 2, there was a significant difference between the scores for the Model for Subtracting Fractions and the Equivalence of Two Fractions (z = 2.379, p = .0167). Thus, the scores for a concept that was covered in several lessons in two courses were significantly higher than the scores for a concept that was covered in several lessons in one course. No significant differences were found for Year 3.
Finally, the Friedman tests comparing the Dividing Fractions key concept scores within each year were significant (Year 2: χ2 = 8.811, df = 2, p = .012; Year 3: χ2 = 11.556, df = 2, p = .003). In Year 2, there was a significant difference between the scores for the Meaning of Division and the Meaning of the Answer Including the Remainder (z = 2.495, p = .013). Consistent with our prediction, the findings in Year 2 showed a significant difference between the scores for a key concept that was covered in several lessons in two courses and the scores for a key concept that was covered in several lessons in one course. In Year 3, there was a significant difference between the scores for the Meaning of Division and the Model for Dividing Fractions (z = 2.598, p = .009), even though both constructs received three asterisks in our scoring system.
In summary, with one exception, when differences were found, they were consistent with our predictions. No relationships between level of course coverage and use of the key concepts were in the reverse direction. Not all differences were significant, but this could be explained simply by the fact that opportunities to learn a topic are not correlated perfectly with amount learned or remembered.
It is noteworthy that the number of lessons devoted to a mathematics topic in the courses might explain why Dividing Fractions, arguably the most difficult of the four topics, shows the highest performance. Returning to the data in Table 4, in Year 2, the total scores for Dividing Fractions were significantly higher than the total scores for Subtracting Fractions (z = 3.273, p = .001) and for Multiplying Two-Digit Whole Numbers (z = 2.672, p = .008). In Year 3, the total scores for Dividing Fractions were significantly higher than the total scores for Multiplying Two-Digit Whole Numbers (z = 3.850, p < .001).
A different analysis reveals a similar finding. Table 7 shows there were more high scorers for Dividing Fractions and this pattern was maintained over time. The more frequent use of the key concepts in planning the lesson for Dividing Fractions might reflect the fact that division of fractions received the most course coverage (see Table 6).
Percentage of Participants Who Received Each Total Score by Topic on Lesson Planning Task (n = 27)

Stability of Graduates’ Responses
Earlier we noted that we collected data on graduates both 2 and 3 years after graduation to check whether their use of the knowledge they acquired remained stable over time. We also noted that participants did not just copy their responses from Year 2 for Year 3; each participant submitted at least somewhat different lesson plans in Year 3 than in Year 2. Results showed total scores from Year 2 to Year 3 remained quite stable (Table 4). The total scores for each target topic were compared across years using Wilcoxon signed rank tests. The total scores for each topic did not significantly increase or decrease from Year 2 to Year 3 (using p < .05).
In order to determine if significant differences existed between each of the three key concept scores for each of the three target topics 2 years after graduation and 3 years after graduation, the scores in Table 6 were compared using Wilcoxon signed rank tests. No comparison was statistically significant; key concept scores for each of the target topics did not significantly increase or decrease from Year 2 to Year 3.
Could Other Factors Explain the Differences in Participants’ Responses?
One reason it is challenging to study the effects of a teacher preparation program is the difficulty of isolating the effects of the program (Diez, 2010). Many other factors might influence the performance of graduates as they move through the program and into the field. We already noted that the mathematics methods course taken by these participants is unlikely to have contributed to their scores on the lesson planning task. We can identify three more alternative explanations for the results just reported: PSTs might enter the program already performing better on some topics than others; after graduating, more participants might teach some topics than others and thereby improve their ability to plan lessons on these topics; and more graduates might receive PD on some topics than others, an activity that might boost their performance on the lesson planning task.
Do PSTs enter the program already performing better on some topics?
To test the hypothesis that the differences in performance on the lesson planning task reflected the entry-level performances of our participants, we administered the lesson planning task to a separate cohort of freshmen, just beginning the first of the two relevant content courses. Of the 71 students taking the course for the first time, 50 were randomly selected and invited to complete the lesson planning task during a 2-hour session. According to normal procedures in the content courses, students participating in research projects, like this one, receive course points. Of the 50 invitees, 35 accepted the invitation and constituted the sample for this aspect of the study.
Responses were coded with the same rubric used to code graduates’ responses (see Appendix A). For entering PSTs, mean total scores (out of six) for each topic were as follows: Multiplying Two-Digit Whole Numbers, 0.71; Subtracting Fractions, 0.37; Dividing Fractions, 0.00; and Finding the Mean, 0.03. There were significant differences among the total scores for the four topics (χ2 = 29.87, df = 3, p < .001; Friedman test). The scores for Multiplying Two-Digit Whole Numbers were significantly higher than the scores for Dividing Fractions (z = 3.48, p < .001) and the scores for Finding the Mean (z = 3.36, p = .001). No other pairwise comparisons were significantly different.
Clearly, entering freshmen did not perform well on any of the four topics. The only significant difference was higher performance on Multiplying Two-Digit Whole Numbers, a topic for which fewer learning opportunities were presented in the courses than for Dividing Fractions and a topic that did not show superior performance after graduation. In general, graduates’ higher performance on target topics than on the control topic 2 and 3 years after graduation cannot be explained by the hypothesis that they begin the program already performing better on target topics.
Graduates performed significantly better 2 and 3 years after graduation on all the topics than did the entering PSTs before beginning the program (Mann-Whitney U tests for independent samples, p < .001 for all eight comparisons of graduates’ Year 2 and Year 3 total scores for each topic, respectively, with entering PSTs’ total scores for each topic). It is interesting that the significantly better performance after graduation includes the control topic as well as the target topics. This result is consistent with the data in Table 5; even though finding the mean was not taught in the program and graduates performed relatively poorly on this topic compared to the target topics, they might have used some knowledge from the courses to support a more conceptual approach to planning a lesson for this (new) control topic.
Does teaching experience explain better performance on the target topics?
To test the hypothesis that teaching can explain the higher performance on the target topics than the control topic, we compared the number of participants who taught each topic. These data were collected by asking each participant which of the four topics, if any, they taught during Years 1, 2, and/or 3 after graduation.
Participants completed the Year 2 and Year 3 lesson planning task shortly after the completion of the Year 2 and Year 3 academic years, respectively. Therefore, we formed teaching and nonteaching groups by reasoning as follows. Participants’ scores for a topic on the Year 2 lesson planning task could be affected by teaching experience if they taught the topic in Year 1 and/or Year 2. Participants’ scores for a topic on the Year 3 lesson planning task could be affected by teaching experience if they taught the topic in Years 1, 2, and/or 3. Therefore, we created two groups of participants who taught each topic—those who taught the topic in Years 1 and/or 2 and those who taught the topic in Years 1, 2, and/or 3. This means the teaching group for Year 3 included participants who taught the topic during Years 1 and/or 2 plus those who taught the topic during Year 3.
Table 8 shows the number of participants who taught each topic at least once before completing the lesson planning task in Year 2 and Year 3, respectively. The alternative hypothesis that teaching is a primary cause of the higher performance on the target topics than the control topic would be supported if significantly more participants taught the target topics than the control topic. The hypothesis was not supported: Statistical tests are not needed to see that more participants did not teach the target topics than the control topic prior to the completion of both the Year 2 and Year 3 lesson planning tasks. In fact, for both years, the topic taught by the most participants was Finding the Mean.
Number of Participants Who Taught Each Topic at Least Once Before Completing the Lesson Planning Tasks in Years 2 and 3 (n = 27)
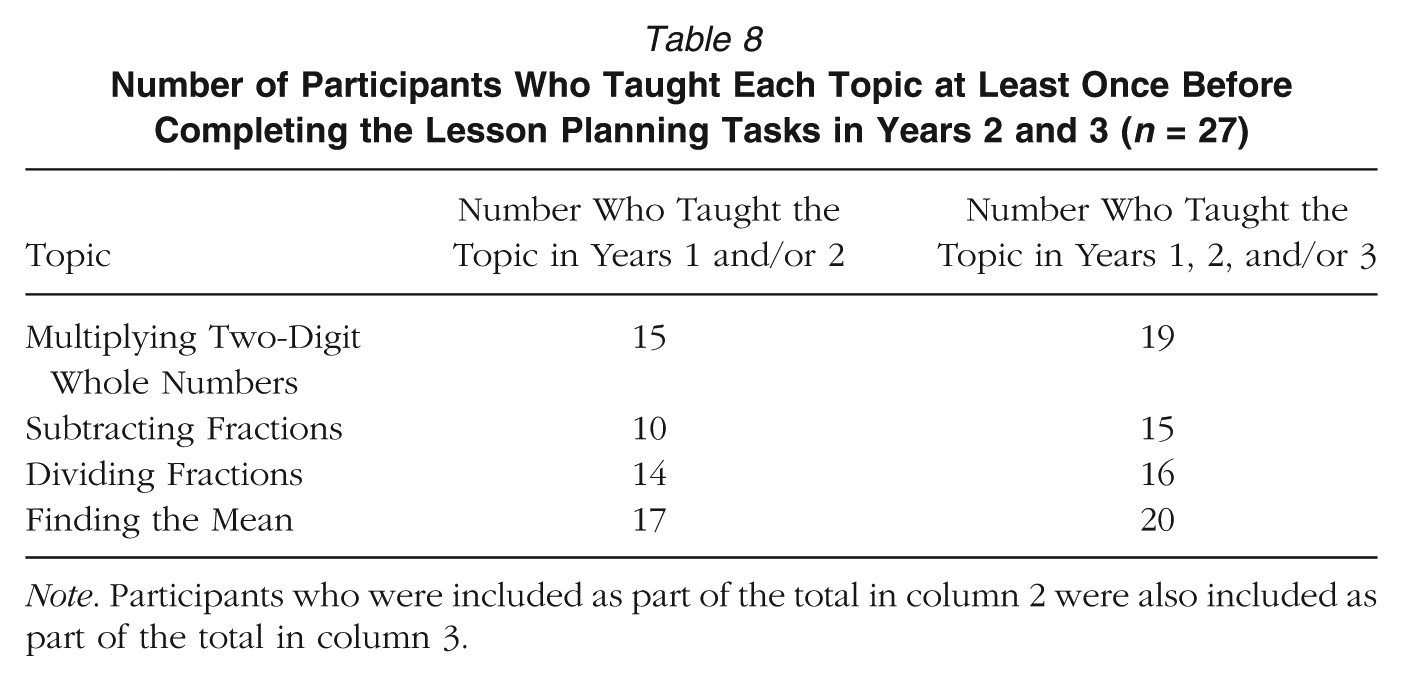
Note. Participants who were included as part of the total in column 2 were also included as part of the total in column 3.
One additional frequency count is useful. There were 14 participants who taught a topic for the first time in Year 3. If participants’ teaching of a topic strongly affected their performance on the lesson planning task (and therefore is a primary factor explaining the differences in performance between the target and control topics), then it is reasonable to expect that these 14 participants should have scored higher in Year 3 than in Year 2 on the lesson planning task for the taught topic. The total scores (0 to 6) across years for the taught topic yield the following counts: 7 participants scored higher on the task after they taught the topic, 3 participants scored the same, and 4 participants scored lower. So half the participants scored higher after they taught a topic for the first time, and half the participants scored the same or lower after they taught a topic for the first time. Although we cannot conclude that teaching experience has no effect on lesson planning in general, the participants’ teaching experiences in this study cannot be the primary explanation for the differences we found in their lesson planning performance.
Does PD explain better performance on the target topics?
To test the hypothesis that PD can account for the higher performance we found on the target topics than the control topic, we compared the number of participants who had PD for each topic. These data were collected by asking each participant whether he or she received PD on any of the topics during Years 1, 2, and/or 3 after graduation. PD and non-PD groups were then formed using the same logic described above for the teaching data.
As the second and fourth columns of Table 9 show, a small number of participants received PD on the four topics. However, unlike the teaching data, more participants received PD for two of the target topics than the control topic. Can this explain the finding that the total scores for the control topic were significantly lower than the total scores for target topics?
Number of Participants (Out of 27) Who Received PD on Each Topic and Mean Total Scores for the Full Sample (n = 27) Compared to Mean Total Scores for Participants Who Did Not Receive PD on That Topic Before They Completed the Task

Note. Participants who were included as part of the total in column 2 were also included as part of the total in column 4.
To investigate this question, we compared the means of the total scores for the full sample of participants (as shown earlier in Table 4) and the means of the total scores for participants who did not receive PD (the non-PD group). We took this approach because so few participants received PD; statistical tests comparing the scores of the PD groups with the scores of the non-PD groups would not be meaningful. Although PD occurred for so few participants that their scores were unlikely to have a substantial effect on the mean of the scores of the full sample, we focused on participants who did not have PD to verify that this was the case (see the third and fifth columns of Table 9).
Statistical tests comparing the full sample with the non-PD group are inappropriate because the non-PD group is a proper subset of the full sample. Notice, however, that for each topic in each year, the mean score for the full sample is nearly identical to the mean score for the non-PD group (which is to be expected given the low numbers who had PD). The largest difference between full sample and non-PD sample performance is for Dividing Fractions in Year 2 (4.22 vs. 4.00, respectively). Although this difference is worth noting, it cannot explain the difference in the full-sample performance between Dividing Fractions and Finding the Mean. One indication of this is shown by removing the effects of PD by comparing across the two topics the mean scores for participants who had no PD experiences for that topic. If PD was responsible for the differences in performance, then the scores for the non-PD participants (those for whom PD could not have had an effect) for Dividing Fractions and Finding the Mean should be similar. However, note the substantial difference between non-PD participants’ scores for Dividing Fractions (4.00) and Finding the Mean (2.12) (see third column, Table 9). The fact that the difference between these scores is similar to the difference between the scores for the full sample (4.22 vs. 2.07) suggests PD was not the primary driver for the performance differences we found for the full sample.
We pursued the plausibility of the PD hypothesis further by carrying out the same qualitative analysis that we conducted to check the teaching hypothesis: We examined the participants who received PD only during Year 3. If the participants’ PD experiences strongly affected lesson planning performance, we should see an increase in their scores from Year 2 to Year 3. The numbers of participants and their scores (0 to 6) in Years 2 and 3, respectively, for each topic are as follows: Multiplying Two-Digit Whole Numbers, 1 participant—0, 2; Subtracting Fractions, 1 participant—6, 4; Dividing Fractions, 1 participant—6, 6; and Finding the Mean, 2 participants—5, 2, and 2, 2. Only one of the five Year 3 scores was higher after PD; four of the five scores were either lower or the same after PD.
Again, although we cannot completely rule out the possibility that PD might have had some effect on participants’ scores, it is clear that PD could not be the principal explanation for the performance differences in lesson planning between the target topics and the control topic. Of the explanations we have explored, we are left with teacher preparation as the most plausible.
Discussion
The results of this study showed that participants attended more often and more completely to the key concepts when completing a lesson planning task for topics covered in the mathematics content courses for elementary PSTs than for a topic not covered in the courses. The more opportunities to learn a concept in the courses, the more likely participants were to use that concept in planning a lesson. These relationships were found 5 to 6 years after participants took these courses.
It is impossible to conclude that studying these topics in the content courses caused the better performance on the lesson planning task. There are too many intervening experiences that were not controlled, and are not even known, to draw a cause-effect conclusion (Diez, 2010). However, we considered several possible alternative explanations, none of which appeared to explain the performance differences: participants’ experience in the mathematics methods course, knowledge of PSTs as beginning freshmen in the program, experience teaching the topics as teachers, and PD received after graduation.
Is it possible other experiences in the preparation program contributed to graduates’ better performance on the target topics? Of course, we cannot rule out this possibility. We are, however, unaware of any experiences outside of the two content courses, in which a large number of our participants engaged, that involved studying the conceptual basis for these particular topics. A second reason for viewing the courses as the most plausible explanation for the differences emerges from the theory of PSTs’ learning of useable knowledge (see our predictions based on Hypotheses 2 and 3, Table 1). Based on well-developed theories of learning, the topic-specific and context-specific hypotheses suggest that relationships would most likely be found between the treatment of these particular topics in the two content courses and use of the knowledge acquired from the courses on a similar kind of task assessing similar knowledge.
We need to acknowledge, however, that Hypothesis 2 might need to be refined. Table 5 suggests that, although graduates did not identify and develop the key concepts for the control topic as completely as for some of the target topics, the emphasis on SCK in the courses might have influenced their effort to develop a conceptual lesson for the control topic. Graduates typically made some attempt to plan a conceptual lesson for finding the mean. In addition, graduates performed significantly better 2 and 3 years after graduation on the control topic than entering PSTs before beginning the program.
What could have improved participants’ performance on the control topic? The three major categories of SCK shown in Table 3—developing the meaning of an operation or concept, creating concrete models for finding solutions, and justifying standard procedures conceptually—were emphasized heavily in the content courses. Based on their scores for Finding the Mean, graduates tried to address one or more of these categories but apparently did not have SCK specifically about the control topic that would allow them to identify and develop key concepts as well as for the target topics. Perhaps their efforts to plan a lesson that attended to some of the relevant concepts were encouraged by the fact that the lesson planning task was contextually similar to many of the tasks encountered in the two courses. For whatever reason, graduates might have acquired the desire to develop conceptually based lessons by applying their knowledge of the three categories but did not know enough about the topic to do so as successfully.
Because we wanted to maximize the chances we would find a relationship between teacher preparation and teaching-related competencies, we let the theory of PSTs’ learning guide many of our decisions, including the focus on SCK found both in the content courses and in the dependent measure, the similarity of the tasks in the courses with the task used to measure their SCK postgraduation, the nature of the scoring rubric that aligned with the SCK developed in the courses, and the specificity with which we calculated the extent of learning opportunities, not only for the mathematics topics but for key individual concepts that comprise the topics. The fact that performance differences were found on the concepts studied in the courses and the fact that performance differences favored the concepts for which there were more learning opportunities in the courses point to the benefits of two features of research that investigate relationships in complex domains like teacher preparation. First, theory-driven research identifies relationships that are likely to be found. Second, precise measures of the constructs predicted to be related reduces the interference of nonrelevant factors.
To complete the story, we note that the average level of performance on the outcome measure for the topics studied in the courses was not especially high (2.6-4.7 out of 6.0). In addition, average performance on the topic not studied was approximately 2.0 out of 6.0. So studying a topic does not ensure high performance on teaching-related tasks years later and not studying a topic does not necessarily yield floor-level performance after graduation. In addition, we note that planning a lesson is only a piece of the competence teachers need to teach well. The full story of teacher preparation would need to include critical additional measures, such as implementing lesson plans.
Despite the limitations of this study, what do the findings we reported mean for teacher preparation? We offer two conjectures that seem worth considering. If these findings can be replicated with other teaching competencies, we believe they would have significant policy implications. First, if more opportunities to study a particular mathematics topic, and specific concepts within that topic, relate to the likelihood that graduates will use this knowledge to teach, then it might be that teacher educators will need to choose carefully how time is allocated during a preparation program. Performance was lower on topics and concepts to which less time was devoted and was not at ceiling even on topics that received considerable time and detailed attention. If teacher preparation is to make a difference in the way graduates teach, it might be that considerable time must be spent studying the knowledge and skills teacher educators want graduates to use.
If this conjecture is confirmed, then providing only a few learning opportunities on many topics, such as in survey courses, is of questionable value. In the courses involved in this study, many opportunities to learn apparently were needed for PSTs to understand a topic, and its key concepts, deeply enough to remember and use the knowledge years later. This means relatively few topics can be covered in these courses. This is the approach already advocated by some teacher educators who describe programs that focus on a relatively few “high leverage practices” (Ball & Forzani, 2009, 2011; Grossman et al., 2009; Lampert, 2009). The findings of this study add support for focusing teacher preparation on the small sets of knowledge and skills that most matter for beginning teachers.
A second conjecture is that the type of learning opportunities, not just the number of them, might be critical in helping PSTs apply what they learned several years after graduation. We do not want to underestimate the potential importance of focusing instructional activities on the concepts determined by unpacking each target topic, or the contextual similarity between the instructional activities provided in the courses (teaching-like tasks such as creating concrete models for arithmetic operations) and the lesson planning task used to assess their SCK. Future studies might test more directly the effect of the nature of instructional activities in these content courses.
Finally, we note that although the school subject we investigated in this study is mathematics, the key aspects of this study do not seem unique to mathematics. As long as the knowledge acquired about a subject can be specified at a level of detail to allow alignment between what PSTs are taught and how they are assessed in the field, there would be no reason why similar investigations could not be conducted in other subject domains. In fact, the findings we report could inform hypotheses to be tested in other school subjects.
Footnotes
Appendix A
Codes for Each Topic Area’s Key Concepts
Appendix B
Sample participant responses illustrating the major categories used in the rubrics (from Table 3), SCK shown in participants’ responses, and the scoring of those responses
From Participant A’s lesson plan:
[I would] set up 1¾ using fraction strips.
Students should also set up 1¾ using fraction strips. [I would] explain that division of fractions is to see how many times the second number (½) fits into the first (1¾). Students should have enough ½ strips to model the problem. [Next, I would] model by showing the students how many times ½ fits into 1. I would place the ½ pieces directly on top of the 1. ½ fits in 2 times. Students should be following along and modeling using their own fraction strips.
[Next, I would] ask the students to find how many times ½ will fit into ¾. Students will model using fraction strips. [I will] draw attention to how ½ fits in one whole time, but does not fit completely into the remaining ¼. Students should be discussing possible answers for the leftover piece.
[Next, I will] ask students how much of that ½ strip fits inside the remaining ¼. Students should note that ½ of that piece fits into ¼.
[Next I will say,] look at how many times ½ fit into 1¾. It was 2 + 1 + ½, or 3 ½ times total. Students should follow along when counting.
Using the fraction strips, the student can clearly see that ½ fits into 1¾, 3 ½ times.
[Something I would be on the lookout for during the lesson is that] when a piece does not fit completely (as ½ did not fit into the remaining ¼), students find the fraction that fits. Students demonstrate basic understanding of fractions (¼ is one half of ½) and acknowledge their understanding that a fraction of a fraction strip can fit and be part of the answer.
SCK displayed: The participant provides a conceptual explanation and uses visual representations to develop the meaning of the answer, including the remainder.
Coding of this response: The participant received a score of 2 for Meaning of the Answer, Including the Remainder. As described in the scoring rubric in Appendix A , the participant uses the repeated subtraction interpretation of the division sign and clearly explains that the quotient tells us how many copies of ½ fit into 1¾, that we first figure out three copies of ½ fit into 1¾, and that we then have to figure out how much of a copy of ½ fits into the remaining amount. The participant explains that ½ of ½ fits into ¼.
From Participant B’s lesson plan:
The first thing I would do is to make each of the numbers [in the data set in the target problem] using connecting blocks and lay it on a mat. Students would be making their own block mats. [The lesson plan shows a picture of students’ block mats:]
I would ask the students if there is a way to share the blocks evenly between all five groups. Students would be using their blocks to move them [around] more equally. Students would share their answers and how they got them.
[Next,] I would ask students to put all of the blocks together, then ask them to now split them into five groups. Students would use their blocks to put them all together and then use their mats to split them into five groups with three in each.
SCK displayed: The participant uses a model that maps directly to the standard procedure for finding the mean, which will help students connect the model to the procedure.
Next I would go back and ask the students what they did when they put the blocks together. [Students would say:] They added 4 + 0 + 2 + 5 + 4 = 15. Next, [I would ask] when we split them up what did we do. [Students would say:] We divided it into 5 equal groups. 15 ÷ 5 = 3. Finally I would ask the students to look at the [formula] “(4 + 0 + 2 + 5 + 4)/5 = 3” and explain that we found the average, which is the sum of all the parts divided by the number of groups. Students would look at the problem and explain what each part means . . . and why we did that.
I want students to see the individual groups
and how the first step of finding the average is to combine all of the pieces:
The second strategy is to see how and why you split it into groups. Even though one of the groups has 0, you still need to split it into 5 groups because that’s how many groups there are to equally share between.
When adding all of them together I want students to see by using the cubes that even though there is a formula for finding the mean that there is a reason for each step. If you want to find how many would be in each group if you spread it out equally, then the first step would be to combine the different pieces. Another strategy is representing dividing the total by how many groups there are. Since the students have the mats in front of them, it is easy for them to visualize splitting the 15 into those 5 separate groups. If they see this picture, then I think it will help them understand why they are dividing by 5.
I would look to see if [the students] can explain what each of the parts of the [formula] means: (4 + 0 + 2 + 5 + 4)/5 = 3. In order to be able to solve another problem they need to know what the parts mean because it will change in every problem. If they can explain that you add on the top to get the total of the parts and then you divide by the number of groups to spread it out evenly, then they understand the concept.
SCK displayed: The participant maps the concrete model to the standard procedure for finding the mean to justify why the procedure works and to develop meaning for the key concepts underlying the standard procedure.
Coding of this response: This response scored a 2 for Justifying the Standard Procedure of Adding and Dividing. As described in the scoring rubric in Appendix A , the participant explains that by adding or combining the numerical values of the data, we are finding the size of the whole that needs to be redistributed to each of the groups. By dividing by the number of groups, we are finding the size of each of the equal groups (partitioning division).
From Participant C’s lesson plan:
I would give students the problem 4/5 – 1/5 to solve with a partner. Fraction strips broken into fifths would be provided. Students would discuss how to take 1/5 away from 4/5 in pairs or small groups and then briefly share/explain how they solved it.
[Next,] I would present the target problem [4/5 – 1/2] for students to solve in groups and provide fraction strips for fifths and halves. Students would discuss and attempt to solve the problem using the given fraction strips. I would stop students shortly after to discuss their thinking, struggles, possible solutions, etc. Students would hopefully share that they struggled to figure out how to take away ½ from 4/5 because they were different size pieces. . . . I would then present students with fraction strips broken into tenths to support them in solving the problem. Using the fraction strips and/or pictures, students work in groups to solve the problem, showing how 4/5 is equivalent to 8/10 and ½ is equivalent to 5/10. Once you have the same size pieces to work with and equivalent representations of the original fractions, you can solve effectively, getting 3/10. . . .
[The particular strategies or representations I would want to make sure all my students saw at some point during the lesson:] [I want them all to see] fraction strips: Make equivalent fractions so that you are working with same size pieces:
This is a great visual representation of how the fractions relate to each other. It shows the significance of needing same size pieces as well as how you can equivalently represent the same fractions using different size pieces. This visual supports the conceptual reasoning that I think would help students achieve the learning goal. . . .
[Something specific I would be on the lookout for during the lesson would be] students taking away half of 4/5. For example, 4/5 – ½ = 2/5 because 2 is half of 4. This would show that the student has not met the learning goal and their misconception needs to be addressed. It is 4/5 of a whole minus 1/2 of a whole.
SCK displayed: The participant has chosen a concrete model for finding the solution to an arithmetic problem that involves the key concepts involved in achieving the targeted learning goal (i.e., “Students will understand the key concepts underlying subtraction of fractions”).
Coding: This response scored a 2 for Model for Subtracting Fractions. As described in Appendix A , the participant solves the problem with a model, the model involves the same “one” or “whole” throughout the modeling, and the participant shows or explains how to obtain the answer 3/10 from the model.
Notes
A
J