
Abstract
There is mounting evidence of substantial “teacher quality gaps” (TQGs) between advantaged and disadvantaged students but practically no empirical evidence about their history. We use longitudinal data on public school students, teachers, and schools from two states—North Carolina and Washington—to provide a descriptive history of the evolution of TQGs in these states. We find that TQGs exist in every year in each state, and for all measures, we consider student disadvantage and teacher quality. But there is variation in the magnitudes and sources of TQGs over time, between the two states, and depending on the measure of student disadvantage and teacher quality.
Introduction
Income inequality has risen dramatically in the United States over the past 5 decades, and disparities in educational outcomes are likely a contributing factor to this trend. Many look to the public education system to close the achievement gaps that exist between advantaged and disadvantaged students when they start kindergarten (Lee & Burkam, 2002), but research on the extent to which schools are able to level the playing field is disheartening. 1 Although there is evidence that schooling interventions—the impact of teachers in particular (Chetty, Friedman, & Rockoff, 2014b; Rivkin, Hanushek, & Kain, 2005; Rockoff, 2004)—could help close these gaps, they often do not because teacher quality itself is inequitably distributed across students.
Research has long shown that disadvantaged students are more likely to have “low quality” teachers—as measured by degrees, experience, and advanced credentials—than more advantaged students (e.g., Clotfelter, Ladd, & Vigdor, 2005; Kalogrides & Loeb, 2013; Lankford, Loeb, & Wyckoff, 2002). More recent work also shows considerable inequity when teacher quality is measured using direct “value-added” measures of teacher effectiveness (e.g., Goldhaber, Lavery, & Theobald, 2015; Isenberg et al., 2013; Sass, Hannaway, Xu, Figlio, & Feng, 2010), though some recent studies suggest that the distribution of teacher effectiveness may be more equitable than this prior work suggests (e.g., Chetty et al., 2014b; Isenberg et al., 2016).
In response to mounting evidence of the importance of teachers and the existence of “teacher quality gaps” (TQGs), the federal government recently directed states to develop plans to reduce inequity in the distribution of teacher quality across public schools (Rich, 2014). Unfortunately, states are forced to develop these plans in what is close to an empirical vacuum about the history of these TQGs. That is, existing studies of TQGs represent snapshots in time and provide virtually no information about the sources of these gaps and how they have changed over time. This gap in our empirical knowledge is problematic because the means of addressing teacher inequity depend fundamentally on the source of this inequity. Moreover, understanding the variation in teacher quality gaps over time is important because it suggests how malleable teacher quality gaps may be. Specifically, gaps that are more persistent over time are likely less malleable than the TQGs that vary more over time.
In this paper, we use longitudinal data on public school students, teachers, and schools from two “focal states”—North Carolina and Washington—to provide a descriptive history of the evolution and sources of TQGs. Data from these states include several different measures of teacher quality and student disadvantage that we use to calculate TQGs. Specifically, in each state, we can measure teacher quality in terms of teacher experience, licensure test scores, and value-added estimates of effectiveness. Likewise, we can categorize students in each state as disadvantaged if they are an economically disadvantaged student (EDS) or from an underrepresented minority (URM) group. 2
For each combination of teacher quality measure and student disadvantage measure, we calculate the corresponding TQG in each state and year as the average difference between disadvantaged and advantaged students in their exposure rates to low-quality teachers, for example, a novice teacher with fewer than 5 years of experience or a teacher in the lowest quartile of the distribution of licensure test scores or value-added. 3 Then we track the evolution of these TQGs in each state and investigate the extent to which each TQG is due to differences across districts and across schools within a district.
We find that TQGs are not a new problem; in fact, disadvantaged students in both states are more likely to be exposed to low-quality teachers in every year of available data (going back to the late 1980s in one case) and under every definition we consider of student disadvantage (poor or minority) and teacher quality (experience, licensure test scores, and value-added estimates of effectiveness). We also find variation in the magnitudes of different TQGs over time and between the two states as well as some important differences in the extent to which these TQGs are due to student and teacher sorting across districts, across schools within districts, and across classrooms within schools.
These results are important for several reasons. First, the descriptive evidence provided in this paper is timely: Recent high-profile research (e.g., Isenberg et al., 2016) has cast doubt on the extent to which TQGs between advantaged and disadvantaged students exist, which calls into question whether addressing TQGs is an important policy focus. We believe that our findings—and importantly, the fact that our findings are robust across different measures of teacher quality and student disadvantage—validate the recent concern (and federal initiative) about the equity of the distribution of teacher quality. 4
Our investigation of the degree to which TQGs are driven by the allocation of teachers and students within districts is also important because the policy levers that one might utilize to address TQGs varies depending on the source of the gaps. We find that TQGs in Washington are largely driven by differences across different districts. Our findings relate directly to an ongoing debate in Washington about school funding (McCleary, et al. v. State of Washington), which is focused in no small part on differences between districts in the ability to attract and retain high-quality teachers. 5 Likewise, our finding that TQGs in North Carolina are largely driven by differences within districts suggests that policymakers looking to close teacher quality gaps in North Carolina should focus on district-level interventions.
The paper proceeds as follows. We review the prior literature that informs this study, describe our data and analytic approach, and then present our results. In the final section, we discuss implications for policy and directions for future research.
Prior Work
Our primary objective is to document the evolution of TQGs in two states using a number of different measures of student disadvantage and teacher quality. Although this question has not been explored in the existing empirical literature on inequities in U.S. public schools, we build on a prior literature that provides different “snapshots” of TQGs at given points in time. This study builds most closely on prior work from Washington state (Goldhaber et al., 2015), one of the focal states in this study, which demonstrates that many different measures of teacher quality are inequitably distributed across various indicators of student disadvantage during the 2012 school year. 6 The authors consider both input (teacher experience, licensure exam score) and output (value added) measures of teacher quality in their analysis and find that disadvantaged students (e.g., EDS and URM) are more likely to receive lower quality teachers regardless of how teacher quality is measured. Furthermore, the authors demonstrate that student and teacher sorting across districts, across schools within districts, and across classrooms within schools all contribute to these TQGs.
Other studies have investigated TQGs using a subset of these measures of teacher quality and student disadvantage, although we again stress that none of these studies has considered the evolution of TQGs over time. For example, Lankford et al. (2002) find that lower quality teachers (as measured by experience, degree, certification, and college of attendance) were more likely to teach in schools with higher numbers of low-performing minority students in the state of New York. Likewise, Clotfelter et al. (2005) use data from North Carolina (the other focal state in this study) and find that Black students are more likely to be in a classroom with a novice teacher than their White counterparts. This is crucial given the well-documented correlation between teacher experience and teacher effectiveness, particularly early in a teaching career (e.g., Rice, 2013; Rivkin et al., 2005; Rockoff, 2004). The authors disaggregate these results to classroom, school, and district effects and find significant effects at each level.
Kalogrides and Loeb (2013) focus on student and teacher assignments within schools themselves. They use data from three large school districts and find that classrooms with higher percentages of minority and low-income students were more likely to be assigned novice teachers. Kalogrides, Loeb, and Béteille (2013) delve further into this relationship and focus on one district from their previous study and find that less experienced teachers were more likely to be placed in classrooms with lower achieving students than their more experienced counterparts. These studies reinforce more qualitative evidence (e.g., Grissom, Kalogrides, & Loeb 2015; St. John, 2014), illustrating how experienced teachers typically have more discretion over their classroom assignments than less experienced teachers. 7
Although the preceding studies have focused primarily on teacher experience and other input proxies for teacher quality, researchers have also explored how output measures of teacher effectiveness (e.g., value-added estimates of teacher performance) are distributed across different groups. Sass et al. (2010) use student-level data from North Carolina and Florida and find that teachers in high-poverty schools on average tend to have slightly lower value-added scores than those in other schools but also that there is more variation in teacher value added in high-poverty schools. Hence, students in disadvantaged schools are considerably more likely to have a teacher in the bottom of the effectiveness distribution. For instance, teachers at the 10th percentile of the value-added distribution in disadvantaged schools in North Carolina are .04 standard deviations of student achievement less effective than teachers at the 10th percentile of the value-added distribution in advantaged schools in North Carolina. Given the outsized effects of having a very ineffective teacher (Chetty et al., 2014b; Goldhaber & Startz, 2017; Hanushek, 1992), this suggests it is important to assess the tails of the value added (and other measures of teacher quality) when considering TQGs.
A number of subsequent studies characterize teacher quality gaps in terms of value added similarly to Sass et al. (2010). Using data drawn from 10 school districts in seven states, Glazerman and Max (2011) find significant value-added TQGs at the middle school level (but not at the elementary level) and document substantial variation in the value-added distribution between the 10 districts they consider. Isenberg et al. (2013) find significant and consistent value-added TQGs and conclude that these differences are more attributable to teacher sorting across schools within these districts rather than teacher sorting across classrooms within schools. Most recently, Steele, Pepper, Springer, and Lockwood (2015) find that schools within the highest quartile of minority students have teachers that are .11 standard deviations of student performance less effective than schools in the lowest quartile of the distribution of minority students.
This characterization of large value-added TQGs is not, however, universal as several recent studies argue that the distribution of teacher effectiveness is relatively equitable (though all report positive and statistically significant TQGs). Chetty et al. (2014a) estimate that a $10,000 increase in a student’s family income is correlated with only a .001 increase in teacher value added. Mansfield (2015) reports that the average student in the bottom decile of a student background index is taught by a teacher at the 41st percentile of the value-added distribution, whereas the average student in the top decile of this index is taught by a teacher at the 57th percentile of value-added distribution, and concludes that “teacher quality is fairly equitably distributed both within and across high schools” (Mansfield, 2015, p. 751). 8 Most recently, Isenberg et al. (2016) find only small gaps between the average value added of teachers of ED and non-ED students. 9
Data and Analytic Approach
Context
North Carolina and Washington, the focal states in this study, provide interesting contrasts along several dimensions, and both have longitudinal data on students and teachers going back several decades. Table 1 provides a comparison of these different state contexts and the data available in each state (and the years in which data are available). As shown in the statistics from the 2013 school year (the most recent year considered for both states) in Panel A, North Carolina has substantially more Black students and charter schools than Washington but has less than half as many school districts despite a considerably larger overall student enrollment. As a result, the average district in North Carolina has more than three times as many students and more than twice as many schools as the average district in Washington. This difference is important in interpreting the extent of cross-district and within-district sorting in the two states, discussed in the next section. 10
Cross-State Data Comparison
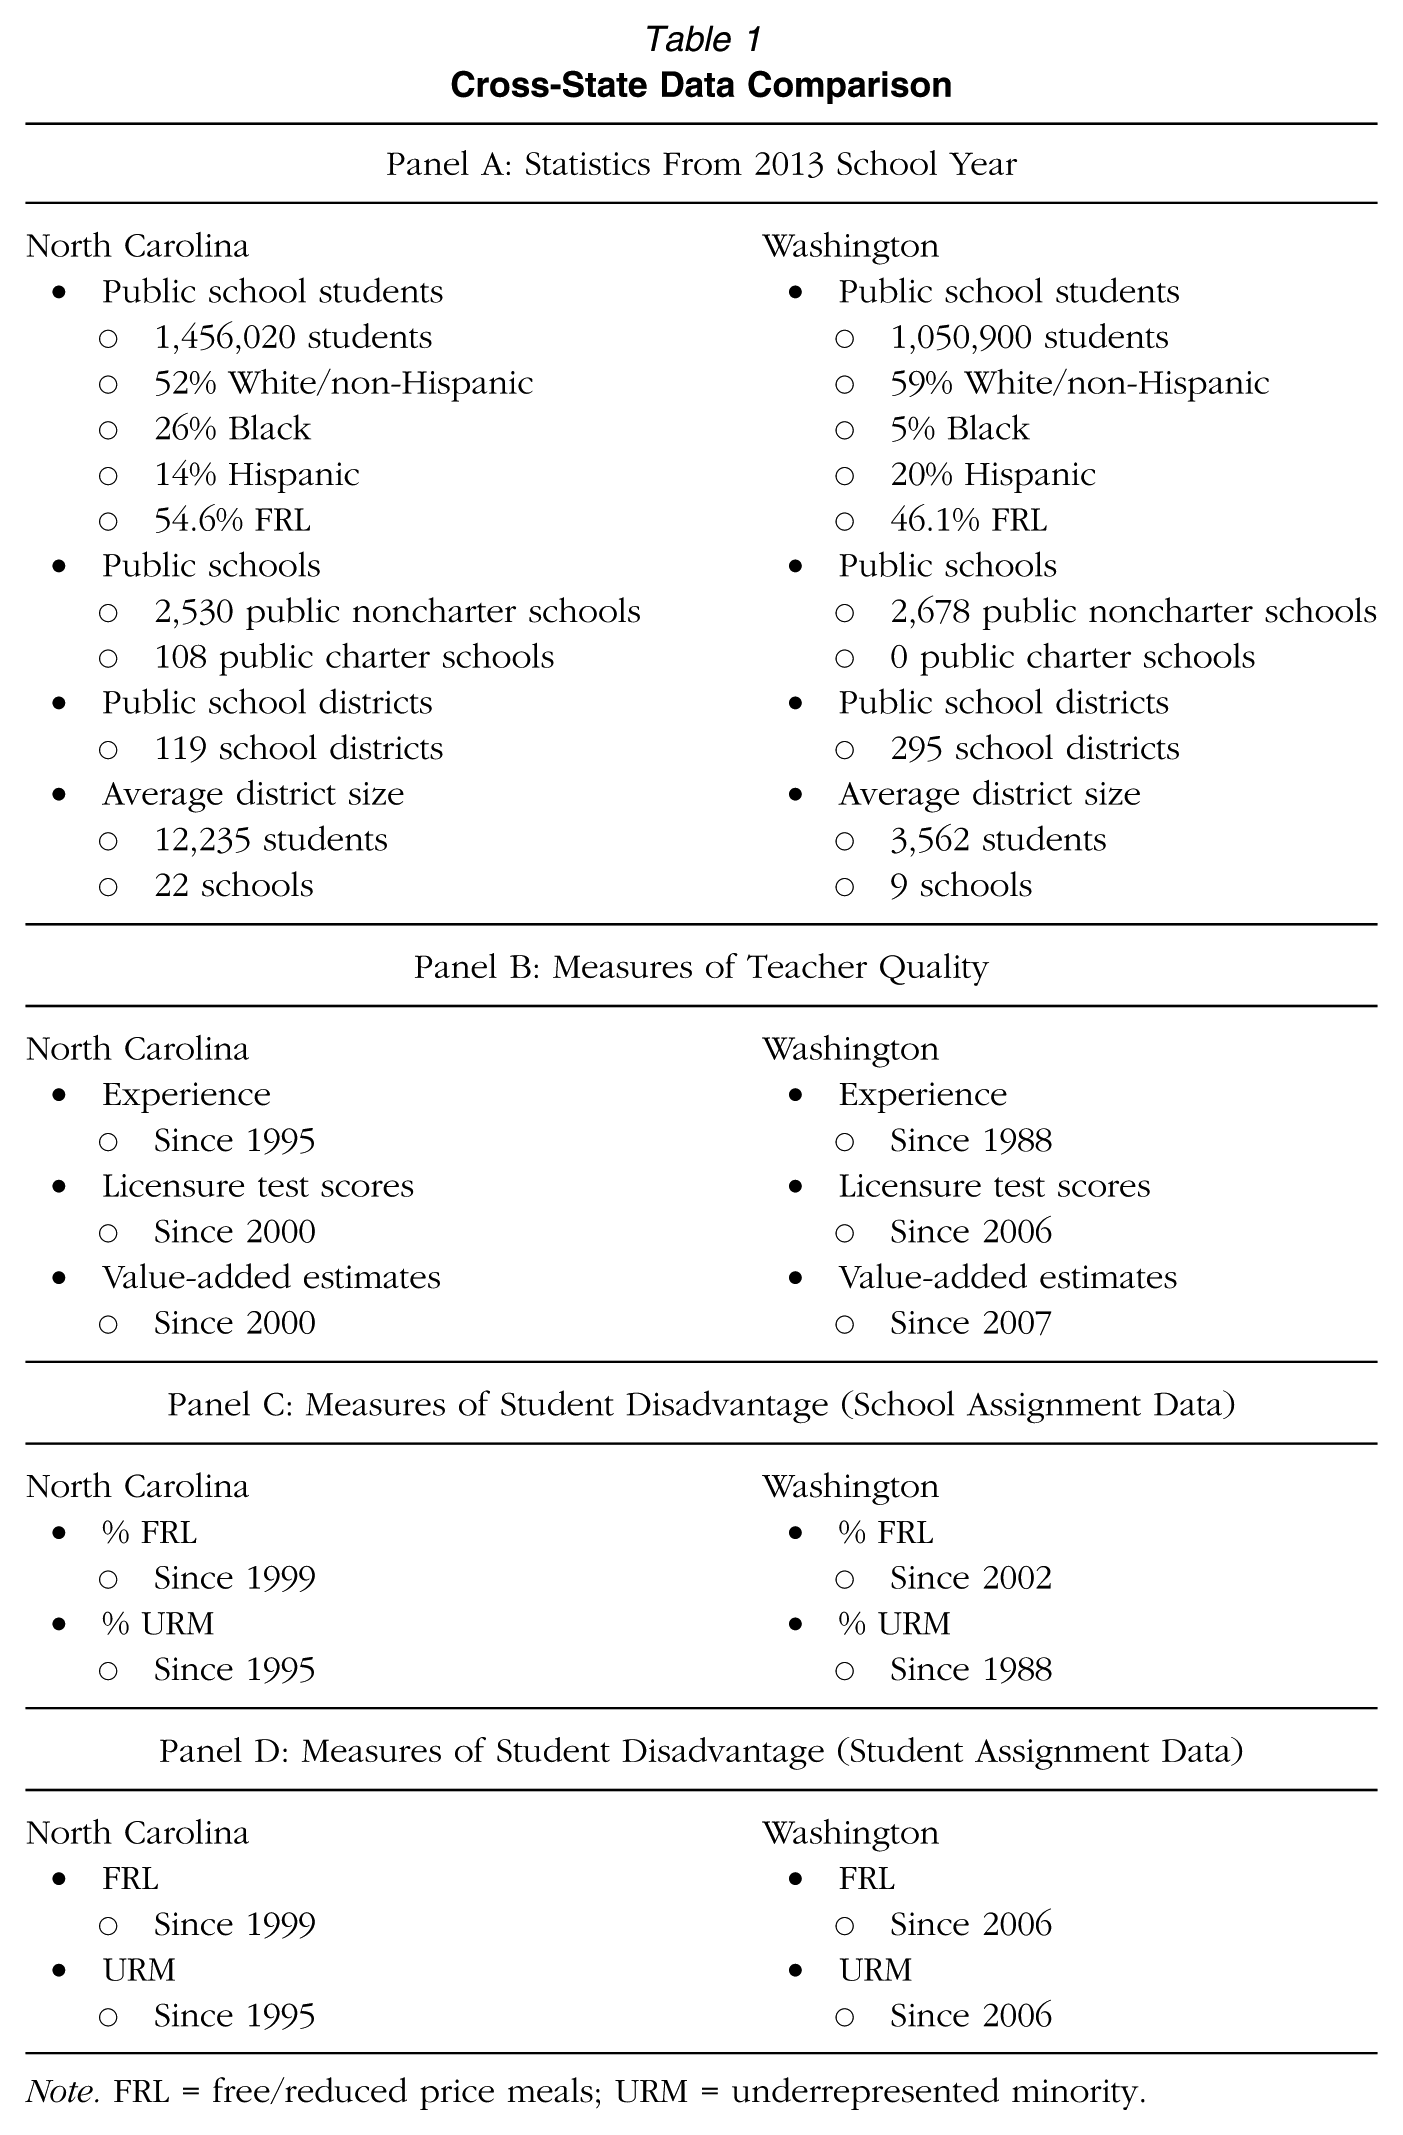
Note. FRL = free/reduced price meals; URM = underrepresented minority.
Figure 1 illustrates the geographic distribution of student demographics across districts in each state; the shading within each figure represents the proportion of URM students (Panels A and C), defined as the proportion of students who are American Indian, Black, or Hispanic, or ED students (Panels B and D), defined as the proportion of students who qualify for free or reduced price meals. Figure 1 shows that URM and ED students tend to be clustered within specific districts in both states (particularly URM students in Washington) and that districts with a high percentage of URM students tend to have a high percentage of ED students; in fact, the correlation between the district-level percentages of URM students and the district-level percentages of ED students is .67 in both Washington and North Carolina. Figure 1 also reinforces the statistics from Table 1 that North Carolina has a substantially more racially diverse student body and a somewhat higher poverty student body than Washington’s.
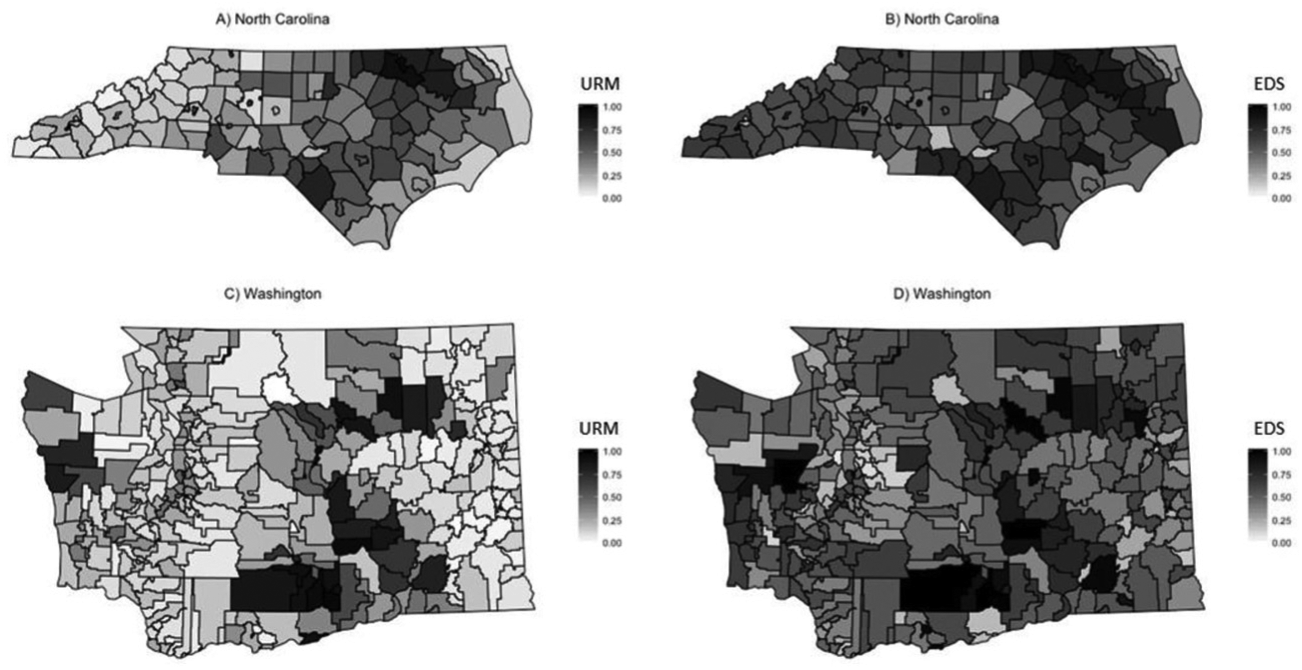
Geographic distribution of proportion of disadvantaged students in North Carolina and Washington in 2014.
Data Overview
For our primary analysis, we combine data from the focal states—provided by the North Carolina Education Research Data Center (NCERDC) and the Washington State Office of Superintendent of Public Instruction (OSPI)—with data from the National Center for Education Statistics (NCES) to create two different longitudinal data sets within North Carolina and Washington. First, we create a school assignment data set where we consider the relationship between teacher characteristics and the aggregated student demographics of the teacher’s school. The advantage of these school assignment data sets is that we can calculate TQGs across all grade levels and available years of data, but we cannot consider inequities in the within-school sorting of students and teachers with these data sets because we do not observe student or teacher classrooms assignments.
We also create a student assignment data set that takes advantage of the fact that student-teacher links are available in elementary grades in each state (since 1996 in North Carolina and since 2006 in Washington). We primarily use the student assignment data to estimate value-added models (VAMs) of teacher effectiveness, but in an extension, we consider the relationship between teacher characteristics and the demographics of the students in a teacher’s classroom within a given year. To facilitate cross-state comparisons, we focus on grade levels in which student-teacher matching is possible in each state across the greatest number of years (Grades 3–5), but we also investigate other grade levels within each state individually.
We describe the data sets for each state in the following as well as the measures of teacher quality and student disadvantage that we employ throughout this analysis. Our primary results focus on the distribution of “low-quality” teachers, which we calculate from the teacher variables in both the school and student assignment data sets described in the following. For teacher experience, we focus on the distribution of novice teachers with 5 or fewer years of teaching experience but also experiment with other definitions of “novice” (e.g., 2 or fewer years of experience). For licensure test scores and value-added estimates, we focus on the distribution of teachers who fall in the lowest quartile of the overall distribution of each teacher quality measure.
Our decision to focus on “low-quality” teachers is motivated by empirical evidence suggesting that exposure to low-quality teachers is particularly important for all three measures of teacher quality. This relationship has been clear for some time when it comes to teacher experience (e.g., Rice, 2013; Rivkin et al., 2005; Rockoff, 2004), but recent evidence suggests that the relationship between teacher licensure test scores and student achievement is driven by teachers in the bottom quartile of the distribution of licensure test scores (Goldhaber, Gratz, & Theobald, 2016), and there are outsize effects (i.e., more than would be expected from a normal distribution) of exposure to teachers at the bottom of the distribution of value added as well (Chetty et al., 2014b; Goldhaber & Startz, 2017). We also experiment with other cut-points in these distributions (e.g., lowest decile) and further consider average teacher quality for advantaged and disadvantaged students in an extension.
North Carolina Data
The school assignment data set in North Carolina relies on teacher-level data from NCERDC going back to the 1995 school year, including information on the number of teachers, teacher position and salary (where experience is calculated), as well as teachers’ average licensure test scores across reading, writing, and math scores on the state’s licensure exam, the Praxis. 11 Our analysis of Praxis scores begins with the 2000 school year because this is the first year in which at least 1% of teachers in the state have a Praxis score, and we consider the average of each teacher’s scores on the math, reading, and writing portions of the test from the first time each teacher took the test. 12
For teachers who teach in tested grades and subjects, 13 we include an estimate of the teacher’s effectiveness calculated from the following VAM estimated for both math and reading:

In Equation 1, Yijst is the state test score for each student i with teacher j in subject s (math or reading) and year t, normalized within grade and year; Yi(t–1) is a vector of the student’s scores the previous year in both math and reading, also normalized within grade and year; Sit is a vector of student attributes in year t (gender, race, ED, English language learner status, gifted status, special education status, learning disability status); and τ js is the VAM estimate that captures the contribution of teacher j to student test scores in subject s up to and including year t. 14
Given that our interest is primarily in differential exposure to teachers at the tails of the value-added discussion and teachers matched to a small number of students distribution are more likely to be in the tails of the distribution (e.g., Aaronson, Barrow, & Sander, 2007), for each year t we improve the precision of our estimates by focusing on pooled value-added estimates that consider all available years of data up to and including year t for each teacher. 15 We also adjust all teacher effect estimates using empirical Bayes (EB) methods that shrink the estimates back to the grand mean of the value-added distribution proportionally to the standard error of each estimate. EB shrinkage does not account for the uncertainty in the grand mean, suggesting that the estimates may shrink too much under this procedure (McCaffrey, Sass, Lockwood, & Mihaly, 2009), but this approach ensures that estimates in the tails of the distribution are not disproportionately estimates with large standard errors. One drawback of this approach is that because value-added estimates for teachers of disadvantaged students tend to be less precise (e.g., Herrmann, Walsh, & Isenberg, 2016), this will likely cause us to understate the true teacher quality gap because too few of these imprecise estimates will end up in the tails of the distribution. We use the average math and reading value-added estimates for teachers who teach both subjects. 16
The value-added specification in Equation 1 is similar to the specification reported in Goldhaber et al. (2015). Isenberg et al. (2016) argue that one reason why the TQGs they report are smaller than the TQGs reported in Goldhaber et al. (2015) is because the primary value-added specification they rely on includes aggregated classroom covariates; namely, the specification in Equation 1 misattributes some of the impact of having disadvantaged classmates to differences in teacher quality between advantaged and disadvantaged classrooms. We experiment with models that include aggregated classroom covariates and find little evidence in either state that the inclusion of these variables in the VAM in Equation 1 impacts the estimated TQGs at the elementary level (the grade level we consider in our primary analysis). 17 As we explore in more detail in Goldhaber, Quince, and Theobald (2016), the inclusion of classroom-level controls matters more for the estimation of teacher quality gaps at the middle school level, likely because there is more tracking in middle school grades.
We merge the school assignment data set to Public School Universe (PSU) data maintained by NCES. The PSU data set includes school-level data about the percentage of students by race and ethnicity (linkable to North Carolina data since 1995) and the percentage of ED students (linkable since 1999). 18 We use the race and ethnicity variables to calculate the percentage of URM students in each teacher’s school each year. 19 The final school assignment data set in North Carolina consists of 213,907 unique teachers and 1,554,901 teacher-year observations. We observe Praxis scores for 170,950 of these teacher-year observations and value-added estimates for 148,312 teacher-year observations.
We compile the North Carolina student assignment data from the NCERDC End-Of-Grade files and Masterbuild files. From 1995 to 2013, the data set links students in Grades 3 through 5 with their classroom teachers. 20 The student assignment data set also includes student-level characteristics such as URM and ED status, and we link these data to teacher experience, Praxis scores, and the VAM estimates described previously. 21 The final student assignment data set in North Carolina consists of 37,374 unique teachers, 2,950,638 student-year observations, and 149,231 teacher-year observations. We observe Praxis scores for 16,798 of these teacher-year observations corresponding to 326,652 student-year observations and value-added estimates for 92,601 teacher-year observations linked to 1,977,248 student-year observations.
Washington Data
The school assignment data set in Washington uses the state’s S-275 database, which contains information from OSPI’s personnel reporting process and includes the school assignment of all certificated employees in the state in addition to a measure of each employee’s teaching experience in the state. 22 Annual S-275 data are available from the 1984 school year through the 2015 school year, although we focus on years since 1988 because data in these years are linkable to the PSU data from NCES.
We link the S-275 to the same teacher quality measures described previously. First, we include teachers’ test scores on the Washington Educator Skills Test–Basic, or WEST-B, a standardized test that all teachers must pass before entering a teaching education program. As with the Praxis in North Carolina, we consider the average WEST-B score across math, reading, and writing from the first time each teacher took the test. The WEST-B was required for entry into teacher education programs beginning in 2002, so we begin considering teacher WEST-B scores in the 2006 school year (the first year in which at least 1% of teachers in the state have a WEST-B score).
As in North Carolina, we merge the Washington school assignment data set to the PSU data that provide school-level student counts by race and ethnicity (linkable to Washington data since 1988) and the percentage of ED students (linkable since 2002). The final school assignment data set in Washington consists of 100,875 unique teachers and 892,662 teacher-year observations. We observe WEST-B scores for 52,087 of these teacher-year observations and value-added estimates from 40,009 teacher-year observations.
The student assignment data set in Washington uses data from the state’s Core Student Records System (CSRS) and Comprehensive Education Data and Research System (CEDARS), both maintained by OSPI. From 2006 through 2009, students in Grades 3 through 5 in the CSRS data set can be linked to their classroom teacher by their proctor on the state exam. 23 Since 2010, the state’s CEDARS data set allows all students to be linked to their classroom teachers through unique course IDs. 24 The student assignment data set includes student-level ED and URM variables, and we link these data to the same teacher variables (experience, WEST-B scores, and VAM estimates) described previously. The final student assignment data set in Washington consists of 17,772 unique teachers, 1,423,347 student-year observations, and 66,561 teacher-year observations. We observe WEST-B scores for 13,912 of these teacher-year observations corresponding to 274,070 student-year observations and value-added estimates for 35,138 teacher-year observations linked to 800,252 student-year observations.
Analytic Approach
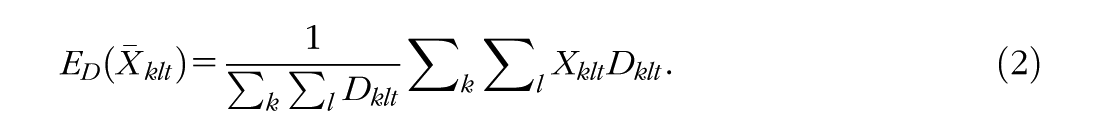
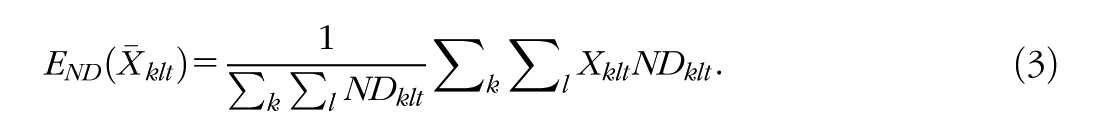
Our methodology for calculating TQGs in each school year from student assignment data closely follows the approach of Clotfelter et al. (2005) and Goldhaber et al. (2015), so we present our approach to calculating TQGs from the school assignment data sets described previously. First, for a given measure of teacher quality (experience, licensure test score, or VAM), let Xklt be the proportion of “low quality” teachers in school k, district l, and year t. Likewise, for a given measure of student disadvantage (URM or EDS), let Dklt be the number of disadvantaged students in school k, district l, and year t (and let NDklt be the corresponding number of non-disadvantaged students). The school-level exposure rate of disadvantaged students to low-quality teachers is calculated as the following weighted average: 25
For this measure of teacher quality and student advantage, the school-level TQG in year t is simply
Results
Long-Term Trends for Between- and Within-District TQGs
We first use the school assignment data to calculate TQGs at the school and district levels in both states, in every year of available data, and using every combination of student disadvantage measure (URM and EDS) and measure of low teacher quality (novice, bottom-quartile licensure test, bottom-quartile value added). Because of the sheer number of TQG estimates, we present all results in a series of figures. 26
Figure 2 traces the evolution of TQGs in terms of student exposure to novice teachers (with 5 or fewer years of experience) in the school assignment data in each state for URM students (Panels A and C) and ED students (Panels B and D).
27
For example, Panel A in Figure 2 shows the average school-level (black lines) and district-level (gray lines) proportion of novice teachers for URM students (solid lines) and non-URM students (dashed lines) in North Carolina. In other words, the solid black line shows the evolution of school-level exposure to novice teachers for URM students (
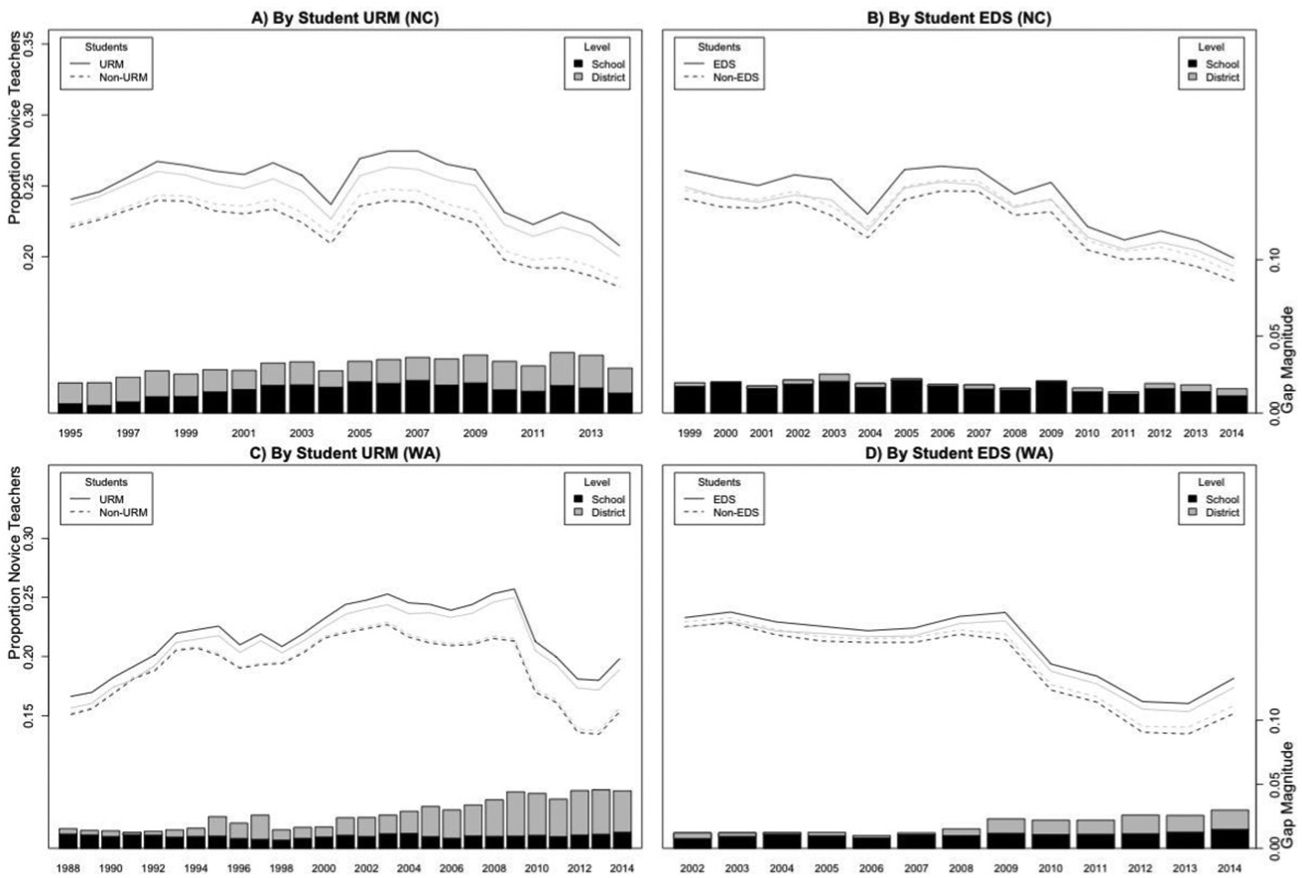
Exposure rates to novice teachers from school assignment data.
The vertical distance between the gray lines in each year represents the district-level TQG in terms of exposure to novice teachers in each year (
Before discussing the details of these plots, we pause to note a fundamental conclusion from these figures. In every single year of observed data in each state and across every combination of student disadvantage and teacher quality, the TQG is positive, namely, disadvantaged students are more likely to be exposed to low-quality teachers. Though consistent with the existing literature discussed previously, this drives home the reality that TQGs are pervasive and not a new phenomenon in either of these states. The remainder of this discussion focuses on the trends within each state for given measures of student disadvantage and teacher quality as well as the differences between the two focal states; these differences emphasize the importance of looking beyond a single state in research like this.
Figure 2 shows that TQGs in the two states in terms of exposure to novice teachers in the two states have ranged from 1 to 5 percentage points over the years of available data; for context, given the returns of the first 5 years of teaching experience in our value-added models, a 1 percentage point difference in exposure to novice teachers corresponds to an expected difference of about .001 standard deviations of student learning between advantaged and disadvantaged students. These TQGs in North Carolina in terms of exposure to novice teachers are largely due to within-district sorting for ED students (Panel B), but there is considerable sorting across districts in North Carolina for URM students (Panel A). A second conclusion from this figure is that the TQGs in terms of exposure to novice teachers in Washington (Panel C) have changed considerably over time; for example, the gaps for URM students are largely due to within-district sorting in the late 1980s, but while the extent of within-district sorting has remained remarkably consistent over the subsequent decades, the growing gaps due to cross-district sorting have caused these TQGs to grow considerably since the 1980s. In fact, while URM students were only 10% more likely to be exposed to a novice teacher in 1988, they were 34% more likely to be exposed to a novice teacher by 2013. Finally, in both states (but particularly Washington), the TQGs in terms of exposure to novice teachers are larger for URM students than for ED students. Note that the overall drop in exposure to novice teachers in the late 2000s in each state is likely due to the slowdown in new teacher hiring during the Great Recession.
Figure 3 shows the evolution of TQGs in terms of student exposure to teachers with low licensure test scores in the school assignment data in each state. The magnitudes of the TQGs with respect to licensure test scores are remarkably consistent for different measures of disadvantage, over time, and between the two states; disadvantaged students are between 5 and 10 percentage points more likely to be exposed to a teacher with a low licensure test score than non-disadvantaged students. Once again, this figure illustrates an important difference between the sources of TQGs in North Carolina and Washington; while these cross-district sorting and within-district sorting contribute approximately equally to these gaps in North Carolina, cross-district sorting is responsible for a far greater share of these TQGs in Washington. With very few exceptions, school districts in Washington have been consistent over the years of available PSU data, so this is not due to any redistricting in Washington. It may, however, be due to the existence of larger districts in North Carolina (and thus more opportunity for within-district sorting); in the extreme, a state with only one district only has within-district sorting, so we would expect more within-district sorting when there are more schools in each district (as is the case in North Carolina relative to Washington).
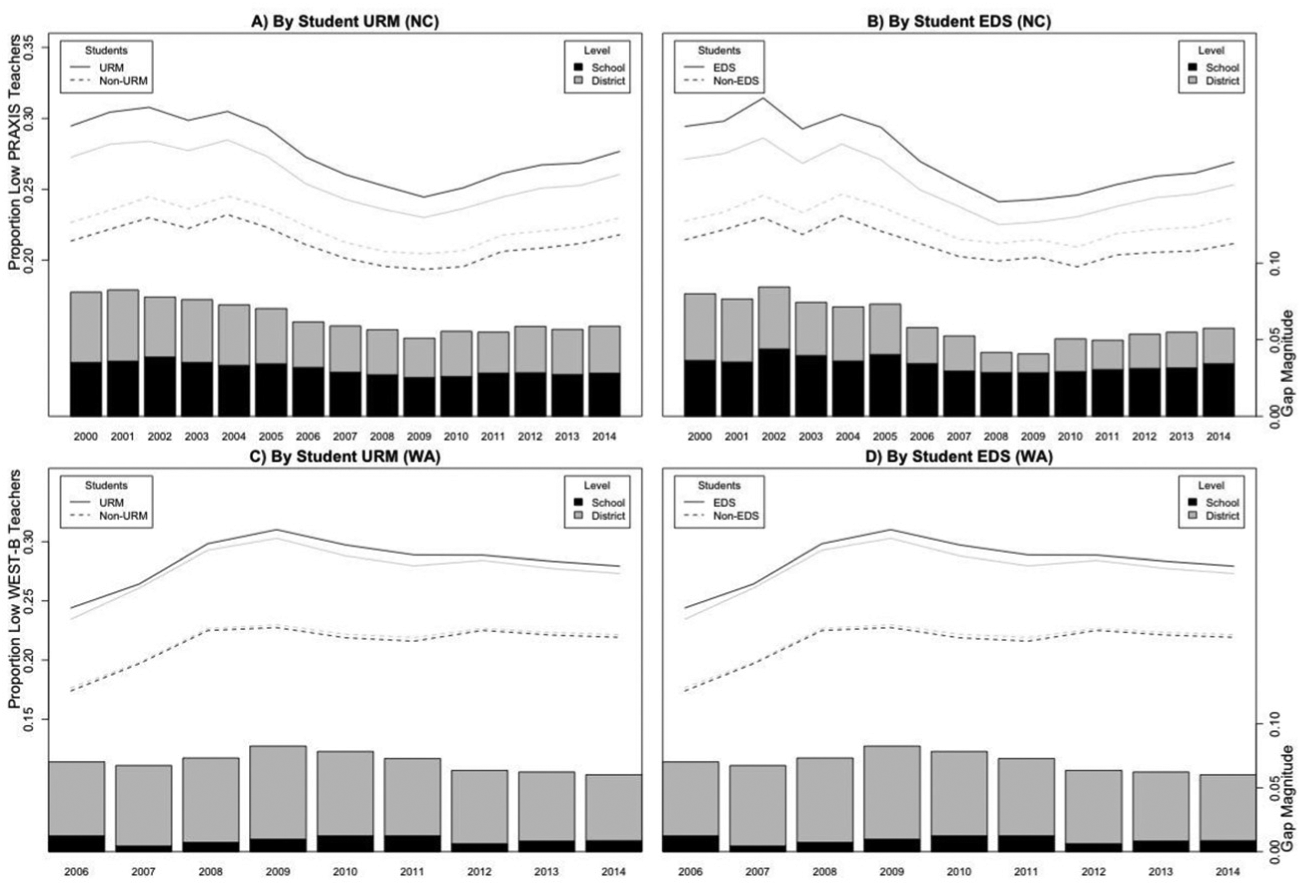
Exposure rates to teachers with bottom-quartile licensure test score from school assignment data.
We further probe these cross-state differences in two ways. First, we restrict the Washington data to the 34 districts in the Puget Sound Education Service District (ESD), which are also some of the largest in the state of Washington; the average district in the Puget Sound ESD has 11,539 students, which is comparable to the average district size in North Carolina (12,235 students) but about three times larger than the average district in Washington (3,562 students). 28 We find that within-district sorting is still a greater contributor to these TQGs in North Carolina than in these Washington districts, which suggests that these patterns are not driven solely by the larger districts in North Carolina. Second, in regressions described more fully in the following, we investigate whether within-district sorting is still greater in North Carolina when we control for other observable characteristics of districts in the two states, including the amount of segregation across schools in the districts and overall level of student disadvantage in the district. Our primary conclusion from these regressions is that the greater within-district sorting in North Carolina can be explained by these observable district characteristics, namely, the amount of segregation across schools within districts in the two states.
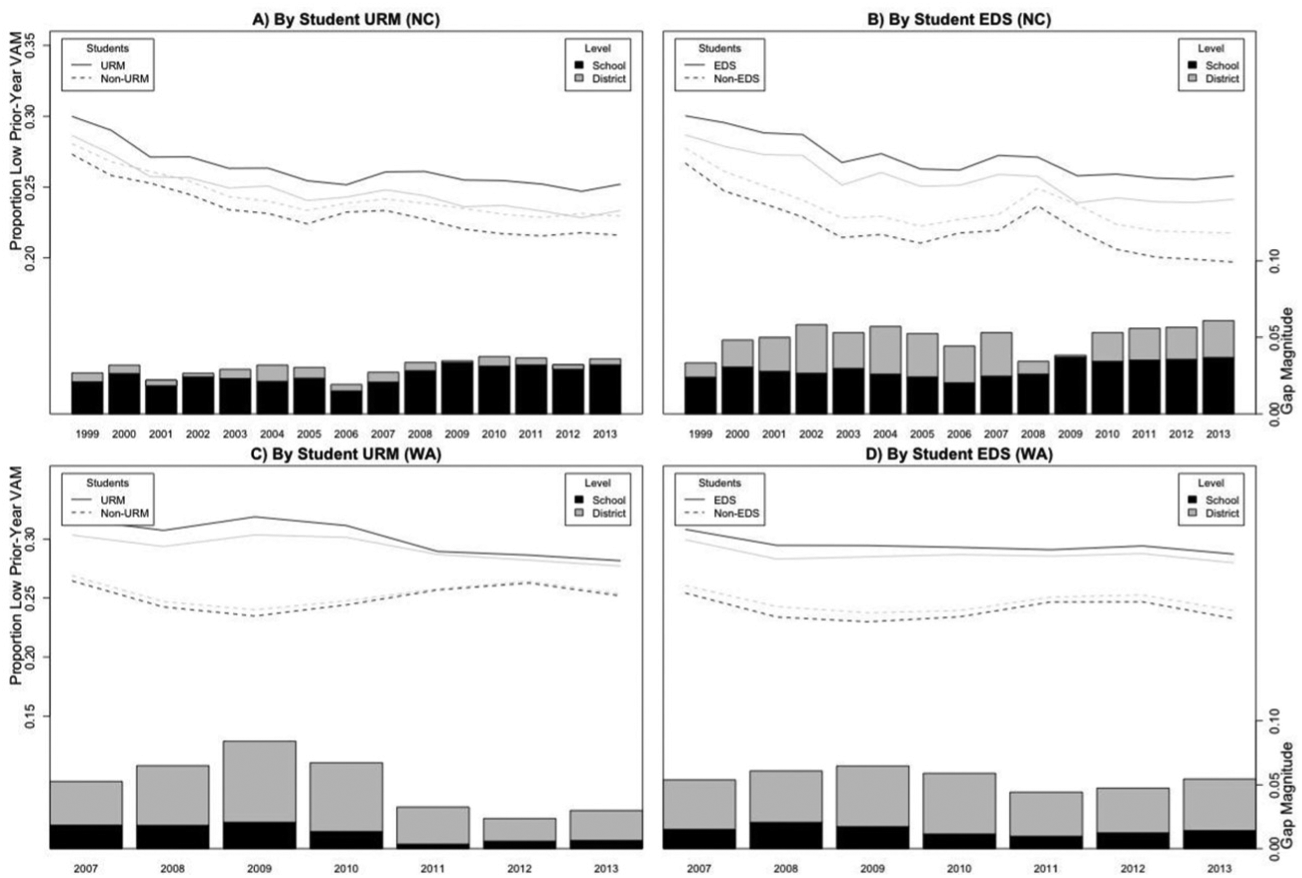
Figure 4 shows the evolution of TQGs in terms of student exposure to teachers with low value-added estimate (averaged between math and reading) in the school assignment data in each state. This figure illustrates a similar difference between the focus states—namely, within-district sorting historically accounts for most of the TQGs in terms of exposure to low value-added teachers in North Carolina, while cross-district sorting accounts for most of the analogous TQGs in Washington—but also illustrates that these TQGs can sometimes change considerably over time. For example, the low value-added TQG for URM students in Washington is over twice as large in 2009 and 2010 than in 2012–2014. 29 Overall, though, disadvantaged students (URM or ED) are between 3 and 8 percentage points more likely to be exposed to a low VAM teacher in any given year and in either state than non-disadvantaged students.
Exposure rates to teachers with bottom-quartile VAM estimate from school assignment data.
Given well-documented returns to early teacher experience, the patterns in Figure 4 may be partly driven by differential exposure to novice teachers (shown in Figure 2). When we replicate these figures using estimates from VAMs that control for teacher experience, we find consistent (though smaller) TQGs over time. This suggests that the gaps in terms of exposure to low value-added teachers consist of both an experience component (i.e., disadvantaged students are more likely to have novice teachers, who are less effective, on average) and a time-invariant component (i.e., even between students assigned to a teacher of the same experience level, disadvantaged students are more likely to have a low value-added teacher than advantaged students). 30
In an extension, we use the student assignment data from each state described previously—that, importantly, only include students in Grades 3 to 5—to calculate TQGs at the district, school, and here, the classroom level over time to assess whether the trends in the recent years of Figures 2 through 4 hold when we extend the analysis to the classroom level. 31 We find that in both states, within-school sorting contributes a small but meaningful portion of the TQGs in terms of exposure to novice teachers and low value-added teachers but less in terms of exposure to low licensure test teachers. 32 There also appears to be more within-school sorting, particularly in terms of low value-added teachers, in North Carolina than in Washington. This holds even when we limit the data to schools in each state that have at least one novice teacher and at least one non-novice teacher. 33 Overall, though, the magnitudes of TQGs calculated from the student assignment data are quite similar to the TQGs reported in recent years of the school assignment data, suggesting that the trends in Figures 2 through 4 would be broadly generalizable to student-level data if it were available.
We draw five broad conclusions from this descriptive analysis. First, disadvantaged students in both states have been more likely to be exposed to low-quality teachers in every single year of available data and under every definition of student disadvantage and teacher quality. Second, the “novice teacher gap” between URM and non-URM students has grown considerably over time in each state, particularly in Washington. Third, TQGs have historically been larger when student disadvantage is defined by race than by poverty level, though the gaps by student poverty level are also educationally meaningful. Fourth, there are some differences in the history of TQGs depending on the measure of teacher quality we consider (e.g., while TQGs by teacher experience have grown over time, corresponding gaps by teacher licensure test scores in both states have been quite consistent over the years of available data). And finally, within-district sorting contributes to TQGs far more in North Carolina than in Washington across all measures of teacher quality we consider. We discuss the policy implications of each of these broad conclusions in the discussion and conclusion.
Heterogeneity in TQGs Across Districts
The results discussed to this point are pooled across districts in North Carolina and Washington, but prior work from these focal states (Clotfelter et al., 2005; Goldhaber et al., 2015) shows that there is considerable heterogeneity in TQGs between different districts within these states. The maps in Figure 5 illustrate the TQGs with respect to novice teachers for URM students (Panels A and C) and ED students (Panels B and D) for every district in each state, calculated from the most recent year of data in each state; districts with darker shading have higher TQGs with respect to novice teachers.
34
The maps in Figure 5 illustrate that the clear trends in Figure 2 (illustrating that ED and URM students are more likely to be exposed to novice teachers, on average, within both states) mask considerable heterogeneity across districts in terms of the inequitable exposure of URM and ED students to novice teachers. That said, more districts have positive TQGs than negative TQGs within each map; for example, 70% of districts in Washington have a positive TQG between ED and non-ED students. Interestingly, the correlations between these TQGs in Figure 5 and the corresponding student demographics are relatively weak (
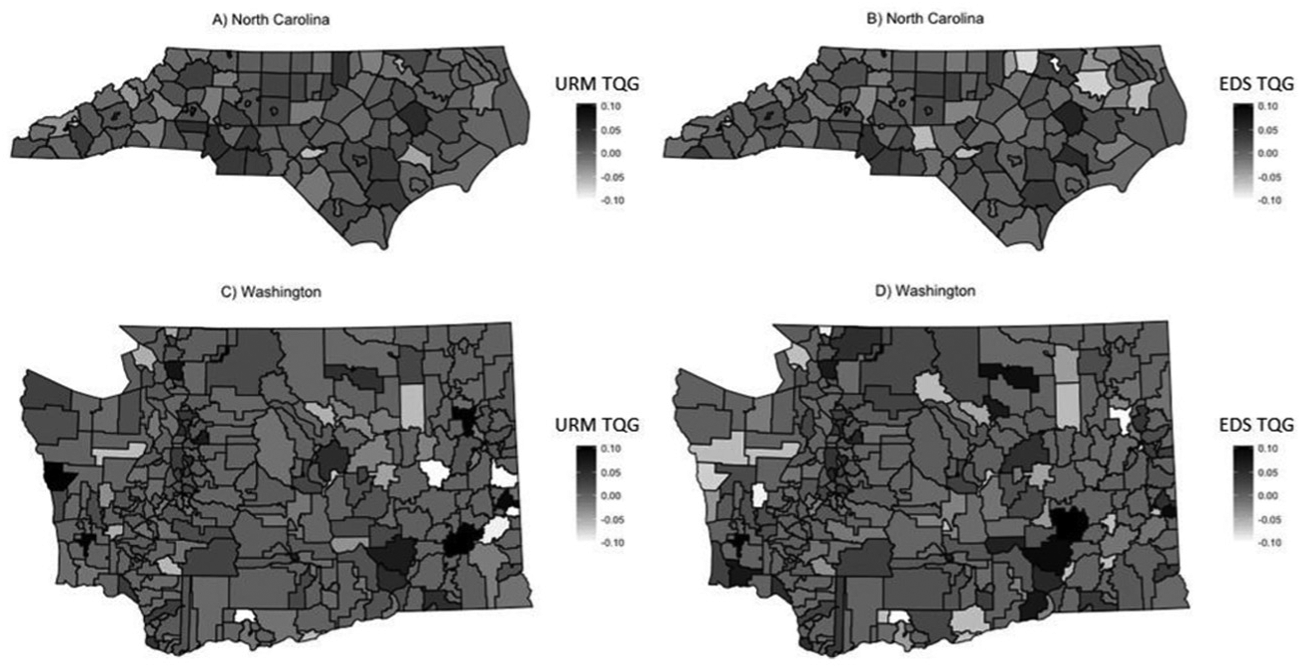
Geographic distribution of TQGs in exposure to novice teachers in North Carolina and Washington in 2014.
When we investigate district-level TQGs using other measures of teacher quality, several interesting patterns emerge. 35 First, while district-level TQGs are quite similar whether the measure of student disadvantage is EDS or URM (r > 0.6 in Washington, r > 0.8 in North Carolina), there is more divergence depending on the measure of teacher quality considered. The strongest correlations are between TQGs for the two measures we observe for all teachers; specifically, the correlation between the district-level novice teacher gap and the district-level licensure test gap ranges between 0.19 and 0.40 depending on the state and measure of student disadvantage. That said, when we limit the student assignment data to Grades 4 and 5 and investigate gaps based on the same sample of students, the strongest correlation is between the novice teacher and value added TQG (r = 0.2). While this correlation is not surprising given the well-documented early-career returns to teacher experience, our broad conclusion is that districts that have large TQGs according to one measure of teacher quality may not have large TQGs according to other measures.
We further investigate the variability in district-level TQGs according to the same measures of teacher quality but within districts across time. We find that a district’s prior year TQG is quite predictive of its TQG in the current year; for example, when we predict a district’s TQG in 2013 as a function of its TQG in 2012, coefficients range from about 0.6 (for value added and ED students in Washington) to 0.9 (for novice teachers and URM students in North Carolina). Some of the variation across time could be due to changes in student assignments and teacher staffing across years within districts, while there is likely to be additional variability in the value-added TQGs due to changes in value-added estimates for individual teachers over time, either due to true changes in teacher quality or the imprecision of VAM estimates (e.g., Goldhaber & Hansen, 2013).
Finally, we use district characteristics observable across all years of data to investigate predictors of these different TQGs. Specifically, we estimate district-year level regressions in which the outcome measure is the TQG in that district and year and the predictor variables include three characteristics of that district in the previous school year: the overall percentage of disadvantaged students in the district; the amount of school-level segregation in the district, defined as the standard deviation of school-level percentage of disadvantaged students across schools within a district and year; and the log enrollment of the district. 36 We report the estimates from these regressions in Table 2. In the first four columns of this table, we consider URM as the measure of student disadvantage, while Columns 5 through 8 consider TQGs for ED students. The first panel of results predicts TQGs with respect to novice teachers, the second panel considers TQGs with respect to bottom quartile licensure test teachers, and the third panel investigates predictors of TQGs in terms of teachers in the bottom quartile of value added.
Predictors of Within-District Teacher Quality Gaps
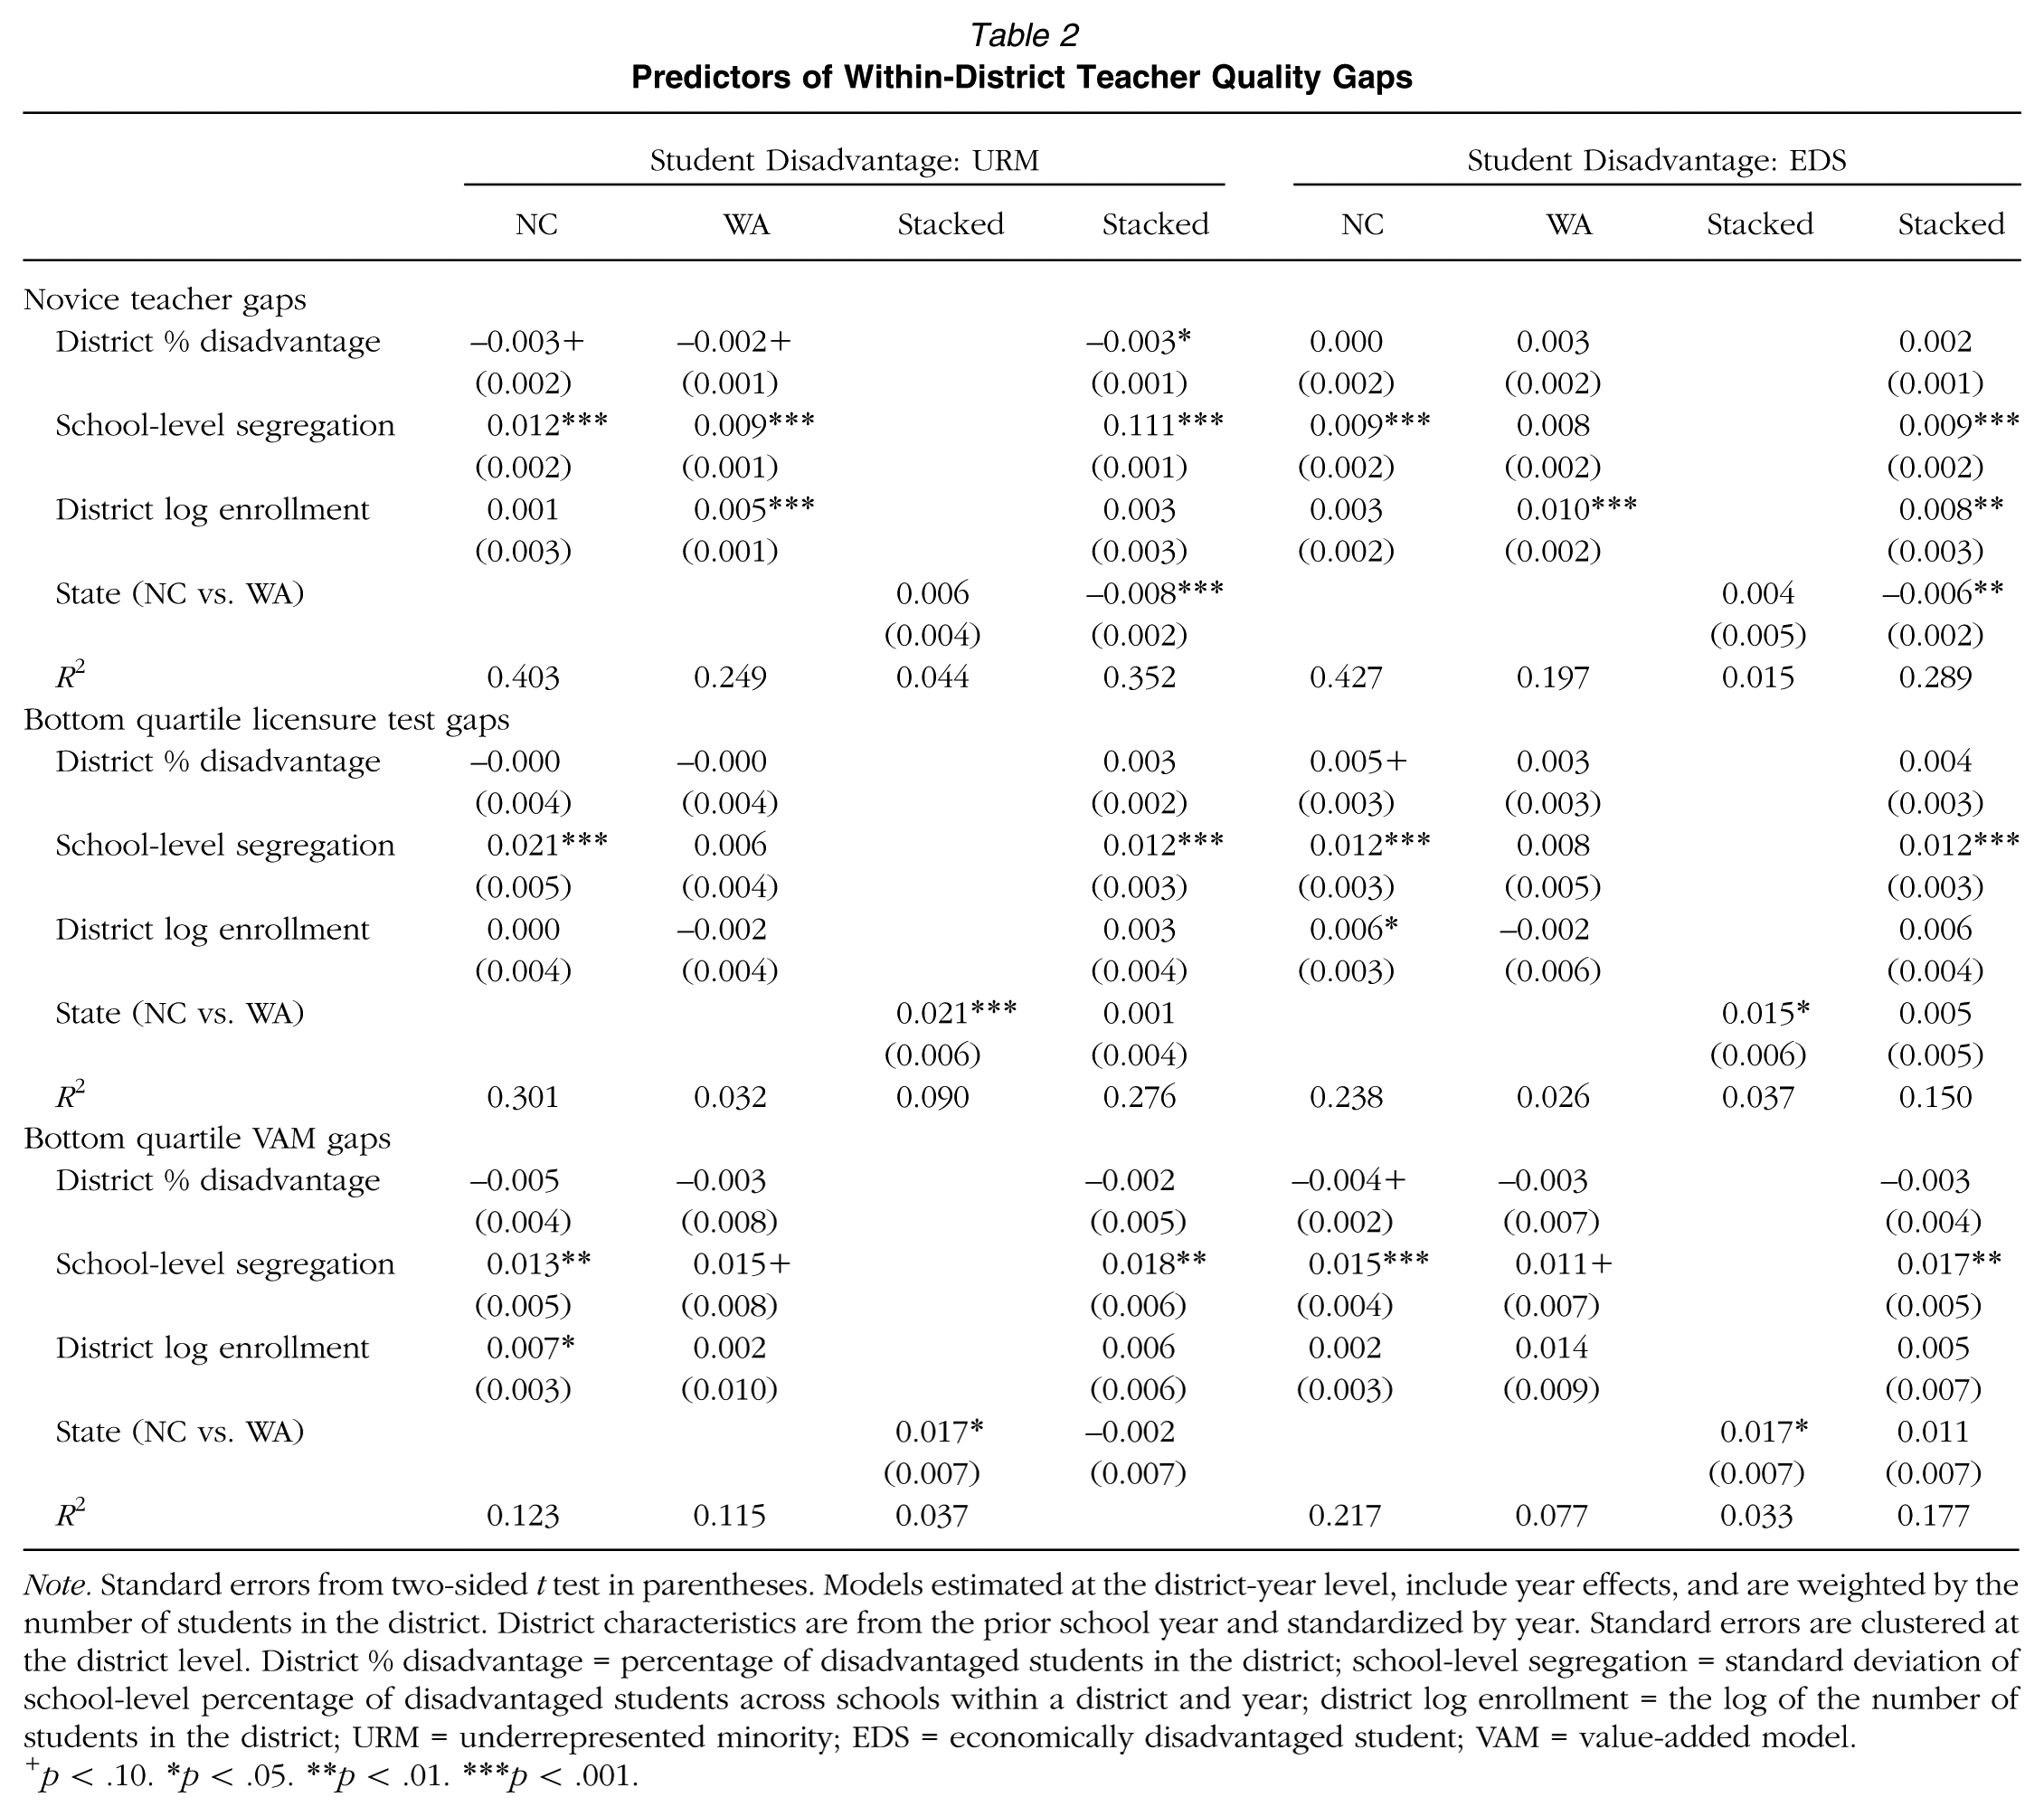
Note. Standard errors from two-sided t test in parentheses. Models estimated at the district-year level, include year effects, and are weighted by the number of students in the district. District characteristics are from the prior school year and standardized by year. Standard errors are clustered at the district level. District % disadvantage = percentage of disadvantaged students in the district; school-level segregation = standard deviation of school-level percentage of disadvantaged students across schools within a district and year; district log enrollment = the log of the number of students in the district; URM = underrepresented minority; EDS = economically disadvantaged student; VAM = value-added model.
p < .10. *p < .05. **p < .01. ***p < .001.
We draw two primary conclusions from this exercise. First, the primary driver of TQGs according to each measure of teacher quality appears to be the amount of segregation in the district; specifically, districts with greater variability in student disadvantage across schools in the district also tend to have greater TQGs according to these measures of teacher quality. Given that all the district measures in these regressions are standardized, the magnitude of these coefficients suggests that a one standard deviation increase in district-level segregation is correlated with a .01 to .02 increase in the teacher quality gaps illustrated in Figures 2 through 4. Importantly, this finding persists in models that include district fixed effects, suggesting that this is also true within the same district over time (i.e., districts tend to have larger TQGs, all else equal, in years following greater segregation across schools in the district). 37
Moreover, stacking data across the two states and including a state fixed effect allows us to investigate sources of the greater within-district TQGs in North Carolina than Washington documented previously. For example, the state effects in the stacked models predicting licensure test and VAM TQGs reinforce one of the primary conclusions from Figure 3, specifically, that within-district TQGs with respect to exposure to low licensure test or VAM teachers tend to be larger in North Carolina than Washington. But these effects are no longer statistically significant in regressions that control for observable characteristics of the districts in the two states, suggesting that these differences are driven by observable differences between districts in North Carolina and Washington.
Robustness of Findings to Different Measures
We conclude by testing the robustness of our findings to different approaches to estimating TQGs, different measures of student disadvantage, different definitions of low teacher quality, and different specifications of our value-added model. First, while the results discussed to this point focus exclusively on differences in the exposure rates to low-quality teachers between advantaged and disadvantaged students, much of the prior work discussed in the literature review focuses on the differences in average teacher quality between advantaged and disadvantaged students. To place our results in the context of this broader literature, we extend our exploration of TQGs by exploring the evolution of TQGs in terms of average teacher quality. 38
Focusing on average teacher quality distribution lets us uncover patterns that are not apparent when we look at the lower tails of the distribution. For example, URM students in Washington attended districts with higher average teacher experience in the late 1980s. However, this changed by the mid-1990s, and as of 2013, URM students attend districts with almost one fewer year of average teacher experience than non-URM students. We also see large gaps between teachers of advantaged and disadvantaged students in both North Carolina and Washington over time; for example, the gaps in Washington for URM and ED students represent about 20% of a standard deviation of candidate performance on the WEST-B.
Finally, average gaps for value added are similar in magnitude to the gaps discussed in some of the earlier work exploring value-added TQGs (e.g., Goldhaber et al., 2015; Isenberg et al., 2013, 2016; Mansfield, 2015; Sass et al., 2010). At the elementary level, the magnitude of the TQGs in North Carolina and Washington are consistently between .02 and .04 standard deviations of student achievement, regardless of the measure of student disadvantage that we consider. In the most recent year (2013), the magnitude of the gap implies that the average ED elementary student in North Carolina is taught by a teacher at the 45th percentile of the value-added distribution, while the average non-ED elementary student is taught by a teacher at the 55th percentile. 39
We also experiment with other measures of student disadvantage (e.g., students who receive free lunch instead of free or reduced priced lunch, Hispanic or Black students instead of URM, etc.) and definitions of low teacher quality (e.g., defining novice teachers as teachers with 2 or fewer years of experience, low licensure test teachers, low value-added teachers as being in the lowest decile of the distribution, etc.) to ensure that our findings are robust to these different definitions. Our overall conclusion is that the patterns described previously are generally robust to these different definitions. There are, however, a few interesting departures from our main results. For example, we find that Black students in Washington were exposed to fewer novice teachers than White students in Washington prior to 1995, but the novice teacher gap between Black and White students has been positive for the past 20 years (the novice teacher gap between Hispanic and White students has been positive in all years of data).
It is also interesting to note that TQGs calculated from more restrictive definitions of low teacher quality (teachers with 2 or fewer years of experience and/or teachers in the lowest decile of the distributions of licensure test scores or value added) are larger in percentage terms than the TQGs reported previously. This means that disadvantaged students are particularly likely to be exposed to teachers at the lower tail of the effectiveness distribution in both states. These findings echo results from Sass et al. (2010) that the TQG between low-poverty and high-poverty schools is primarily driven by the presence of more low value-added teachers in high-poverty schools. Given recent findings relating teacher turnover to student outcomes (e.g., Atteberry, Loeb, & Wyckoff, 2017; Ronfeldt, Loeb, & Wyckoff, 2013), it is also interesting to consider TQGs in terms of exposure to teachers with different mobility outcomes, namely, teachers who are either new to the school or who will depart the school at the end of the year. We find consistent TQGs in terms of exposure to each of these types of teachers in both states.
Finally, given ongoing debate about the most appropriate specification of value-added models, particularly for this application (e.g., Isenberg et al., 2016), we pursue a number of additional extensions (beyond those already described previously) of our value-added results that use different specifications of the VAM described earlier. Specifically, we experiment with VAMs that consider both past and future years of student performance, control for multiple years of prior performance, include a correction for measurement error in the prior year test scores, and predict student performance in terms of percentile ranks instead of standardized scores. In each case, the correlations between the revised VAM estimates and the estimates from our primary VAM specification are greater than .97, and these specification checks have few implications for our primary results. 40 One exception is the VAM that controls for two prior years of test performance. Specifically, when we limit our sample to fifth-grade teachers (whose students have two prior years of test scores) and estimate TQGs using VAMs that control for one or two years of prior test scores, we find that the estimated TQGs in terms of exposure to lowest quartile VAM teachers is about 75% as large when the VAM controls for two years of prior performance rather than one year. We still prefer our primary VAM specification because it allows us to consider a much larger sample of teachers but note that TQGs appear to be somewhat sensitive to the number of prior years of test scores in the VAM.
Discussion and Conclusions
The broadest conclusion from this analysis (already discussed) is that TQGs are not a new phenomenon; in fact, disadvantaged students in both states were more likely to be exposed to low-quality teachers in every single year of available data and under every definition of student disadvantage and teacher quality. TQGs are therefore a persistent feature of public schools that only exacerbate well-documented achievement gaps between advantaged and disadvantaged students.
That said, a number of trends point to potential implications for policy. First, TQGs have historically been larger when student disadvantage is defined by race than poverty level. For example, the difference in the exposure rate to novice teachers in both states between URM and non-URM students has been typically about twice as large as the corresponding difference between ED and non-ED students. Moreover, this “novice teacher gap” between URM and non-URM students has grown considerably in each state, particularly in Washington. This suggests that in contrast to evidence that gaps in student performance by race have been decreasing over the past several decades (e.g., Reardon, 2011), gaps in exposure to inexperienced teachers by student race have only grown over time. This is not surprising given evidence from the teacher labor market literature suggesting teacher preferences for schools with fewer minority students (e.g., Engel, Jacob, & Curran, 2013) that also tend to have stronger school organizational contexts (e.g., Kraft, Marinell, & Yee, 2016). Policies that incentivize teachers to work in high-minority schools—such as a bonus policy in North Carolina that considerably reduced the attrition of targeted teachers from high-minority schools in the 2000s (Clotfelter, Glennie, Ladd, & Vigdor, 2008)—may be a fruitful avenue for policymakers looking to close these gaps. That said, the gaps by student poverty level are also educationally meaningful, particularly in light of recent evidence demonstrating the importance of school quality to intergenerational income mobility in the United States (Chetty, Hendren, Kline, & Saez, 2014).
Second, there are important differences in the history of TQGs depending on the measure of teacher quality we consider. While TQGs by teacher experience have grown over time, corresponding gaps by teacher licensure test scores in both states have been quite consistent over the years of available data, and gaps by value-added estimates have varied considerably. This points to the importance of understanding the processes that contribute to these TQGs to explain this variation between teacher quality measures and over time.
Our investigation of the heterogeneity of TQGs across different districts and the extent to which each TQG is due to differences across districts, across schools within a district, and across classrooms within a school begins to point us in this direction. For example, while TQGs by teacher experience in Washington in the late 1980s were primarily due to student and teacher sorting within districts, sorting across districts has been the more important contributor to TQGs in Washington for most of the past 20 years. Within-district sorting also contributes to TQGs far more in North Carolina than in Washington, across all measures of teacher quality we consider. This is important because while prior work in Washington suggests that seniority transfer provisions in CBAs may be an important contributor to within-district inequities in teacher quality (Goldhaber, Lavery, et al., 2016), districts in North Carolina are not bound by collectively bargained personnel laws yet appear to have even more within-district inequity.
That said, the goal of our future research agenda is to examine the extent to which different processes in public schools contribute to TQGs and their evolution. Specifically, the TQGs described in this paper are the result of four different processes. First, changing student demographics in different classrooms, schools, and districts may be an important process that contributes to these gaps, particularly given recent evidence of increased racial segregation (Reardon & Owens, 2014) and income segregation (Owens, Reardon, & Jencks, 2016) across schools and school districts. In other words, it’s possible that changes in TQGs (e.g., the growing novice teacher gaps in Washington) are due in large part to growing disadvantaged student populations in districts that already had more novice teachers.
The other three processes have all been well studied in the teacher labor market literature. Specifically, teachers in disadvantaged schools are far more likely to leave their school than teachers in more advantaged schools (Goldhaber, Gross, & Player, 2011; Hanushek, Kain, & Rivkin, 2004; Scafidi, Sjoquist, & Stinebrickner, 2007), teachers who decide to transfer between schools tend to transfer into schools with more advantaged students than the school they left (Clotfelter et al., 2011), and disadvantaged schools tend to hire far more inexperienced and underqualified teachers than advantaged schools (Darling-Hammond, 2004). Future work that builds off emerging research investigating how these processes contribute to TQGs (e.g., Isenberg et al., 2016; Steele et al., 2015) will inform the process that policymakers should seek to influence to close TQGs. For example, if patterns in teacher hiring explain most of the TQGs, policymakers could develop recruitment policies to attract high-quality teachers to disadvantaged schools. But if patterns in teacher attrition drive the observed inequities, policymakers may wish to focus on retention policies designed to keep high-quality teachers in disadvantaged schools. Either way, the evidence in this paper suggests that U.S. public schools have a long way to go in terms of ensuring equal access to quality teaching for advantaged and disadvantaged students.
Footnotes
This work is supported by the William T. Grant Foundation (Grant No. 184925) and the National Center for the Analysis of Longitudinal Data in Education Research (CALDER) (grant No. R305C120008). We wish to thank James Cowan, Matt Kraft, and Rob Rickenbrode for helpful comments that improved the paper as well as Joe Walch and Malcolm Wolff for research assistance. The views expressed in this paper do not necessarily reflect those of American Institutes for Research or the University of Washington.
Notes
D
V
R