



Abstract
Our secondary analysis of Measures of Effective Teaching data contributes to growing evidence that observation ratings, used as part of comprehensive teacher evaluation systems across the nation, may measure factors outside of a teacher’s performance or control. Specifically, men and teachers in classrooms with high concentrations of Black, Hispanic, male, and low-performing students receive significantly lower observation ratings. By using various methodological approaches and a subsample of teachers randomly assigned to classrooms, we demonstrate that these differences are unlikely due to actual differences in teacher quality. These results suggest that policymakers consider the unintended consequences of using observational ratings to evaluate teachers and consider ways to adjust ratings to ensure they are fair.
Keywords
Introduction
In recent years, U.S. federal and state education reforms have made improving teacher quality a priority. As part of this, most states have implemented comprehensive teacher evaluation systems that combine classroom observation ratings, value-added measures (VAM), and in some cases, other measures of teachers’ performance, such as student surveys (Doherty & Jacobs, 2013). However, much of the conversation about teacher evaluation has focused on the use of VAMs despite methodological and practical concerns regarding this measure. For instance, the American Educational Research Association (2015) recently issued a statement cautioning the use of VAMs for high-stakes evaluations of teachers and teacher preparation programs, stating, Although there may be differences in views about the desirability of using VAM for evaluation purposes, there is wide agreement that unreliable or poor-quality data, incorrect attributions, lack of reliability or validity evidence associated with value-added scores, and unsupported claims lead to misuses that harm students and educators. (p. 4)
Observation ratings of teachers from standards-based evaluation systems offer several potential benefits over VAMs. Observation ratings are available for all or most teachers, whereas VAMs are only available for teachers in tested grades and subjects. Though VAMs provide an overall estimate of a teacher’s ability to improve student learning, they offer little information about the quality of instruction. Ratings from observation instruments, by contrast, have the potential to provide teachers with useful feedback about the quality of their teaching across different instructional domains.
As VAMs have become more controversial, the increased reliance on classroom observation ratings as a measure of teacher and/or teaching quality is not without issues. A growing body of evidence suggests that observation ratings are valid and reliable measures of teacher quality, though there exists some concern that they may not be equitable (Campbell, 2014; Kane & Staiger, 2012; Whitehurst, Chingos, & Lindquist, 2014). Specifically, new evidence indicates that observation ratings may vary with the characteristics of teachers (race/ethnicity and gender) and the students they teach (performance level, race/ethnicity, and income status), apart from the quality of teaching being observed (Campbell, 2014; Whitehurst et al., 2014). Prior research in this area suggests these trends likely reflect inequities in the application of existing teacher evaluation systems. However, alternative explanations are possible. In particular, these differences could also reflect real differences in teacher quality. We know, for example, that less qualified and less effective teachers tend to sort into classrooms and schools with more marginalized 1 student populations (Goldhaber, Lavery, & Theobald, 2015; Kalogrides, Loeb, & Béteille, 2013). Though prior studies have attempted to separate inequities in observation ratings from actual differences in teacher quality, efforts have been constrained by data and other limitations.
Drawing on data from the Measures of Effective Teaching (MET) Project, we examine whether teachers’ observation ratings are related to their own characteristics, the characteristics of the students they teach, and what may explain observed relationships. Using innovative methodological approaches, we make progress in disentangling differences in observational ratings due to teacher quality from other explanations. We provide strong evidence that teachers of Black, Hispanic, male, low-performing, and in some cases, low-income students get significantly lower observation ratings even after accounting for differences in teacher quality. We also find some evidence that observational ratings vary by teachers’ gender—men, on average, receive lower ratings than women. These results suggest that policymakers consider the unintended consequences of using observational ratings to evaluate teachers and consider ways to possibly adjust ratings to ensure they are fair.
Background
The research on observational evaluations of teachers has focused primarily on their relationships with student performance, paying less attention to their relationships with teacher, school, and classroom characteristics. In the following, we review the few existing studies that have considered these relationships.
Observational Evaluations and Teacher Characteristics
Jacob and Walsh (2011) considered several teacher characteristics related to productivity, including educational credentials, experience, absences, and race/ethnicity-gender. They found that teachers who had more teaching experience, were from selective colleges, and majored in education received higher ratings than their peers. They also found that principals rated White female teachers higher than all other racial/ethnic-gendered groups, even after conducting robustness checks for sample selection. Though it is possible that these trends reflect principal preferences beyond instructional quality, it is also possible that White female teachers happen to be better quality teachers than all other teachers. The authors note that a major limitation of their analysis was the inability to directly measure teachers’ instructional quality using, for example, student test performance.
To separate differences in observation ratings due to actual differences in instructional quality from differences due to other teacher characteristics, Campbell (2014) built on Jacob and Walsh (2011) by also controlling for teachers’“direct” contributions to student learning, as measured by VAM. Consistent with Jacob and Walsh, Campbell found that White male English language arts and Black female math teachers received lower ratings than White female counterparts in their respective subjects after adjusting for teacher quality as measured by VAM. Moreover, the findings held when using a school fixed effects framework, effectively comparing teachers only to their colleagues in their same schools.
In their investigation of the new teacher evaluation system in the Chicago Public Schools, Jiang and Sporte (2016) similarly found that men and teachers of color 2 received significantly lower observation ratings than women and White teachers, where negative effects were most pronounced among Black teachers. By contrast, they found no race or gender differences when examining value-added measures. In separate models, the authors included school fixed effects to test whether differences between school contexts, including student demographics, might explain these relationships; the effects of teacher gender and race persisted, though the magnitude of the point estimate on Black teachers decreased by about two-thirds. The latter finding suggests that most of the Black teacher effect was explained by differences between schools; namely, the authors argue, Black teachers disproportionately work in schools with a high concentration of low-income students where teachers tend to receive lower observation ratings. Even so, Black teachers were still rated lower compared to peers in their same schools.
These studies provide initial evidence that teacher evaluations may not be equitable; however, they do not address the systematic sorting of teachers into classrooms and students to teachers. Thus, it is possible that observed relationships between teacher ratings and teachers’ race/ethnicity and gender are explained by differences between the kinds of students they teach. Our study extends prior work by addressing this concern. Because a subsample of teachers in the MET study were randomly assigned to classrooms, we are able to interrogate whether the effects of teachers’ race and gender persist even in settings where teacher-classroom sorting did not exist. Additionally, while prior studies have used school fixed effects to try to disentangle the effects of school characteristics from teacher characteristics, within-school, between-classroom differences could still account for the observed relationships between observation ratings and teacher characteristics; by including a vector of classroom characteristics in some models, we make progress in disentangling the contribution of teacher characteristics from classroom characteristics. Finally, because teachers may perform differently across classes based on the student composition, aggregating VAMs to the teacher level likely masks important within-teacher, between-classroom variation in instructional quality. To better disentangle the contributions of actual differences in instructional quality from contributions of rater biases/tendencies, we extend prior work by adjusting for classroom-level, rather than teacher-level, VAMs.
Observational Evaluations and Classroom and School-Level Characteristics
A wide body of literature suggests that teachers who teach marginalized students tend to have lower VAM scores. For example, teachers of students who are low performing, low income, receiving special education services (SPED), and English language learners (ELL) tend to have lower VAM scores than teachers of high-performing and more privileged student populations (Lauen & Gaddis, 2013; Sanders & Rivers, 1996; Sass, Hannaway, Xu, Figlio, & Feng, 2012). One explanation is that less effective teachers tend to sort into schools with a large proportion of marginalized students (Lankford, Loeb, & Wyckoff, 2002). Another explanation is that teachers perform worse, independent of average teacher effectiveness, in schools with large proportions of marginalized students due to worse working conditions of these schools, including worse collaboration and leadership quality, known to influence teaching quality and retention (Kraft & Papay, 2014; Loeb, Darling-Hammond, & Luczak, 2005; Ronfeldt, 2015). Both Kraft and Papay (2014) and Ronfeldt (2015) demonstrate that a given teacher performs worse when teaching in schools with worse working conditions compared to the same teacher in schools with better working conditions.
Though most studies have focused on VAMs, an emerging body of literature has begun to consider whether teacher quality as measured by observation ratings varies with student characteristics. Jacob and Walsh (2011), described previously, found average ratings of teachers do not vary by schools’ racial/ethnic student composition. They found that observationally similar principals gave higher average ratings to teachers in high-performing elementary schools than teachers in low-performing elementary schools. However, the authors used school rather than classroom characteristics, which makes it difficult to separate the principal’s influence from the school’s influence on teacher ratings and masks within-school, between-teacher differences in classroom composition that could contribute to differences in how teachers are evaluated (Kalogrides & Loeb, 2013). The differences in ratings between high- and low-performing schools could suggest that observation ratings are measuring what they were designed to capture—differences in instructional quality. However, the analytic approach used in this study cannot rule out the possibility that instructional quality is identical across schools but that more stringent raters happened to take jobs as principals in low-performing schools or principals tend to rate teachers more harshly when they are working with low-performing students.
Whitehurst and colleagues (2014) begin to address some of these concerns by exploiting within-school (and thus within-rater), between-teacher differences in observation ratings to test whether a teacher’s ratings depend on the composition of students in his or her classroom. They found that teachers of students with higher incoming performance received better observation ratings, on average, than teachers of students with lower incoming performance. Given teacher quality should be independent of the incoming performance of students, the authors concluded that principal ratings of teachers are biased because they measure other factors beyond instructional quality. They specifically target bias among raters, stating: “When observers see a teacher leading a class with higher ability students, they judge the teacher to be better than when they see that same teacher leading a class of lower ability students” (p. 16).
Explanations other than rater bias, though, are possible. First, it could be that less effective teachers are systematically assigned to classrooms with low-performing students. Whitehurst et al. (2014) note that they compared the same teacher over time and got similar results, which would make progress in ruling out this alternative explanation so long as their models appropriately adjusted for the effects of teaching experience. However, the authors do not describe the methodology they used or report their estimates, so it is difficult to assess how well they addressed this issue. Moreover, absent random assignment of teachers to classrooms, it is impossible to fully rule out sorting of this kind.
A second possible explanation is that low-performing students are more challenging to teach, thus making it more difficult for the same teacher to perform at high levels than when working with high-performing kids; in other words, observers might not have been biased but did indeed observe worse teaching in classrooms with low-performing students. A recent study by Steinberg and Garrett (2016) provides the strongest experimental estimates to date that students’ incoming performance indeed predicts better observation ratings of teachers. Like our study, the authors use the MET data and perform a number of methodological approaches to identify whether matching of teachers to classes influences the observation ratings of teachers. The authors found that teacher-student sorting indeed leads to bias in observation ratings—teachers who work with higher performing students receive higher ratings than would be expected based on estimates of fixed teacher quality. This finding suggests that teacher-student sorting that is typical in schools and districts likely penalizes the ratings of teachers who work with low-performing students.
Of particular relevance to the present study, though, the authors also investigate the subsample of teachers in the second year of the MET study who were randomly assigned to students, for whom systematic sorting cannot explain observed effects. Even among teachers who were randomly assigned, those assigned to students with higher incoming performance received stronger observation ratings than other teachers. Thus, even where such sorting is not present, incoming performance of students predicts a teacher’s ratings. How can this be? As suggested previously, two likely explanations remain: (Explanation 1) rater bias based on classroom composition of students and (Explanation 2) being assigned higher achieving students indeed benefits teaching (not teacher) quality. Steinberg and Garrett (2016) conclude, “Ultimately, we are unable to definitively determine whether the incoming achievement 3 effect reflects bias in observation scores due to the composition of a teacher’s class or whether teachers are systematically higher performing when assigned to higher achieving students” (p. 21).
Though we too do not fully resolve what explains the observed relationships between classroom composition of students (including prior achievement) and observational ratings, we extend prior research generally, and the work of Steinberg and Garrett (2016) specifically, by making progress in examining and disentangling these two likely remaining explanations. In some model specifications, we include classroom VAM scores as measures for classroom-specific instructional quality. We include these, for example, in models with teacher and teacher-by-year fixed effects. By doing so, we adjust for, respectively, within-teacher and within-teacher-and-year across classroom differences in instructional quality (Explanation 2) and find observed relationships between classroom composition and observational ratings persist. We believe our teacher-by-year specifications, not used by Steinberg and Garrett or any prior work, are particularly useful because they help rule out the possibility that within-teacher, across-year improvements in instructional quality associated with changes in classroom composition could explain observed effects.
In addition to making progress over prior work in ruling out Explanation 2, we also include sensitivity analyses that more directly test for evidence of rater bias (Explanation 1). Specifically, we hypothesize that if raters are responding to student characteristics by evaluating more harshly/leniently, then these rater biases should be captured in the interactions between rater main effects and classroom characteristics (e.g., proportion of Hispanic students). Rater main effects would capture average harshness/leniency of raters across kinds of classrooms; the interaction of rater main effects with classroom composition, though, indicates the degree to which ratings vary with changes in classroom characteristics. We find that adding rater by classroom characteristic interactions explains more of the variation in classroom observation ratings than the rater main effects, suggesting that rater bias in response to classroom composition is likely a contributing factor.
We extend the work of Steinberg and Garrett (2016) in at least three other ways as well. First, though Steinberg and Garrett provide experimental estimates for the relationship between incoming student performance and teachers’ observation ratings, they do not explicitly investigate other student characteristics that may influence a teacher’s observation ratings. Assuming rater bias exists, we speculate that observation ratings of teachers would likely have strong relationships with other observable student characteristics that are more salient than incoming performance, such as student race and gender. Thus, our study also goes beyond Steinberg and Garrett by investigating the relationships between observational ratings and other student characteristics (e.g., student race, gender, income status) beyond prior achievement; in doing so, we also extend other prior research by presenting causal estimates for these relationships. A second way our study extends Steinberg and Garrett and other prior literature is by considering simultaneously the effects of teacher and student characteristics on observational evaluations and whether and how one (e.g., teacher race) may be driven by the other (e.g., student race).
Finally, by employing different analytic methods to common data, our study tests whether Steinberg and Garrett’s (2016) findings regarding the relationship between student prior performance and observation ratings are reproducible under different assumptions. Among other differences, we: (a) combine math and English language arts (ELA) subjects instead of looking at these subjects separately 4 ; (b) keep all classrooms where randomization held rather than keeping only those classrooms where randomization held across classrooms in the same block in defining our randomization sample 5 ; (c) include classroom-level VAM scores as a measure of instructional quality; (d) use different model specifications, including three-level multilevel models rather than ordinary least squares (OLS) models that cluster standard error at the teacher level and in some cases teacher-by-year fixed effects; and (e) allow observation ratings (dependent variable) to vary within classrooms across times rather than aggregate observation ratings up to the classroom level; this allows us to utilize all available variation in the outcome.
Even with these changes, our estimates for the relationship between student prior performance and observation ratings are consistent with those presented by Steinberg and Garrett (2016). Though reproducibility is a critical principle of the scientific method, it is often overlooked and undervalued in educational research. In advocating for more replication studies in educational research, for example, Makel and Plucker (2014) revealed that less than 1% of education articles in top journals were replication studies. Our results then confirm the findings presented by Steinberg and Garrett and, in so doing, add to the increasing evidence that the observed relationships between observation ratings and classroom characteristics represent real effects, which has implications for educational policy and practice.
In summary, our study then extends the prior literature in a number of ways. Perhaps most importantly, we make progress in disentangling whether the relationships between classroom characteristics and observation ratings of teachers are explained by the systematic sorting of teachers to classrooms, differences in classroom-specific teaching quality, or rater bias. In addition to leveraging the randomized study design and using teacher fixed effects, we interrogate systematic sorting by also employing teacher-by-year fixed effects to test whether a teacher gets differentially worse ratings in classrooms with more marginalized students than the same teacher in the same year with fewer marginalized students. We then control for classroom-specific VAM scores to try to differentiate within-teacher, across-classroom differences in instructional quality from rater biases due to differences in classroom composition. Since teacher and student sociodemographic characteristics are often related (e.g., same-race sorting), we also test whether the relationships between observation ratings and teacher characteristics (e.g., race and gender) observed in prior literature are explained by student characteristics. Specifically, this study asks: Are teachers’ observation ratings related to teacher characteristics or those of the students they teach? If so, what explains these relationships?
Data and Methods
Data
We conducted a secondary analysis of data collected as part of the Measures of Effective Teaching Project. Funded by the Bill & Melinda Gates Foundation, this project collected teacher and student administrative records data, survey data, and observational data during the 2009–2010 and 2010–2011 academic years. During the first year of the MET project, 2,746 teachers participated; 1,868 of these teachers continued to participate in the second year of the project. 6 Participants were primarily math and ELA teachers in Grades 4 through 8, with a small sample of ninth-grade Algebra I, English, and biology teachers. These teachers worked in 317 schools across six large urban school districts in the United States. Using unique teacher, classroom, and school identifiers, teachers were linked to classrooms and schools where observations took place.
Sample
For this analysis, we include only teachers evaluated at least twice so that we can use a teacher fixed effects approach (described later). Because our analysis focuses on the Framework for Teaching instrument, which was used only to evaluate math and ELA teachers in Grades 4 through 8 and Grade 9 Algebra I teachers, 7 biology teachers were excluded from the sample. We also restricted the sample to classrooms with complete information on the classroom covariates of interest. One district was missing free and reduced-priced lunch data for all students and classrooms; therefore, it is excluded from the analytic sample. Based on these restrictions, the analytic sample consisted of 1,296 teachers teaching in 2,985 classrooms in 237 schools across five districts.
During the second year of the study, a subsample of Year 1 participants was randomly assigned to preformed (summer of 2010) class rosters of students. To qualify for the randomization group, teachers had to be certified, plan to teach in the same subject and grade in Year 2 as they had in Year 1, and work in a school with at least one other teacher who would be teaching the same subject and grade as them in Year 2. Though Garrett and Steinberg (2015) found that initial randomization of teachers to class rosters was successful, White and Rowan (2014) and Steinberg and Garrett (2016) have demonstrated that students (or those who placed them) did not fully comply with the initial randomization and that the subsequent noncompliance appears to have been nonrandom. Therefore, we define our “randomized” sample as only Year 2 observations of teachers who had been initially randomized and had fully compliant classrooms—where all students randomly assigned to a classroom remained there the entire year. This subgroup of teachers made up 33% of the 1,296 teachers in our full sample. We refer to all other teachers as our “nonrandomized” sample, including teachers who were either never randomized, randomized but with full or partial noncompliance among students, or Year 1 observations of teachers in our “randomized” group before they participated in the random assignment.
Given noncompliance, we follow the methodological approach used by Garrett and Steinberg (2015) to examine the fidelity of the MET study randomization using a covariate balance test. This test allows for the determination of whether current classroom characteristics are associated with randomized teachers’ prior observation ratings. To conduct the balance test, we predicted the pre-randomization (Year 1) observation ratings as a function of Year 2 classroom-level student characteristics of teachers in our randomized sample, controlling for randomization block fixed effects. Summarized in Table 1, findings from the covariate balance tests indicate that the classroom characteristics are not statistically related to teachers’ 2010 observation ratings; therefore, we conclude that randomization was successful for this sample. 8
Covariate Balance: Student Characteristics and Randomized Teacher Observation Ratings

Note. Standard errors in parentheses We employed randomization fixed effects with standard errors clustered at the randomization block level. All models include grade, subject, and year indicators. SPED = students receiving special education services; ELL = students receiving English language learning services; FRPL = students eligible for the free or reduced-price lunch program; Other students of color = students labeled Race Other by the Measures of Effective Teaching Project. We understand that a limitation of combining racial/ethnic groups is that this masks their unique experiences and the relationship on teachers’ observation ratings.
Table 2 summarizes the characteristics of teachers in the full and randomized analytic samples as well as characteristics of the classrooms in which they taught. On average, most of the teachers in both samples were women and White. Teachers in the full sample had, on average, 7.8 years of experience in the district, ranging from 0 to 42 years of experience, while teachers in the randomized sample had more years of experience (9.3 years).
Teacher and Classroom Characteristics

Note. Proportions are reported for all teacher and classroom characteristics except experience, classroom VAM (in standard deviation units), prior performance (in standard deviation units), and class size. Years of experience is the years of teaching experience in the district. Classroom characteristics variables are in proportions. SPED = students receiving special education services; ELL = students receiving English language learning services; FRPL = students eligible for the free or reduced-price lunch program; Other students of color = students labeled Race Other by the Measures of Effective Teaching (MET) Project; VAM = classroom-level value-added measures; Other teachers of color include Hispanic teachers and teachers labeled Race Other by MET. Due to sample sizes, we combined these two groups of teachers. We understand that a limitation of combining racial/ethnic groups is that this masks their unique experiences and the relationship on teachers’ observation ratings.
On average, teachers in the full sample taught in classrooms with the majority of students being eligible for free or reduced-priced lunch (57%). About 67% of students in the classrooms were either Black or Hispanic. Only 8% were classified as receiving SPED services, while 12% were classified as ELL. The majority of the classrooms in the sample were ELA (44%), with math classrooms making up 38% of the sample, and the remaining 17% of the classrooms were both ELA and math. The latter group were mostly classified as “subject matter generalist” and taught in elementary, self-contained classrooms. Teachers in the randomized subsample also taught in classrooms with most students being eligible for free or reduced-priced lunch (62%). About 64% of students in the classrooms were either Black or Hispanic, which is slightly lower than teachers in the full sample. Similar to the full sample, 8% were classified as receiving SPED services, and 12% were classified as ELL. Fifty percent of the teachers taught ELA only; however, 10% taught both ELA and math.
Measures
Observation Ratings
The MET researchers rated teachers using five observation instruments (for a detailed description of each instrument, see White & Rowan, 2014). In this study, we focus on the Framework for Teaching (FFT) observation instrument because of its wide use in teacher evaluation systems across several states and school districts. There are four FFT domains; however, MET researchers decided to evaluate teachers on only two of the four FFT domains—Instruction and Classroom Environment. Each domain includes four dimensions. The Classroom Environment domain includes: creating an environment of respect and rapport, establishing a culture for learning, managing classroom procedures, and managing student behavior. The Instruction domain includes: communicating with students, using questioning and discussion techniques, engaging students in learning, and using assessment in instruction. All dimensions were on a 4-point scale, where a rating of 1 indicated unsatisfactory and a rating of 4 indicated distinguished.
All raters, who were current or former teachers, were trained and certified. Training of the raters included four sections: (a) training in the Web interface used to access videos, (b) training on how to eliminate bias in scoring, (c) training that provided an overview of the protocol, and (d) specific training on the scoring of each scale in a protocol, where raters completed an initial certification test. Raters were external to the school setting and had no personal relationship with the teachers observed. Rather than visiting classrooms to observe live teaching, raters in the MET study completed classroom observation ratings while watching digital videos. Multiple raters scored each classroom.
We standardized each of the eight dimensions and then averaged the standardized dimensions to create a composite rating at the observation (lesson) Level9 (See Figure 1 for the distribution of standardized composite ratings across teachers). Unlike Steinberg and Garrett (2016), who use classroom-level aggregate ratings, we allow ratings to vary within classrooms and across observations (lessons). In our multilevel models, we nest observations (lessons) within classrooms to adjust for the fact that observations are not independent of one another. An advantage of our approach is that it leverages more of the variation available in the outcome (rather than aggregating to the classroom level) while adjusting standard errors according to the number of observations (lessons) for a given classroom. We refer to each of these observation rating (lesson) scores as OR. On average, teachers had four ORs for each classroom across both years.

Distribution of composite Framework for Teaching observation ratings.
Value-Added Measures
MET researchers constructed VAM from state and supplemental assessments. Using classroom rosters to link teachers to students, MET researchers estimated VAM models separately for each subject, grade, and district by employing a two-stage process. In the first stage, student test scores were estimated as a function of individual student characteristics, student’s prior year test scores, classroom characteristics including the average prior performance of all students, and a student-level residual (for more detail, see White & Rowan, 2014). After estimating the model, student-level residuals were aggregated at the class level to construct the classroom-level teacher VAM. Each of the VAM models were test, grade, and district specific. Across all ORs for a teacher in a given classroom, we use a single classroom VAM, provided in the MET data set. However, for self-contained classrooms, there were two VAMs—math and ELA; in those cases, we used the subject that aligned with the particular subject the teacher was teaching when observed. 10
Analysis
To examine the relationship between teacher and classroom characteristics and observation ratings, we employed a three-level hierarchical linear modeling (HLM) approach with observation ratings (lessons) at Level 1, classrooms at Level 2, and teachers at Level 3. Unconditional models indicated that the proportion of the total variance of ORs accounted for at the classroom and teacher levels was 36% and 34%, respectively. We estimated several HLM models in addressing our research questions; however, the reduced form equation for the full model is as follows:

Here, the observation rating (OR) i in classroom j of teacher k is a function of time-invariant and varying teacher characteristics (T); a vector of classroom characteristics (C); year, grade, and subject indicators (
Because teachers are typically not randomly assigned to classrooms, a particular concern is the potential for sorting of less effective teachers into certain kinds of classrooms—this kind of sorting could account for any observed relationships between observation ratings and classroom characteristics. To address this potential sorting bias, we also use teacher fixed effects models to estimate whether the same teacher receives different ratings in different classrooms depending on the composition of the students he or she teaches. By using a teacher fixed effects approach, we effectively compare the same teacher across years and/or classrooms. The teacher fixed effects approach is feasible only for teachers with multiple observation ratings and variation in the characteristics of students he or she teaches. If a teacher is observed with multiple ratings but for only one classroom, there will be no variation in classroom characteristics. Therefore, identification in these models comes from teachers who have multiple classrooms either over the two years of data or by teaching multiple classes within a year. Because of this identification strategy, the number of teachers in our sample was reduced from 1,296 to 1,102. The teacher fixed effects model takes the following form:

Here, the observation rating (OR) i in classroom j of teacher k is a function of a vector of classroom characteristics (C); time-varying teacher characteristics (
A teacher fixed effects framework, though, might not adequately adjust for time-varying teacher or school characteristics that could also contribute to differences over time in teacher evaluation, such as teaching experience. The teacher fixed effects models shown in Equation 2 assume that a teacher’s quality is comparable across both years. However, there is substantial evidence that each year of teaching experience contributes meaningfully to teacher quality (Papay & Kraft, 2015). Thus, we also ran models where we replaced teacher fixed effects with teacher-by-year fixed effects in Equation 2. 12 In these models, time-varying teacher characteristics are absorbed by the teacher-by-year fixed effects. By using a teacher-by-year fixed effects approach, we effectively compare the same teacher in the same year but across classrooms; thus, teacher-by-year fixed effects can only be estimated for teachers that have multiple classrooms in a given year. Therefore, teachers with multiple classrooms across years are not included in the analysis as teachers with one classroom in a given year. A large majority of the reduction in the sample comes from teachers who teach at the elementary school level where teachers are in self-contained classrooms over the course of a year. Because of this identification strategy, the number of teachers for this sample is 554, compared to 1,102 in the teacher fixed effects approach.
Because the teacher and teacher-by-year fixed effects models are \covariate-adjusted models, they still may be prone to bias due to the systematic sorting of teachers to certain kinds of classrooms and schools. To further rule out this concern, we leveraged the random assignment of a subset of teachers to predetermined classrooms, which took place in the second year of the MET study. Similar to Equation 1, we then estimated HLM models for the randomized sample and another for the nonrandomized sample (see the “Sample” section for a detailed description for these two subsamples).
Because across-model specification described previously we find observation ratings to be associated with classroom characteristics, we conducted a series of sensitivity analyses aimed at discerning whether these relationships are due specifically to rater biases. In particular, for each of the focal classroom characteristics that predicted observation ratings (student race, gender, income status, and prior performance), we employed a three-stage modeling approach. In the first stage, we removed a focal classroom characteristic (e.g., proportion of Hispanic students) and then used OLS regression models to estimate observation ratings as a function of teacher characteristics and all other classroom characteristics included in Equations 1 and 2. In Stage 2, we then used OLS regression to estimate the residual from Stage 1 as a function of the previously removed classroom characteristic (e.g., proportion of Hispanic students) and rater main effects. We use the residual from Stage 1 as the outcome because in theory, these represent random error after all of the teacher and classrooms characteristics that are systematically related to ORs have been removed and should be uncorrelated with other predictors.
Finally, in Stage 3, we reproduced models from Stage 2 but included interactions between rater main effects and the focal classroom characteristic. The interaction terms in our Stage 3 models represent rater-specific slopes for the relationship between observation ratings and the target classroom characteristic. If all raters are biased in the same way across classroom characteristics, it would be impossible for us to detect bias; however, if raters are biased, then we would expect the slopes of those raters to significantly differ from other raters. Thus, we examined the number of interaction terms that differed significantly from the mean of raters to check whether that number was greater than what we would expect due to chance. We also conducted likelihood ratio tests (LR) between the Stage 2 and 3 models to determine whether the models with the interaction effects are explaining significantly more of the variation in classroom observation ratings than models without the interactions; finding LR tests to be nonsignificant would suggest interaction terms are not contributing significantly to the models and thus that rater bias is unlikely to be influencing observation ratings in a significant way.
Findings
Research Question 1: Associations Between Observation Ratings and Teacher Characteristics
Table 3 summarizes results estimating teachers’ observation ratings as a function of teacher characteristics. Column 1 estimates teachers’ ORs as a function of their race/ethnicity and gender to examine whether these sociodemographic characteristics predict ORs. Column 2 then adds classroom characteristics to determine whether observed relationships between teachers’ sociodemographic characteristic and ORs are explained by the composition of students in their classrooms. Column 3 then adds two measures of teacher quality—current classroom-level VAM, as our measure of classroom-level instructional quality, and years of teaching experience in the district. This specification allows us to test whether any observed effects of teacher race or gender are explained by differences in teacher quality.
Differences in Observation Ratings Based on Teacher Characteristics

Note. Standard errors in parentheses. All models include grade, subject, and year indicators. Other teachers of color include Hispanic teachers and teachers labeled Race Other by Measures of Effective Teaching (MET) Project. Due to sample sizes, we combined these two groups of teachers. We understand that a limitation of combining racial/ethnic groups is that this masks their unique experiences. VAM = classroom-level value-added measures. Classroom controls include aggregated student race, gender, English language learners, prior performance, class size, students eligible for free or reduced-price lunch, and students who receive special education services. Observation ratings M (SD) = 0.01 (0.739).
p < .01.
Across all modeling specifications, we find men receive lower ratings than women even after adjusting for the characteristics of the students they teach and differences in teachers’ instructional quality. We also find that Black teachers receive lower ratings on average than White teachers by about one-tenth of a standard deviation, which, in our models, is equivalent to the average difference in observational ratings between a first- and a second-year teacher (β = 0.09), an amount we know to be meaningful. However, after we adjust for student characteristics, the observed relationship between ratings and teachers’ race changes direction and is no longer significant. Thus, differences in ratings between Black and White teachers appear to be driven by differences in the populations of students taught by these teachers. Consistent with this explanation, we compare classrooms between Black and White teachers and find significant differences (see Appendix)—Black teachers teach in classrooms with significantly larger proportions of Black, male, SPED, and low-performing students and smaller proportions of Hispanic and low-income students. Of particular note, Black teachers teach a higher proportion of Black students than White teachers; in the median classroom among Black teachers, 82% of the students are Black, whereas the median percent of Black students for White teachers is 12%.
In analyses thus far, we have attempted to make covariate adjustments to isolate the effect of teacher characteristics on observation ratings from the effect of classroom characteristics. However, these models do not adjust for unobserved characteristics of teachers or their classrooms. Additionally, even among observed characteristics, adding them as covariates will not fully adjust for differences due to the systematic sorting of certain types of teachers into certain types of classrooms, like the race matching we describe previously. Prior literature has shown that teachers of color tend to work in schools and classrooms with a higher proportion of students who are low income (Jiang & Sporte, 2016), low performing (Kalogrides et al., 2013), and of color (Campbell, 2014). This systematic sorting of teachers of color into classrooms and schools with more marginalized students than White teachers may bias estimates even in models that control for sociodemographics of students.
To address this concern, we leverage the random assignment of teachers to classrooms that took place in the second year of the MET study. As previously mentioned in the “Data and Methods” section, randomization was preserved among teachers whose classrooms were fully compliant with randomization. Table 4 presents results for randomized teachers (Columns 1–3) and nonrandomized teachers (Columns 4–6). We use a similar modeling progression as used in Table 3. Results are generally consistent across the randomized and nonrandomized groups except that the observed effect of teacher gender appears to be greater in magnitude among nonrandomized teachers. Since randomization occurred within schools, these models do not address the potential for the systematic sorting of teachers between schools. In an effort to address between-school sorting, we also include randomization block fixed effects (see Table 5), which are similar to school fixed effects since randomization was within schools. So these come closer to addressing between-school sorting, though are unlikely to do so fully. The findings are generally consistent with the randomized and nonrandomized results in Table 4, though the point estimates on male teachers are larger in magnitude across specifications and still negative and significant. In summary, the results suggest that men tend to receive lower ratings than women, with the most convincing evidence that systematic sorting does not fully explain the effects of teachers’ gender on observational evaluations shown in the randomization block fixed effects specification.
Differences in Observation Ratings Based on Teacher Characteristics, by Randomization Subsample

Note. Standard errors in parentheses All models include grade and subject indicators. The full and nonrandomized samples also include a year indicator. Other teachers of color include Hispanic teachers and teachers labeled Race Other by the Measures of Effective Teaching (MET) Project. Due to sample sizes, we combined these two groups of teachers. We understand that a limitation of combining racial/ethnic groups is that this masks their unique experiences. VAM = classroom-level value-added measures.
p < .10. **p < .05. ***p < .01.
Differences in Observation Ratings Based on Teacher Characteristics Using Randomization Block Fixed Effects (RBFE)

Note. Standard errors in parentheses. Other teachers of color include Hispanic teachers and teachers labeled Race Other by the Measures of Effective Teaching (MET) Project. Due to sample sizes, we combined these two groups of teachers. We understand that a limitation of combining racial/ethnic groups is that this masks their unique experiences.
p < .10. ***p < .01.
Research Question 2: Associations Between Observation Ratings and Classroom Characteristics
Table 6 presents results from models estimating teachers’ ORs as a function of classroom characteristics. Column 1 summarizes estimates from three-level HLM models with only classroom characteristics as predictors, while Column 2 also includes teacher characteristics (race/ethnicity, gender, VAM, and experience). In Columns 3 and 4, we replicate Columns 1 and 2 but replace time-invariant teacher characteristics with teacher fixed effects; in Columns 5 and 6, we use teacher-by-year fixed effects.
Differences in Observation Ratings Based on Classroom Characteristics

Note. Standard errors in parentheses Standard errors are clustered at the teacher level in the teacher fixed effects models and at the teacher-by-year level in the teacher-by-year fixed effects models. Hierarchical linear modeling and teacher fixed effects models include grade, subject, and year indicators; teacher-by-year fixed effects includes grade and subject indicators. SPED = students receiving special education services; ELL = students receiving English language learning services; FRPL = students eligible for the free or reduced-price lunch program; Other students of color = students labeled Race Other by the Measures of Effective Teaching (MET) Project. We understand that a limitation of combining racial/ethnic groups is that this masks their unique experiences and the relationship on teachers’ observation ratings. VAM = classroom-level value-added measures.
p < .10. **p < .05. ***p < .01.
Column 1 estimates suggest that teachers in classrooms with more students who are Black, Hispanic, male, low performing, and low income receive significantly lower ratings than their peers. A possible explanation is that less effective teachers systematically sort into classrooms with these student populations. To test this explanation, in Column 2, we include two measures of teacher effectiveness—teaching experience and classroom-specific VAM scores, along with teachers’ sociodemographic characteristics. The results persist after adjusting for differences in teacher effectiveness (Column 2), suggesting that the relationships between classroom characteristics and observation ratings of teachers are unlikely to be due to actual differences in teacher effectiveness.
One might be inclined to conclude, then, that rater bias is at work. However, it is also possible that unobserved characteristics of teachers could explain the results. For example, less effective teachers on measures for teacher quality not captured by experience and VAM could differentially sort into classrooms with more students who are Black, Hispanic, male, low performing, and low income. Thus, in Column 3 and 4, we include teacher fixed effects to adjust for both observed and unobserved time-invariant characteristics of teachers, finding results to be similar.
As described in the “Analysis” section, though, a teacher fixed effects framework might not adjust adequately for time-varying teacher or school/classroom characteristics that contribute to differences over time in teacher ratings. As an additional test, we reproduced models replacing teacher fixed effects with teacher-by-year fixed effects (see Column 5). These models effectively compare classrooms of the same teacher in the same year to test whether teachers are rated differently in classrooms with different student compositions. Since comparisons are within the same teacher and year, time-varying teacher and school characteristics are unlikely to explain effects. We go further in Column 6 by adjusting for classroom-specific VAM, which varies across classrooms but within teacher and year; this allows us to test whether observed relationships are explained by differences in classroom-specific instructional quality for the same teacher in the same year. As a general trend, when compared with teacher fixed effects models, the point estimates on most classroom characteristics were similar or increased slightly in magnitude; however, most were nonsignificant due to the fact that standard errors almost doubled with the inclusion of teacher-by-year fixed effects.
Across model specifications in Table 6, point estimates on the proportion of Hispanic and Black students fell mostly within the range of β = −0.3 to −0.4, suggesting that teachers in classrooms with 100% Hispanic (or Black) students receive ratings that are 30% to 40% of a standard deviation lower than teachers in classrooms with 0% Hispanic (or Black) students. Said another way, a 25 percentage point increase in Hispanic or Black students is associated with a decrease in observational ratings by 8% to 10% of a standard deviation, which is equivalent in our models to the difference in ratings between a first- and a second-year teacher, which is a meaningful amount.
As described in the previous section, models that adjust for student covariates and fixed effects are still prone to bias due to the systematic sorting of teachers to certain kinds of classrooms and schools. Thus, we test whether the observed relationships between observation ratings and classroom composition hold even with the subsample of randomized teachers. Table 7 reports results from the randomized (Columns 1 and 2) and nonrandomized (Columns 3 and 4) samples of teachers. The model progression is similar to Table 6; Columns 1 and 3 summarize estimates from three-level HLM models with only classroom characteristics as predictors, and Columns 2 and 4 also includes teacher characteristics.
Differences in Observation Ratings Based on Classroom Characteristics, by Randomization Subsamples

Note. Standard errors in parentheses. All models include grade, subject, and year indicators. Classroom characteristics variables are in proportions. SPED = students receiving special education services; ELL = students receiving English language learning services; FRPL = students eligible for the free or reduced-price lunch program; Other students of color = students labeled Race Other by the Measures of Effective Teaching (MET) Project. We understand that a limitation of combining racial/ethnic groups is that this masks their unique experiences and the relationship on teachers’ observation ratings. VAM = classroom-level value-added measures.
p < .10. **p < .05. ***p < .01.
We see that the directions and magnitudes of point estimates on the proportion of Black, Hispanic, and low-performing students are similar across the randomized and nonrandomized subsamples, suggesting that the systematic sorting of teachers to classrooms likely does not explain these effects. However, the effect of male students is substantially smaller in magnitude among teachers who were randomly assigned to students, suggesting the effect is partially driven by the systematic sorting of students to teachers and vice versa. Further supporting this point, we include randomization block fixed effects, elaborated in the following; these differences are even more pronounced, with the point estimate on proportion male students switching direction (Table 8).
Differences in Observation Ratings Based on Classroom Characteristics Using Randomization Block Fixed Effects (RBFE)

Note. Standard errors in parentheses. All models include grade, subject, and year indicators. Classroom characteristics variables are in proportions. SPED = students receiving special education services; ELL = students receiving English language learning services; FRPL = students eligible for the free or reduced-price lunch program; Other students of color = students labeled Race Other by the Measures of Effective Teaching (MET) Project. We understand that a limitation of combining racial/ethnic groups is that this masks their unique experiences and the relationship on teachers’ observation ratings. VAM = classroom-level value-added measures.
p < .10. **p < .05. ***p < .01.
Table 8 includes randomization block fixed effects, which accounts for the systematic sorting of teachers both within and between schools. Adding these fixed effects should produce more credibly causal estimates, though doing so also substantially increases the standard errors, doubling their size in many cases. Thus, in reviewing these estimates, we focus primarily on the magnitude and direction of point estimates and whether they are consistent with Table 7 results rather than significance levels. The magnitudes and directions of point estimates on proportion of Black and Hispanic students and student prior performance are consistent. However, the point estimates on proportion male students switch direction and are much smaller in magnitude, suggesting that the results for this classroom characteristic are more mixed. Finally, the point estimates on the proportion of students receiving free/reduced-price lunch switch direction (become negative) and are much larger in magnitude, and the point estimates on the proportion of SPED and Asian students also increase in magnitude.
Given that within- and between-school sorting is unlikely to explain these relationships between classroom composition and observation ratings observed in the randomized subgroups, we offer two additional explanations: (a) Teachers’ instructional quality may differ based on classroom composition, or (b) raters are evaluating teachers more harshly or favorably based on the observable characteristics of students. We attempted to disentangle these explanations by adjusting in Column 2 of Table 7 for classroom-specific VAM scores. 13 These are measures of classroom-specific instructional quality measured concurrently with the observation ratings. If teachers are truly performing better or worse because of the kinds of students they teach, then estimates on student characteristics should decrease after including measures for differences in instructional quality. However, estimates on classroom characteristics remained mostly similar, suggesting the relationships between observation ratings and classroom composition are likely not explained by differences in instructional performance. In fact, the estimate on the proportion of Black and Hispanic students actually increases substantially in magnitude. In other words, after adjusting for differences in classroom-specific instructional performance, having more Black and Hispanic students in the classroom is even more predictive of receiving lower ratings.
Since we find that associations between observation ratings and classroom characteristics are unlikely to be explained by differences in instructional quality, another explanation is that raters tend to evaluate more harshly when they observe teachers teaching classrooms with more Black, Hispanic, male, and low-performing students. Finding point estimates on student race, among the most observationally salient of classroom characteristics, to increase in magnitude after controlling for instructional quality (classroom VAM) seems consistent with this claim.
To investigate this claim further, we conducted a series of sensitivity analyses aimed at examining rater bias more explicitly. For each of the focal classroom characteristics we found to predict observation ratings (student race, gender, income status, and prior performance), we conducted a three-stage model progression (for details, see end of “Analysis” section in “Methods”). The basic progression is as follows: In Stage 1, we use OLS regression to estimate observation ratings as a function of teacher characteristics and classroom characteristics other than the focal classroom characteristic (e.g., proportion of Hispanic students); in Stage 2, we estimate the residual from Stage 1 as a function of the previously removed focal classroom characteristic and rater main effects; in Stage 3, we include interactions between rater and the target classroom characteristic.
Table 9 summarizes results. In the first column, we summarize likelihood ratio tests comparing models from Stages 2 and 3—without and with interactions between raters and the focal classroom characteristic. Results suggest that in all cases but one (proportion of male students), LR tests were significant. Finding LR tests to be significant suggests that interaction terms are contributing significantly to the models and thus that rater bias is likely to be contributing to observation ratings in significant ways.
Rater Bias Sensitivity Checks

Note. The second column summarizes likelihood ratio tests comparing models with and without interactions between raters and the focal classroom characteristic. The last three columns summarize the number of raters whose slopes are significantly different from the mean. Columns 3 and 4 are the number of raters significantly positive or negative, respectively. Column 5 presents the number of raters that did not differ significantly from the mean. FRPL = students eligible for the free or reduced-price lunch program.
p < .01.
As previously mentioned, the interaction terms in our Stage 3 models represent rater-specific slopes for the relationship between observation ratings and the target classroom characteristic. To examine rater bias, we also examined the number of interactions that differed significantly from the mean of raters to check whether this number was greater than what would be expected due to chance. Table 9 (right side) summarizes the number of raters whose slopes were significantly greater and less than the mean as well as the number that did not differ significantly. Across classroom characteristics, we found that between 10% and 13% of raters were significantly distinguishable from the average, which is greater than what we would expect due to chance. 14 Though most raters with significant interaction terms differed from the mean in the direction (positive or negative) that we would expect based on prior results, it is important to note that across classroom characteristics, some differed in the opposite direction as well. This is notable because if these interaction terms are indeed reflecting rater responses to classroom composition, then we would not expect these responses to be homogeneous. For instance, though most raters might be more stringent in their ratings of classrooms with more male students, others might likely be more lenient.
Discussion and Conclusions
In this study, we extend the extant literature on teacher evaluation systems by examining whether ratings from observation instruments are equitable and fair tools for evaluating teacher quality. Our findings contribute to growing evidence that these ratings seem to measure factors outside of a teacher’s performance or his or her control, including the gender of the teacher and the type of students assigned to him or her. Specifically, the results show that men receive lower ratings, on average, than women. Consistent with prior research, we also find that Black teachers are rated lower than White teachers. We extend prior work, though, by demonstrating that differences in observation ratings between Black and White teachers appear to be driven by differences in classroom composition; after adjusting for the characteristics of the students they teach, Black and White teachers receive statistically similar observation ratings. Also consistent with prior literature, we find that teachers who teach higher proportions of students who are Black, Hispanic, male, low performing, and in some models low income also receive lower ratings. We have made progress beyond prior research, though, in interrogating the mechanisms behind these observed relationships between classroom composition and observation ratings. In particular, we demonstrate that these relationships are likely not explained by less effective teachers sorting to classrooms with more Black, Hispanic, male, low-performing, and low-income students. Our sensitivity analyses offered some initial, although not conclusive, evidence that raters may evaluate teachers based on student classroom characteristics.
By using various fixed effects approaches and leveraging MET’s random assignment design, we provide the strongest evidence to date that teachers’ ratings are significantly related to the sociodemographic characteristics of the students they teach apart from differences in teacher quality. In particular, we are the first study, to our knowledge, to use a teacher-by-year fixed effects approach to leverage within-teacher-and-year across-classroom differences in observation ratings. This approach makes progress in ruling out explanations due to the systematic sorting of more effective teachers into certain kinds of classrooms. Because we are comparing classrooms of the same teacher within the same year, time-invariant and context-invariant forms of teacher quality are effectively being held constant. To further rule out observed relationships being explained by the systematic sorting of teachers to classrooms and schools, we took advantage of the fact that a subset of teachers in the MET study were randomly assigned to classrooms. Even among these teachers, those that taught more Black, Hispanic, and low-performing students received lower observation ratings; this was also true for teachers of more low-income and male students in some model specifications, but results were mixed.
If the systematic sorting of more effective teachers to certain kinds of classrooms is not explaining these results, then what is? We hypothesized two additional explanations: (a) Teachers teach better (or worse) depending on the kinds of students in their classrooms, or (b) teachers are not actually teaching better (or worse), but raters are evaluating them more (or less) favorably based on the kinds of students in their classrooms. If the former is true, then observation ratings are, in some sense, working—they are measuring differences in instructional quality. If the latter is true, however, this would suggest that observation ratings may not be equitable or fair in that teachers of students of color, low-performing students, and male students may receive lower ratings not because of their instructional quality but, instead, who they teach.
Regarding the first explanation, our teacher-year fixed effects may not go far enough in that it is certainly possible that the same teacher, even in the same year, is less effective in different classroom contexts. Here too, though, our study has made progress in ruling out this explanation. Specifically, we also control for classroom-specific teacher effectiveness (as measured by classroom-level VAMs) to disentangle within-teacher, across-classroom differences in instructional quality from other explanations. Even with these adjustments, we find that students’ sociodemographic characteristics and prior performance still predict observation ratings. In fact, among the subsample of teachers that were successfully randomized, adding classroom VAMs actually increased point estimates on the proportion of Black and Hispanic students. The increase in effects after adjusting for classroom-specific instructional quality is consistent instead with the explanation that correlations with classroom sociodemographics likely reflect rater biases, especially since we would expect such biases to be particularly responsive to student race given its observable salience relative to other classroom characteristics. Consistent also with this rater bias explanation, our sensitivity analyses revealed that rater-by-classroom characteristic interactions explain more of the variation in classroom observation ratings than rater main effects, suggesting that rater bias likely contributes to differences in observation ratings. We also find that across classroom characteristics, a large percentage of raters were significantly distinguishable from the average than would be expected by chance.
Other studies that have previously suggested the existence of rater biases like these have recommended additional rater training and the use of multiple raters, including external raters (Campbell, 2014; Whitehurst et al., 2014), which is also consistent with the recommendations provided by MET researchers (Ho & Kane, 2013). In accordance with these recommendations, all raters in our sample were external to the school, underwent extensive training, and were certified prior to evaluating teachers; additionally, each classroom and teacher was rated by multiple raters. Even so, we still found the sociodemographic characteristics of both the teacher and his or her students to significantly predict observation ratings. These results were robust to specifications conditional on actual performance as well as the random assignment of teachers to classrooms. These findings do not, though, mean that multiple raters or rater training are unnecessary. Rather, our results seem to imply that if inequities are deeply rooted in our evaluation systems, we may need to consider alternative ways to correct for these inequities.
Though our results suggest that rater biases, more than classroom-specific differences in instructional quality, could explain relationships between observation ratings and classroom characteristics, our data and methods do not allow us to fully disentangle these explanations. In particular, classroom-level VAM measures may not fully capture between-classroom, within-teacher differences in instructional quality. In other words, observation ratings may pick up on real differences in instructional quality that VAMs are failing to detect. Our sensitivity analyses are consistent with a rater bias explanation and indicate that rater bias cannot be ruled out as an explanation, though these analyses do not directly test whether rater bias is causing the observed relationships. While we have made progress, more research is needed to disentangle whether the relationships we observe are due to rater bias or actual differences in instructional quality. If teachers are truly performing worse in classrooms with marginalized students, then we need a better understanding of why and potentially how to boost instructional quality in these settings. In particular, policymakers might consider ways to provide additional supports to ensure teachers are equipped to teach diverse groups of learners.
If teachers receive lower ratings in classrooms with more marginalized student groups due to factors outside of teachers’ control, such as rater biases, then evaluation systems should not penalize teachers for working in these classrooms. Thus, it would be critical to find ways to better account or adjust for classroom characteristics in how we evaluate teacher and teaching quality. Consistent with Whitehurst et al. (2014), we encourage educational leaders, policymakers, and researchers to explore the possibility of adjusting observation ratings for student characteristics. Such an approach would be similar to covariate adjustments already being used in the construction of most VAM specifications. One possibility would be to report observation ratings based on both covariate adjustments and mean unadjusted ratings. This would allow teachers, evaluators, and policymakers to determine whether ratings are consistent or discrepant across specifications. For instance, if a teacher receives low ratings using simple mean ratings but does very well after adjusting for student composition, then this might raise concerns that the unadjusted mean scores may be reflecting factors beyond instructional quality. On the other hand, if a teacher does well across both specifications, then this would increase confidence in the ratings.
Assuming that rater bias is the cause of the trends we observe, then each rater likely has a unique set of biases. Thus, a limitation of adjusting observation ratings for student characteristics is that ratings for some teachers may be overadjusted, while others may be underadjusted. For example, where raters respond more harshly to classrooms with marginalized students, then adjusted teacher ratings may end up being underadjusted. While we imagine that, on average, the correction will be preferable, we acknowledge that corrections for each case will be imperfect. Another option to consider, albeit a costly one, would be designing observations so that all evaluators are required to co-observe a set of lessons (perhaps even with a master rater) as a way to measure rater-specific biases; teacher evaluations then could adjust for these measured, rater-specific biases.
Steinberg and Garrett (2016) point out, though, that “unmeasured differences in ratings due to the systematic assignment of teachers to classes based on fixed, unobserved teacher characteristics will continue to bias estimates of teacher performance based on observational scores” (p. 21). As suggested by these authors, we would recommend also using multiple years of teacher data to help correct measures for these additional forms of bias. Though these suggested reforms have potential to improve the fairness of validity of observation ratings, we agree with Steinberg and Garrett that some forms of bias would likely still exist, thus raising serious questions about their use for high-stakes personnel decisions.
Classroom observations are among the most common forms of teacher evaluation and are being used to make high-stakes decisions about dismissal, tenure, and compensation. Therefore, it is essential that these evaluation systems measure what they intend to measure. Otherwise, as Baker et al. (2010) argue, adopting an invalid teacher evaluation system and tying it to rewards and sanctions is likely to lead to inaccurate personnel decisions and to demoralize teachers, causing talented teachers to avoid high-needs students and schools, or to leave the profession entirely, and discouraging potentially effective teachers from entering it. (p. 4)
Our results raise questions about whether individuals are receiving differentially lower or higher ratings due to their characteristics and the characteristics of their students rather than their instructional effectiveness. However, the study has important limitations. First, our most substantive conclusions (i.e., teacher and randomized block fixed effects) are based on a small subsample of teachers in the MET sample. Even so, we find that (a) this subsample is fairly representative of the teachers in the full sample in terms of teacher and classroom characteristics (refer to Table 2) and (b) the effects we observe are robust across samples in our study. Second, though we do our best by including block and teacher fixed effects, the randomization strategy used by MET was within, not between, schools, so we are unable to fully guard against the possibility that between-school sorting may contribute to the effects we observe. Third, our analyses are based on a composite observation rating; therefore, we did not examine whether one of the two FFT dimensions of practice (i.e., Instruction and Classroom Environment) are individually more highly associated with classroom characteristics than the other. However, research using the FFT observation instrument supports the aggregation of domains given the factor structure and how the ratings are used by states and districts (Kane, McCaffrey, Miller, & Staiger, 2013; Kane, Taylor, Tyler, & Wooten, 2011; Mihaly, McCaffrey, Staiger, & Lockwood, 2013). Finally, the classroom observation data from this study are based on an unusual structure of teacher evaluations whereby a teacher is evaluated by multiple trained raters who by nature of the MET design have no relationship to the teachers, students, or schools they evaluated via potentially decontextualized videos of teachers and students. However, we know that most evaluations of teachers are conducted by a school administrator, primarily the principal, who has a relationship with the teacher and students. Therefore, how potential rater biases manifest and influence ratings in this study’s sample may not generalize to more typical contexts, where raters know the teachers and work in the same schools.
The implication is not to do away with observation ratings. To the contrary, observation ratings can provide teachers with formative feedback that has been shown to improve instructional quality (Allen, Pianta, Gregory, Mikami, & Lun, 2011; Dee & Wyckoff, 2015; Papay, Taylor, Tyler, & Laski, 2015). Rather, these results suggest that educational leaders, policymakers, and scholars pay careful attention to possible unintended consequences of these evaluation systems and then make necessary adjustments to ensure they are fair and equitable.
Footnotes
Appendix
Classroom Composition Difference Between Black and White Teachers
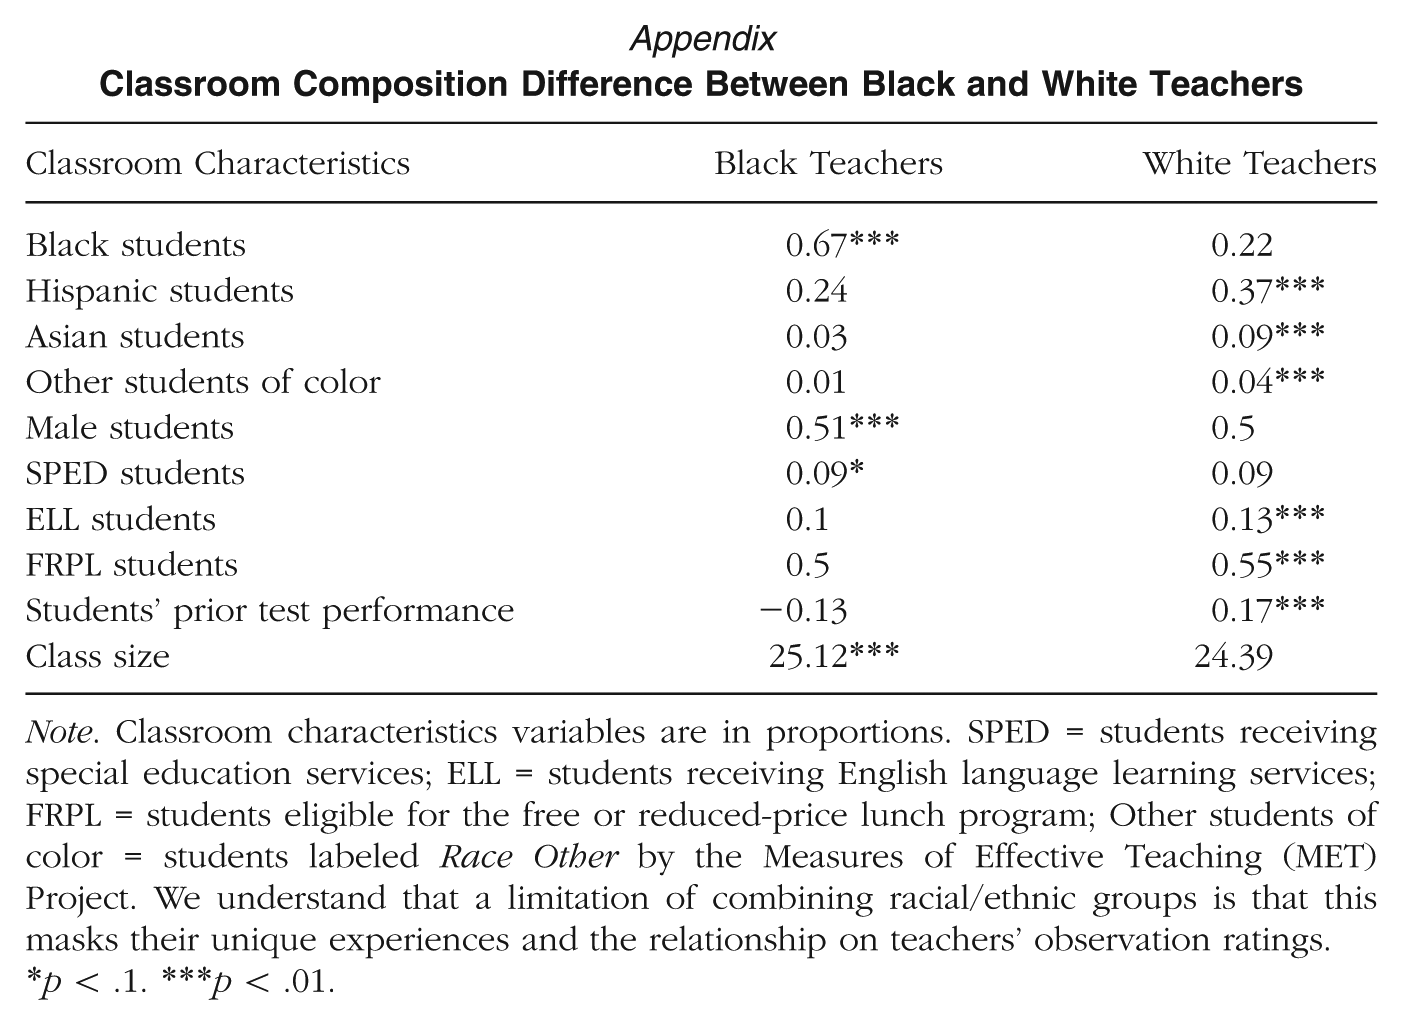
| Classroom Characteristics | Black Teachers | White Teachers |
|---|---|---|
| Black students | 0.67*** | 0.22 |
| Hispanic students | 0.24 | 0.37*** |
| Asian students | 0.03 | 0.09*** |
| Other students of color | 0.01 | 0.04*** |
| Male students | 0.51*** | 0.5 |
| SPED students | 0.09* | 0.09 |
| ELL students | 0.1 | 0.13*** |
| FRPL students | 0.5 | 0.55*** |
| Students’ prior test performance | −0.13 | 0.17*** |
| Class size | 25.12*** | 24.39 |
Note. Classroom characteristics variables are in proportions. SPED = students receiving special education services; ELL = students receiving English language learning services; FRPL = students eligible for the free or reduced-price lunch program; Other students of color = students labeled Race Other by the Measures of Effective Teaching (MET) Project. We understand that a limitation of combining racial/ethnic groups is that this masks their unique experiences and the relationship on teachers’ observation ratings.
p < .1. ***p < .01.
Notes
S
M