
Abstract
This article reports the results of a randomized control trial of a semester-long intervention designed to promote ninth-grade science students’ use of text-based investigation to create explanatory models of biological phenomena. The main research question was whether the student participants in the intervention outperformed the students in the control classes, as assessed by several measures of comprehension and application of information to modeling biological phenomena not covered in the instruction. A second research question examined the impact on the instructional practices of the teachers who implemented the intervention. Multilevel modeling of outcome measures, controlling for preexisting differences at individual and school levels, indicated significant effects on the intervention students and teachers relative to the controls. Implications for classroom instruction and teacher professional development are discussed.
Keywords
National and international trends indicate that current reading comprehension instruction is not preparing citizens for full participation in 21st-century societies (National Assessment of Educational Progress, 2009a, 2009b; Organization of Economic & Cultural Development, 2013). The accessibility of unprecedented amounts of information, much of it unfiltered and often contradictory, means that readers need to analyze, synthesize, and evaluate information within and across sources (e.g., print-based texts, audio and video, images). The need is particularly acute for science because of public participation in decision making about quality-of-life issues (e.g., global climate change, genetically modified foods). Yet the evidence suggests that the public is ill equipped to deal with the science underlying such issues (National Center for Educational Statistics, 2012).
The Common Core State Standards (CCSS; Council of Chief State School Officers, 2010) and the Next Generation Science Standards (NGSS; National Research Council, 2012; NGSS Lead States, 2013) speak to these needs. For the diverse students in our nation’s middle and high schools, many of whom are profoundly ill prepared for the CCSS and NGSS, educators must simultaneously support literacy and science learning (e.g., Schwarz, Passmore, & Reiser, 2017). A critical challenge for adolescents is that they are expected to build knowledge in multiple content areas. Presented with discipline-specific texts, they are expected to perform tasks that require specialized ways of reading, thinking, and conveying information (Bazerman, 1985; Bromme & Goldman, 2014; Lee & Spratley, 2010; Moje, 2015; Shanahan & Shanahan, 2008). Yet the disciplinary literacies—the oral and written communication practices of disciplines (Moje, 2008)—are rarely the focus of instruction, either in content areas or in reading or English language arts. The NGSS address science practices, foregrounding necessary literacies, most explicitly in Practice 8, “Organizing, selecting, and communicating information” (NGSS Lead States, 2013).
Motivated in part by the gaps between the literacies citizens need in the 21st century and those they have upon high school graduation, various countries have undertaken different initiatives to redress the gap. One such effort undertaken in the U.S., Project READI, is the context for this study.
Overview of Project READI
Project READI was a multi-institution collaboration of researchers, professional development designers and facilitators, and practitioners. Funded from 2010 to 2016 under the “Reading for Understanding” initiative of the U.S. federal government, the Project READI team engaged in researching and developing interventions to enhance adolescents’ reading for understanding in three areas—literature/literary reading, history, and science. The team defined reading for understanding as engaging adolescents in the practice of evidence-based argumentation (EBA) from multiple sources of information in developmentally appropriate forms of authentic disciplinary practices. In EBA, claims are asserted and supported by evidence that has principled connections to the claim, but the nature of claims, evidence, and principles differs across disciplines (Goldman, Britt, Brown et al., 2016; Herrenkohl & Cornelius, 2013; Langer, 2011; Lee & Sprately, 2010). In Project READI, “multiple sources of information” referred to the multitude of media, and representational modes and genres/forms accessible in the 21st century, including online and off-line sources, spoken and written, verbal and visual (graphs, diagrams, schematics, video), static and dynamic (Kress & Van Leeuwen, 2001; New London Group, 1996; Unsworth, 2002). Competent reading comprehension and learning in the 21st century involve fluency across these forms.
Project READI involved four strands of work. Two strands pursued overarching questions about the forms and types of tasks, information sources, instructional strategies, and tools that would enable students to engage in EBA from multiple sources. Strand 1 employed quasi-experimental studies. Strand 2 engaged in iterative design-based research (DBR). The DBR was conducted through design teams for each disciplinary area. Each team included researchers, teacher educators, classroom teachers, and professional development and subject matter specialists, who collaboratively developed, implemented, and revised instructional designs for EBA instructional modules. Strand 3 focused on developing assessments of EBA that would support claims about relevant student learning.
Strand 4 focused on teachers’ opportunities to learn and followed directly from the Project READI theory of action. Simply put, teachers mediate students’ opportunities to learn. However, many teachers have had little opportunity to engage in inquiry-based approaches to literary reading, history, or science. Throughout the project, the team convened teachers, who worked in disciplinary groups to explore a variety of constructs and rethink their practices. The constructs explored included argumentation, close reading, and disciplinary reasoning. Instructional practices included the tasks they assigned, information sources they used, and opportunities they provided for students to engage in individual and collaborative sense making, and how they orchestrated small-group but especially whole-class discussions. Explorations within disciplines were shared across disciplines and provided opportunities for teachers to learn how colleagues outside their own discipline thought about the same set of constructs, challenges, and practices. Overall, there was a strong emphasis on teachers learning how to move the intellectual work, including reading from various information sources, from themselves to students.
A major culminating activity of Project READI, and a requirement of the funding agreement, was a randomized control trial (RCT) efficacy study of the instructional approach that emerged from the design and research activities. During the academic year 2014–2015, we conducted the efficacy study in ninth-grade biological sciences classes. 1 This article examines the impact of the Project READI instructional intervention. The main research question for this study was whether student participants in classes implementing the Project READI intervention outperformed students in control classes. Performance was compared on multiple measures of comprehension and application of information for purposes of explaining models of biological phenomena. A second research question relates to potential impacts on the attitudes, beliefs, and practices of those biology teachers who participated in the efficacy study as intervention teachers.
The remainder of this introduction provides the theoretical and empirical rationales for the overall Project READI approach to reading for understanding, its instantiation in science as text-based explanatory modeling, and the professional development model. We emphasize that text-based investigations should be understood in contrast to hands-on investigations, where students collect data and work from these data to construct explanations or test hypotheses. In Project READI, “text” is used broadly to refer to the multiple forms in which science information may be represented, including verbal text, static and dynamic visual displays (e.g., tables, graphs), diagrams, and schematics. The specifics of the student intervention and the professional development model in the efficacy study reported herein are provided in the Methods section.
Theoretical Framework
Project READI Approach to Reading for Understanding
The Project READI team developed a conceptualization of reading to understand that built on conceptions of reading comprehension as involving the construction of mental representations of text in a sociocultural context (e.g., RAND Reading Study Group, 2002). These mental representations capture surface input, information presented, and inferences that integrate the information within and across texts and with prior knowledge (e.g., Goldman, 2004; Graesser & McNamara, 2011; Kintsch, 1994; Rouet & Britt, 2011; van den Broek, Young, Tzeng, & Linderholm, 1999). Processes involved in generating these representations are close, careful reading of what the text says, along with analytic and synthetic reasoning within and across texts to determine meaning (Goldman, 2018). We joined this perspective on comprehension with a disciplinary literacies perspective on argumentation from multiple sources, thus integrating disciplinary reasoning practices with the literacy practices that support them.
As a general construct, argumentation refers to the assertion of claims that are supported by evidence that has principled connections to the claim (Toulmin, 1958). Generally speaking, close reading, analysis, and synthesis enable learners to identify elements and construct arguments from text(s). These arguments are subject to justification, evaluation, and critique.
However, these reading, reasoning, and argumentation processes operate differently in different content areas. This is so because what claims are about, the criteria that define what counts as evidence relative to some claim, and the principles that warrant or legitimize why particular evidence supports a particular claim differs across disciplines. In traditional academic disciplines, what constitutes valid argument depends on the discipline’s epistemology (Goldman, Britt, Brown, et al., 2016) in conjunction with the discourse norms that the members of the disciplinary community have negotiated and agreed upon (Gee, 1992; Lave & Wenger, 1991). That is, the members constitute a discourse community and share a set of conventions and norms regarding valid forms of argument and communication. These norms reflect the field’s epistemology—the nature of the disciplinary knowledge and how new knowledge claims in that discipline are legitimized and established (Bricker & Bell, 2008; Goldman & Bisanz, 2002; Moje, 2015; Norris & Phillips, 2003; Osborne, 2002; Sandoval & Millwood, 2008; Wineburg, 2001). Thus, in addition to knowing the concepts and principles of their discipline, community members have knowledge about their discipline that supports engaging in the reading, reasoning, and argumentation practices.
To capture what students needed to know about a discipline to support comprehension and production of argumentation, each of three Project READI disciplinary teams (literary reading, history, and science) undertook an extensive examination of the theoretical and empirical literature on the reading and argumentation practices of disciplinary experts, empirical reports of adolescents’ disciplinary reasoning, and the types of representations and discourse used by members of the disciplinary community. Cross-talk among the disciplinary teams produced agreement on five categories of knowledge about a discipline, which we labeled core constructs: epistemology; inquiry practices and reasoning strategies; overarching concepts, themes, principles, and frameworks; forms of information representation/types of texts; and discourse and language structures (Goldman, Britt, Brown, et al., 2016). The general definitions of these five categories are provided in the first column of Table 1 and the specification in science in Column 2. (For specification in literature and history, see Goldman, 2018; Goldman, Britt, Brown, et al., 2016.)
Core Constructs Instantiated for Text-Based Investigation in Science

By combining the core construct specification in each discipline with the general processes of reading and reasoning to argue, the Project READI team formulated learning goals for each disciplinary content area. The learning goals for science are
Close reading. Engage in close reading of science information to construct domain knowledge, including multiple representations characteristic of the discipline and language learning strategies. Close reading encompasses metacomprehension and self-regulation of the process.
Synthesize within and across multiple text sources.
Construct explanations of science phenomena (explanatory models) using science principles, frameworks, enduring understandings, cross-cutting concepts, and scientific evidence.
Justify explanations using science principles, frameworks and enduring understandings, cross-cutting concepts, and scientific evidence. (Includes evaluating the quality of the evidence.)
Critique explanations using science principles, frameworks and enduring understandings, cross-cutting concepts, and scientific evidence.
Science Epistemology and Inquiry. Demonstrate understanding of epistemology of science through inquiry dispositions and conceptual change awareness/orientation (intentionally building and refining key concepts through multiple encounters with text); seeing science as a means to solve problems and address authentic questions about scientific problems.
In contrast to the science learning goals, which capture what it means to engage these processes in science, the learning goals specified for literature or history reflect the epistemic orientation of each discipline; the claims, evidence, and reasoning principles appropriate to each; and the kinds of information representations that are read and produced by community members. Thus, what students are closely reading, what they are trying to bring together—the patterns they attempt to discern, the explanations they seek to construct, justify, and critique—are specific to each discipline and embody its epistemic orientation (Goldman, Ko, Greenleaf, & Brown, 2018). Supporting the central role of epistemic orientation are data that indicate that participants’ thinking about the epistemology of the topic they are reading is a significant predictor of comprehension (e.g., Strømsø, Bråten, & Samuelstuen, 2008).
Engaging students in active inquiry and knowledge construction practices that are essential to EBA departs from traditional knowledge-imparting pedagogy (e.g., Goldman & Scardamalia, 2013). Project READI pedagogy included instructional routines and participation structures that were intended to provide social and affective support for persistence and resilience in the face of the challenges posed by EBA tasks. For example, instructional routines included teacher modeling to make visible disciplinary knowledge construction processes as well as metacognitive conversations to build awareness of how learning happens, and strategies and heuristics involved in sense making, including struggling. Participation structures involved a cycle of independent work followed by sharing in dyad or small-group work, culminating in whole-class discussion. This cycle enabled students to share their thinking and struggling with peers and then engage in further sense making, prior to sharing publicly with the whole group.
Project READI Approach to Science: Text-Based Investigations to Support Explanation of Phenomena
The reasoning practices of science foreground EBA around the development of models that explain phenomena of the natural world 2 (Cavagnetto, 2010; Osborne, 2010; Windschitl, Thompson, & Braaten, 2008). Prior work that has focused on supporting students in developing explanatory models has engaged students in hands-on investigations or provided them with data sets that serve as the basis of modeling, explanation, and argument construction (Berland & Reiser, 2009; Chin & Osborne, 2010; McNeill & Krajcik, 2011; Passmore & Svoboda, 2012). These efforts tend to downplay the literacy practices called upon in working with representations of science information (e.g., Linn & Eylon, 2011).
The focus of the Project READI science work on text-based investigations centrally involved the use of authentic science texts to construct knowledge, draw on information and evidence, and develop explanations and arguments that fit the data. As noted above, science information is presented in a wide range of representations, including verbal texts but also in static and dynamic visual displays. Data are tabulated, displayed, summarized, and reported in graphs, tables, and schematics, and there are conventional linguistic frames that constitute the rhetoric of argument in science (Lemke, 1998; Osborne, 2002; Park, Anderson, & Yoon, 2017; Pearson, Moje, & Greenleaf, 2010). Indeed, for some science subdisciplines, the data are extant longitudinal data sets, such as databases on global climate measurements collected over centuries and ice core sampling. To learn to practice science, students need to build the literacies required in such an enterprise, yet they are not typically instructed or engaged in activities that do so (Litman et al., 2017; Osborne, 2002; Vaughn et al., 2013; Yore, 2004; Yore, Bisanz, & Hand, 2003).
The absence of science text reading in classroom instruction is attributable in part to the kinds of texts typically found in those classrooms, namely textbooks that portray science as a set of known facts. This portrayal of science stands in stark contrast to the collaborative yet argumentative knowledge building processes that have been observed in scientists at work (e.g., Chiappetta & Fillman, 2007; Penney, Norris, Phillip, & Clark, 2003). Moreover, science information is necessarily communicated in complex sentences that contain technical terminology and mathematical expressions, as well as everyday vocabulary used in highly specific ways. Visual texts of varied kinds, including diagrams, graphs, data tables, and models, are used to communicate science information, but students are rarely taught how to comprehend these texts (Fang & Schleppegrell, 2010; Lee & Sprately, 2010). Faced with such seemingly intractable texts that portray science as a known body of facts, teachers transmit instruction orally and “PowerPoint” what they are responsible for teaching students (e.g., Litman et al., 2017; Vaughn et al., 2013). The result is that students neither have opportunities to engage in the reading practices of science nor do they use the information found in texts to construct, justify, or critique explanations and models of science phenomena.
Thus, the Project READI approach to science instruction encompassed pedagogies and curricular materials to support students engaging in investigations of phenomena using authentic texts. The approach was realized in instructional modules that reflected design principles related to (1) selecting and sequencing science texts that reflect a range of complexity (van den Broek, 2010); (2) instructional supports to foster reading for inquiry purposes (Moje & Speyer, 2014; Schoenbach, Greenleaf, & Murphy, 2012; Tabak, 2016) and to develop and evaluate causal explanations of phenomena (Chin & Osborne, 2010; Passmore & Svoboda, 2012); and (3) discourse-rich participation structures (e.g., individual reading, peer-to-peer text discussion, whole-class discussion) to support grappling with difficult texts and ideas, knowledge building, and EBA (Ford, 2012; Osborne, 2010; von Aufschnaiter, Erduran, Osborne, & Simon, 2008).
The Strand 2 iterative DBR informed successive refinement of the instructional supports, sequencing, framing of inquiry questions, and selection of texts to reflect the range and variety of representational forms that characterize science information presentation. Sequencing was particularly important. It was informed by observations and revisions to designs over the life of the Strand 2 work as well as research literature regarding development of the various kinds of knowledge and skills identified in the core constructs and areas of challenge for students (Garcia & Andersen, 2008; Greenleaf, Brown, Goldman, & Ko, 2014; Zohar, 2008). Refinements worked toward improving upon a progressive sequence of activities to build reading, reasoning, and modeling practices specified in the Project READI Science Learning Goals. For example, one consistent observation in the design work was that students needed to learn discourse norms and routines for text-based, metacognitive conversations that could support sense making, building knowledge of science, and building metaknowledge for science reading and modeling. Also, students needed to learn about the warrants for argument in science. The instructional progression built in these threads as aspects of science literacy practice that would build over time.
One outcome of the Strand 2 work was a four-phase learning progression that reflected the READI science design team’s collective understanding of productive staging of the introduction of specific learning goals and their progressive deepening over time and in relation to the other learning goals. (For details see Appendix A in the online version of the journal.) Further discussion of these four phases in the context of the specific progression for the efficacy study is provided in the Methods section.
In brief, the Project READI science progression is a framework for “on-boarding” novice science readers into science reading practices, culminating in the reading of multiple science texts for the purpose of generating explanatory models of science phenomena. The instructional progression reflects an iterative instructional cycle for practices of reading, reasoning, and argumentation during text-based investigations. Practices are introduced, often through modeling and explicit instruction, followed by student use of the modeled practices. Student use is scaffolded through various templates that provide language stems for reading, reasoning, and talking science and follow the participation structure cycle of individual (pair/small group) and whole-class discussion. Throughout, there are opportunities for feedback to support fluent grasping of the concepts and practices that reflect core disciplinary constructs. A long-term goal is that students come to view themselves as competent and confident science readers and learners who persist at tasks and with texts that challenge them, consistent with Bandura’s (1997) definition of self-efficacy.
Project READI Approach to Professional Development
The Project READI instructional approach asks teachers to make significant shifts in their current practices. Although some pedagogical shifts are amenable to highly structured, scripted materials and practices, the Project READI approach is not. When the goal is the type of deep instructional change called for by the approach, past research on professional learning indicates that teachers need several types of experiences and support, including inquiry into teaching and learning, learning in ways that model the targeted pedagogical approaches (Davis & Krajcik, 2005; Loucks-Horsley, Hewson, Love, & Stiles, 1998; Schoenbach, Greenleaf, & Murphy, 2016), ongoing reflection on their practice and their own learning (Moon, 2013), working with colleagues to translate ideas into their specific contexts, and ongoing support for their learning (Bill et al., 2017; Cognition and Technology Group at Vanderbilt, 1997; Greenleaf & Schoenbach, 2004; Kennedy, 2016; Kyza & Georgiou, 2014; Lieberman & Mace, 2010; Yoon et al., 2017; Zech, Gause-Vega, Bray, Secules, & Goldman, 2000).
Accordingly, Project READI’s Strand 4 work was devoted to developing, studying, and refining inquiry designs for engaging teachers as practitioners of EBA in their discipline. From the beginning of Project READI and up through Year 4, we convened ongoing meetings of teachers in “teacher inquiry networks.” Participants in these networks were not eligible to participate in the RCT efficacy study. Network participants engaged in three types of activities. The first group of activities was intended to surface teachers’ thinking and build their understanding of argumentation, including the nature of claims, evidence, and reasoning, in their discipline. The second group of activities provided opportunities for teachers to explore their disciplinary reading and reasoning processes, especially across different types of representations they might encounter across a range of information sources. In science this included different types of authentic forms of traditional texts, graphs, data tables, diagrams, and schematics. The teachers annotated these representations individually, then shared and reflected on them with colleagues within their discipline. These within-discipline discussions were shared across the three disciplinary teams, an activity that highlighted key similarities and differences across the disciplines. These opportunities for teacher learning built on the professional learning model previously developed by the authors (Greenleaf et al., 2011) but adapted to reflect READI’s focus on EBA from multiple information sources.
In their second year, the teacher inquiry networks turned to a third activity, namely the iterative design of instructional sequences, in collaboration with project science staff. Designs were developed, reflected on, revised, and implemented over Year 2 through Year 4. This process resulted in inquiry learning modules that extended over multiple weeks. By the third year of involvement, the inquiry network science teachers were active contributors to the Strand 2 science design team.
The work in the first 4 years of Project READI confirmed two important principles regarding professional learning. First, repositioning the teacher’s role is a gradual process. It took several iterations of implementation and reflection before the teachers’ adaptations reflected the deep structure of the approach. Typically, the first time the teachers tried many instructional processes, they were tentative and unsure of their success. Initial adaptations retained the form but not the substance of the principles. Debriefing with colleagues in the design team and teacher network meetings provided a crucial opportunity for feedback and reflection. These reflections led to revisions in designs and successive iterative cycles. With each cycle, the teachers and the rest of the design team members had new insights. By the third or fourth cycle, most teachers had become quite adept at analyzing candidate texts and tasks that would accomplish content goals and afford relevant students learning opportunities. Second, the teachers took up the approach in different ways, over different time frames, and to different degrees. However, we saw evidence of change toward the envisioned Project READI approach in approximately 90 of the almost 100 teachers with whom we worked over the project’s first 4 years.
These two lessons posed a dilemma for the design of the efficacy study reported here due to two constraints on the design of RCTs. First is the design requirement that participants have no prior history with the intervention prior to random assignment. This meant that participants in the efficacy study would be first-time implementers of the intervention, making an inquiry network approach to teacher professional development (PD) unfeasible for the efficacy study. A second design requirement of RCTs is clear definition of the “it” of the intervention. Yet the work with teachers in the inquiry network had indicated that even when teachers collaborated on a module’s design, enactments with their students varied depending on the class they were teaching. These variations reflected adaptive integration (Bryk, Gomez, Grunow, & LeMahieu, 2016), but they also reflected fidelity to Project READI’s underlying principles.
Given the need for an identifiable intervention and the reality that we would be testing its efficacy with teachers who were implementing it for the first time, we opted to provide the intervention teachers with instructional modules that had been developed in Strands 2 and 4 rather than have them create their own modules. This decision was intended to produce consistency across intervention teachers and their students in the materials (i.e., tasks, information resources, and tools) that constituted the content of the intervention. The professional development, described in detail in the Methods section, engaged teachers in the instructional routines and practices that constitute the Project READI approach to enacting curriculum materials. Thus, the PD design was intended to prepare teachers to understand the deep structure of the Project READI science approach sufficiently to achieve reasonable progress on the science learning goals, especially close reading, synthesis across multiple information sources, and construction of explanatory arguments.
The main research question for this efficacy study concerned the impact on students of participating in the intervention as compared with a control group of students who participated in typical ninth-grade biological sciences instruction. The second research question examined the impact of the professional learning experiences on teachers’ attitudes and practices by comparing the intervention with the control teachers.
Methods
This section begins with the overall research design and a description of participants. The next section details the design of the instructional intervention, followed by the design of the teacher PD. The instruments used for data collection are then described. The last two sections detail the data collection procedures and the data analysis approaches.
Research Design
The design was a stratified RCT with schools as the unit of assignment. To account for preexisting variations in demographics and achievement levels among the schools, these characteristics were used to sort schools into six strata; randomization of schools to treatment condition (intervention or control) was applied within each stratum. Definitions of the strata and the demographics for the schools, teachers, and students assigned to each condition are provided in the “Participants” section.
As depicted in Figure 1, the student intervention occurred over a 5- to 6-month period (20–22 weeks of instruction) beginning with the 2014 academic year. Professional development for teachers assigned to the intervention condition began 9 months prior to the start of the student intervention. PD for teachers assigned to the control group occurred after the conclusion of all data collection.
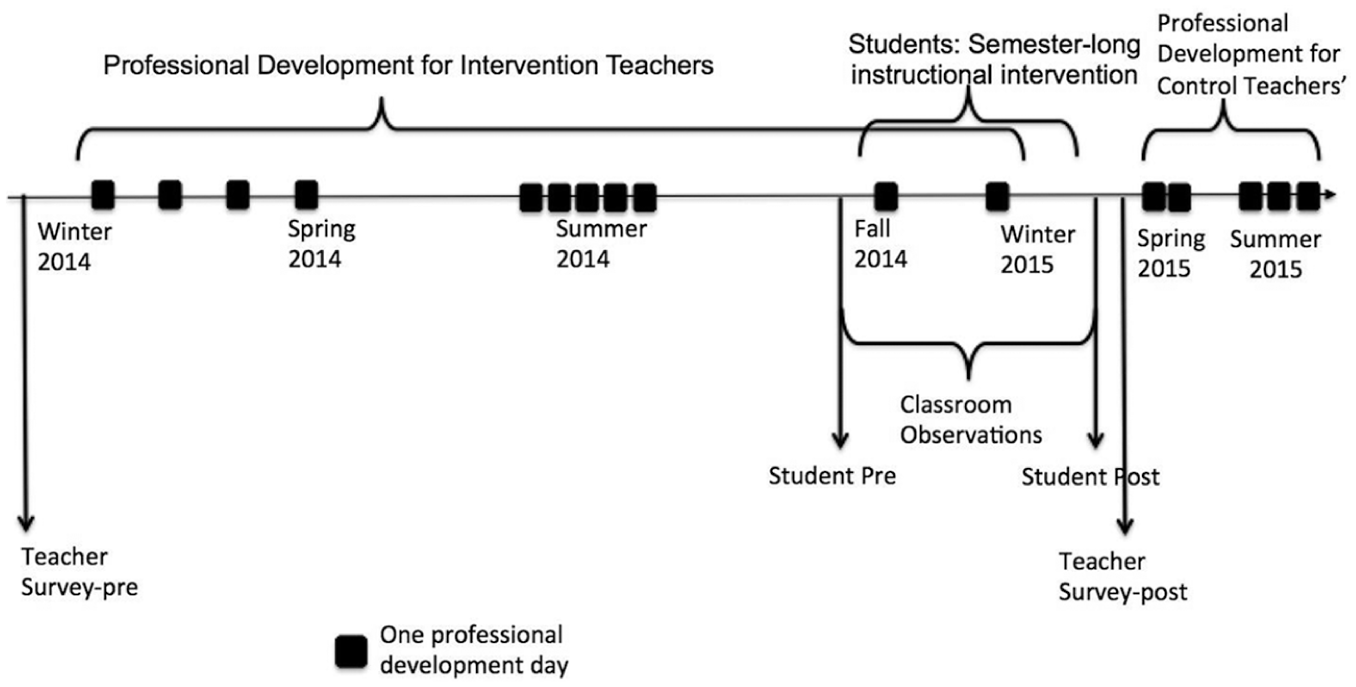
Research design timeline for efficacy study.
Dependent measures of student performance were derived from instruments that assessed EBA from multiple texts for biology phenomena not covered during instruction, basic reading comprehension skills, and complex comprehension from multiple texts and from self-report surveys of epistemology and self-efficacy. Dependent measures for teachers were derived from self-report surveys of attitudes and practices and from observations of classroom practices. The characteristics of the various instruments are provided in a later section. Figure 1 shows the timing of data collection from teachers and students relative to the onset of the PD for the teachers in the intervention condition, the implementation of the instructional intervention, and the PD for the control teachers.
In addition to basic descriptive analyses (e.g., means, standard deviations) and statistical tests of within- and between-group differences for the dependent measures, multilevel modeling was used to test for treatment effects at the student level, as is appropriate for the nesting present in the design (students within classrooms, classrooms within teachers, teachers within schools). The multilevel modeling took into account the variation in performance levels prior to the start of the intervention (pre). The same strategy of descriptive statistics and tests of group mean differences followed by multilevel modeling was employed to examine the differences between intervention and control teachers.
Participants
High schools were recruited from six districts in and around a large urban area. Working with district administrators, the schools were contacted, and faculty teaching ninth-grade biological sciences were recruited. During recruitment, teachers and principals were informed of the requirement of random assignment to conditions and that schools that agreed to participate had a 50:50 chance of being assigned to the intervention condition. However, we indicated that those assigned to the control condition would be provided with PD after the research study was concluded. This process yielded an initial pool of 35 schools that reflected a broad range of achievement and socioeconomic levels. There were three dominant demographic patterns among these school populations: largely (defined as greater than 80%) African American, with a mix of Latinx, White, Asian, or Multiracial; largely Latinx, with a mix of African American, White, Asian, or Multiracial; and Mixed, defined as no single group constituting more than 60% of the student body. In the time period between recruitment and random assignment of schools to conditions, 11 of the 35 schools indicated that they were no longer willing to participate. 3
To achieve the goal of equating the intervention and control condition samples with respect to achievement levels and demographic characteristics existing prior to the intervention, six stratified groups were created based on publicly available data on achievement, socioeconomic status, and populations served. Achievement level was indexed by the percentage of students meeting or exceeding expectations for the 11th grade based on the state’s learning standards. These percentages were those reported for the Spring 2013 administration of the Prairie State Achievement Exam (PSAE), the most recent administration at the time of recruitment and randomization. The PSAE was the only assessment common to all the high schools in the sample; there was no other assessment that all schools administered at a consistent grade level. The PSAE is a 2-day standardized test taken by all 11th graders in the state where the study was conducted. On Day 1, students take the ACT assessment of college and career readiness (https://www.act.org/). On Day 2, they take a WorkKeys job skills assessment of foundational skills for success in the workplace (https://www.act.org/) and a science exam designed by the state’s Board of Education. Students’ individual scores are benchmarked against the state’s 11th-grade learning standards; the percentage of students who meet or exceed expectations at the school level is publicly available for each school in the state.
Socioeconomic status was indexed by the percentage of students qualifying for free or reduced lunch. Populations served reflected the three types of schools. Half of the schools within each strata were randomly assigned to the intervention condition, and the other half constituted the control. The results of the stratification and randomization process are shown in Table 2 for the 24 participating schools.
Demographic Information for Schools Resulting From Stratified Random Assignment of Schools (N = 24) to Intervention or Control Group
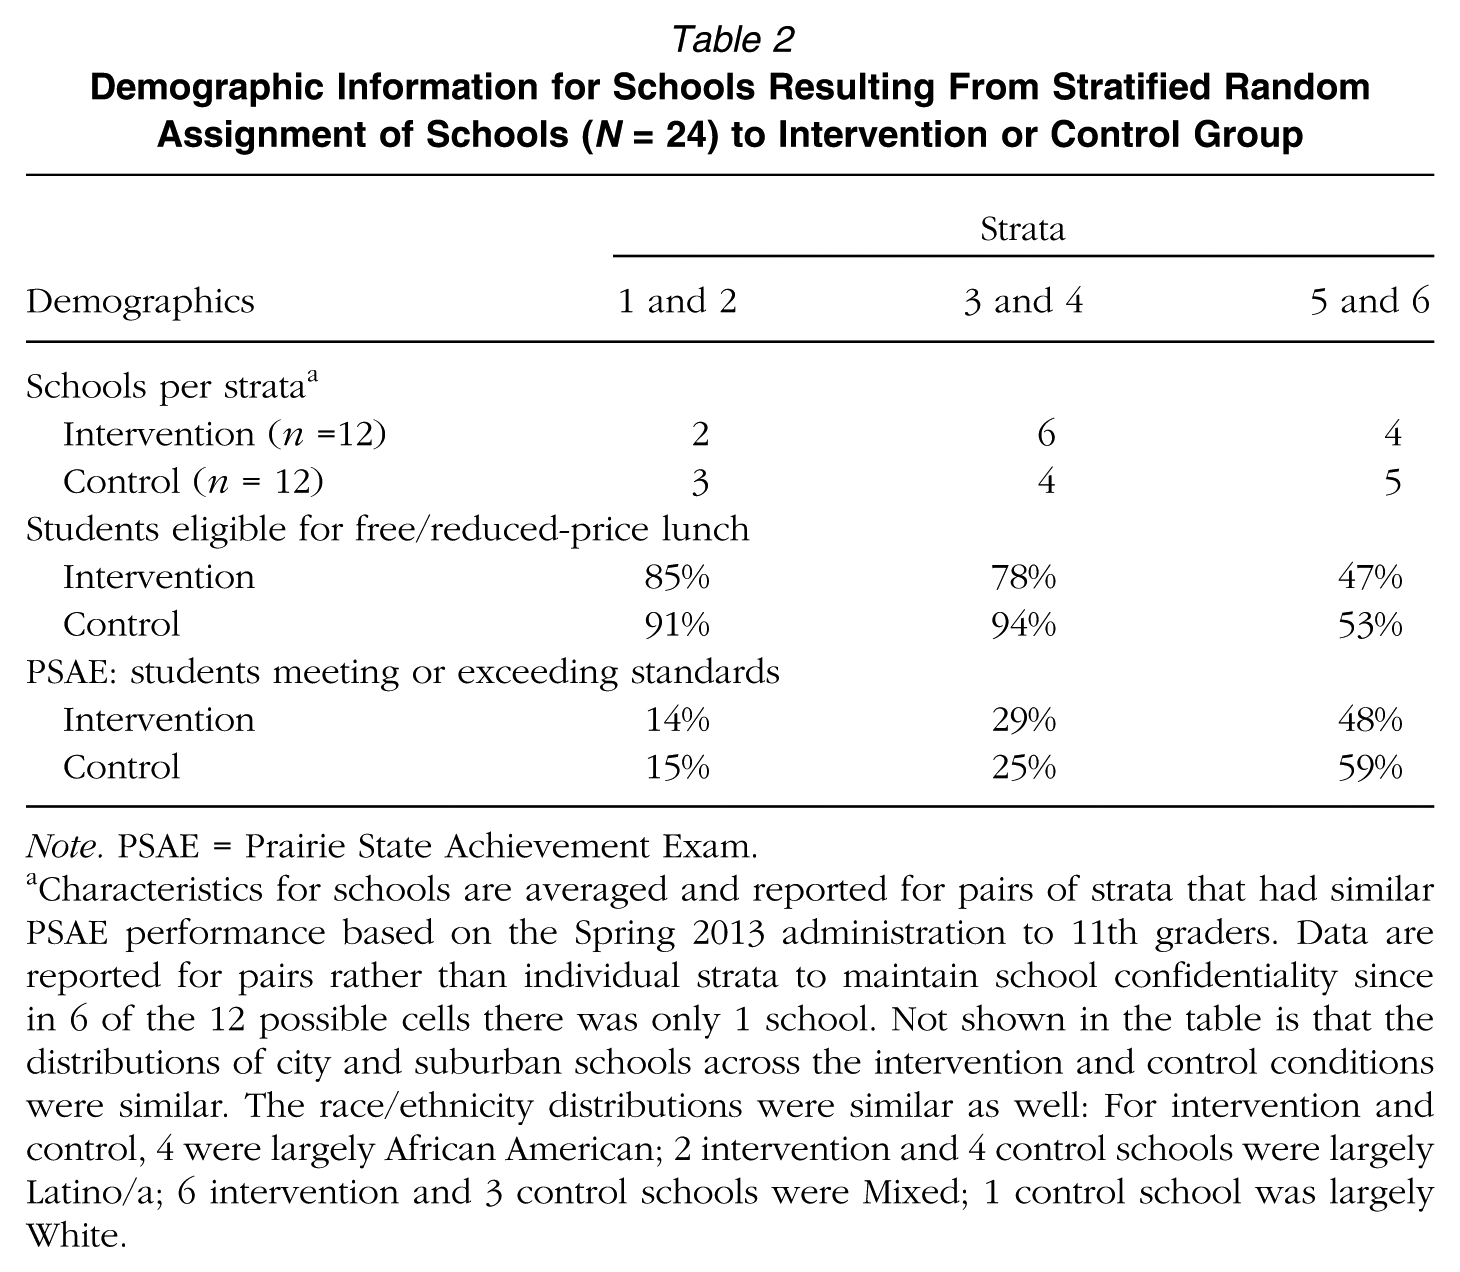
Note. PSAE = Prairie State Achievement Exam.
Characteristics for schools are averaged and reported for pairs of strata that had similar PSAE performance based on the Spring 2013 administration to 11th graders. Data are reported for pairs rather than individual strata to maintain school confidentiality since in 6 of the 12 possible cells there was only 1 school. Not shown in the table is that the distributions of city and suburban schools across the intervention and control conditions were similar. The race/ethnicity distributions were similar as well: For intervention and control, 4 were largely African American; 2 intervention and 4 control schools were largely Latino/a; 6 intervention and 3 control schools were Mixed; 1 control school was largely White.
Note that the difference between the strata that are grouped together was in demographic pattern rather than achievement or socioeconomic characteristics. For example, schools in Strata 3 were largely African American; schools in Strata 4 served largely Latinx populations. Of importance are the data indicating that the stratification followed by random assignment to treatment group resulted in highly similar characteristics within each pair of strata across intervention schools and control schools. The lowest strata (1 and 2) had the lowest percentage of students meeting or exceeding grade-level expectations. Note that the schools in the highest-achieving strata were below 60% in meeting or exceeding grade-level expectations.
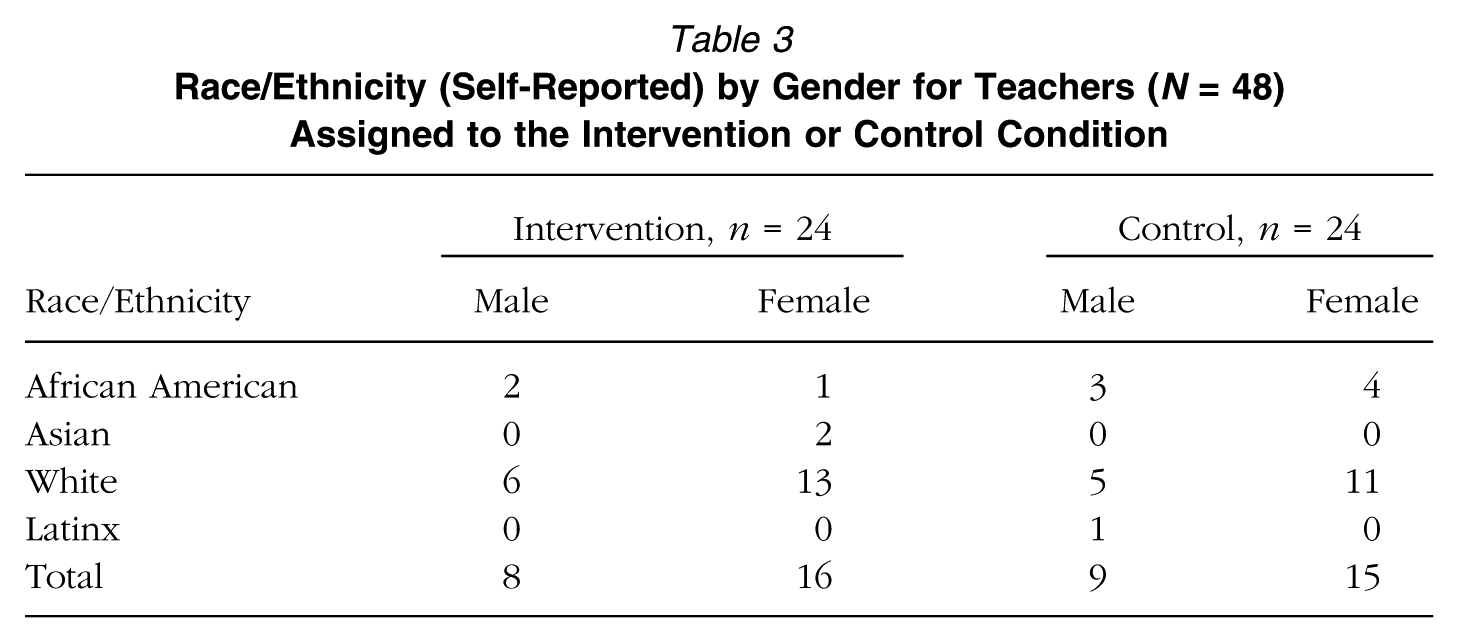
Table 3 provides information about the 24 teachers in the intervention group as compared with the 24 in the control group. Gender distribution was not related to condition, χ2(2, N = 48) = 0.09, p = .76. Race/ethnicity distributions were also similar across conditions, as was the range of teaching experience (2–15 years). Each of the 48 teachers taught multiple sections of the ninth-grade biological sciences course; each section defined a classroom.
Race/Ethnicity (Self-Reported) by Gender for Teachers (N = 48) Assigned to the Intervention or Control Condition
Students were recruited from 2 classrooms of each teacher, yielding 96 classrooms (48 intervention and 48 control). 4 Approximately 1,400 students returned their own and parental consent forms indicating willingness to participate. Of these, approximately 60% were from the students in the intervention classrooms, and the other 40% were from the students in the control classrooms. Preliminary analyses indicated that consent rates were consistent across strata and schools within districts. Thus, the consenting sample did not introduce selection bias related to strata.
A total of 981 students assented to contributing data to the analyses reported in this article, approximately 70% of those who had agreed to participate at the start of the school year. Attrition was due to a variety of issues, including missing data on one or more of the assessments. Of importance is that the intervention and control groups did not differ with respect to age (intervention: M (mean) = 14.22 years, SD (standard deviation) = 0.56, range = 13–18; control: M = 14.19, SD = 0.93, range = 13–18; t(933) = 0.60, p = .55). Nor were there differences related to the percentage of students reporting English as their first language (intervention: 77%; control: 75%; χ2(1, 941) = 0.71, p = .40). 5 Table 4 presents the gender and race/ethnicity distributions for the intervention and control groups. Neither the distribution of gender by condition, χ2(1, 979) = 0.53, p = .47, nor that of race/ethnicity by condition, χ2(5, 977) = 8.72, p = .12, was significant.
Race/Ethnicity (Self-Reported) by Gender for Students (N = 979) Assigned to the Intervention or Control Condition
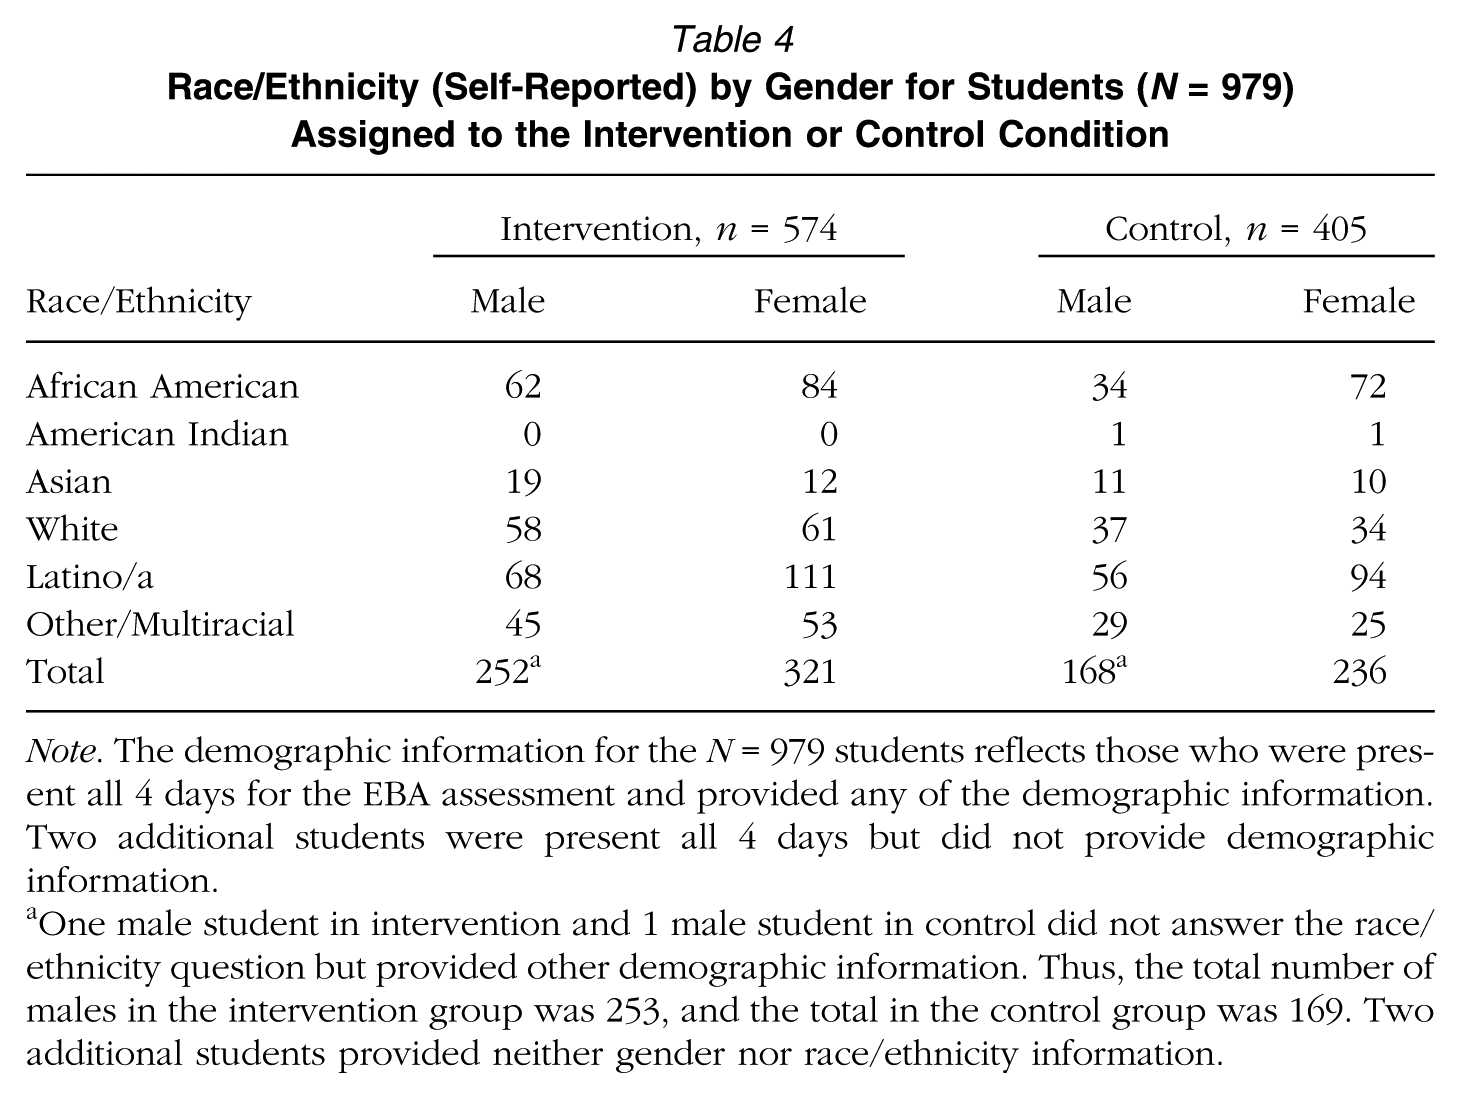
Note. The demographic information for the N = 979 students reflects those who were present all 4 days for the EBA assessment and provided any of the demographic information. Two additional students were present all 4 days but did not provide demographic information.
One male student in intervention and 1 male student in control did not answer the race/ethnicity question but provided other demographic information. Thus, the total number of males in the intervention group was 253, and the total in the control group was 169. Two additional students provided neither gender nor race/ethnicity information.
Design of the Student Intervention
The intervention began with the start of the Fall 2014 semester and extended into the first 2 months of the Spring 2015 semester. Topic selection and sequencing for the intervention condition were aligned with content coverage for the fall semester in the control condition and complied with any district mandates regarding coverage. To achieve alignment, the Project READI team consulted districts’ scope and sequence documents in conjunction with information provided by Intervention and Control teachers regarding what they planned to cover (including any district mandates) and in what order during the Fall 2014 semester. The alignment of content coverage (e.g., biological principles and concepts) across Intervention and Control conditions was intended to reduce the possibility that differences between groups postintervention could be attributed to the content they had had opportunities to learn.
Table 5 shows how the four-phase learning progression and Project READI learning goals were instantiated across weeks in the Fall 2014 semester. The rows in the table specify the focal learning goals, materials and tools, and the sequence of biology science topics and principles. Weeks per learning phases were approximations and were expected to vary across teachers and classrooms, an expectation conveyed to the Intervention teachers.
Design of the Semester-Long Instructional Intervention in Ninth-Grade Biological Sciences
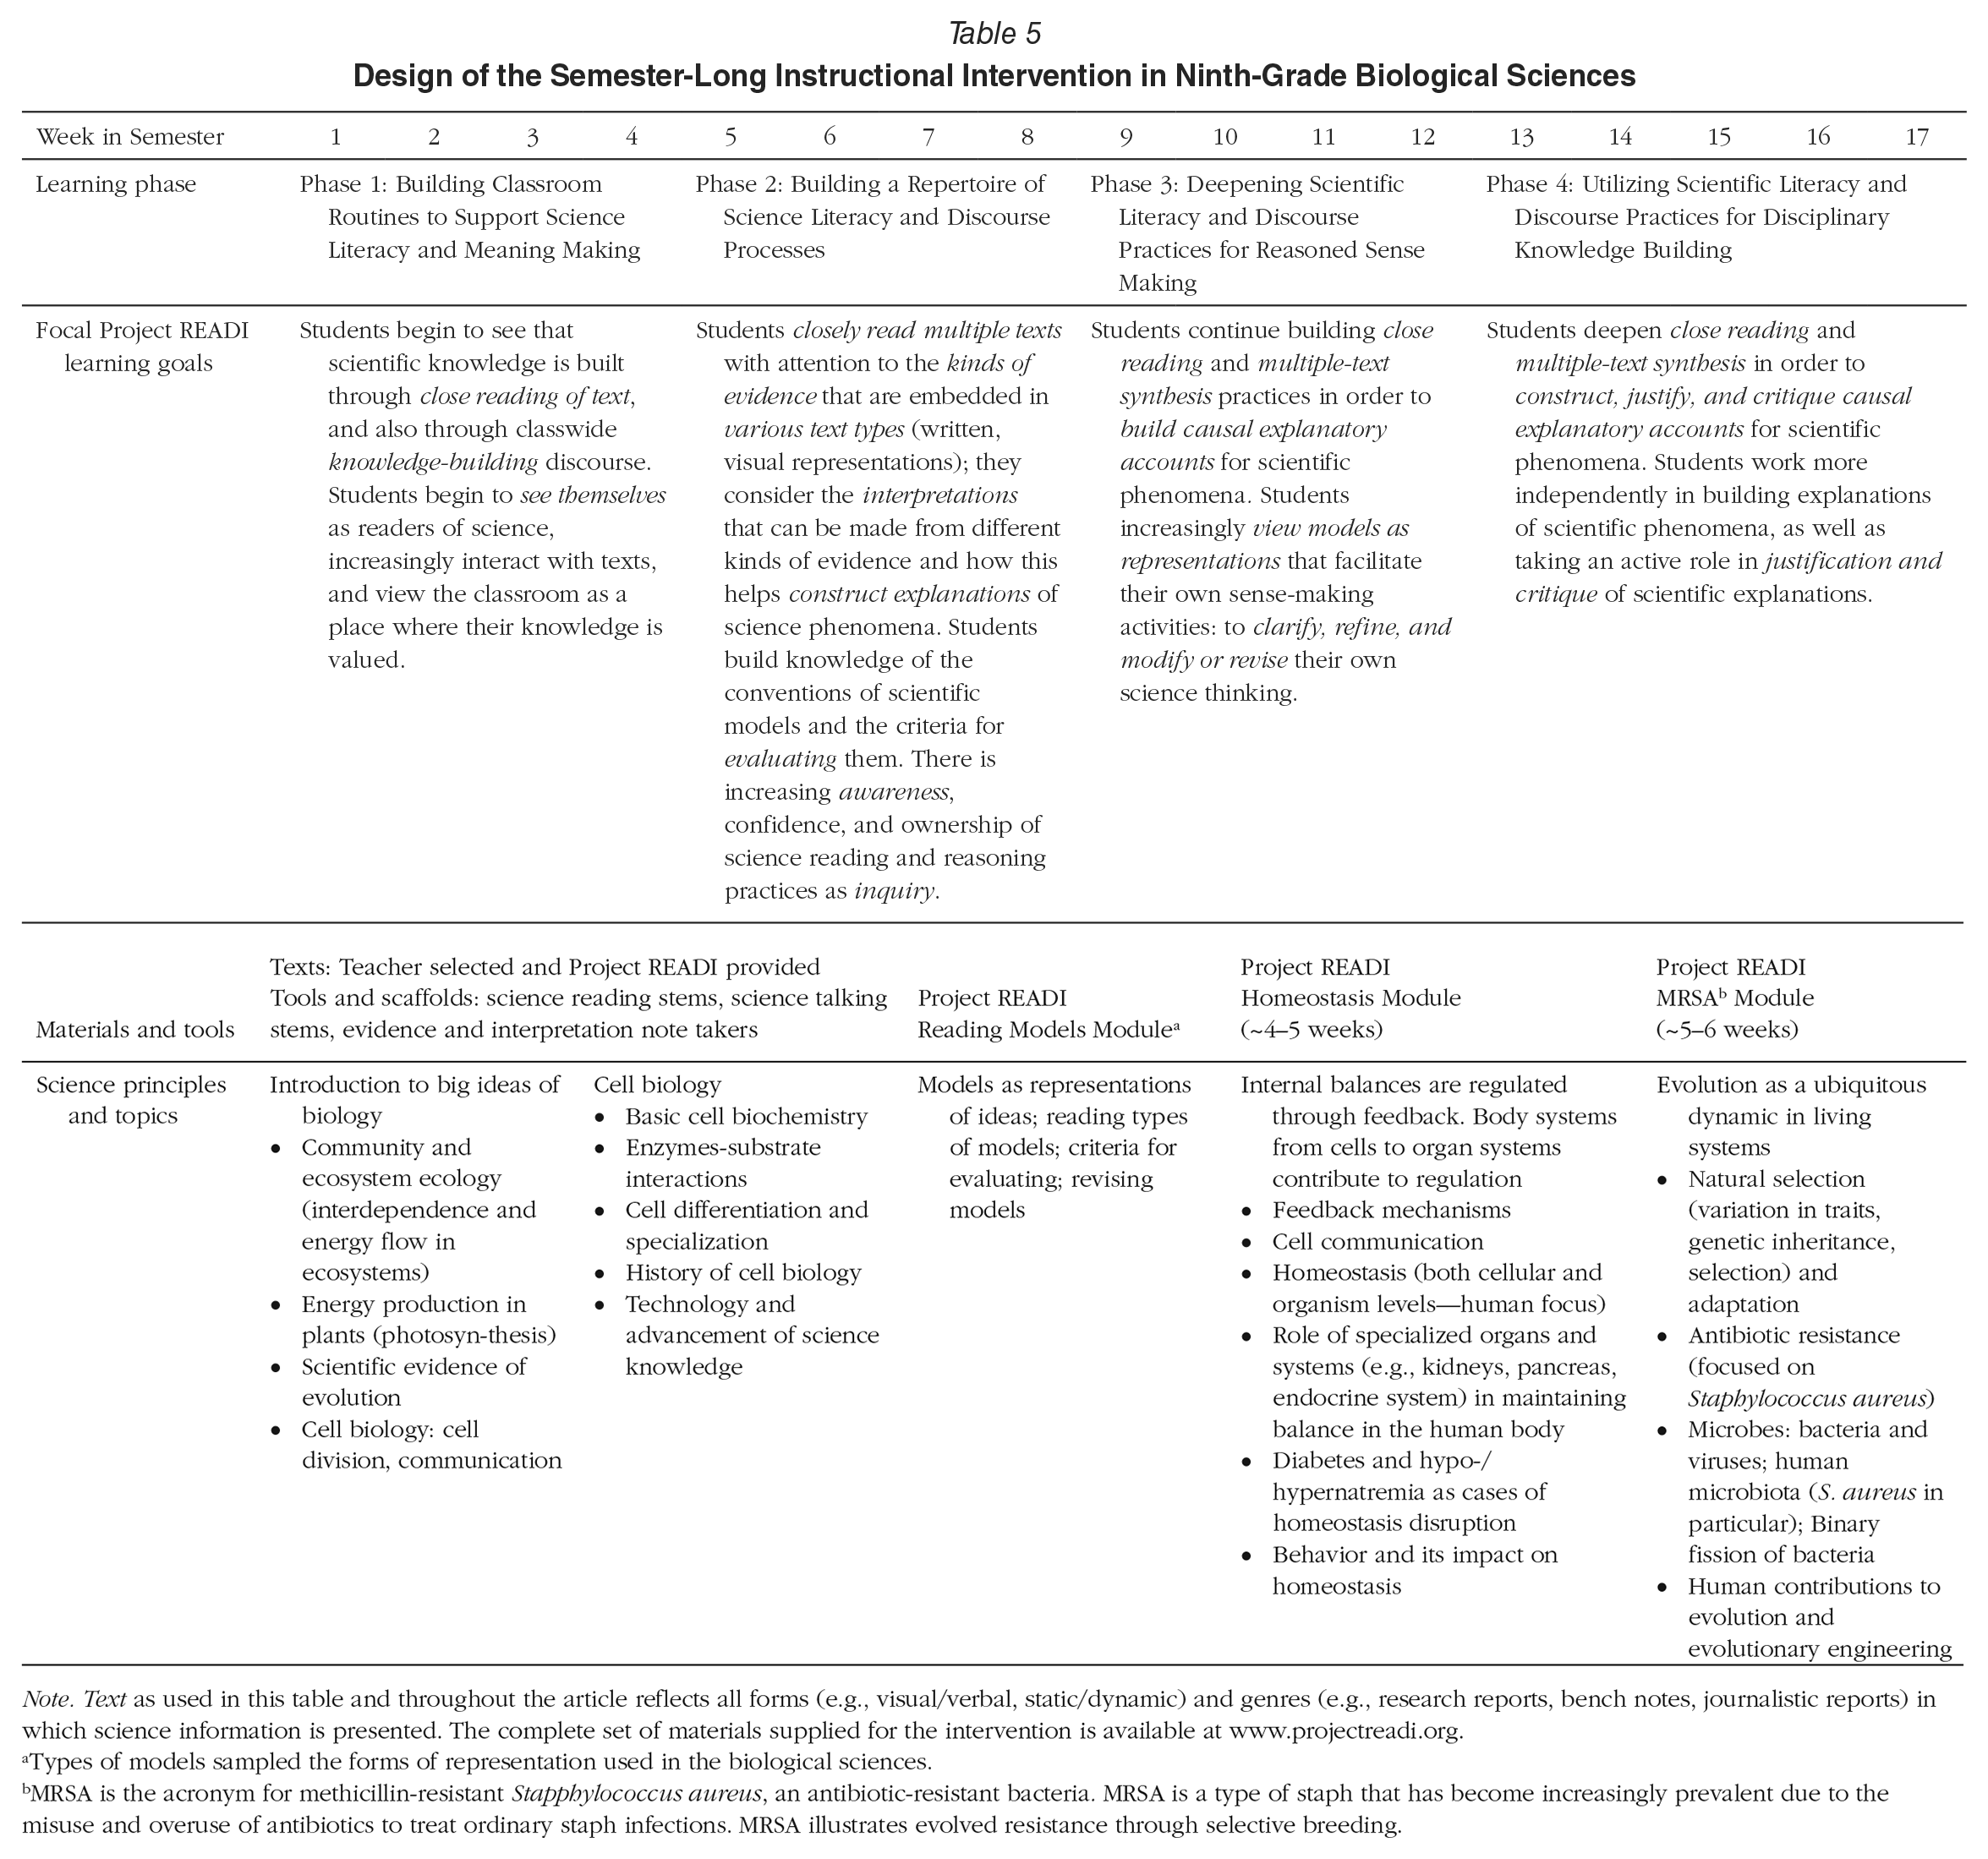
Note. Text as used in this table and throughout the article reflects all forms (e.g., visual/verbal, static/dynamic) and genres (e.g., research reports, bench notes, journalistic reports) in which science information is presented. The complete set of materials supplied for the intervention is available at www.projectreadi.org.
Types of models sampled the forms of representation used in the biological sciences.
MRSA is the acronym for methicillin-resistant Stapphylococcus aureus, an antibiotic-resistant bacteria. MRSA is a type of staph that has become increasingly prevalent due to the misuse and overuse of antibiotics to treat ordinary staph infections. MRSA illustrates evolved resistance through selective breeding.
The learning phase progression was organized to introduce and then deepen the reading, reasoning, and discourse skills that students need to engage in text-based inquiry for the purpose of constructing explanatory models of biological phenomena. In Phase 1, classroom routines that support reading, reasoning, and talking about biology were established. In Phase 2, students worked within these classroom routines and moved from more generic reading, reasoning, and talking strategies and heuristics to those tailored to make sense of principles, concepts, and models germane to the biological sciences. In Phase 3, the routines and sense-making processes were instantiated in inquiry aimed at constructing explanatory models of biological phenomena, often motivated by driving questions or conundra intended to induce puzzlement in students. In Phase 4, the students deepened their explanatory modeling practices by not only constructing but also justifying and critiquing alternative models.
The design relied on intentional sequencing of information resources in combination with tools intended to scaffold reading, reasoning, representational, and modeling practices, as well as the classroom routines that made these processes visible. Particularly important for making processes and thinking visible are classroom discourse routines that support metacognitive awareness of how we know what we know. As described previously, the specific materials, tools, and instructional processes for engaging students in the reading, reasoning, representational, and modeling practices in biology were based on those that had been iteratively designed and implemented by teachers in the Strands 2 and 4 work. These were assembled into student notebooks and text sets (“readers”). The student notebooks included descriptions of activities, instructions for what students were to do, and templates of various worksheets that scaffolded reading, reasoning, and modeling activities. The design assumed teacher facilitation and mediation of students’ use of notebooks. Teacher guides to the facilitation and mediation took the form of annotated versions of the student notebooks. The annotations provided guidance and tips from teachers who had been involved in the iterative design process. The specifics of the four phases of learning are provided in Appendix B in the online supplemental materials. Summaries of the modules listed in Table 5 under “Materials and tools” are provided in Appendix C in the online supplemental materials. Complete modules can be accessed and downloaded at www.projectreadi.org.
Design of Professional Development for Intervention Teachers
The professional development design was shaped by what we had learned from collaborating with teachers during the Project READI Strands 2 and 4 work in conjunction with the constraints of conducting an RCT efficacy study, as discussed above in the section “Project READI Approach to Professional Development.” The PD was designed to achieve two focal goals:
Raise teachers’ awareness of their own practices for making sense of science information, including the reading, reasoning, and arguing processes they used when working with science materials that were challenging for them as adult biological sciences teachers.
Immerse the teachers-as-learners in the intervention they would subsequently implement with their students, a process similar to the educative curriculum approach (Davis & Krajcik, 2005).
The immersion process engaged teachers in constructing explanatory models of the phenomena and topics covered in the ninth-grade biological sciences course and provided a basis for teachers to discuss and reflect on how to introduce and sustain the instructional routines and classroom participation structures. In particular, they reflected on the challenges they expected students would experience and brainstormed tools and strategies for supporting students, especially in reading to construct explanatory models from biology information sources (e.g., texts, graphs, diagrams). Throughout, they examined their own thinking about modeling practices, including justification and evaluation of models based on coherence and completeness criteria.
The intervention teachers participated in a total of 11 daylong sessions distributed over 10 months, as shown in Figure 1. Nine days occurred during the winter, spring, and summer preceding the actual start of the intervention work. The remaining 2 days were during the intervention’s enactment.
Sessions 1 to 4
The teachers were immersed in reading practices relevant to learning science (e.g., Schoenbach et al., 2012). For example, Session 1 focused on engaging the teachers with close reading of science texts—in particular in participating in the routines that they would enact to lay the groundwork for and foster student engagement in science reading and learning. The participants explored how literacy has shaped their engagement with text, how the social conditions of the learning environment affected them, and how they read and thought as scientists. They were asked to try out these routines in their classrooms in preparation for bringing artifacts from these efforts to Session 2. During Session 2, the teachers shared their artifacts, discussed their experiences, and engaged in inquiry focused on engaging students in reading to construct explanations of science phenomena. Again, the teachers were expected to try out these routines in their classrooms and debrief at the next meeting. Similarly, during Sessions 3 and 4, the emphasis was on pedagogical practices for supporting text-based inquiry in science.
Sessions 5 to 9
Five sessions during the summer focused on organizing the work of the semester-long student intervention. The teachers were provided with an overview of the intervention semester (Table 5) and familiarized themselves with the substance of the intervention—the information resources provided for students in the form of readers for each module, the tasks, the descriptions of activities, and the tools provided in the student notebooks. During the sessions, the teachers participated as students in the instructional routines and activities they were to implement in their own classrooms. Especially important were the teacher modeling activities because in the Project READI approach modeling of reading and reasoning makes these thinking processes visible to students. The teachers revisited the activities— but now in the context of biological science topics and explanatory modeling practices. The teachers worked through and discussed the suggested candidate texts for the introductory and cell biology topics as well as the Reading Models module. They previewed the Homeostasis and MRSA (an acronym for methicillin-resistant Stapphylococcus aureus) modules.
Sessions 10 and 11
These sessions focused on the teachers taking deeper dives into the Homeostasis module (Session 10 during Week 6) and the MRSA module (Session 11 during Week 10). Also, they provided opportunities for the teachers to share their experiences and their instructional strategies.
Design of Professional Development for the Control Teachers
The control teachers were provided 5 full-day sessions of PD, during which they experienced a modified version of the PD that had been provided to the intervention teachers. The five sessions all took place after data collection for the RCT study was completed (see Figure 1). The control group teachers covered all of the same topics and learning experiences that the intervention teachers had covered, except for the portions concerned with implementation planning. The control teachers were provided with the same instructional resources that had been provided to the intervention teachers.
Data Collection Instruments: Teachers
All the teachers completed a self-report survey about their attitudes and practices regarding students’ reading in science prior to the start of the PD for the intervention teachers (pre-intervention) and again after all data were collected from students but prior to the PD provided for control teachers (postintervention). The classroom practices of the teachers in both conditions were observed twice during the intervention. The instruments used to collect these data are described below.
Teacher Self-Report Survey of Attitudes and Practices
The Project READI team developed and administered a self-report survey of teachers’ attitudes and practices related to teaching science, science literacy, and their student populations, consisting of 72 items that reflected 10 scales. One scale was a single item that asked about familiarity with the CCSS. Three scales were developed for the purposes of this study, and 6 scales were adapted from those used in a prior RCT conducted by a subset of the Project READI team (Greenleaf et al., 2011). All items used a 5-point Likert-type response format with all the response options labeled. Table 6 presents information on each scale, including the name and construct tapped by the scale, the number of items before and after the exploratory factor analyses (EFAs; reported in the “Data Analysis” section), one or two example items, the type of response scale (e.g., frequency, agreement, or importance), the response options, and the reliabilities obtained at the pre and post administrations.
Survey of Teacher Knowledge, Attitudes, and Practices Related to Students and Science Reading
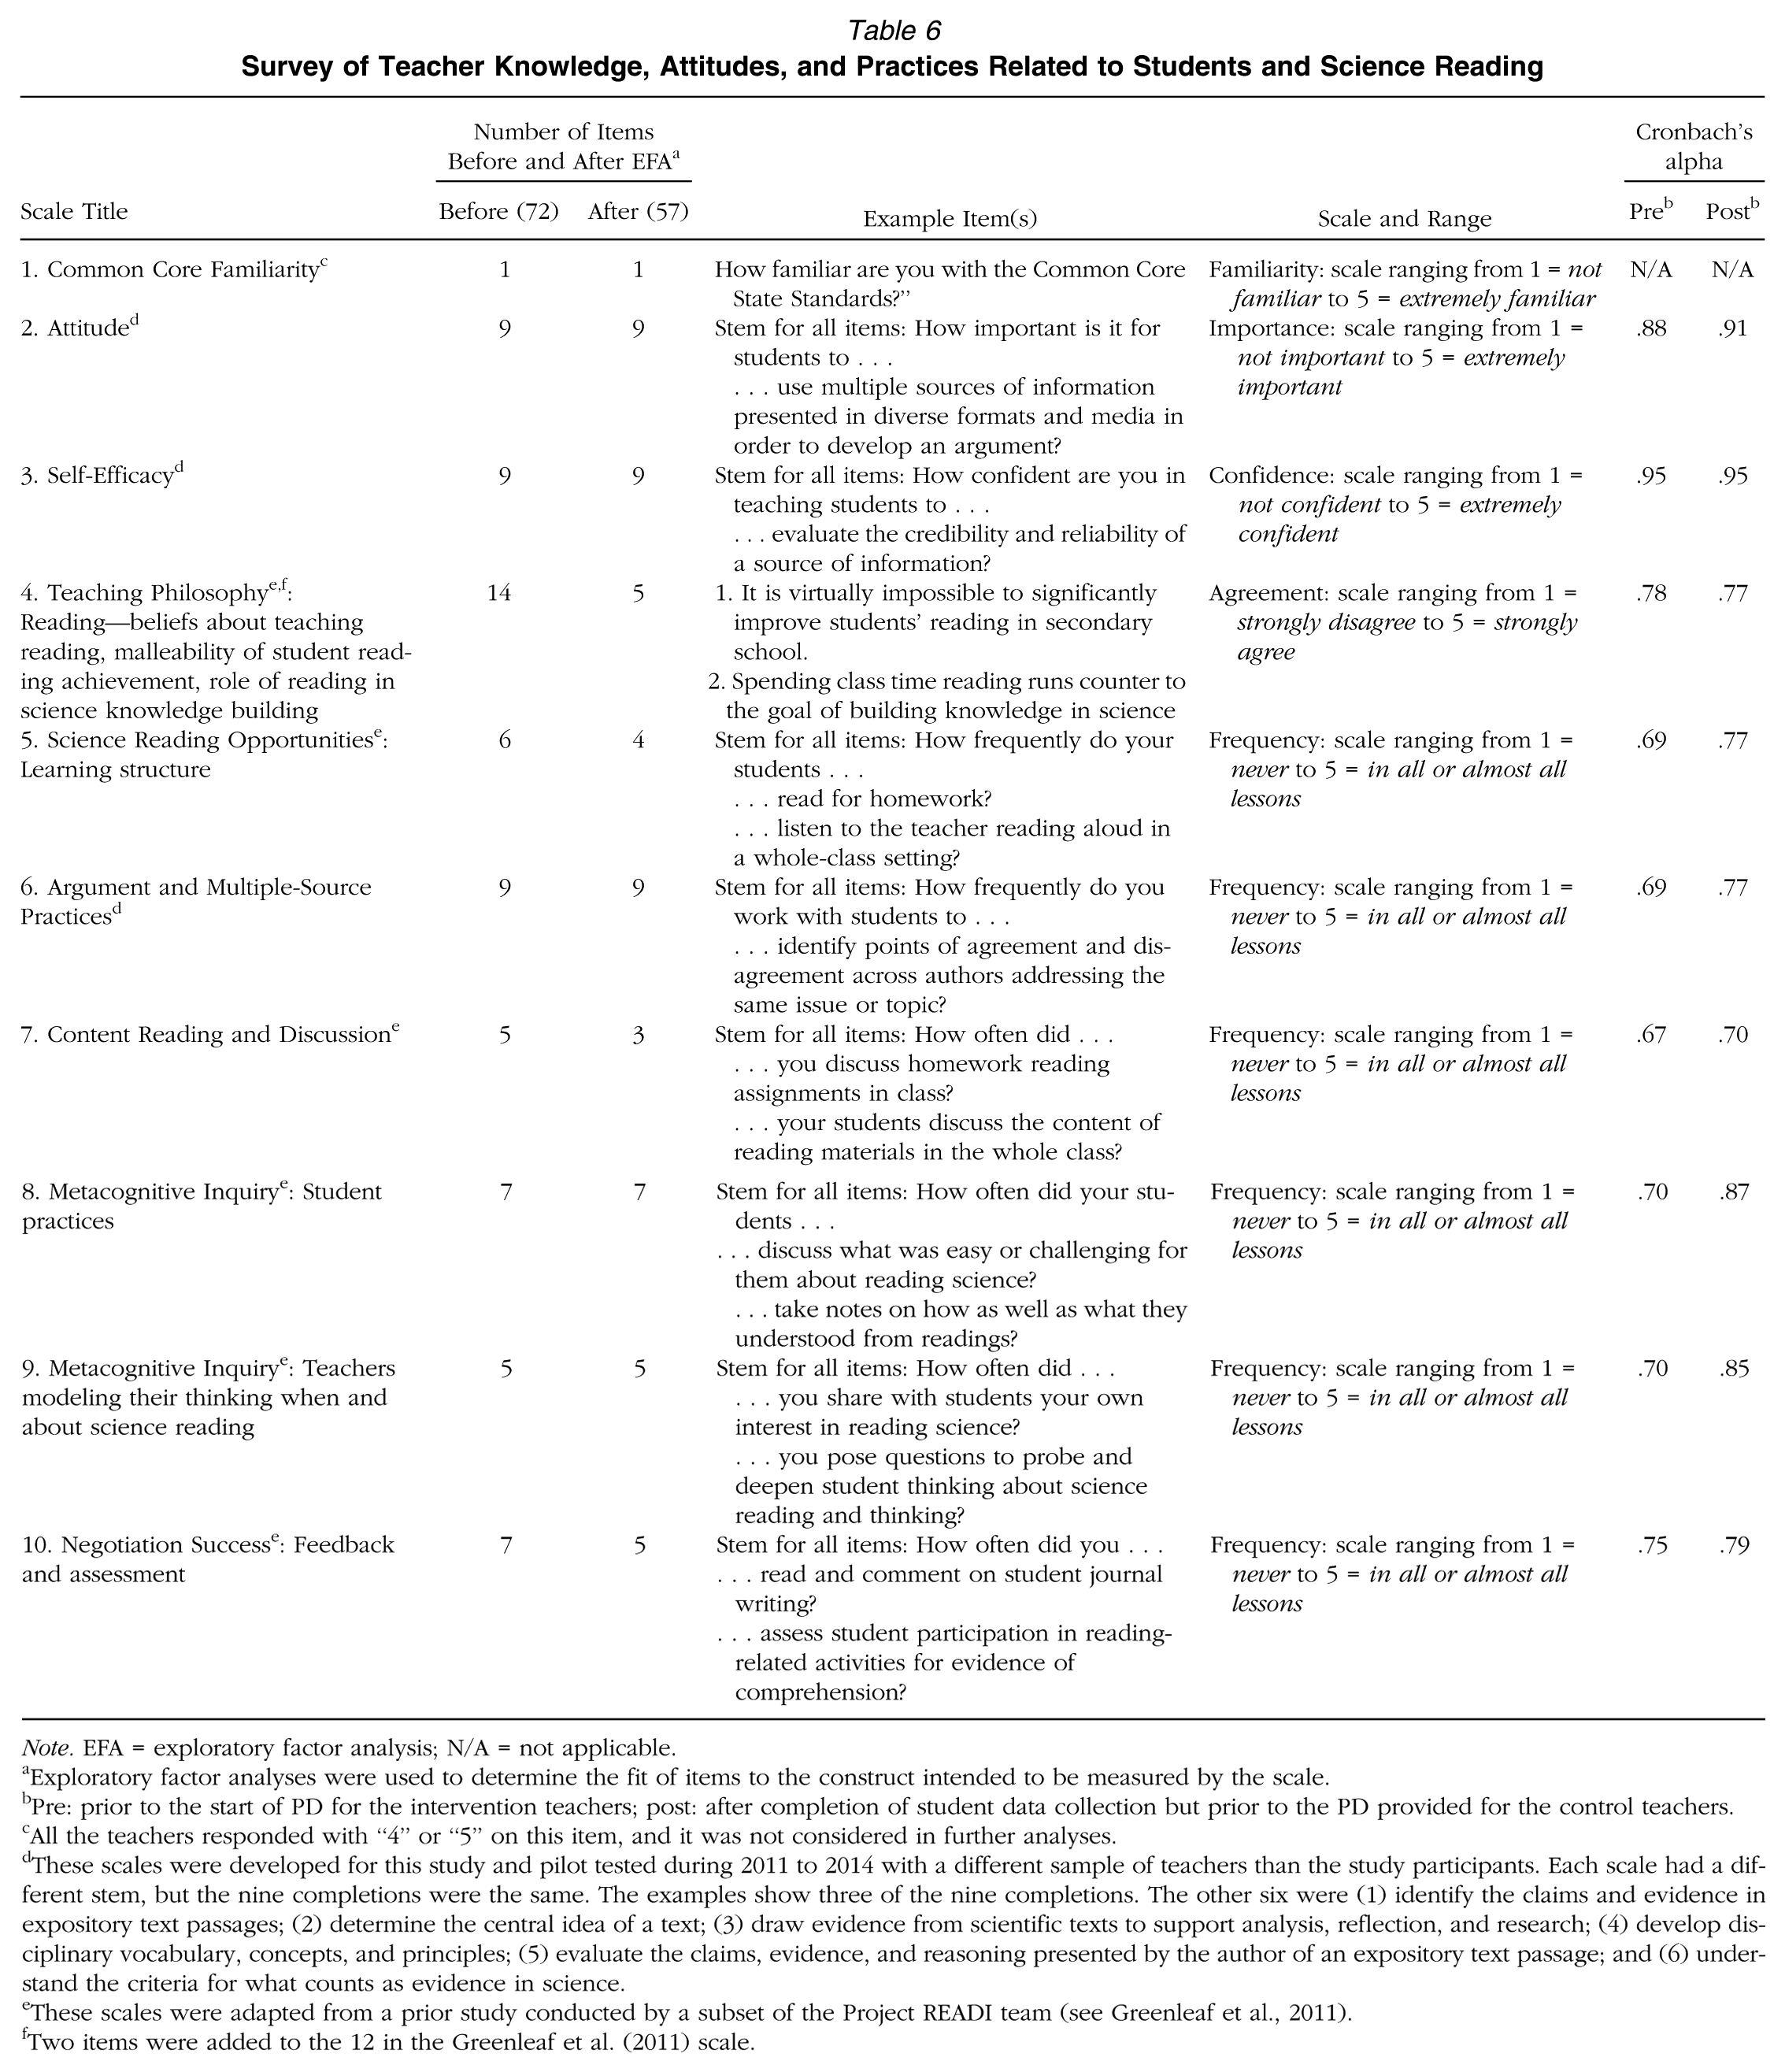
Note. EFA = exploratory factor analysis; N/A = not applicable.
Exploratory factor analyses were used to determine the fit of items to the construct intended to be measured by the scale.
Pre: prior to the start of PD for the intervention teachers; post: after completion of student data collection but prior to the PD provided for the control teachers.
All the teachers responded with “4” or “5” on this item, and it was not considered in further analyses.
These scales were developed for this study and pilot tested during 2011 to 2014 with a different sample of teachers than the study participants. Each scale had a different stem, but the nine completions were the same. The examples show three of the nine completions. The other six were (1) identify the claims and evidence in expository text passages; (2) determine the central idea of a text; (3) draw evidence from scientific texts to support analysis, reflection, and research; (4) develop disciplinary vocabulary, concepts, and principles; (5) evaluate the claims, evidence, and reasoning presented by the author of an expository text passage; and (6) understand the criteria for what counts as evidence in science.
These scales were adapted from a prior study conducted by a subset of the Project READI team (see Greenleaf et al., 2011).
Two items were added to the 12 in the Greenleaf et al. (2011) scale.
The scales described in Table 6 were targeted at teachers’ attitudes with respect to the role and importance of reading in science (Scale 2), their confidence in teaching and implementing science reading strategies with their students (Scale 3), and the malleability of student reading achievement (Scale 4). With respect to practices, the teachers were asked to indicate how frequently they had students read science material in different contexts (Scale 5), engage in discussions of science content within and across sources and for purposes of identifying the elements of an argument (Scales 6, 7), and engage in metacognitive discussions about the processes of reading (Scale 8). They were also asked how often they made their science reading and reasoning processes visible to their students (e.g., through modeling) (Scale 9) and how frequently and in what manner they provided students with feedback on their reading assignments (Scale 10).
Observation of Teachers’ Classroom Practices
Observers took field notes continuously throughout the observed class period. Each observer then used the field notes to assign a rubric score point to each of 19 indicators, resulting in 19 scores for each teacher for each observation. Score points ranged from 1 (lowest) to 4 (highest). The indicators were a priori clustered into six constructs central to accomplishing Project READI science learning goals: opportunities to read science to acquire content knowledge (Construct 1), teacher support for students’ comprehension processes (Constructs 2), metacognitive inquiry into processes and content (Construct 3), strategies and tools for text-based inquiry (Construct 4), argumentation and model building (Construct 5), and collaboration (Construct 6). Definitions of the constructs, the indicators of each construct, and criteria for the lowest and highest score points for each indicator are provided in Appendix D in the online supplemental materials. Generally, the indicators referred to the extent to which the tasks and teachers supported and provided students with opportunities to engage in the activities referred to in the construct and whether and how students took advantage of such opportunities.. Observations were conducted by six members of the project staff, all of whom were familiar with the intervention, including three who had been directly involved in its development. A rater who had not been involved with the intervention development (external rater) provided ratings that were used for purposes of interrater reliability. The external rater was a member of the project’s assessment design team and familiar with the learning goals and instructional approach. Training to achieve consensus on the criteria for the various score points was conducted prior to the Time 1 and again prior to the Time 2 observations. The training involved each of the seven raters independently watching a video of a science class, taking field notes, and assigning score points. Different videos were used for training at the two time points. The Time 1 video was of a middle school teacher implementing an early iteration of a text-based investigation of the water cycle; at Time 2, the video was of a ninth-grade genetics lesson that used text but was taught by a non–Project READI teacher. The seven raters met to discuss score points and rationales. Discussion of each video produced consensus regarding the criteria for all score points on all indicators.
To establish interrater reliability on score point assignments for the teachers observed in the present study, the external rater observed one class with each of the six observers, thus resulting in six pairs of observations at Time 1 and six pairs of observations at Time 2. The external rater was not told whether the teacher was an intervention or a control teacher. Percent agreement was computed for exact score point agreement and agreement within 1 score point. Average exact percent agreement was 76.4% (range 51.7% to 96.6%) at Time 1 and 65.5% (range 89.7% to 51.7%) at Time 2. Within 1 score point, average agreement at Time 1 was 93.1% (range 100% to 86.2%); it was 92.5% at Time 2 (range 100% to 89.7%). Disagreements in score point assignments were discussed and resolved.
Data Collection Instruments: Students
As previously mentioned, the students completed the EBA assessment, self-report surveys (science epistemology and science self-efficacy), and two reading comprehension assessments (one administered pre-intervention, the other postintervention). Although the EBA assessment topics had not been part of the instruction in either the intervention or the control group, the EBA assessment was highly aligned with the intervention instruction as it targeted practices of explanatory modeling of biological science phenomena from multiple information sources. Self-report surveys of prior knowledge of the topics featured in the EBA (or part of the EBA), epistemology, and self-efficacy were administered because individual differences associated with these constructs are known to impact comprehension (e.g., Alexander, 2003; Nietfeld, Cao, & Osborne, 2006; Strømsø, et al., 2008). All of these instruments were designed to be administered pre- and post-intervention. In addition, the students completed two reading comprehension assessments developed by the Educational Testing Service (ETS): Pre-intervention, all students completed the Reading Inventory and Scholastic Evaluation (RISE; Sabatini, Bruce, & Steinberg, 2013), a test of basic reading comprehension skill (e.g., word recognition, decoding, morphology, vocabulary, sentence processing, basic reading comprehension) . Postintervention all students completed the Global Integrated Scenario-Based Assessment (GISA), a test of comprehension from multiple texts (Sabatini & O’Reilly, 2015). The GISA tapped reading and reasoning skills applied to science information resources but in a format that was less similar to the intervention instruction. Thus, the GISA assessment represents a far transfer test relative to the intervention and EBA.
EBA From Multiple Texts
The Project READI science and assessment teams designed the EBA assessment to closely align with the text-based inquiry intervention. The assessment consisted of a set of five texts that students were to read and then use to complete four tasks, with the texts present. The tasks all involved understanding an explanatory model that could be constructed from the information provided in the text set. We developed text sets and corresponding tasks on two topics (Skin Cancer and Coral Bleaching), allowing us to counterbalance within the classroom so that a student completed the assessment on different topics at pre and post. These two topics were selected after several rounds of piloting different topics that were related to the biological sciences but were not taught directly in either the intervention or the control classrooms. Pilot testing indicated that the Skin Cancer and Coral Bleaching topics and the text sets provided were manageable by ninth-grade students enrolled in biology. However, piloting also indicated that the two topics were not equal in difficulty; that students provided less complete answers the second time they saw the same topic, regardless of which topic it was; and that they did not see the point of doing the same tasks on the same topic a second time. Given that there are statistical procedures that can take the differential difficulty of the two topics into account in analyses, we implemented a within-classroom topic by time of assessment counterbalancing plan for the Skin Cancer and Coral Bleaching topics rather than have students complete exactly the same tasks on the same topics at pre and post.
The text set for each topic consisted of one text that provided background information about the topic plus four texts, one of which was a graph. Each text set was designed such that constructing the model required reading and synthesizing information across the multiple texts in the set. The text set contained the information needed to answer a prompt that asked for an explanation of a phenomenon associated with the topic. Figures 2a and b are representations of the linked network of states and events derived from the information in the text set for Skin Cancer (a) and Coral Bleaching (b). These reflect representations of explanatory models that provide complete and coherent responses to the prompt based on the information in the text set for the topic.
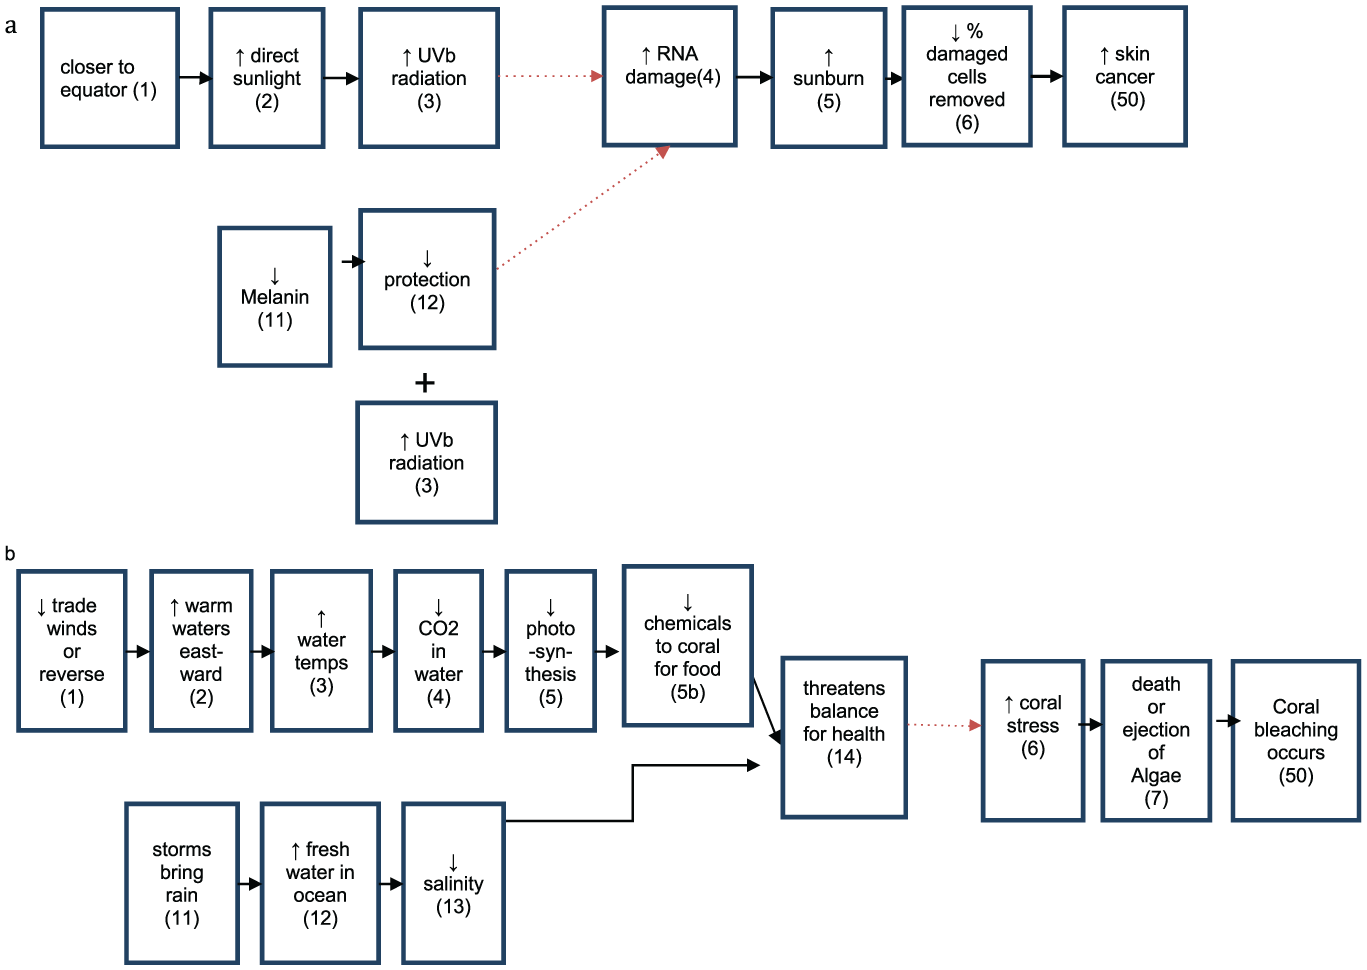
Representations of complete and coherent models that could be constructed from text sets for (a) Skin Cancer and (b) Coral Bleaching.
Prior to beginning the EBA assessment, the students rated how much they knew about skin cancer or coral bleaching, depending on the topic they were assigned, using a Likert-type scale with 1 = I do not know anything and 6 = I know a lot. The brief nature of the prior knowledge assessment reflected the time constraints for the assessments and that we wanted to maximize the time the students had to read and complete the EBA tasks. The self-reported topic prior knowledge ratings were used to statistically control for differences in prior knowledge when examining the effects of the Project READI intervention.
The task instructions prior to reading informed the students that one purpose of reading in science was to understand why and how science phenomena happen. The instructions stated that students were to read the source materials provided in their packet to help them understand and explain as follows: For Skin Cancer: What leads to differences in the risk of developing skin cancer? For Coral Bleaching: What leads to differences in the rates of coral bleaching? For both: While reading, it is important to show your thinking by making notes in the margins or on the texts. You will be asked to answer questions and use specific information from the sources to support your ideas and conclusions.
The instructions also specified that the information sources could be read in any order but that students should read the sheet titled “Background: Skin Damage” (or “Coral Bleaching,” depending on their topic) because it provided general information on the topic.
Four task types were used to assess students’ understanding of the explanatory model and were to be completed in the following order. This order was intended to minimize students using information from the later tasks in the earlier tasks.
The essay task asked students to express the explanatory model in words or visuals.
The multiple-choice (MC) task presented students with nine items that tapped connections among elements in the model, some of which had to be inferred. Four alternative answers were provided for each question, and students had to select one.
The peer essay evaluation task presented the students with two explanations (attributed to fictitious students). The essays were constructed to contrast on six criteria important to evaluating the adequacy of models of science phenomena: relevance (staying on topic), coherence (connecting concepts to the final outcome), completeness (stating both initiating factors), the importance of sourcing, mentioning the graph from the text set, and mentioning a concept tied to the graph in the text set. Each peer essay adequately addressed only three of the criteria. This design meant that each essay met three of the criteria of an explanatory model. The criteria lacking in one were present in the other. This design was adopted based on pilot data indicating that this strategy yielded the most informative student responses from which to infer criteria the students were considering in their evaluations.
The graphical model comparison task asked students to decide which of two graphical depictions of possible explanatory models was more adequate and why. Students selected one model and wrote short explanations of the basis of their evaluations.
Of the four tasks, the MC task required the least amount of language production and thus came closest to traditional standardized testing methods of assessing reading comprehension. The essay task required students to organize and express their thinking about the explanatory model, thereby assessing comprehension and language production at the same time. Neither the MC nor the essay task required students to critique or evaluate models of the phenomenon. That was the purpose of the peer essay evaluation and the graphical model comparison tasks.
The instructions for the four task types all included statements indicating that students could refer to the texts they had been provided. Appendix E in the online version of the journal contains the complete set of instructions for reading and for the four task types.
Coding and Scoring of the EBA Tasks
Scoring ranges and reliability of coding are reported in Table 7. Coding and scoring of all measures were conducted with the condition and the time of testing (pre or post) blinded. (For details of the process used to establish reliability in scoring, contact the first author.) Note that disagreements among the coders were resolved through discussion.
Coding and Scoring and Interrater Reliability for Evidence-Based Argument Measures
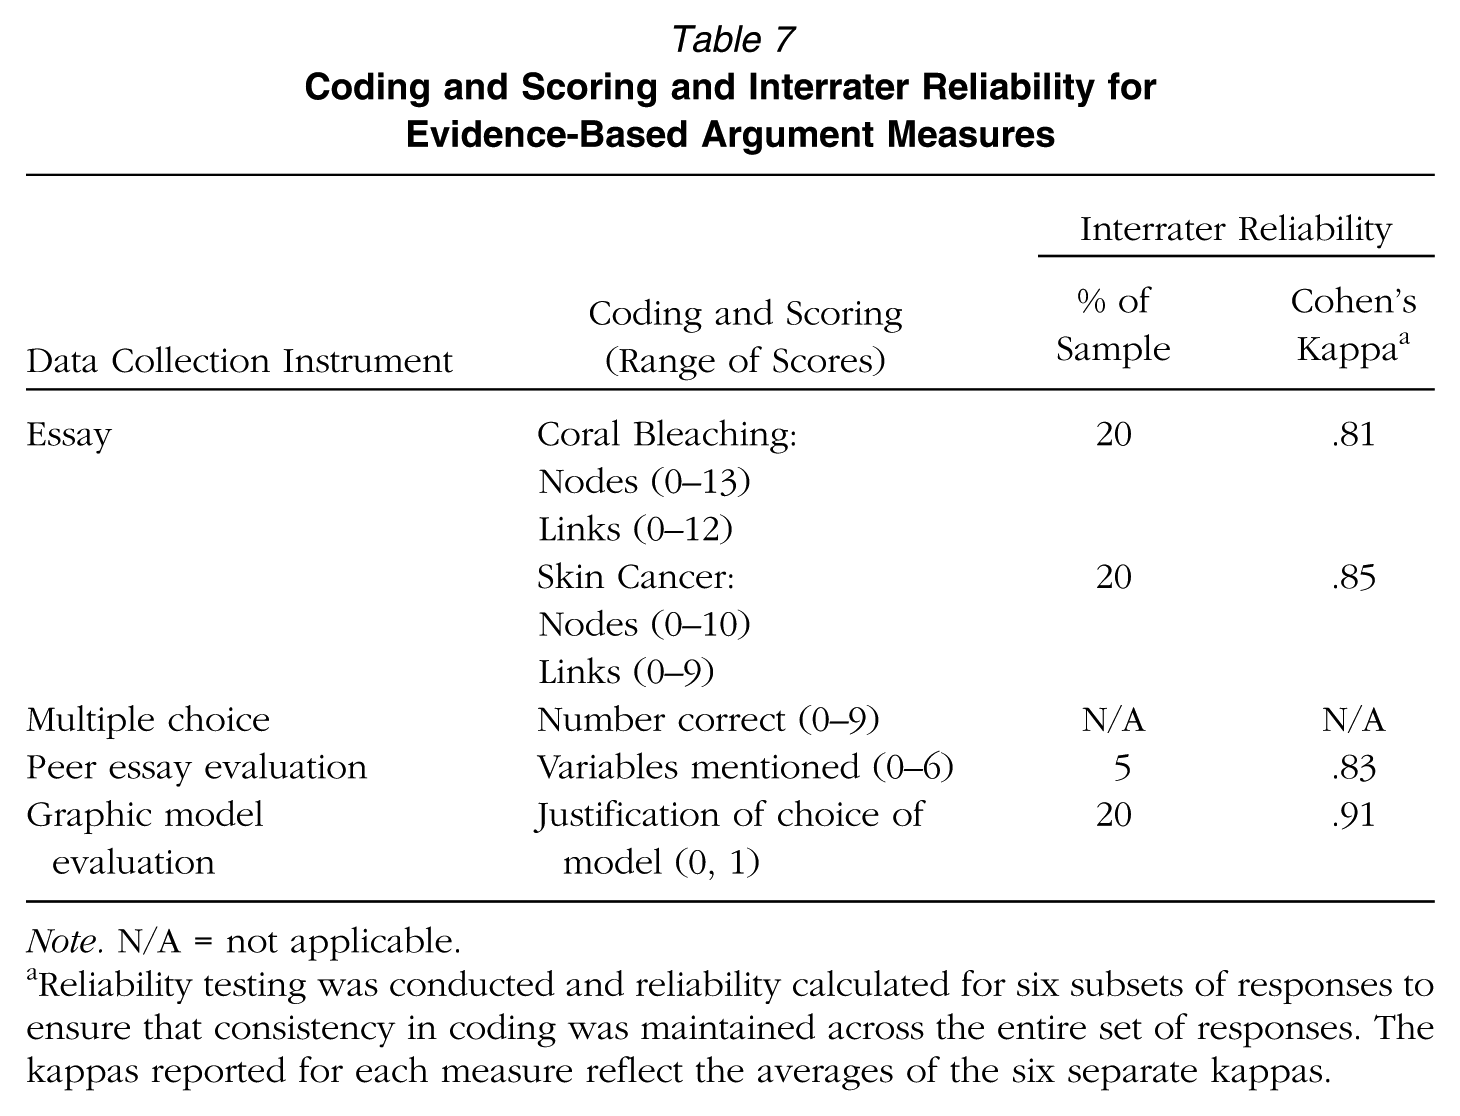
Note. N/A = not applicable.
Reliability testing was conducted and reliability calculated for six subsets of responses to ensure that consistency in coding was maintained across the entire set of responses. The kappas reported for each measure reflect the averages of the six separate kappas.
Essays
The essays were scored to determine the number of concepts (Figure 2, rectangles) and the number of connections (Figure 2, arrows) the students included in their essays. The essays were coded on a sentence-by-sentence basis to identify all the concept nodes and all the connections between the concepts.
Multiple choice
Each item was scored as correct or incorrect. Individual student scores ranged from 0 to 9 and were recorded as percent correct.
Peer essay evaluation
The peer essay evaluation justification scores indicated how many of the six variables were mentioned across the two peer essays. A score of 1 was given for a variable if the student correctly wrote about the variable in at least one of the essay evaluations (i.e., correctly noting that the variable was present or correctly noting that the variable was absent).
Graphical model evaluation
The justification of the model evaluation item was scored as 1 or 0 based on a brief rubric of acceptable answers. The language in the justification of the selection of the better model had to include some variant of the following options: steps, step-by-step, order, cause and effect, the way it’s organized, process, chain reaction, how they connect to each other.
Descriptive statistics for the peer essay evaluation and the graphical model evaluation tasks indicated wide variation in scores within each group and minimal differences in central tendency measures between groups and across time.
Science Epistemology Survey
A subset of the team developed and validated this scale over the first 4 years of the project to specifically assess various dimensions of epistemology related to text-based science inquiry from multiple sources (Salas et al., 2016). Several iterations of piloting resulted in a final set of 18 items constituting two scales reflecting the nature of science knowledge: Complex/Uncertain (7 items: e.g., “Most scientific phenomena are due to a single cause”; “The best explanations in science are those that stick to just the one major cause that most directly leads to the phenomena”) and Integration/Corroboration (11 items: e.g., “To understand the causes of scientific phenomena, you should consider many perspectives”; “You should consider multiple explanations before accepting any explanation for scientific phenomena”). Students endorsed the items using a scale ranging from 1 = strongly disagree to 6 = strongly agree.
For each student, 18 scores were recorded for analysis, with higher ratings reflecting more normative beliefs about the nature of science knowledge.
Science Self-Efficacy Survey
Nietfeld et al.’s (2006) Self-Efficacy scale was adapted to align with the science domain and piloted during the year preceding the efficacy study reported in this article. The resulting scale contained six items measuring students’ confidence to learn and perform well in science (e.g., I am sure I could do advanced work in science). The scale employed a 5-point Likert-type response scale with option labels for the middle and both end points: 1 = nothing like me, 3 = somewhat like me, 5 = exactly like me. Each student contributed one rating for each item, with higher ratings reflecting higher confidence in doing science.
Basic Comprehension Skills Assessment
At the beginning of the school year, the students completed the RISE (Sabatini et al., 2013). This assessment enabled us to examine the intervention’s impact taking into account pre-intervention proficiency on basic reading skills. Reliabilities on the RISE, computed as Cronbach’s alpha for each subtest in each of Grades 5 to 10, ranged from .64 to .98 (Sabatini, Bruce, Steinberg, & Weeks, 2015). ETS staff scored this assessment and returned scores on each subtest and a total score.
Comprehension of Multiple Texts: GISA
The GISA assessment was developed specifically to tap comprehension of multiple texts using scenarios that pose authentic reading situations (e.g., preparing for a class presentation; Sabatini & O’Reilly, 2015). The students took this test postintervention using the Web-based administration platform. The topic of the GISA, mitochondrial DNA, was specifically developed for the study’s intervention. This topic is related thematically to the content covered in both the intervention and the control classes but was not itself a topic that was taught in either group. This GISA form contained an initial assessment of prior knowledge and then assessed a variety of comprehension skills, including literal comprehension and reasoning about information (e.g., students were asked to read and reason about the attributes of nuclear and mitochondrial DNA and construct a table to indicate whether specific attributes are true of nuclear DNA, mitochondrial DNA, both, or neither). Other items provided inferences, and students had to decide if the inference was supported by the text or not. This GISA form also presented the claims of two scientific theories and the evidence that supported each, and students were asked to decide which of several presented statements provided additional evidence for each theory. The final task involved reading a short article that presented new evidence. Students were asked to decide which theory the evidence supported and indicate why.
All responses on the GISA except the justification for the theory chosen were selected response items. The ETS returned the total percent correct scores for each individual student for analysis. Sabatini, O’Reilly, Weeks, and Steinberg (2016) reported that in field tests conducted across a variety of GISA forms and grade levels, Cronbach’s alpha coefficients for the total percent correct score ranged from .72 to .89.
Data Collection Procedures: Teachers
As depicted in Figure 1, all the teachers completed the pre assessment survey prior to the start of PD for the intervention teachers (in early 2014); the post assessment occurred at the conclusion of the intervention. Across the schools in the study, start dates varied from mid-August to just after Labor Day, leading to variation between districts in when the classroom intervention began and ended. All teachers in both conditions were observed twice during the intervention period. Observations of intervention and control teachers from the same district or strata were scheduled within a week of each other. Across teachers, the average time between observations was 108 days (SD = 11, range 93–132 days). In the intervention classrooms, this corresponded to roughly the 4th to 7th week of the intervention implementation for Time 1 and the 12th to 17th week for Time 2 (see Table 5). The timing of the control teachers’ post surveys coincided with the timing for the intervention teachers within their strata and district.
Data Collection Procedures: Students
The EBA assessment was administered in paper-and-pencil format over two successive days during the biology class period. For the pretest, the epistemology survey was distributed and completed first (in 10 minutes), followed by the brief topic prior knowledge rating for the pretest topic. After completing the topic prior knowledge rating, the students each received a folder that contained the relevant texts for their topic, arranged in the same order for all students but “clipped” rather than stapled so they could easily manipulate them. The booklets stated the overall task instructions (see Appendix C, available in the online version of the journal) and indicated that the rest of the first class period was for reading and annotating the texts. Each student’s folder was collected at the end of Day 1 and returned to that student on Day 2, along with a response booklet that repeated the overall task instructions; specific instructions for each task were included when the task appeared in the booklet. Tasks were organized in a fixed order: essay first, with lined paper provided for writing; MC questions; peer essay evaluation; and graphic model evaluation. For the peer essay and model evaluations, lined response areas were provided. The last thing the students completed was the Self-Efficacy scale. An additional class period was used for computer-based administration of the RISE reading comprehension test.
Postintervention administration was organized similarly in terms of task order and organization of the materials. Each student worked on a topic not worked on at pretest. The GISA was administered via computer within 2 weeks of completing the EBA post assessment.
Student pre-intervention data were collected within the first 8 weeks of school, and postintervention data were collected within 2 weeks of concluding the intervention. To account for the staggered school year start dates, data collection in the control classrooms was coordinated with that in the intervention classrooms within each district. In all but one case, the control classrooms completed the assessments later in the year than the intervention classrooms, so that any bias introduced by when the test was taken would favor the students in the control classrooms. For ease of instructional management, all students in each class were administered the assessments, including the RISE and the GISA. Data from the students who had not assented to participate in the research study were destroyed prior to analysis.
Data Analysis Approaches
Preliminary data analyses used EFAs to examine the validity and reliability of the data obtained from the teacher surveys, the classroom observations, and student surveys. Descriptive statistics (means, standard deviations), tests of between- and within-group differences, and multilevel modeling were used to evaluate treatment effects.
Preliminary Analyses
When conducting the EFA of each scale, we followed Tabachnick and Fidell’s (2007) recommendations to remove items whose loadings on a factor fell below .32. Having removed such items, the EFA was rerun. Item loadings on the various scales as well as the variance explained by the scales indicate the validity of the scales (Hair, Black, Babin, Anderson, & Tatham, 2006).
Descriptive Statistics
For all measures, means and standard deviations were computed and submitted to independent-samples t tests to examine differences between the intervention and control groups on pre and post scores. Paired-samples t tests examined the pre-post differences within each group as well.
Multilevel Modeling of Treatment Effects
Teacher survey and classroom observation data were submitted to multilevel models, in which teachers (Level 1) were clustered within schools (Level 2). Treatment effects were examined for each scale on the teacher survey and each observation construct from the classroom observations. All models controlled for school strata (six levels) and included the pre score on that scale (grand mean centered at Level 1) or the Time 1 score on the specific observation construct.
Student data were submitted to multilevel models in which students (Level 1) were clustered within classrooms (Level 2) and classrooms were clustered within schools (Level 3). The appropriateness of this multilevel model was determined through preliminary analyses that compared the intraclass correlation coefficients (ICCs) at each level for each of three multilevel models. Specifically, the following three models were compared:
(a) A three-level model: students nested within classrooms nested within schools
(b) A three-level model: students nested within teachers nested within schools
(c) A four-level model: students nested within classrooms nested within teachers nested within schools
Table 8 shows the ICCs at each level for the two different three-level models and the four-level model for performance on the MC and GISA instruments. (Essay performance showed the same pattern.) When all four levels were considered, the teacher level added little shared variance (ICC = 2.22% and 0.23%, respectively), indicating that the ICCs at the teacher level were generally low. Therefore, following the recommendations in the multilevel regression literature (e.g., Raudenbush & Bryk, 2002), the more parsimonious three-level model (a) was chosen to proceed with the analyses.
ICCs for Three Competing Multilevel Models for the Multiple-Choice and GISA Performance
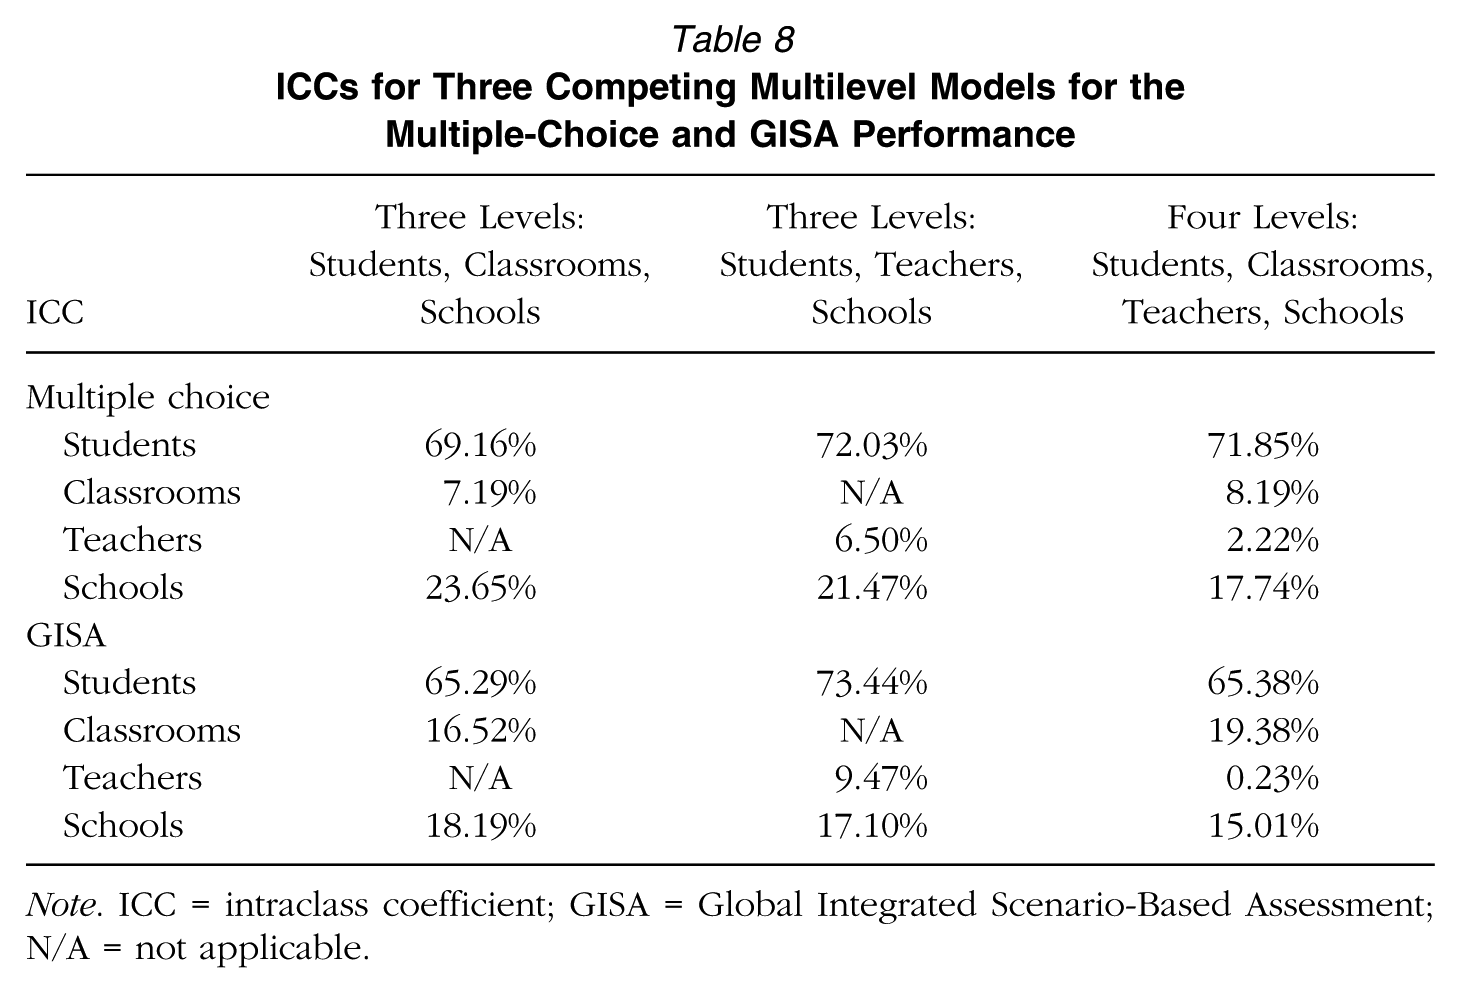
Note. ICC = intraclass coefficient; GISA = Global Integrated Scenario-Based Assessment; N/A = not applicable.
For the MC and essay tasks of the EBA assessment, treatment effects were initially tested using full models that covaried pre-intervention scores on the outcome measure (e.g., MC or essay performance), topic prior knowledge, the two Epistemology scales, and the Self-Efficacy scale (each grand mean centered). Additionally, the full models controlled for school strata (six levels), topic, and the interaction of topic by pretest score on the outcome measure. The inclusion of topic and the interaction addressed the difference in difficulty of the two assessment topics. For the GISA performance, we used a similar approach to the modeling, except that there was no topic prior knowledge variable and the RISE was used as the pre-intervention comprehension measure.
The analyses were performed using HLM 7, Hierarchical Linear and Nonlinear Modeling software Version 7.02 (Raudenbush, Bryk, & Congdon, 2016). All the multilevel models were random intercepts models. We first tested full models and followed this by removing the nonsignificant covariates and testing the trimmed models, the results of which are reported here.
Sample sizes for analyses of the various measures were based on the total number of participants who provided data for that measure and are indicated when reporting the results. For the EBA assessment analyses, only participants who were present for both the 2-day pre and the 2-day post administration were included. The resulting sample consisted of 964 students (567 intervention and 397 control) from 95 classrooms (48 intervention and 47 control) in 24 schools (12 intervention and 12 control) and 48 teachers, 24 in each condition.
Results
The first section of the results reports the preliminary factor analyses that were conducted to establish the validities and reliabilities of the survey and observation scales. The organization of the remainder of the results reflects Project READI’s theory of change: Teachers need to provide opportunities for students to learn the knowledge, practices, and dispositions that constitute the intended outcomes of the Project READI intervention. Accordingly, Research Question 2 is addressed first to examine the impact of the PD learning experiences and implementation of the intervention on the teachers. The intervention and control teachers are compared on the self-report surveys completed at the conclusion of the intervention, taking into account their responses prior to the start of any PD. Classroom observations are informative regarding the nature of instruction over the course of the semester from the perspective of similarities and differences between the intervention and control groups as well as changes over the semester within groups. The relationship between the surveys and observations of practice provides information regarding the validity of the teachers’ self-reports of practices.
Research Question 1 concerns the impacts on students of participating in the intervention and is addressed through comparisons of postintervention performance on the EBA tasks, and comprehension of multiple texts as assessed by the GISA, taking into account pre-intervention performance.
Preliminary Analyses: Teacher Survey
The EFA of each administration of the teacher survey resulted in the removal of 15 items because their factor loadings were below .32 (Tabachnick & Fidell, 2007). Table 5 indicates the scales from which the items were removed as well as the reliabilities for each scale. EFAs were then rerun on the 56 remaining items. Appendix F, Table F1 in the online supplemental materials reports the number of items that loaded on each scale, the range of the factor loadings, and the variance explained by the scale for the pre and post administrations. In addition, EFAs indicated that five of the six scales that focus on teachers’ practices loaded on a single higher-order “teacher practice” factor. Factor loadings of the scales on this higher-order factor ranged from .63 to .86, explaining 51.3% of the variance for the pre score, and from .86 to .88, explaining 74.2% of the variance for the post score. Reliability estimates for the higher-order “teacher practice” factor were .83 for the pre and .93 for the post administration.
Preliminary Analyses: Classroom Observations
For purposes of contextualizing the meaning of the quantitative analyses of the rubric scores, qualitative descriptions of the intervention and the control teachers’ classrooms were derived from the field notes taken during observations. For each observation, summaries based on repeated readings were constructed for three aspects of instruction: (1) science topics and materials in use, (2) instructional and teacher activities, and (3) student activities. Rubric scores for each indicator within each construct (Appendix D in the online version of the journal) were submitted to EFA. Results indicated that factor loadings were within acceptable ranges (Tabachnick & Fidell, 2007) for each construct: The Time 1 range was .37 to .97; the Time 2 range was .69 to .97. Indicators within each construct explained 51.4% to 87.0% of the variance at Time 1 and 61.9% to 89.1% at Time 2. Estimates of internal consistency reliability (Cronbach’s alphas) ranged from .77 to .95 at Time 1 and .86 to .93 at Time 2. The factor loadings and estimates of internal consistency suggested that it was reasonable to calculate one mean rubric score for each construct for each time point. Details of the results of the factor analyses and reliability data are provided in Appendix F, Table F2 in the online version of the journal.
Preliminary Analyses: Science Epistemology Survey
EFAs of the epistemology survey showed two distinct factors that corresponded to the a priori 11-item Corroboration scale and the 7-item Complex/Uncertain scale. Factor loadings for the 11 items on the Corroboration scale ranged from .41 to .60 (Cronbach’s α = .80) for the pre scores and from .44 to .72 (Cronbach’s α = .84) for the post scores. Factor loadings for Complex/Uncertain ranged from .43 to .56 (Cronbach’s α = .70) for the pre scores and from .43 to .58 (Cronbach’s α = .72) for the post scores. Overall, the two subscales explained 27.73% of the variance for the pre data and 33.09% for the post data. Detailed results are available upon request.
Preliminary Analyses: Self-Efficacy Survey
EFAs on the Self-Efficacy scale indicated a single-factor solution. At pretest, factor loadings ranged from .63 to .76 (Cronbach’s α = .86) and explained 50.47% of the variance; at post, loadings ranged from .68 to .78 (Cronbach’s α = .87) and accounted for 54.15% of the variance.
Comparisons of Intervention and Control Teachers: Surveys
The mean scale scores of the teachers assigned to the intervention as compared with those of the control group were not significantly different prior to the initiation of PD for the intervention teachers. The descriptive statistics and t tests for these data are provided in Appendix G, Table G1 in the online version of the journal. In contrast, the posttest comparisons, provided in Table 9, indicate that the intervention teachers scored significantly higher than those in the control condition on higher-order teaching practices as well as on each of its components, with large effect sizes (1.34 < d < 2.00). Also, the intervention teachers indicated that they provided a variety of science reading opportunities more frequently than the control teachers reported doing so, also with a large effect size, d = 1.37. On attitude, self-efficacy, and teaching philosophy, the differences between the teacher groups were not statistically significant, although the intervention teachers’ means tended to be higher than those of the control. Cohen’s d effect sizes were small, ranging from 0.29 to 0.51.
Comparison of the Intervention and Control Teachers for Postintervention Scores on the Survey Scales

Note. Teaching Philosophy: Reading—This was reverse coded so that higher scores reflect beliefs more consistent with Project READI. One teacher in each group did not complete the postintervention survey, resulting in n = 23 in each condition. Cohen’s d = M2 −M1/√[(SD12+SD22)/2]; d values between 0.2 and 0.5 constitute a small effect, between 0.5 and 0.8 a medium effect, and 0.8 or greater a large effect. M = mean, SD = standard deviation.
Equal variance is not assumed (Levene’s test: F = 6.96, p = .011); independent-samples t test: t = 4.72, df (degrees of freedom) = 38.30.
Equal variance is not assumed (Levene’s test: F = 6.29, p = .016); independent-samples t test: t = 6.90, df = 36.14. cEqual variance is not assumed (Levene’s test: F = 4.78, p = .034); independent-samples t test: t = 4.60, df = 39.67.
Equal variance is not assumed (Levene’s test: F = 11.95, p = .001); independent-samples t test: t = 5.46, df = 34.68.
Equal variance is not assumed (Levene’s test: F = 8.21, p = .006); independent-samples t test: t = 6.37, df = 36.70.
*p < .001.
The multilevel modeling for the survey scales confirm this pattern. Specifically, the science reading opportunities scale accounted for 68.0% of the variance at the teacher level and 3.8% at the school level. The model for higher-order teacher practice accounted for 41.0% of the variance at the teacher level and 77.8% at the school level. The variance explained by the individual teacher practice scales that loaded on the higher-order factor ranged from 19.8% to 50.2% at the teacher level and from 53.5% to 82.3% at the school level. After controlling statistically for six school strata and pre- scores on the scales, there were significant treatment effects for these scales, with effect sizes ranging from 1.34 to 2.24, indicating large effects (Elliot & Sammons, 2004). These results are shown in the upper panel of Table 10. Of particular note is the effect size for students engaging in metacognitive inquiry.
Summary of Multilevel Results for Condition for Teacher Survey and Classroom Observations
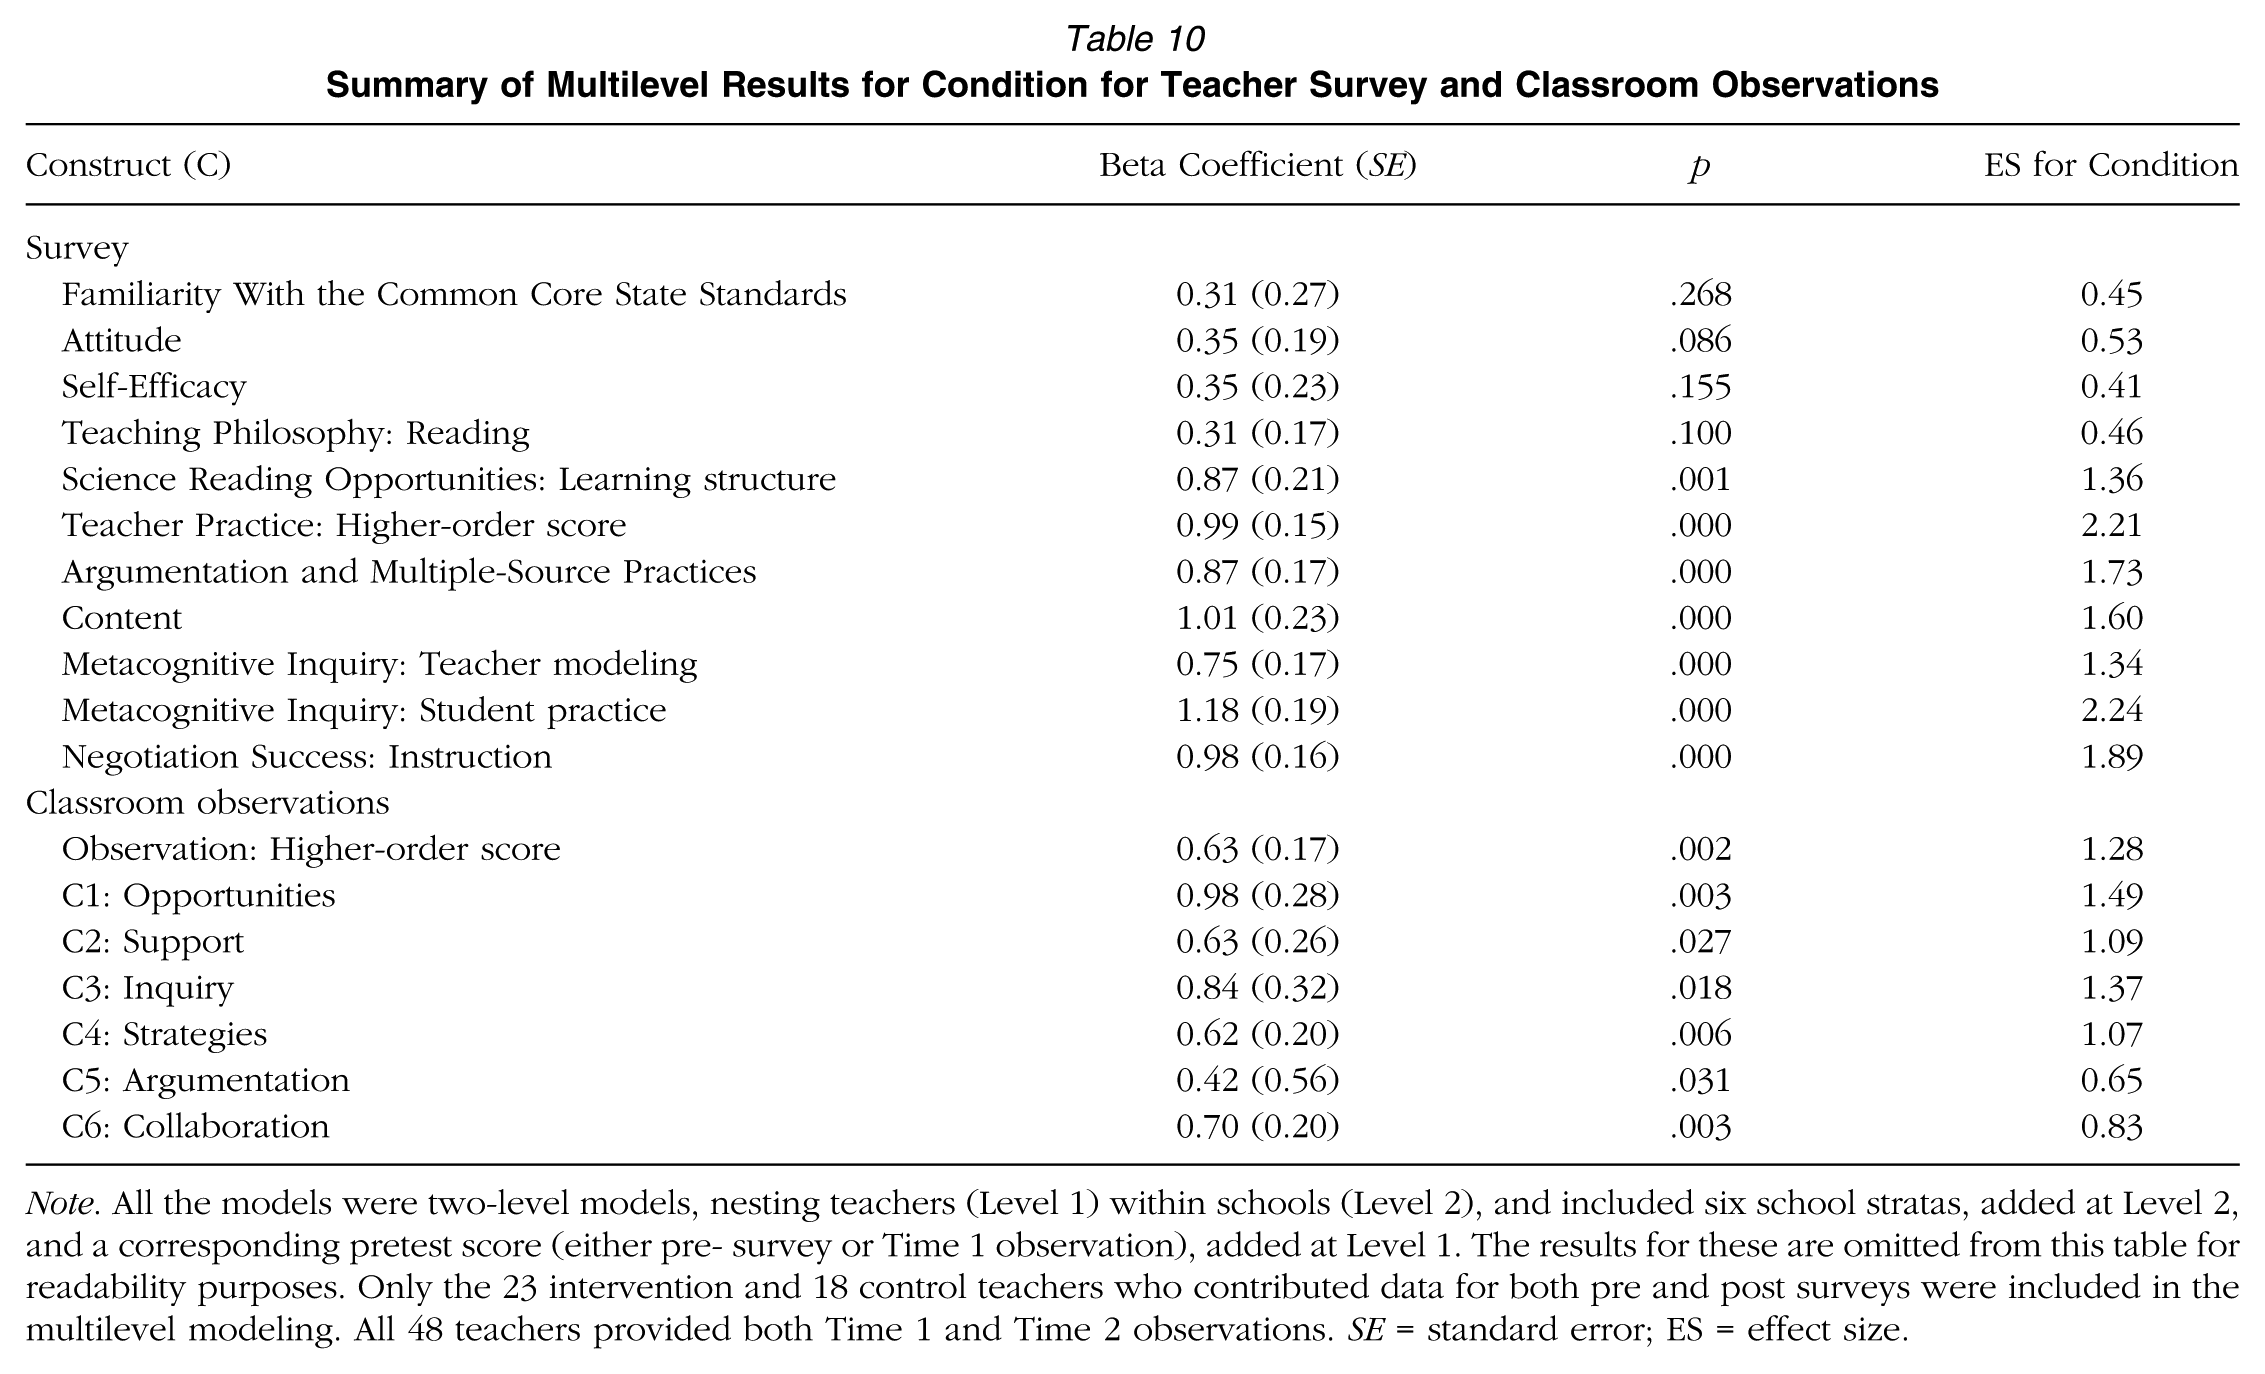
Note. All the models were two-level models, nesting teachers (Level 1) within schools (Level 2), and included six school stratas, added at Level 2, and a corresponding pretest score (either pre- survey or Time 1 observation), added at Level 1. The results for these are omitted from this table for readability purposes. Only the 23 intervention and 18 control teachers who contributed data for both pre and post surveys were included in the multilevel modeling. All 48 teachers provided both Time 1 and Time 2 observations. SE = standard error; ES = effect size.
Comparisons of Classroom Observations of the Intervention and Control Teachers: Descriptive Accounts
Topics and Materials in Use
During the Time 1 observations, 5 intervention teachers were implementing the Reading Science Models module; 5 were engaged in activities focused on cell structure and function using the Project READI recommended text sets, while 5 were using other texts; 7 teachers were engaged in implementing the Homeostasis module; 1 teacher was doing a lab about cell structure; and 1 teacher had students using the biology textbook to review for a quiz. At Time 2, most teachers (17) were implementing the MRSA module, but 2 were finishing the Homeostasis module. An additional 4 teachers were also working on evolution, although they were using materials outside of Project READI (e.g., WebQuest, labs, district curriculum texts). Finally, 1 teacher was reviewing material for the end of the semester biology exam.
Control teachers were using the materials they typically used in teaching ninth-grade biological sciences, such as text books, study guides, and PowerPoint presentations. At Time 1, 11 control teachers were engaged in activities about cell structure and function, 10 were focusing on ecology and ecosystems, 2 were working on writing lab reports using the scientific method, and 1 teacher was covering atomic structure. At Time 2, most teachers were engaged in activities around evolution and genetics (12) or ecology and ecosystems (9). Three teachers were focused on other topics: citing sources in research papers, a movie related to biochemistry, or completing an extra-credit assignment.
Instructional Activities
In the intervention classrooms, the predominant mode of classroom instruction was a mix of teacher-directed activity (setting up the activity of the day, modeling a think-aloud, introducing a new practice, such as building an explanatory model, etc.) and student collaborative activity (i.e., metacognitive conversations around text, peer review). This mix was present during both observations.
In the control classrooms, the predominant mode of observed classroom instruction at both Time 1 and Time 2 was teacher lecture and PowerPoint presentations. The lectures and PowerPoints were, for the most part, shortened versions of the biology textbook content. Typically, teachers read the content of the slides verbatim. As teachers presented the information, students were responsible for listening, taking notes, and completing study guides or worksheets. Teacher presentation was usually followed by a whole-class discussion that followed the traditional initiate-respond-evaluate monologic pattern, in which the teacher asks a question, calls on students until the desired response is provided, affirms the answer, and then moves on to the next question (Mehan, 1979; Wells, 1989). Partner talk and small discussion groups were observed in three teachers’ classrooms. Infrequently, students were directed to search online, using websites such WebQuest, TedTalk, and YouTube, for information on teacher-designated science topics.
Student Activities
The student activities observed in the intervention classrooms were similar during the two observations and reflected the use of Project READI–provided readers and student notebooks. As indicated in the description of the student intervention design, the texts in the module readers included multiple representations (verbal text, graphs, diagrams, etc.) and were used in service of inquiry around a driving question. Teachers supported students’ by modeling thinking aloud, reminding students about support tools (e.g., reading strategy charts and science talk stems), and engaging them in metacognitive thinking (e.g., What do I already know? What questions do I have?). At Time 2 compared with Time 1, there was greater emphasis on supporting students in activities using the information in the readers to construct models and evaluate them for coherence and completeness.
During both observations in the intervention classrooms, collaborative meaning making of text in pairs or small groups was the dominant participation structure. Whole-group discussion occurred after students had the opportunity to read and problem solve on their own. During reading time, teachers circulated among the pairs or small groups, listening and interjecting questions asking for elaboration (e.g., What else can you say about that? Why do you think that?), additional problem solving (e.g., How do you think you could figure that out?), or evaluation of the completeness or coherence of the explanatory model, the science phenomenon, or their own understanding. Finally, in the classrooms of two different intervention teachers, one at Time 1 and the other at Time 2, students were reading from their biology textbook to answer questions and fill out a study packet.
In the control classrooms, the observed student activities were similar during the two observations, although different from the student activities observed in the intervention classrooms. In the control classrooms, students were observed reading their science textbooks to complete activity sheets and lab reports. Occasionally, a student was asked to read aloud from the textbook or to read independently from teacher-prepared study packets that highlighted material the class needed to know. These included a variety of representational forms (e.g., verbal text, graphs, tables). With two exceptions, little to no teacher support of the reading was observed. That is, students were told to read independently or for homework but without supports or modeling of how to read and reason about the information. The exceptions were two teachers who had students annotating texts and who talked with students about comprehension monitoring. When reading assignments were evaluated, it was through completion of activity sheets.
Comparisons of Classroom Observations of the Intervention and Control Teachers: Observation Scores
At both Time 1 and Time 2, there were significant differences between the intervention and control teachers on all six constructs, with large effect sizes. Table 11 provides the means and independent-samples t tests, and effect sizes for the rubric scores for each of the six constructs at each of the time points (Time 1, upper panel; Time 2, lower panel). Consistent with the descriptive findings, the intervention teachers’ classrooms achieved higher score points than the control teachers’ on each construct. Furthermore, the differences between the two groups of teachers increased for the Time 2 observation. This is reflected in the larger effect sizes at Time 2 compared with Time 1. The differences at Time 1 are not surprising because the intervention teachers had had 9 days of PD prior to beginning the Fall 2014 semester. Thus, the Time 1 differences indicate that students in the intervention teachers’ classrooms were indeed experiencing instruction and opportunities to learn that were substantively different from what the control students were experiencing; these differences increased as the semester progressed.
Comparisons of the Mean Rubric Score Points on Classroom Practices Constructs (C) for the Intervention and Control Teachers, n = 24 per Group
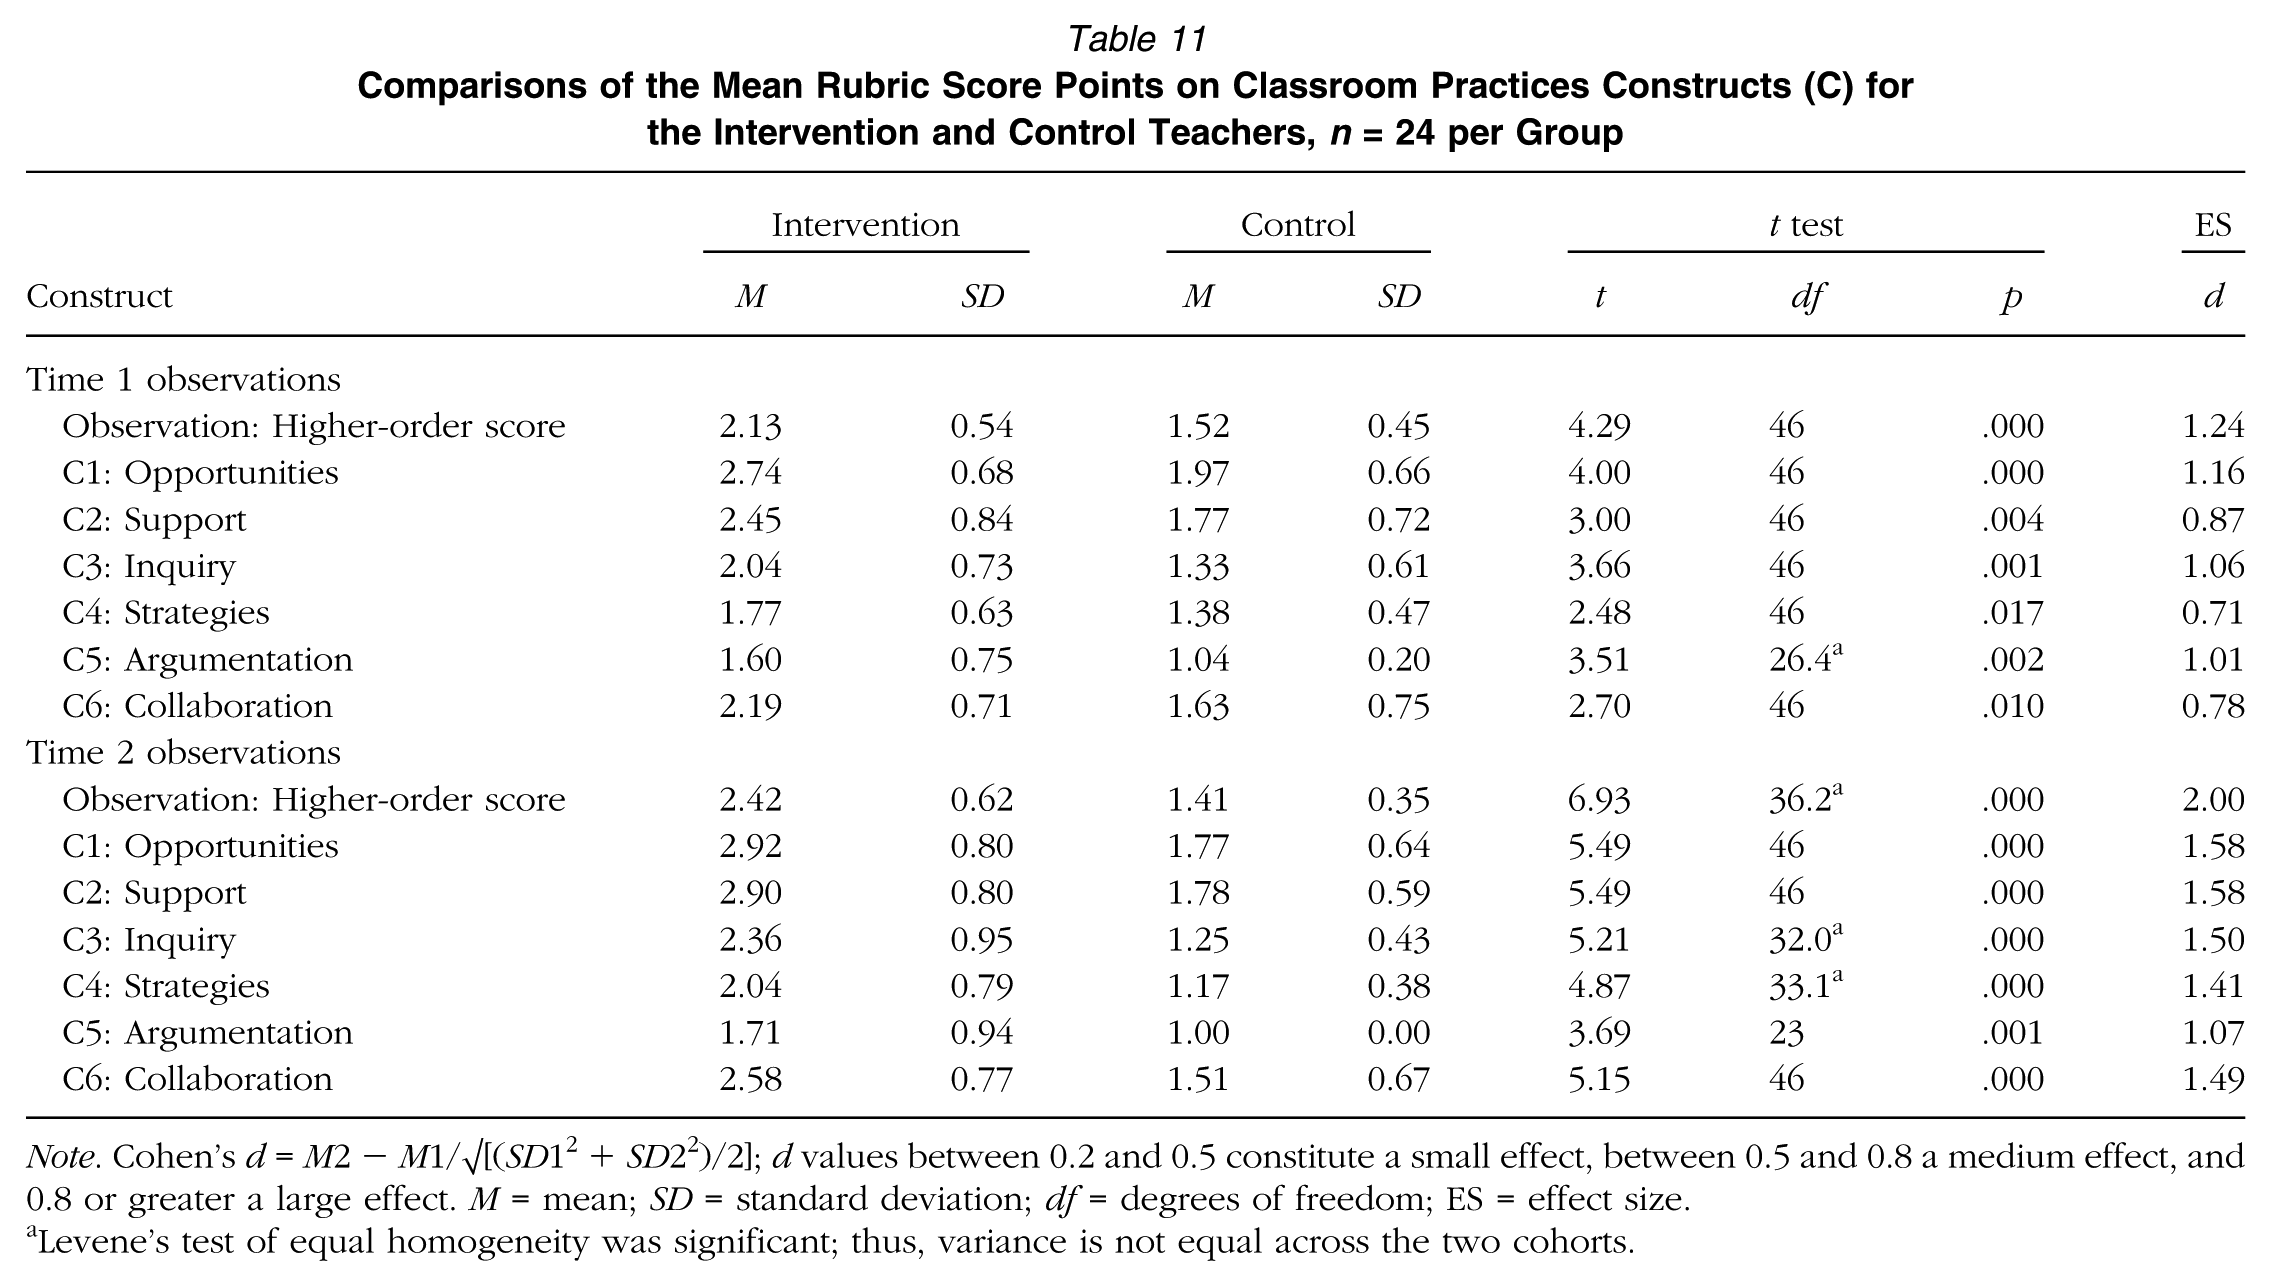
Note. Cohen’s d = M2 −M1/√[(SD12+SD22)/2]; d values between 0.2 and 0.5 constitute a small effect, between 0.5 and 0.8 a medium effect, and 0.8 or greater a large effect. M = mean; SD = standard deviation; df = degrees of freedom; ES = effect size.
Levene’s test of equal homogeneity was significant; thus, variance is not equal across the two cohorts.
Within-group analyses of the Time 1 and Time 2 scores, reported in Table 12, indicate increases on all constructs for the intervention teachers. The differences met conventional levels of statistical significance for two constructs, Construct 2: Support and Construct 6: Collaboration. For the control teachers, the scores on each construct trended lower at Time 2 than at Time 1, although no differences reached conventional levels of statistical significance.
Within-Group Comparisons of the Mean Rubric Score Points on Classroom Practices Constructs (C) at Time 1 and Time 2 Observations for the Intervention and Control Teachers
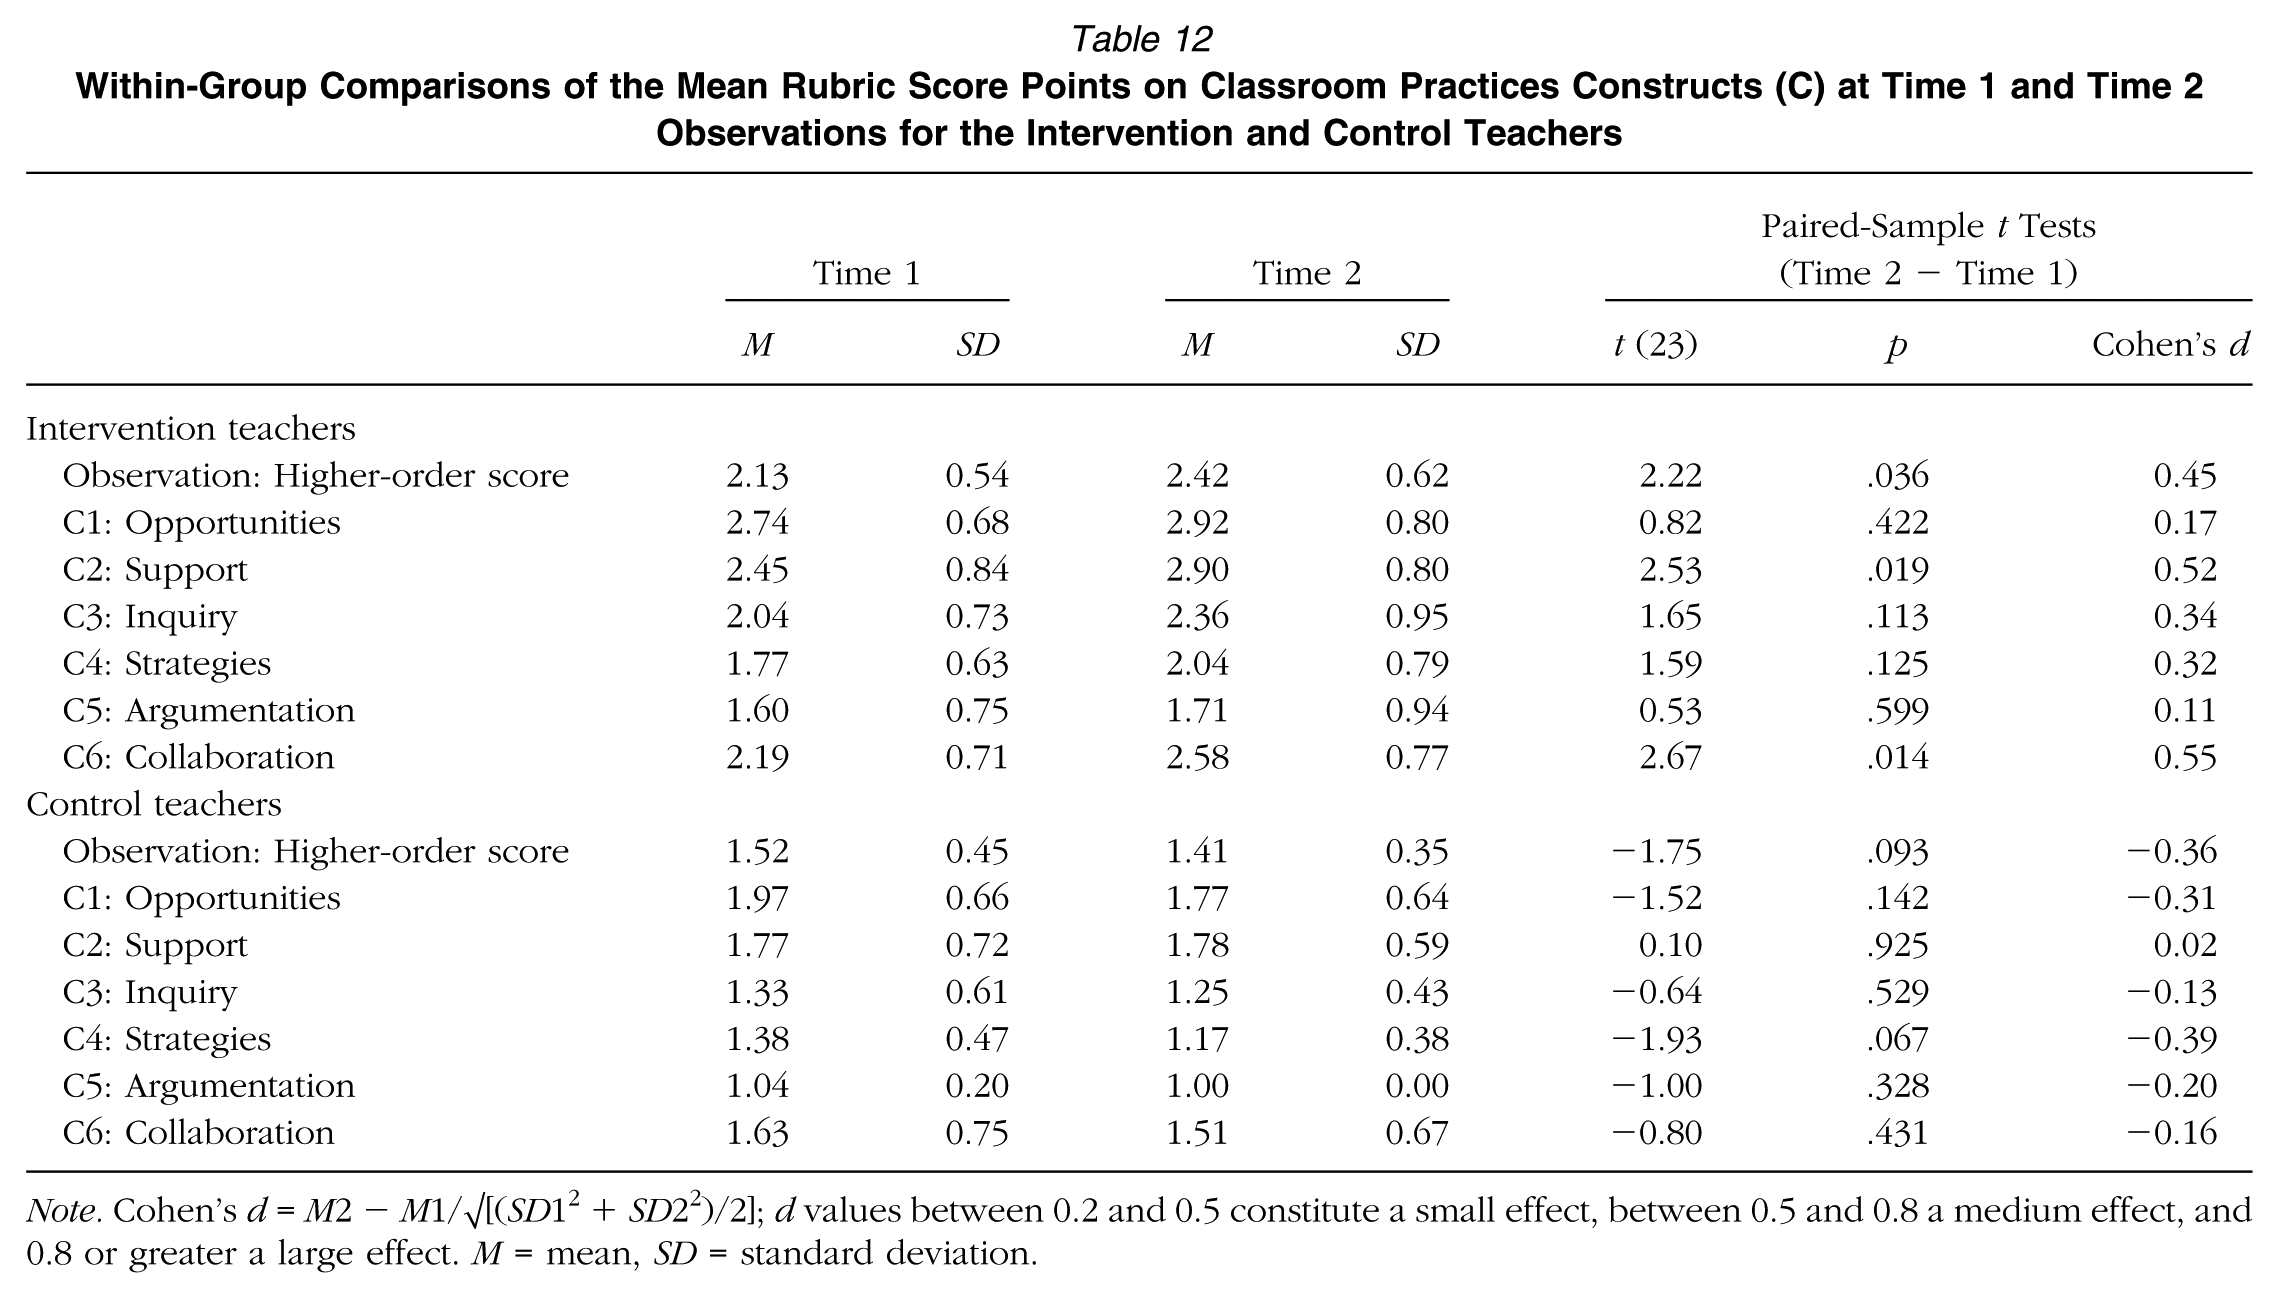
Note. Cohen’s d = M2 −M1/√[(SD12+SD22)/2]; d values between 0.2 and 0.5 constitute a small effect, between 0.5 and 0.8 a medium effect, and 0.8 or greater a large effect. M = mean, SD = standard deviation.
In the multilevel model, the higher-order observation rubric scores accounted for 48.8% of the variance at the teacher level and 84.0% at the school level. The model for the higher-order score yielded a significant treatment effect, indicating that these scores at Time 2 were significantly higher for the intervention as compared with control teachers (see Table 11, lower panel). The multilevel modeling results for each individual observation construct score also showed significant treatment effects, with beta coefficients ranging from .42 to .98, indicating medium to large effect sizes (range = 0.65 to 1.49). The largest effect size was for Construct 1: Science Reading Opportunities; the smallest was for Construct 5: Argumentation.
Relationships Between the Survey and Observation Data
To determine whether the self-report survey data were consistent with observed practices, we examined the relationships between individual teachers’ scores on the self-report higher-order teacher practices construct and the higher-order scores for the observation constructs. Figure 3 shows the scatterplots: Figure 3a shows the relationship between the survey completed prior to any PD (pre) and the Time 1 observations, which occurred between the 4th and 7th weeks of the intervention implementation; Figure 3b shows the relationship between the survey completed at the conclusion of the intervention and Time 2 observations, which occurred between the 12th and 17th weeks of the intervention implementation. What is noteworthy is that at Time 1, the intervention and control groups are indistinguishable in terms of how they are distributed across the two-dimensional space, yielding a nonsignificant Pearson r(41) = .17, p = .274. However, at Time 2, the scatterplot suggests a much more distinct separation between the two groups on both the self-report and the observation measures, providing an overall significant correlation, r(45) = .50, p < .001. These patterns indicate consistency between what the teachers reported they were doing in the classroom and what they were observed to be doing, providing evidence of the validity of the self-report responses. They also indicate movement on the part of the intervention teachers toward more Project READI–consistent practices and ways of talking about them.
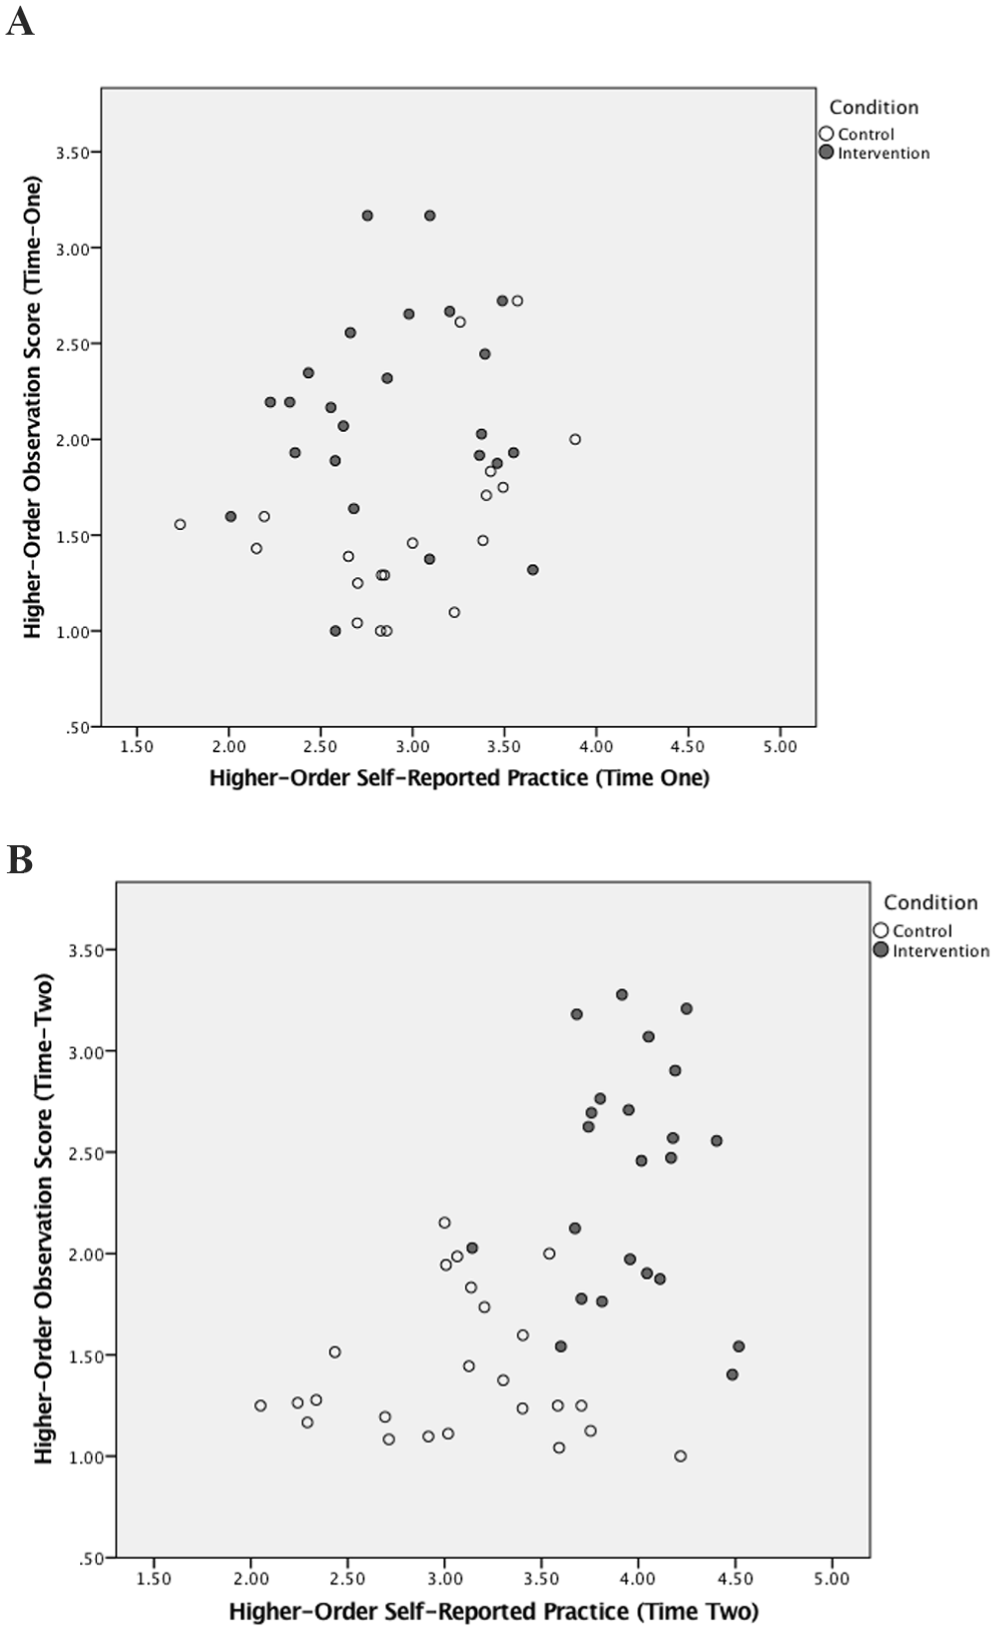
Scatterplots showing the relationship between self-reported practices and observed practices by condition.
Comparisons of the Intervention and Control Students: EBA Assessment
The descriptive statistics for the Multiple-Choice, Essay, Topic Prior Knowledge, Epistemology, and Self-Efficacy scales are provided in Table 13. With the exception of one scale (Complex/Uncertain), there were no significant differences in mean performance between the intervention and control groups before the intervention (upper panel). On the Complex/Uncertain scale, the control group scored significantly higher than the intervention group at the p = .03 level. Thus, with the exception of the single Epistemology scale, the randomization procedure resulted in groups that were performing at statistically equivalent levels on the MC and essay tasks as well as the self-report measures of topic prior knowledge, corroboration, and self-efficacy prior to the intervention.
Descriptive Statistics for EBA Assessment, Epistemology, Self-Efficacy, and Topic Prior Knowledge for the Intervention and Control Groups in the Pre- and Postintervention Administrations
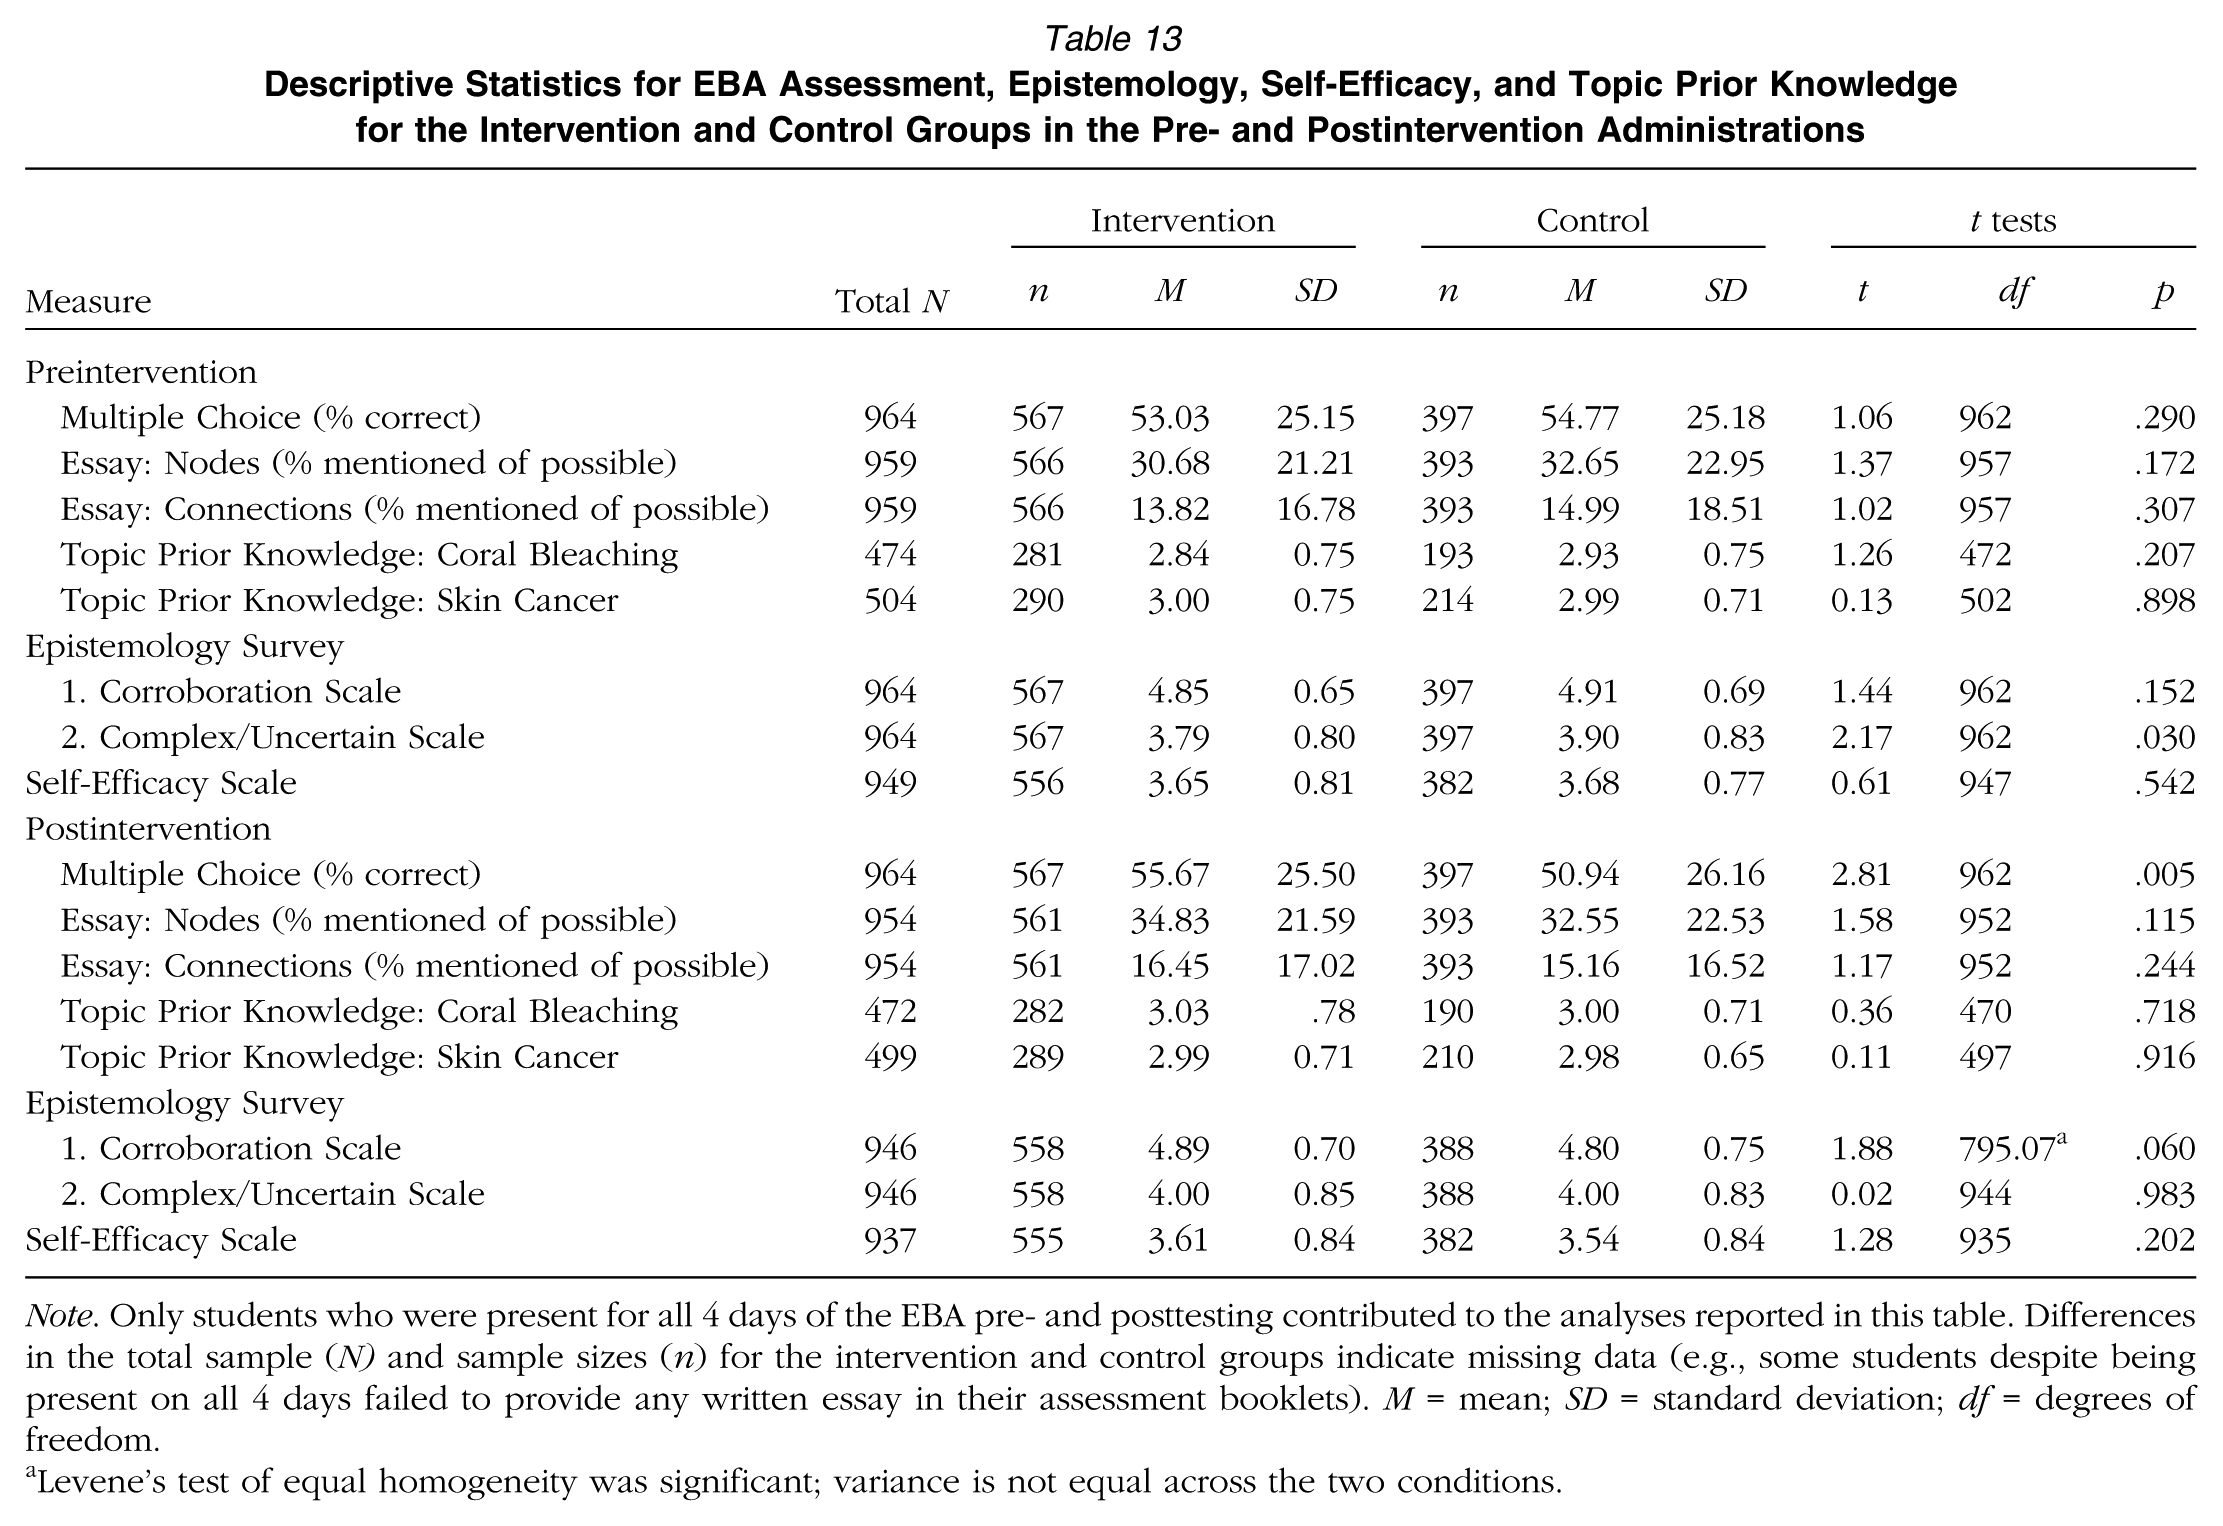
Note. Only students who were present for all 4 days of the EBA pre- and posttesting contributed to the analyses reported in this table. Differences in the total sample (N) and sample sizes (n) for the intervention and control groups indicate missing data (e.g., some students despite being present on all 4 days failed to provide any written essay in their assessment booklets). M = mean; SD = standard deviation; df = degrees of freedom.
Levene’s test of equal homogeneity was significant; variance is not equal across the two conditions.
Postintervention, the descriptives in the lower panel of Table 13 indicate significantly higher performance on the MC task for the intervention group (56% correct) compared with the control group (51% correct). On the essay task, the intervention group means were higher than those of the control, but the differences were not statistically significant. In addition, postintervention, there were no statistically significant differences between the intervention and control groups on the Topic Prior Knowledge, Epistemology, and Self-Efficacy scales. Note, however, that analyses of the overall main effect of topic and the interaction of topic and time of test were significant: Performance on the Skin Cancer topic was higher than on Coral Bleaching for both MC and essay measures. Thus, in conducting the multilevel modeling to evaluate the intervention’s effects, we statistically controlled for differences among students due to the testing time at which they had each topic.
Multilevel Modeling of Multiple Choice
The trimmed model for the MC performance postintervention, shown in Table 14, explained 18.18% of the student-level variance, 76.92% of the classroom-level variance, and 96.62% of the school-level variance. This model yielded a significant treatment condition effect (β = 5.71, p = .010, effect size = 0.26). In addition, and not surprisingly, performance on the MC task prior to the intervention was a significant predictor of performance postintervention, with a large effect size of 1.03. Also, pre-intervention scores on the Epistemology scales (Corroboration and Complex/Uncertain) were significant predictors of postintervention MC performance, indicating that students who held more sophisticated epistemological beliefs at the start of the school year scored higher on the postintervention MC measure. Finally, as anticipated based on the pilot data, whether students had the more difficult topic at pre versus post (indicated in the topic by multiple choice interaction term) significantly predicted postintervention performance. However, this interaction does not compromise the interpretation of the significant treatment effect because the same counterbalancing scheme was used in the intervention and control classrooms. Thus, taking into account individual differences prior to the intervention, students in the intervention condition performed significantly better than those in the control condition on the MC task.
Effects of Treatment Condition on Multiple-Choice Posttest Performance

Note. These multilevel models reflect students nested within classrooms, nested within schools. Because there were no predictor variables at Level 2 = classroom, this level is not displayed in the table. df = degrees of freedom; SE = standard error; SD = standard deviation; ES = effect size.
Effect size for dichotomous variables = β1/σ. Effect size for continuous variables = β1 × 2SDiv/σ. These effect sizes are interpreted as Cohen’s d, with d = 0.2 being a small effect, d = 0.5 a medium effect, and d≥ 0.8 a large effect.
Multilevel Modeling of Essay Performance
The results of the trimmed model for the concept nodes are provided in the upper panel of Table 15 and for connections in the lower panel. The final model for nodes accounted for 21.56% of the variance at the student level, 48.77% of the variance at the classroom level, and 99.92% of the variance at the school level. The trimmed model for connections accounted for 7.04% of the variance at the student level, 39.6% at the classroom level, and 99.99% at the school level. Treatment condition did not significantly predict postintervention performance on either node or connection inclusion in the essay. This is consistent with the nonsignificant differences in the means for the two groups (Table 15). Individual differences at pretest associated with topic prior knowledge, the Corroboration Epistemology scale, and the Self-Efficacy scale were significant predictors of the inclusion of concept nodes in the essays, along with pretest performance on this outcome measure. We found a similar pattern with the connections that were included in the essays: a nonsignificant condition effect and the same variables entering as significant predictors among the survey scales completed at the beginning of the semester.
Effects of Treatment Condition on Essay Performance
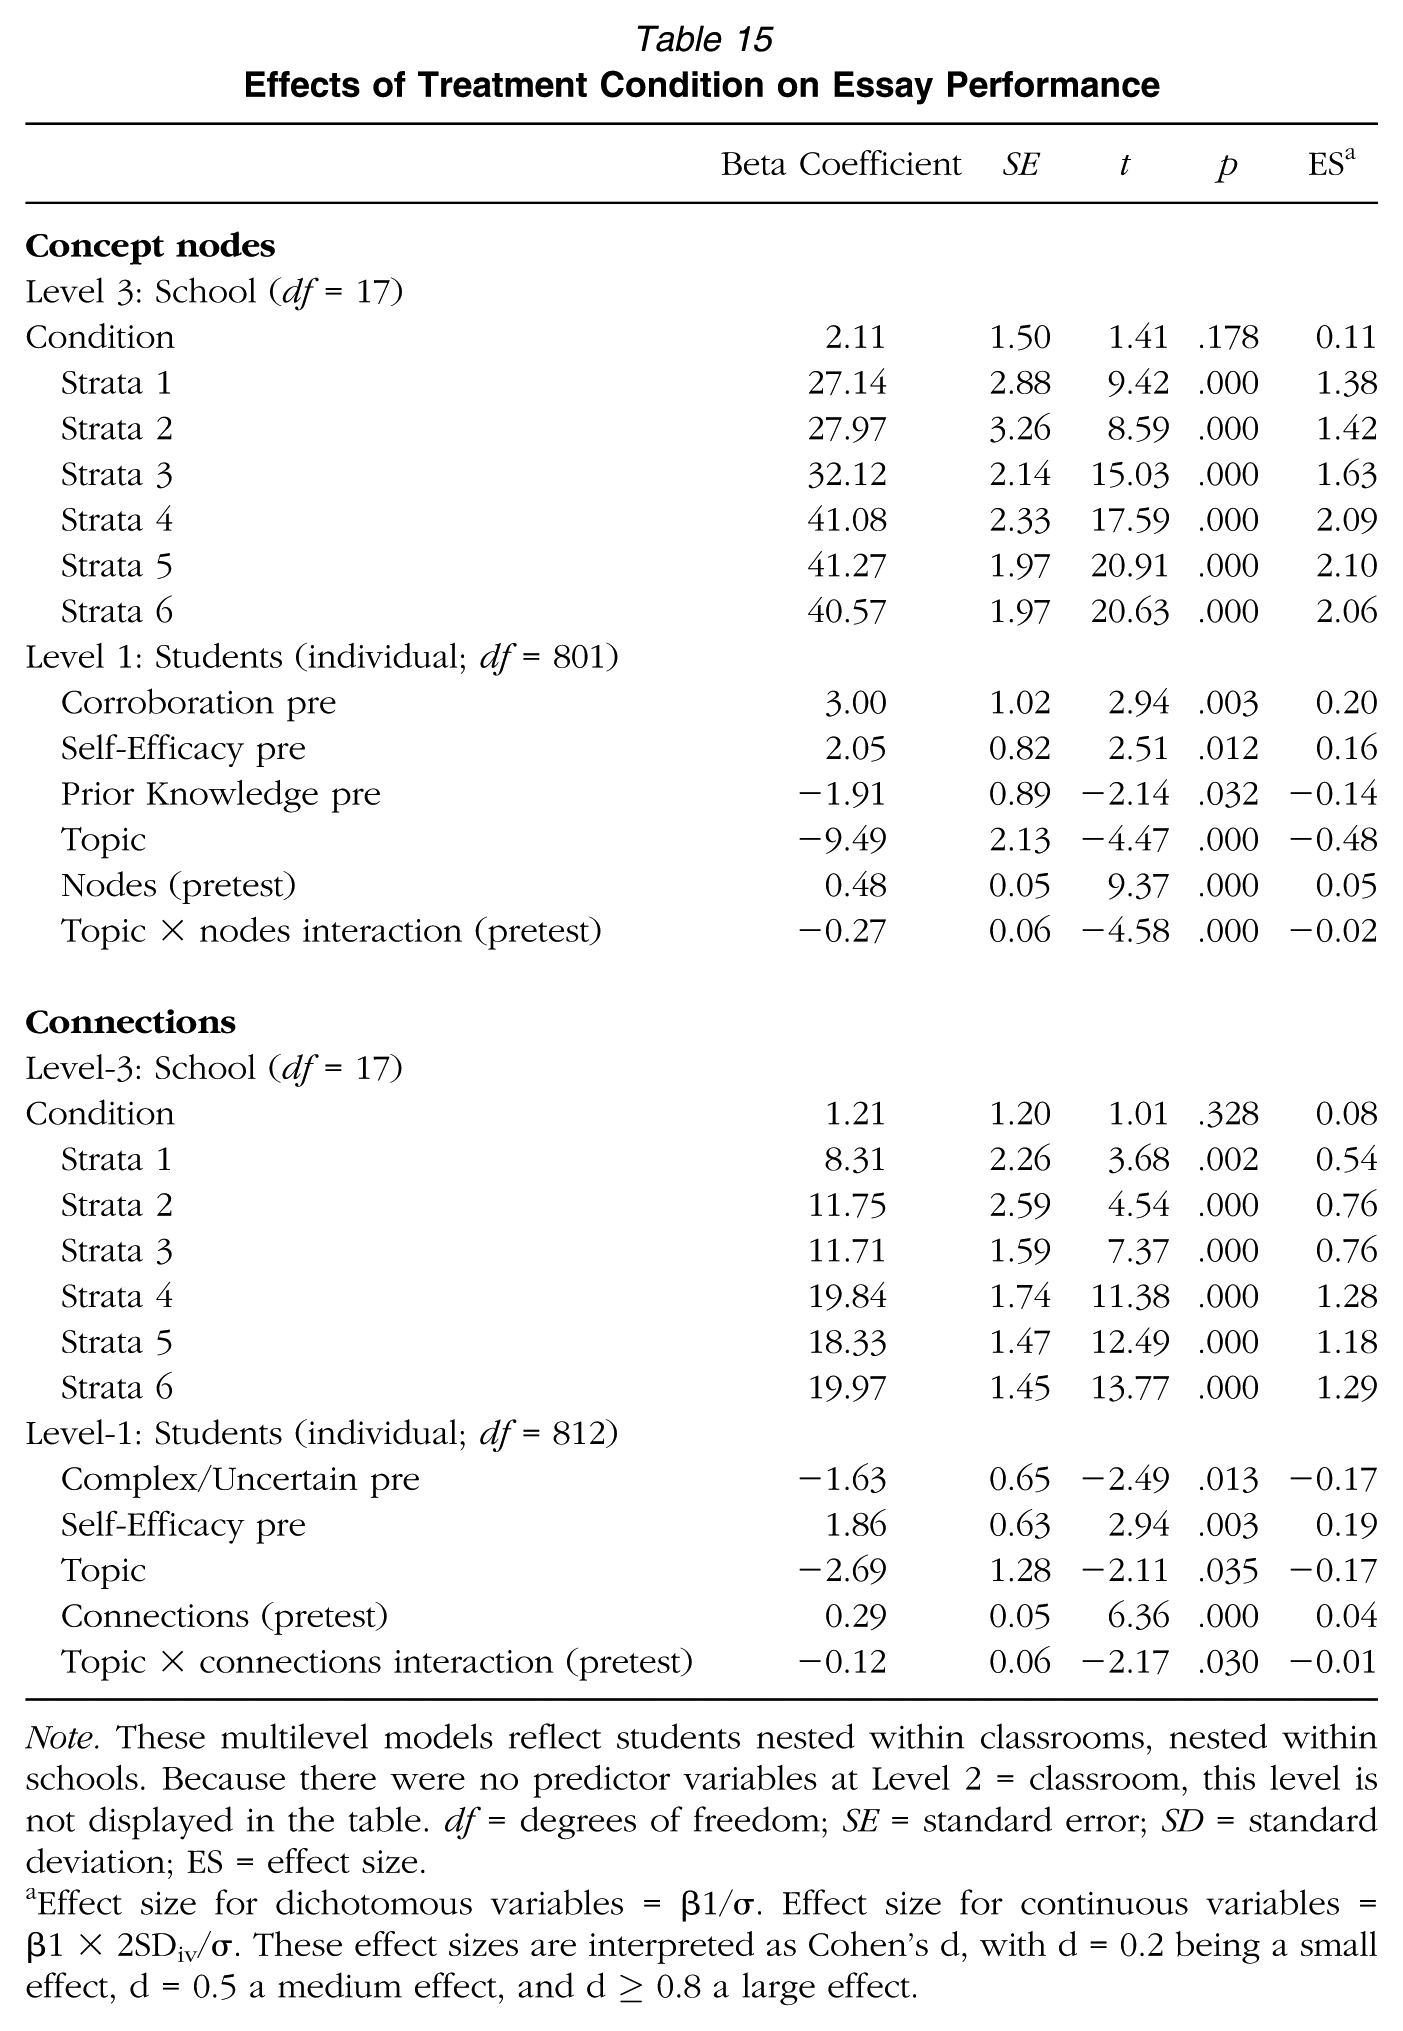
Note. These multilevel models reflect students nested within classrooms, nested within schools. Because there were no predictor variables at Level 2 = classroom, this level is not displayed in the table. df = degrees of freedom; SE = standard error; SD = standard deviation; ES = effect size.
Effect size for dichotomous variables = β1/σ. Effect size for continuous variables = β1 × 2SDiv/σ. These effect sizes are interpreted as Cohen’s d, with d = 0.2 being a small effect, d = 0.5 a medium effect, and d ≥ 0.8 a large effect.
Comparisons of the Intervention and Control Students on Multiple-Text Comprehension: GISA
Descriptive statistics for percent correct of the total items on the GISA indicated higher performance for the intervention group (M = 59.60, SD = 16.24, n = 519) compared with the control group (M = 56.38, SD = 17.22, n = 333). The multilevel model that was used to test for the significance of the treatment effect on GISA performance controlled for six strata and included the RISE assessment and the pre-intervention scores on the two Epistemology scales and the Self-Efficacy scale. Note that on the RISE, there were no statistically significant differences between the intervention (M = 272.48, SD = 13.27, N = 507) and control (M = 271.42, SD = 14.09, N = 388) groups at the beginning of the school year. The results of the modeling (Table 16) showed that treatment condition emerged significant (β = 4.41, p = .038, effect size = 0.32), with the intervention students scoring higher on the GISA than the control students.
Effects of Treatment Condition on Comprehension of Multiple Texts: GISA
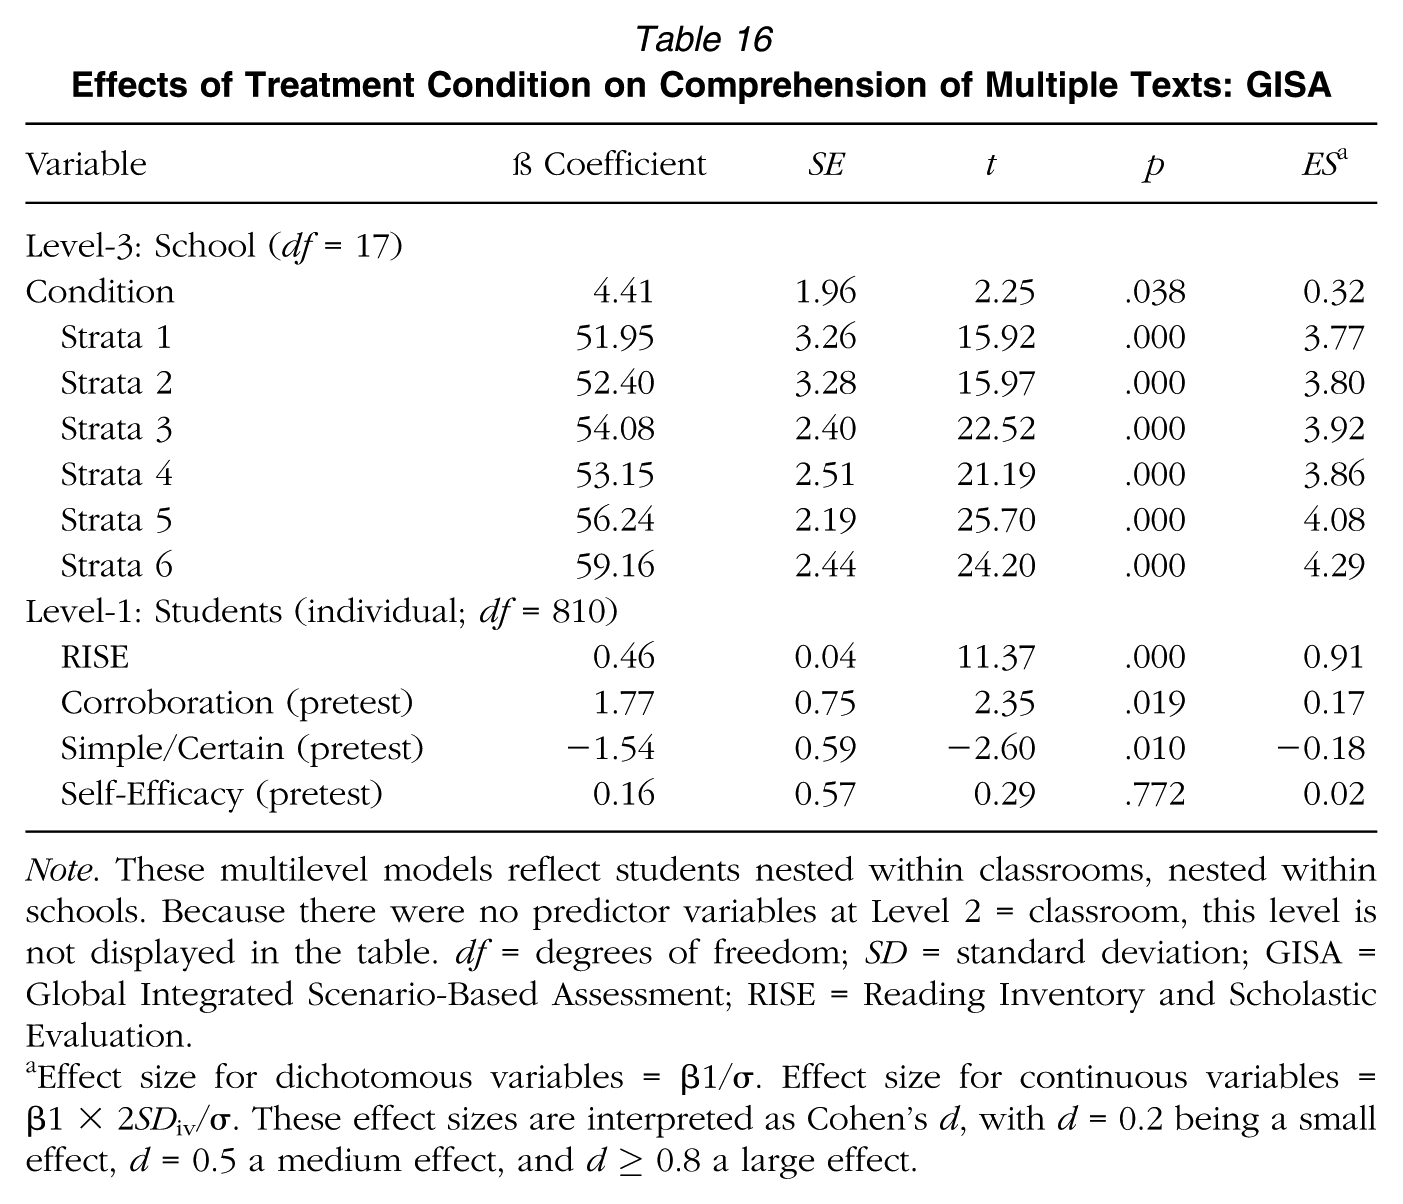
Note. These multilevel models reflect students nested within classrooms, nested within schools. Because there were no predictor variables at Level 2 = classroom, this level is not displayed in the table. df = degrees of freedom; SD = standard deviation; GISA = Global Integrated Scenario-Based Assessment; RISE = Reading Inventory and Scholastic Evaluation.
Effect size for dichotomous variables = β1/σ. Effect size for continuous variables = β1 × 2SDiv/σ. These effect sizes are interpreted as Cohen’s d, with d = 0.2 being a small effect, d = 0.5 a medium effect, and d≥ 0.8 a large effect.
Discussion
The findings of the present study indicate that participating in the intervention impacted teachers’ practices and student performance in ways consistent with the Project READI approach and the goals of the designed intervention.
Impact on the Students
With respect to students, comparisons of those in intervention classrooms with those in control classrooms indicated significantly higher performance in the comprehension of science information from multiple texts. That is, there were significant differences favoring the intervention group on the MC task of the EBA assessment and the GISA assessment of comprehension. Performance on these assessments required students to read and reason about biological science topics (e.g., skin cancer) that had not been part of the curriculum for either group of students. Thus, the results indicate that students in the intervention classrooms were better equipped than those in the control classrooms to tackle new material. The magnitude of the effect sizes qualifies as small from a statistical point of view (0.26 for the MC task and 0.32 for the GISA). From a practical point of view, the estimate of the magnitude of change associated with 1 year of reading growth at the high school level is 0.19 (Hill, Bloom, Black, & Lipsey, 2008). Thus, the effect sizes suggest that the intervention students were about 1.5 years ahead of the control students after participating in the intervention.
On the other hand, the intervention students’ inclusion of concepts and connections in the written essay task were not significantly different from that of control students. We attribute this to insufficient instructional time and support for students to master the rhetorical forms and language structures needed to express explanatory models in written verbal text or visuals. Instructional time was devoted to the oral discourse of science argument, that is, to talking about explanatory models in small- and whole-class discussions. However, more support may have been needed to move from such socially supported oral discourse exchanges to independently constructed written explanations. Similarly, lack of sufficient opportunities to critique models was likely responsible for the failure to find treatment effects on the peer essay evaluation and graphic model comparison tasks. The model and peer essay evaluation tasks required that students invoke evaluative criteria for models and written explanations of models. Although these learning goals were introduced during the semester, limited instructional time was devoted to them.
Overall, the EBA assessment results suggest that the impact on the intervention students was greatest for those learning goals and science practices they had worked on iteratively over the four learning phases (Table 5): close reading of a variety of the representational forms of science information for the purpose of understanding key content ideas and how they might be synthesized and connected to make evidence-supported explanatory claims. However, students appear to have needed additional instruction, support, and opportunities to express their ideas in independently produced written essays and to develop criteria and language frames for writing critiques of representations produced by others. These findings are consistent with prior research regarding the critical need and importance of providing writing instruction and scaffolds that make the rhetorical forms of science communication explicit to students (Akkus, Gunel, & Hand, 2007; Hand, Wallace, & Yang, 2004).
The significant treatment effects on the MC EBA task and the GISA were obtained after taking into account preexisting differences among the students on individual variables known to affect comprehension performance, including prior knowledge of the topic (Alexander, 2003;), epistemological orientations to the topic (e.g., Ferguson & Bråten, 2013; Kienhues, Ferguson, & Stahl, 2016), self-confidence in reading (e.g., Guthrie et al., 1996), and, not surprisingly, performance on the outcome task prior to any intervention (e.g., the MC pre-intervention performance). It is hardly surprising to find that students who were better at this task prior to the intervention continued to be better postintervention, indicating that the treatment did not significantly disrupt the “rank ordering,” so to speak, among the students. This does not, however, mitigate the significance of the treatment condition effect; it added value over and above that predicted by performance levels pre intervention.
The RISE test of basic reading skills emerged as a significant predictor of multiple-text comprehension as assessed on the GISA. This finding is consistent with the conceptual model of single- and multiple-text reading and reasoning processes that served as the basis of the learning goals of Project READI in science. Students with stronger basic skills on the RISE performed at higher levels on the GISA. The significant treatment effect on the GISA after controlling for basic reading skills indicates that the intervention enhanced performance in multiple-text comprehension beyond what typical instruction is predicted to produce.
The predictive relationships between the pre- and postinterventions for both the highly and less aligned assessments of comprehension from multiple texts indicate that, not surprisingly, it does matter where students start. More importantly, these relationships indicate that the intervention’s impact is robust enough to “survive” (have a positive impact on performance) despite the individual differences in starting points. We speculate that the positive impact of the intervention was related to the ways in which the teachers adapted the Project READI approach and materials to the range of students they were teaching. Systematic investigation of these adaptations was beyond the scope of the present study but is clearly an area in need of further study.
Although there was little change within groups from pre to post intervention and no significant differences between groups on the Epistemology or the Self-Efficacy scales at post, the Epistemology scale pre-intervention ratings did emerge as significant predictors in the multilevel modeling of the postintervention MC task and of GISA performance. Furthermore, the Corroboration scale at pre was a significant predictor of the inclusion of concepts and connections for the essay task. Essentially, these findings suggest that performance on the postintervention outcome measures was higher for those students who began the semester holding more sophisticated beliefs about the nature of science (Complex/Uncertain scale) and/or more strongly in agreement with the need to cross-validate information and data when constructing explanations of science phenomena (Corroboration scale). These findings are consistent with prior research that has found significant relationships between epistemic beliefs about a domain or topic and performance on a variety of multiple-text comprehension tasks (e.g., Ferguson & Brâten, 2013; Strømsø et al., 2008).
Impact on the Teachers
The significant changes in the constructs on the self-report survey and the observation protocol indicate that the intervention teachers did in fact change their instructional practices over the course of the PD and the intervention. Classroom observations validated the self-reports of the intervention and control teachers and support the claim that over the course of the intervention, observable practices and instructional routines in Intervention teacher classrooms were more aligned with those central to the Project READI approach than they were at the beginning of the semester. These findings lend credence to the theory of change that guided the study’s overall design. Specifically, we posited that teachers determine what students have opportunities to learn. Students in the intervention classrooms were experiencing instruction that was different from that in control classrooms, while at the same time all the teachers were adhering to similar within-district mandates on topic coverage.
The relationships between the higher-order observation practices construct and the higher-order self-reported practices construct shown in the scatterplots (Figure 3) indicate that prior to the PD for the intervention teachers, teachers who were assigned to the intervention condition were indistinguishable from those teachers assigned to the control condition. In contrast, the scatterplot based on the postintervention surveys and Time 2 observations suggests movement toward two distinct samples of teachers. At the same time, we note the lack of significant differences in attitude, self-efficacy, and teaching philosophy between the intervention and control teachers on the pre- and postintervention surveys. A plausible explanation for this lack of differences is that the study’s time frame was simply insufficient to impact these perspectives. There is quite a bit of debate in the research literature on teacher change regarding the relationships between changes in instructional practices and shifts in beliefs, attitudes, or perspectives about effective practices and one’s ability to execute such practices (e.g., Berliner, 2001; Borko & Putnam, 1996; Hammerness et al., 2005; Pajares, 1992). The present study suggests that changes in practice may be visible prior to evidence garnered through surveys about changes in attitudes and beliefs.
Nevertheless, the self-report surveys and classroom observations indicate that the intervention teachers shifted their practice to be more aligned with the Project READI approach and its emphasis on socially supported reading, reasoning, and argument based on information presented in multiple information resources. Further, as posited in our theory of action, these differences in instruction aligned with the intervention students’ performance on the assessments. That is, instruction over the intervention semester provided iterative opportunities for students to deepen their mastery of the first three learning goals: (1) close reading, with metacognitive awareness; (2) analysis and synthesis of information across multiple information resources, and (3) constructing arguments to explain phenomena. The later modules in the intervention added to these three by introducing justification and critique of explanatory models. However, the students had comparatively fewer opportunities to engage in the reading and reasoning processes of justification and critique.
Implications: Classrooms as Complex Systems
One rather unexpected finding that emerged in the course of carrying out the multilevel modeling supports a conception of classroom learning as constituting a complex system. Specifically, the multilevel modeling of student performance indicated that more variance in outcomes was associated with the classroom level of clustering than with the teacher level. This finding suggests that the types of changes in instructional practices called for by the Project READI approach require changes in the classroom culture—in the expectations, responsibilities, and ways of participating in the teaching and learning process for both teachers and students. That is, teachers and students constitute a sense-making system the processes of which are dynamic and interactive, with products or results that vary far more widely than those in teacher-directed classrooms. Sense making proceeds through grappling with ideas—independently, peer to peer, among peers with and without teacher input. Talk plays a central role in such classrooms, but it must be productive talk for building knowledge and engaging in knowledge generation (e.g., Engle & Conant, 2002; Michaels & O’Connor, 2017; Resnick, Asterhan, & Clarke, 2015). Such activity depends on the existence of a classroom community that values and respects what students and teachers bring and contribute to the learning environment. Processes and outcomes emerge through such interactions and over time (see Jacobson & Wilensky, 2006; Yoon, Anderson et al., 2017).
An important property of complex systems that is the unexpected occurs and not infrequently. Adaptive systems respond to the unexpected in ways that are productive for the system’s functioning, taking the state of the system into account. Seeing classrooms from a complex-systems perspective is consistent with claims that have been made that teachers need adaptive rather than routine expertise (Darling-Hammond & Bransford, 2005; Hatano & Inagaki, 2003). This is so precisely because they are attempting “in the moment” to be responsive to the unanticipated in ways that move learning in productive directions and maintain student involvement and agency. This requires flexibility in guiding learning that goes well beyond the skilled execution of instructional procedures and strategies. To support the development of adaptive expertise in teachers, we need to better articulate what teachers need to know (e.g., knowledge of the discipline, how students learn the discipline, how to engage students in productive discussions) and how they come to know it (Grossman, Hammerness, & McDonald, 2009; Lampert, 2010).
Limitations and Future Studies
Any study has limitations. In the present study, some limitations are related to the requirements of conducting an RCT. As discussed in the conceptual framework for the PD, the design of the intervention teachers’ PD experience reflected a compromise between what the empirical literature indicates are important characteristics of effective PD and the requirement of RCTs that the participating teachers be randomly assigned to treatment conditions. That is, the intervention teachers in this study were teaching with the Project READI approach for the first time, but the approach calls for significant shifts in the positioning of texts, tasks, students’ roles as agentive learners in the classroom, as well as teachers’ roles as facilitators of learning. Other research indicates that to make such shifts in practice, it typically takes multiple iterations during which teachers try out new practices, reflect on “how it went,” and revise for subsequent classroom iterations (Penuel, Fishman, Cheng, & Sabelli, 2011; Penuel, Fishman, Yamaguchi, & Gallagher, 2007; Yoon, Anderson, et al., 2017). In-classroom coaching supplementing “out of the classroom” PD experiences as well as opportunities to reflect and revise with colleagues can facilitate adaptive shifts in practice (Cochran-Smith & Lytle, 1999; Darling-Hammond & McLaughlin, 1995).
The model of PD that we enacted in the work leading up to the study reported here, especially the collaborative design teams and the work in the teacher networks (Strands 2 and 4), incorporated these features of effective PD. Over 3 to 4 years, we saw evidence of shifts in practice and the emergence of the teachers’ generative capacity with respect to instructional routines and modules. That is, after two or three iterations of a module, the teachers showed evidence of adaptive integration of the “first principles” of the Project READI approach into their specific instructional contexts (e.g., Cribb, Maglio & Greenleaf, 2018; Greenleaf & Brown, 2018; Greenleaf, Litman, & Marple, 2018; Shanahan et al., 2016). However, as we have described, the 1-year time frame of the present study and the need to randomly assign teachers to condition prior to any PD meant that the intervention was tested under conditions of first-time implementation by the intervention teachers. Also, due to the sample sizes that were needed to conduct the multilevel modeling, there were insufficient resources to provide in-classroom coaching or more than 2 days of PD during the intervention’s implementation.
A second limitation is the single-semester time frame of the instruction in which the students participated. As noted, the intervention did not devote sufficient time to supporting students’ written expression of their thinking about phenomena in the biological sciences. Emphasis was on reading and reasoning from the multiple types of information sources in which biology information is conveyed and on sense making through discussion, often for the purpose of constructing explanatory models of various biological phenomena. Although the students did construct various types of visual models and present them orally to their peers, they were infrequently asked to write out verbal descriptions. Further work is needed here.
Time constraints also curtailed going beyond surface-level considerations of justification and critique of models, in terms of revising either one’s own model or someone else’s. An important consideration in advancing these practices are occasions in which new evidence does not “fit” the working model and leads to processes of revision as well as replication, two core features science knowledge (Asterhan & Schwarz, 2009; Mendonça & Justi, 2013; Rinehart, Duncan, Chinn, Atkins, & DiBenedetti, 2016). Just as the instructional model was new to the teachers, it was new to the students. Accordingly, the first 6 weeks of instruction were typically devoted to establishing reading and sense-making routines for engaging with texts. We speculate that had the students been well versed in these routines based on prior instructional experiences, further progress would have been made on critique and justification of models. Future studies are needed to look at results for students engaged in such practices of science over multiple years.
Finally, the intervention engaged students in “doing school” differently, asking them to take on greater responsibility as well as agency in their own learning. In hindsight, it is clear that the student perspective on this intervention is absent. Interviews with the students to ascertain their perspectives, in terms of what they were learning and how they were learning it, would have been very informative.
Conclusions
Despite the short duration of the Project READI PD, the first-time implementation, and the absence of in-classroom coaching, at the end of the intervention implementation, the participating teachers reported practices significantly more aligned with those called for in the Project READI approach when compared with their own ratings at the start of the PD and in comparison with the control teachers.
Thus, the present study demonstrates that significant shifts in practice can be visible and have an impact on students’ learning even within a 1-year time frame, as in this RCT. We caution, however, that teachers and students in Project READI were just getting started with this type of instruction and learning. Additional opportunities for PD and classroom experiences are needed for teachers and students to more firmly establish these practices.
The positioning of this RCT of the Project READI approach in biological sciences was necessitated by the need to recruit a sufficient sample size of schools and teachers to achieve sufficient power to detect an effect. As noted, across Grades 6 to 12, and across history, literary reading/literature, and the various sciences, ninth-grade biological sciences was the only grade level and subject area where this was possible. However, this resulted in a semester-long curriculum that engaged students in sense making from text. This sense making involved students in the range of practices specified in the NGSS, including asking questions, developing models, interpreting data, constructing explanations, and arguing from evidence, as well as the science literacy practices specifically discussed as Practice 8 in the NGSS: “Obtaining, evaluating and communicating information” (NGSS Lead States, 2013).
The present study demonstrates that when engaging in authentic scientific work, science literacies are integral to all seven practices (e.g., Bricker, Bell, van Horne, & Clark, 2017). Furthermore, the present study provides evidence of the efficacy of text-based investigations in promoting sense making with multiple forms of text in service of inquiry to develop explanations and argue for their viability, practices that involve students in nearly all of the NGSS practices. There are many topics and phenomena in the sciences where it is simply not feasible, and in some cases not possible, for students to engage directly with the phenomenon. Disciplinary reading (and writing) processes are critical to reasoning with, interpreting, and producing the multiple representational forms manifest in the practices and epistemology of science. The text-based investigations designed and studied by Project READI are an example of NGSS implementation, one that simultaneously builds students’ capacity to read for understanding in science.
Supplemental Material
AERJ812742_AppendicesA_GOnlineSupplement12_05_18 – Supplemental material for Explanatory Modeling in Science Through Text-Based Investigation: Testing the Efficacy of the Project READI Intervention Approach
Supplemental material, AERJ812742_AppendicesA_GOnlineSupplement12_05_18 for Explanatory Modeling in Science Through Text-Based Investigation: Testing the Efficacy of the Project READI Intervention Approach by Susan R. Goldman, Cynthia Greenleaf, Mariya Yukhymenko-Lescroart, Willard Brown, Mon-Lin Monica Ko, Julia M. Emig, MariAnne George, Patricia Wallace, Dylan Blaum and M. Anne Britt in American Educational Research Journal
Footnotes
Authors
Project READI: Kimberly Lawless, University of Illinois at Chicago; James Pellegrino, University of Illinois at Chicago; Gayle Cribb, WestEd, Strategic Literacy Initiative; Thomas Hanson, WestEd, Strategic Literacy Initiative; Katie James, University of Illinois at Chicago; Candice Burkett, University of Illinois at Chicago; Angela Fortune, University of Illinois at Chicago; Cindy Litman, WestEd, Strategic Literacy Initiative; Stacy Marple, WestEd, Strategic Literacy Initiative; and Ashley Ballard, University of Illinois at Chicago.
Notes
S
C
M
W
M
J
M
P
D
M. A
References
Supplementary Material
Please find the following supplemental material available below.
For Open Access articles published under a Creative Commons License, all supplemental material carries the same license as the article it is associated with.
For non-Open Access articles published, all supplemental material carries a non-exclusive license, and permission requests for re-use of supplemental material or any part of supplemental material shall be sent directly to the copyright owner as specified in the copyright notice associated with the article.