



Abstract
Accountability pressures and the Common Core State Standards for Mathematics have created complex demands for educators, especially early-career teachers (ECTs). Analyzing longitudinal data, including the social networks of 119 ECTs, we find that ECTs increase their ambitious mathematics instruction when their network members positively interpret accountability pressures and curricular standards as manifest in standardized tests and evaluation. This estimated effect is net of an ECT’s rich covariates, including the levels of ambitious mathematics instruction at the beginning of the academic year. It is implied that not all ECTs experience accountability pressures and curricular standards in the same way—their experiences are affected by the immediate networks in which they are embedded. Corresponding guidance for teacher educators and administrators is given.
Education policy in the United States has generated two strong institutional forces over the last decade. The 2002 reauthorization of the Elementary and Secondary Education Act (ESEA), known as No Child Left Behind, elevated the importance of accountability through evaluation of schools and teachers (U.S. Department of Education, n.d.; see also Hursh, 2007; Wiliam, 2010). Then, in 2009–2010, the National Governors Association Center for Best Practices (NGA Center) and the Council of Chief State School Officers (CCSSO) developed the Common Core State Standards (CCSS) to set learning goals to “outline what a student should know and be able to do at the end of each grade” (CCSS Initiative, 2010; NGA, 2010). On the macro scale, the CCSS complemented but did not replace the ESEA, as both emphasized systemic coherence to facilitate conditions for equal opportunity for students.
Once in the school, it is the educator who must make sense of institutional forces and who should enact instruction that facilitates student learning (Cohen et al., 2003; Diamond, 2007; Ingersoll & Perda, 2008; Lipsky, 2010). However, we do not know how accountability pressures and curricular standards such as the CCSS are experienced by schools and teachers (e.g., Blazar & Pollard, 2017; Coburn et al., 2016). Teachers could interpret accountability pressures and curricular standards as conflicting. In particular, the standardized tests used for teacher evaluation as a part of accountability pressures often assess at relatively low levels of cognitive demand (Harris & McCaffrey, 2010; Jennings & Bearak, 2014; Polikoff et al., 2011; Webb, 1999), while the Common Core mathematics standards emphasize higher-order thinking skills (CCSS Initiative, 2010). But teachers could also develop integrated responses to accountability pressures and curricular standards by increasing opportunities for all students to grapple with authentic and meaningful mathematics—also known as ambitious mathematics instruction (Lampert et al., 2010). Research (see Kilpatrick et al., 2001) indicates that ambitious mathematics instruction can address both students’ procedural fluency (“skill in carrying out procedures flexibly, accurately, efficiently, and appropriately”; p. 5) and their conceptual understanding (“an integrated and functional grasp of mathematical ideas”; p. 118). Ultimately the combination of procedural and conceptual instruction to create authentic mathematics experiences can be responsive to both accountability pressures and the CCSS, contributing to student learning (Hiebert & Grouws, 2007; National Mathematics Advisory Panel, 2008). Our goal then is to understand how teachers, specifically early-career teachers (ECTs), respond to the dual pressures of accountability and curricular standards and how their response might depend on the social context in which they are embedded.
Early Career Teachers, Accountability Pressures, and Curricular Standards
In 2010–2011, approximately 18% to 25% of students had a teacher with less than 5 years’ experience (National Center for Education Statistics, 2018). This applies especially to low-income/racial minority students, who are much more likely to be assigned to ECTs (e.g., Lankford et al., 2002). Thus, ECTs are a critical leverage point for the implementation of any reform in the short and long run.
ECTs are especially vulnerable to accountability pressures because of the ECTs’ untenured employment status (Bausell & Glazier, 2018; Feiman-Nemser, 2001). In particular, ECTs typically experience accountability pressures in the form of evaluation and standardized tests. ECTs are observed and evaluated more frequently than non-ECTs, with higher consequences in terms of retaining their jobs (Kim, 2017). Similarly, as overall evaluation often typically includes results from standardized test scores (Kraft & Gilmour, 2017), ECTs must be more responsive to their students’ performance on standardized tests than more senior teachers. Critically, ECTs experience accountability pressures while they transition out of teacher-training institutions, which often emphasize ambitious instructional practices consistent with the CCSS (Lampert et al., 2010). This makes the combination of accountability pressures and curricular standards especially salient for ECTs.
ECTs face a combination of accountability pressures and curricular standards when their professional identities (Rodgers & Scott, 2008) are tentative and they often lack clarity on how they will achieve their ideals (Thomas & Beauchamp, 2007). These identities are shaped by their organization and the larger professional context (Agee, 2004; Day et al., 2006; Hamman et al., 2010; Lasky, 2005). Furthermore, the professional identities teachers form in their early careers set trajectories for their instructional practices throughout their careers (Fairbanks et al., 2010; Olsen, 2008).
The transition from learners to teachers, including identity development, is very challenging in general (McCormack et al., 2006), and it often involves emotion, which is defined as “a heightened state of being that changes as individuals interact with their immediate contexts” (Lasky, 2005, p. 901). Pillen and colleagues (2013) described various tensions that ECTs experience during the transition into teaching and the negative emotions often associated with such tensions, such as feeling helpless, inferior, and anger about themselves or about their surroundings. Although emotion is inherently a part of teaching and ECTs are generally enthusiastic and optimistic compared with their experienced counterparts (Hargreaves, 2005), ECTs without appropriate coping strategies for negative emotions might develop symptoms of burnout, which clearly harms their performance and well-being (Kim et al., 2017).
Serious undealt challenges and negative emotions during the first years of teaching can contribute to teacher turnover (Lasky, 2005). In particular, turnover rates among ECTs are much higher than those of experienced teachers (Allensworth et al., 2009; Ingersoll et al., 2018; Kelly, 2004). An extended literature has documented various factors that affect teachers’ intended and actual turnover, such as principal leadership (Grissom, 2011; Kim, 2019; Ladd, 2011), student composition (Allensworth et al., 2009; Boyd et al., 2005), and mentoring and induction (Smith, 2006; for an extensive review of the factors that affect teacher turnover, see Borman & Dowling, 2008). In particular, teacher turnover is highly correlated with teachers’ working conditions. And among various aspects of teachers’ working conditions, collegial supports are one of the strongest predictors of teacher turnover (Kraft et al., 2016; Simon & Johnson, 2015). That is, if a teacher receives appropriate support from colleagues, the odds that the teacher remains in the school or the profession are significantly increased. Other, macrolevel factors such as economic recession and changes in state-mandated curricula also seem to affect teacher turnover (Minor et al., 2019)
To the point of our study, professional social networks and communities of practice are especially important for ECTs (Morrison, 2013; Pearce & Morrison, 2011). The supports for ECTs can take different forms. Formal induction programs can support ECTs, and some induction programs have produced better outcomes for ECTs (Glazerman et al., 2010; Luft et al., 2011). Teacher colleagues can provide support more tailored to the specific needs of ECTs (Desimone et al., 2014; Youngs et al., 2012). Third, as formal leaders of schools and mentors, principals also provide some support for ECTs (Bickmore & Bickmore, 2010; Kim, 2019).
While the studies described above establish the importance of ECTs’ networks and school context for their instructional practices and resilience, they do not help us understand how the social context mediates between the forces emanating from accountability pressures and curricular standards and an ECT’s practices. Thus, they have limited capacity to help us understand how ECTs contribute to the school’s response to accountability pressures and curricular standards. In this study, we examine how ECTs’ social context, including close colleagues and mentors, affects their instructional practices in response to accountability pressures and curricular standards.
Anticipating our key results, among 119 ECTs, we found no evidence that an ECT’s own interpretations of accountability pressures and curricular standards are related to the ECT’s instructional practices in the classroom. But we found robust evidence that ECTs are more likely to engage in ambitious mathematics instruction in the spring, when their colleagues positively interpret accountability pressures (as expressed through evaluation and standardized tests) and curricular standards. We interpret this relationship as a process of sensemaking (e.g., Weick, 1995), through which colleagues’ interpretations of circumstances affect an ECT’s practice.
Although our findings are based on observational data, to interpret them, we employ extensive controls, including an ECT’s instructional practices measured in the fall of an academic year, and fixed effects for district membership. This accounts for the potential selection of network members based on their baseline behaviors as well as other unobservables commonly experienced by those in a district. Furthermore, our inference is at least moderately robust (Frank, Maroulis, et al., 2013) with respect to concerns about potentially omitted variables that could have affected how the ECTs selected their network members. Our findings imply that not all ECTs experience accountability pressures and standards in the same way—ECTs are affected by the immediate network in which they are embedded. Ultimately, our findings point to critical supports that schools and administrators may offer ECTs to develop their networks as well as their pedagogical skills (cf. Smith et al., 2018).
From Interpretation to Practice: The Process of Sensemaking
We draw on the theory of sensemaking to understand the role of teachers in translating the institutional forces of accountability pressures and curricular standards into classroom instruction. In particular, we use Weick et al.’s (2005) definition: “Sensemaking involves turning circumstances into a situation that is comprehended explicitly in words and that serves as a springboard into action” (p. 409, italics added). The definition implies that sensemaking is a process that is evidenced partly in a relationship between comprehension and action. Such sensemaking is critical for producing successful or maladaptive practices at the individual and organizational levels (Maitlis & Christianson, 2014; Weick, 1995).
In our study, we attend to the broad circumstances concerning the institutional forces generated by state and federal governments, districts, the media, and organizations associated with curricular standards (e.g., CCSSO, NGA, Student Achievement Partners, Achieve) as well as accountability pressures expressed in terms of evaluation and standardized tests. Comprehension concerns how teachers interpret the combined expectations associated with accountability pressures and curricular standards, which inform how teachers understand the content to be taught and the nature of students’ work. The action pertains to classroom instruction, which is critical for student outcomes. 1 Thus, in our context, sensemaking represents the process arcing from the circumstances of accountability pressures and curricular standards to comprehension of the corresponding expectations and then to action within the classroom.
We draw on the sensemaking literature because the multiple forces of accountability and curricular standards create complex challenges beyond the direct translation of external circumstances to practice. In particular, the sensemaking literature describes how people respond to ambiguous and unexpected demands (Maitlis & Christianson, 2014; Weick, 1995). In the context of this study, accountability pressures and curricular standards create multiple, complex demands concerning the content that should be taught, how it should be taught, and the outcomes that should result (Coburn et al., 2016). ECTs may realize the goals of ambitious classroom instruction if they can positively interpret the combined forces of accountability pressures and curricular standards and then integrate them in their instruction (i.e., by addressing state test content focused on basic skills while also promoting conceptual understanding through authentic learning).
Critically, ECTs may lack sufficient experience and knowledge of the local context to comprehend how the complex forces of accountability pressures and curricular standards blend and then how to translate them into practice (John, 2006). Given most ECTs’ limitations in local knowledge and experience, it is reasonable that they may turn to school-based colleagues as one source of local knowledge and experience (Frank et al., 2011). These colleagues share the ECT’s challenges and resources, including student composition, administrative climate, and district curriculum (Gamoran et al., 2005; Hord, 1997; Resnick & Scherrer, 2012). Furthermore, as a set, these network members possess critical resources (see, e.g., Bausell & Glazier, 2018; Kagan, 1990) that can help ECTs respond to the institutional forces associated with accountability pressures and curricular standards. Indeed, prior research suggests that teachers’ social network members can strongly influence their instructional practices (see the reviews in Frank, Lo, et al., 2018; Moolenaar, 2012). This is consistent with the emphasis on social sensemaking, in which individuals draw on those in their social contexts to make sense of particular circumstances (Maitlis, 2005; Weick et al., 2005).
Although the social aspect of sensemaking can be captured in part through social network data (Maitlis & Christianson, 2014), few studies of sensemaking in education settings have included direct measures of social context defined by networks as well as direct observations of behaviors such as classroom practice. Spillane (1999) included the network as part of the zone of enactment—“that space where reform initiatives are encountered by the world of practitioners” (p. 144), and Coburn (2001) studied how teachers develop a shared understanding about reforms (“collective sensemaking”). But neither study included direct observations of teachers’ behaviors that could be linked to teachers’ interpretations or those of their network members. Our study will extend previous literature by explicitly measuring teacher’s exposure to others’ comprehension and interpretations of the external forces of accountability pressures and curricular standards through egocentric network (Perry et al., 2018) or personal network (McCarty et al., 2019) data and relating that exposure to direct observations measuring ECTs’ instructional practices. We then view any relationship between the interpretation of external circumstances and practice as reflecting a sensemaking process.
We recognize that the specific networks in which teachers are embedded are one manifestation of the context of the sensemaking process (Coburn, 2001; Spillane, 1999). The context also includes professional learning communities (Gallucci, 2008; Printy & Marks, 2004), cliques or subgroups of teachers (Frank, Penuel, et al., 2013; Penuel et al., 2009), and instructional coaches (Coburn & Woulfin, 2012), all of whom contribute to the zone of enactment (Spillane, 1999). But the specific link between ECTs’ personal network and instructional practices represents the most immediate (on the spot) context through which an ECT is exposed to others’ knowledge and norms. Other formal contexts such as district-level meetings or school- or grade-level planning teams may also shape practice. But an ECT’s informal network members can provide nuanced interpretations of institutional forces and convey them in day-to-day interactions (Hansen, 1999). Correspondingly, variability in the resources embedded in these networks likely contributes to the variability in ECTs’ responses to external pressures. In this context, the more experienced teachers in an ECT’s network can act as informal leaders and contribute to the sensemaking process through which an ECT translates the circumstances of accountability pressures and curricular standards into practice (Coburn & Woulfin, 2012; Gioia & Chittipeddi, 1991; Maitlis & Christianson. 2014; Weick et al., 2005). Thus, our study can inform how schools as organizations inculcate teachers after their preservice training (Bausell & Glazier, 2018; Darling-Hammond & Adamson, 2014; Zeichner & Gore, 1990) and how institutional forces diffuse through schools as organizations (Bridwell-Mitchell, 2015, 2018; Coburn & Woulfin, 2012; Maitlis & Christianson, 2014; Meyer & Rowan, 2006; Scott, 1987, 2008; Spillane, 2012; Weick, 1995).
The ECT’s sensemaking process is shown at the top of Figure 1. The white arc shows how an ECT’s interpretations of the circumstances of accountability pressures and curricular standards affect their classroom practice. The arc that transitions from black to white shows the contribution of the network members’ interpretations that can support the ECT’s instructional practice. As an example, an ECT might learn from a senior colleague that in their district the policies associated with accountability pressures and curricular standards can both be integrated into instruction by focusing on authentic learning opportunities such as in project-based learning (Krajcik & Blumenfeld, 2006). The senior teacher may have this understanding based on their own experience as well as through consensus from interactions with other colleagues in previous years—what Coburn (2001) refers to as “collective sensemaking” (p. 151). The ECT may then draw on the interpretations of the network member as a resource for the ECT’s own practice. In this sense, our theory elaborates on network centrality measures (Freeman, 1978) by accounting for the resource a network member can provide through a tie as well as the number and structure of network ties. We recognize other possible flows of influence represented by the dashed lines in Figure 1, but they are not the focus of our study. We also estimate the effect of network members’ reported instructional practices on an ECT’s instructional practices (Figure 1, solid black line) as a covariate in our model.
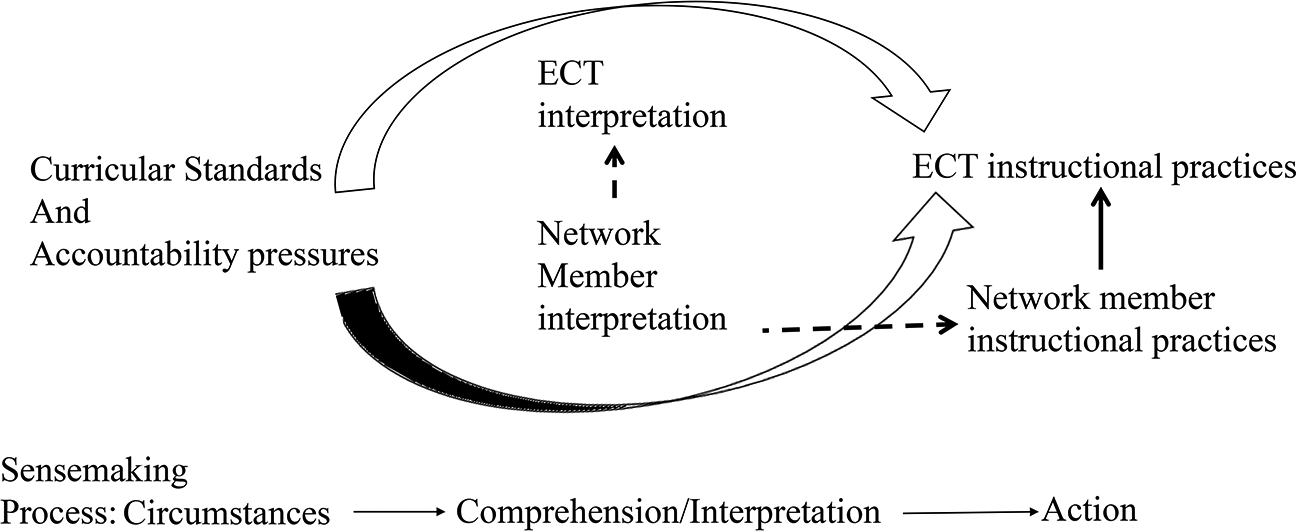
The sensemaking process from circumstances to interpretations to Early-Career Teachers’ (ECTs’) instructional practices.
Research Questions
Our research questions reflect two sensemaking paths from the circumstances external to the school to instructional practices in the classroom:
Research Question 1: How do an ECT’s interpretations of accountability pressures and curricular standards affect the ECT’s ambitious mathematics instruction?
Research Question 2: How do an ECT’s network members’ interpretations of accountability pressures and curricular standards affect the ECT’s ambitious mathematics instruction?
The first question is represented by the white arc in Figure 1. That is, any evidence consistent with sensemaking will be in the relationship between an ECT’s interpretations and the ECT’s practices. The second question is represented by the black-to-white arc in Figure 1. This arc represents the relationship between the interpretations of network members and the ECT’s practices.
Before proceeding, we note that we use causal language in our research questions because we are interested in causes that would have implications for changing policies and/or practice. We attempt to answer these questions with longitudinal data and a rich set of covariates (including controls for prior practices, district membership, professional development, and mathematics knowledge for teaching [MKT]) that have proven critical to reducing bias in observational studies (Chetty et al., 2014; Shadish et al., 2008; Steiner et al., 2010; Wong et al., 2017). Furthermore, we respond to potential challenges to any inferences we make by quantifying how robust our inferences would be to uncontrolled bias (Frank, 2000; Frank, Maroulis, et al., 2013).
Weick (1995) describes how actors enact sensible environments by creating and contributing to the environment in which they make sense of a situation. Correspondingly, as a secondary analysis, we attend to how ECTs shape their collegial networks. Here, we ask what characteristics of ECTs are associated with network members’ interpretations of accountability pressures and curricular standards. This is an exploratory analysis to begin to learn how teachers shape their networks.
The focus of this study is embedded in a broader framework as shown in Figure 2. The sensemaking process from an ECT’s interpretations to instructional practice is shown via the white arrow in Figure 2, and the process from network members’ interpretations to an ECT’s practices is shown via the arrow that transitions from black to white. But the broader framework accounts for how network members’ own practices create expectations for an ECT (Figure 2, black arrow) that can have important effects on practice (e.g., Frank et al., 2004). Professional development and subject-specific knowledge for teaching may also affect interpretations and teaching practices (Hill et al., 2005; Hill et al., 2007; Huggins et al., 2017; Jacob et al., 2017). These are represented via the dashed lines for secondary foci in Figure 2.
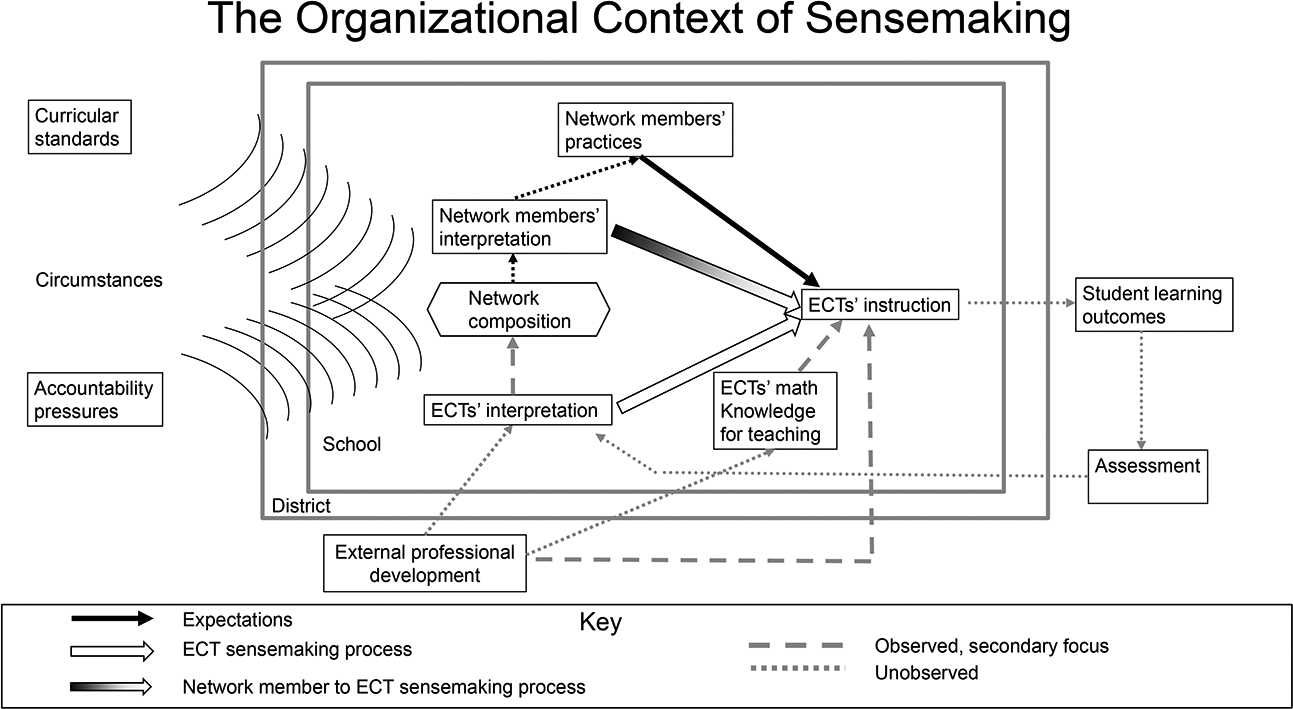
The organizational context of the process of Early-Career Teachers’ (ECTs’) sensemaking from interpretation to practice.
The broader framework also includes the role of the district, as represented by the outer rectangle. Districts have considerable influence over defining the circumstances of teaching through the curricular materials they choose, the professional development they offer, and the priorities they assign to building administrators (Coburn & Russell, 2008). Within the district, the school context also affects the ECT, including the role of the formal leadership (Peters & Pearce, 2012; Wood, 2005) and the informal leadership (Spillane, 2012). These leaders can shape and contribute to the intraschool social dynamics that can affect the sensemaking process through teachers’ interactions with and exposure to one another, as shown in the inner rectangle (Frank et al., 2004; Frank, Penuel, et al., 2013; Pogodzinski et al., 2013). Thus, our framework locates an ECT’s instructional choices relative to external forces, district constraints, school context, and the dynamics in their immediate network. Our framework also draws on research that has linked classroom instruction to student learning (e.g., Aaronson et al., 2007; Cohen et al., 2003; Rivkin et al., 2005), as well as linking assessment and instructional practices (e.g., Black & Wiliam, 2009; CCSSO, 2008), here represented indirectly flowing through an ECT’s interpretations. This reciprocal flow from assessment to interpretations and then practice contributes to the sensemaking process by providing critical feedback from experience (Weick, 1995). Although shown, this counterflow and other dotted lines are beyond the scope of our study.
Method
Research Question 1 concerns how ECTs’ interpretations of accountability pressures and curricular standards affect their ambitious mathematics instruction. Correspondingly, we measured the ECTs’ interpretations of accountability pressures in terms of standardized tests evaluation and curricular standards, as well as observing their classroom instructional practices. To address Research Question 2, we measured the same interpretations of members in the social networks of the ECTs. To have adequate power (e.g., more than 100 ECTs) to detect the effects of the ECTs’ interpretations as well as those of their network members, we employed an egocentric (Perry et al., 2018) or personal (McCarty et al., 2019) network design with classroom observation and surveys of the ECTs as well as surveys of their network members. Ultimately, we obtained classroom observations and survey measures of 119 ECTs in 48 schools in eight districts from 2014 to 2017. This is the largest database of ECTs that includes observations of instructional practices that we are aware of (cf. Smith et al., 2018). 2
Sample
We identified three states in the upper Midwest that varied in their level of implementation of the CCSS. Two of the states implemented CCSS starting in 2012–2013 and 2013–2014, respectively. These were considered CCSS states in Opfer et al. (2018). The last state first implemented CCSS in 2010, paused in May 2013, and then withdrew the policy in April 2014 (Torphy et al., 2019). This state was not considered a CCSS state; however, its mathematics standards were very similar to the CCSS.
Within each state, we sought two to four districts for participation in our study. Our goal was to recruit medium-sized districts in the three states that (a) served varying student populations with regard to race/ethnicity and socioeconomic status and (b) had at least 10 full-time core content elementary general education ECTs in Grades K–6 as of 2014–2015. While data collection was limited to eight districts due to limitations in resources, this provided a large enough sample of ECTs to have adequate power to detect moderate effects of ECTs or their networks. We provide the background characteristics of students in the districts in our study in Table 1. The districts served students ranging from 5.3% to 70% eligible for free/reduced-price lunch and from 28% to 92% White.
Background Characteristics of Students in the Districts
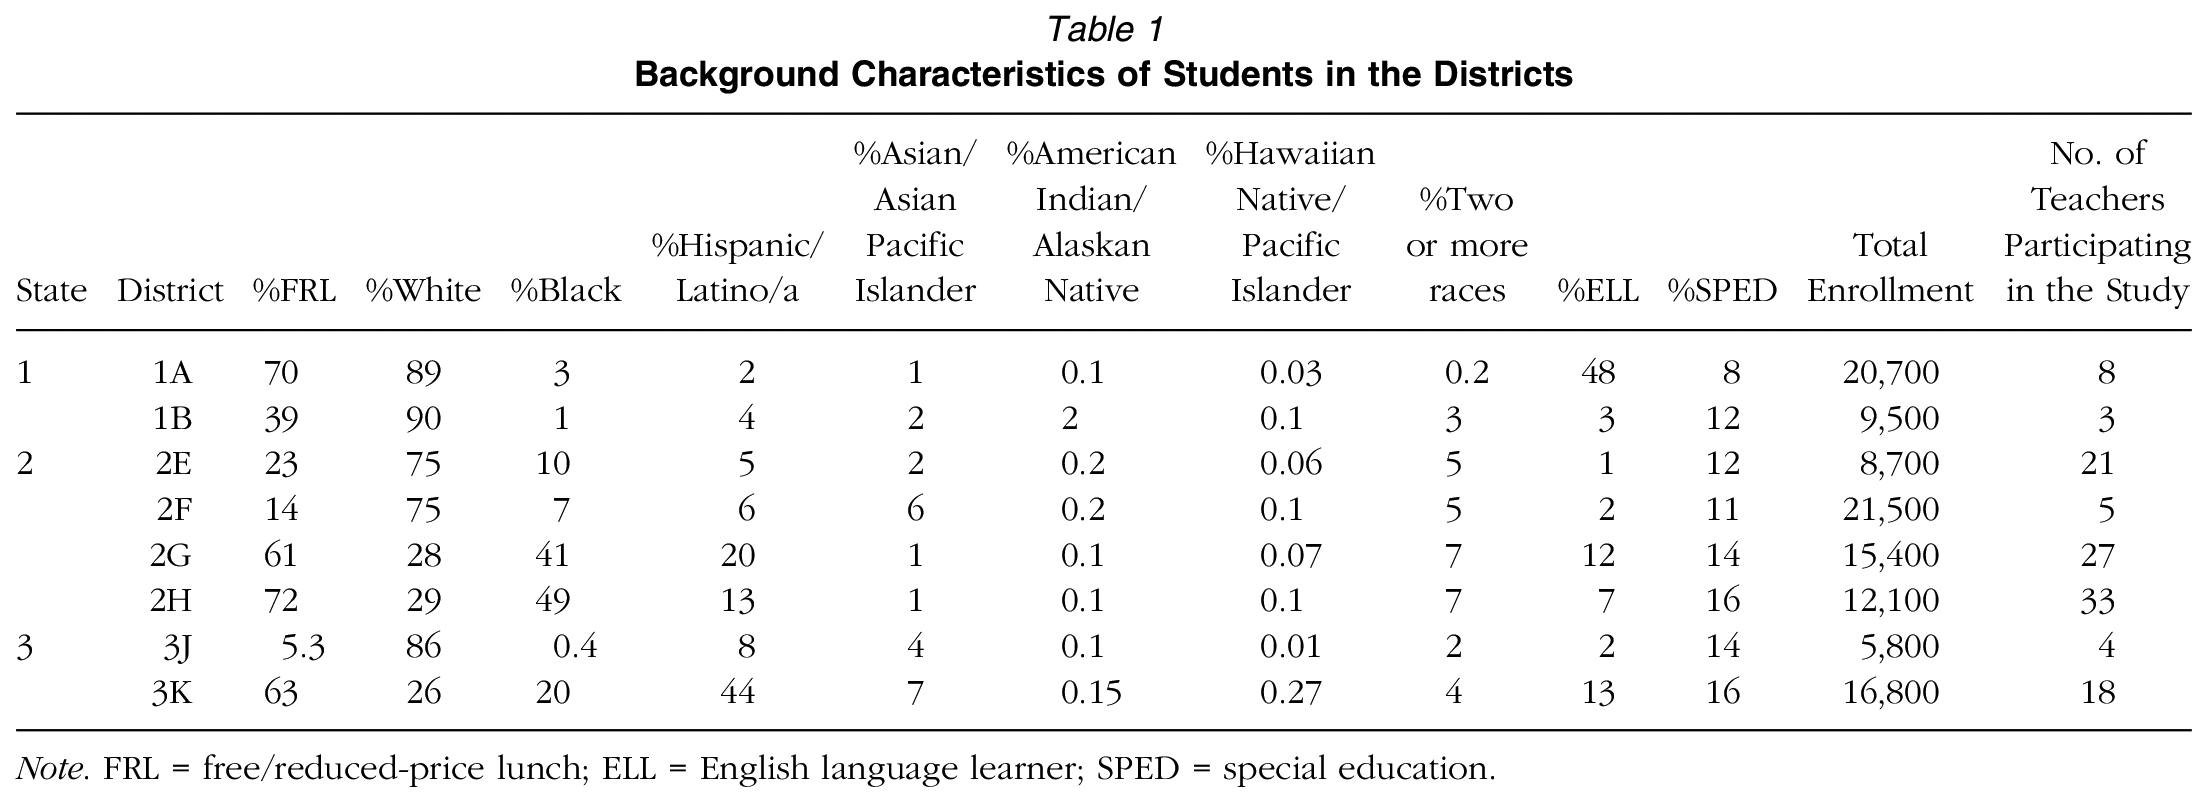
Note. FRL = free/reduced-price lunch; ELL = English language learner; SPED = special education.
In terms of standardized tests, each state administered its own state tests in reading/language arts and mathematics to students in Grades 3 to 8 on an annual basis. With regard to teacher evaluation, each state used data from classroom observations, student learning gains, and other data sources to evaluate teachers on a yearly basis. However, there was substantial variation among the districts in the details of their teacher evaluation systems, such as the weights given to each component of evaluation, the number of observations required, how each district used the teacher evaluation results, and so on. Such variation was in part due to the fact that the states allowed the districts to create their own system rather than employing a uniform state system (Kim, 2017). We acknowledge that the ways in which each state and/or district implemented CCSS varied, and thus, we include district fixed effects to account for such variation in the analysis. For example, using a fixed effect for District C accounts for anything commonly experienced by the teachers in District C, including the curriculum, the orientation of the central administration, the location, and so on.
Once a district agreed to participate, we requested a list of ECTs who might be eligible for our study. We defined an ECT as one who was in the first 4 years of teaching and taught at least some mathematics in a K–6 multiple-subjects classroom. We defined “early career” as the first 4 years of teaching because it takes about 4 years for most teachers to develop and refine their instructional repertoire (Feiman-Nemser, 2001) and because teachers in many states achieve tenure at the district level and/or professional licensure at the state level after about 4 years (Darling-Hammond et al., 2001; Goldhaber & Hansen, 2010). Given our definition of an ECT, we contacted the eligible ECTs within each district and solicited their participation. The ECTs were compensated $30 for each classroom observation and each survey. Ultimately, our study includes data from 14 ECTs from the school year 2014–2015, 95 ECTs from 2015–2016, and 49 ECTs from 2016–2017. This totaled 158 unique cases for a given teacher in a given year, although there were only 119 unique teachers, where 85 ECTs contributed 1 observation, 29 ECTs participated in 2 years and contributed 58 observations, and 5 ECTs participated in 3 years, contributing 15 observations.
The teachers in our data represent about 34% of the ECTs in the schools that we studied. The range was from 8% to 100% across schools, with lower response rates generally in schools where many ECTs worked. Our response rates did not vary with respect to the demographics of the school districts (response rate was correlated at .25 with %free/reduced-price lunch students and at −.36 with %White students, but these correlations were not statistically significant). Our sample size and sampling rate compare with those in Smith et al. (2018), who analyzed data from 61 ECTs, representing a response rate of roughly 50% but ranging lower in some analyses due to missing data. As such, our data afford one of the best opportunities to longitudinally study ECTs’ observed instructional practices, and perhaps they are the only such data to link ECTs’ instructional practices to attributes of their network members.
To gauge our study sample relative to a national sample, in Appendix A (in the online version of this journal), we compare the teachers in our study with the ECTs in the National Teacher and Principal Survey (NTPS), the most recent national survey of teachers (employing the NTPS weights in the calculation of the test statistics to ensure national representation). The teachers in our sample were not statistically different from the NTPS ECTs in terms of being Black. They were less likely to be Hispanic (2% in our study vs. 10% in the national survey). They were also more likely to be female and more likely to have a general certification and a major in education (differences in the percentage having a master’s degree were not statistically different). We return to these differences in the Limitations, although we note here that the students in the districts we studied were diverse in terms of socioeconomic status and race. 3
Data Collection
As shown in Figure 3, in each of the three (2014–2015, 2015–2016, and 2016–2017) academic years, we collected classroom observation data from ECTs and survey data from both ECTs and their social network members. We observed each ECT twice in the fall/winter (between October and February) and twice in spring (between April and May) as they taught mathematics. The observations in a given season typically took place within 1 to 2 days of each other. We use the spring observations as our primary dependent variable and the fall observations as a baseline control. In almost all cases for a given ECT, the spring observations took place at least 3.5 to 4 months after the fall observations.
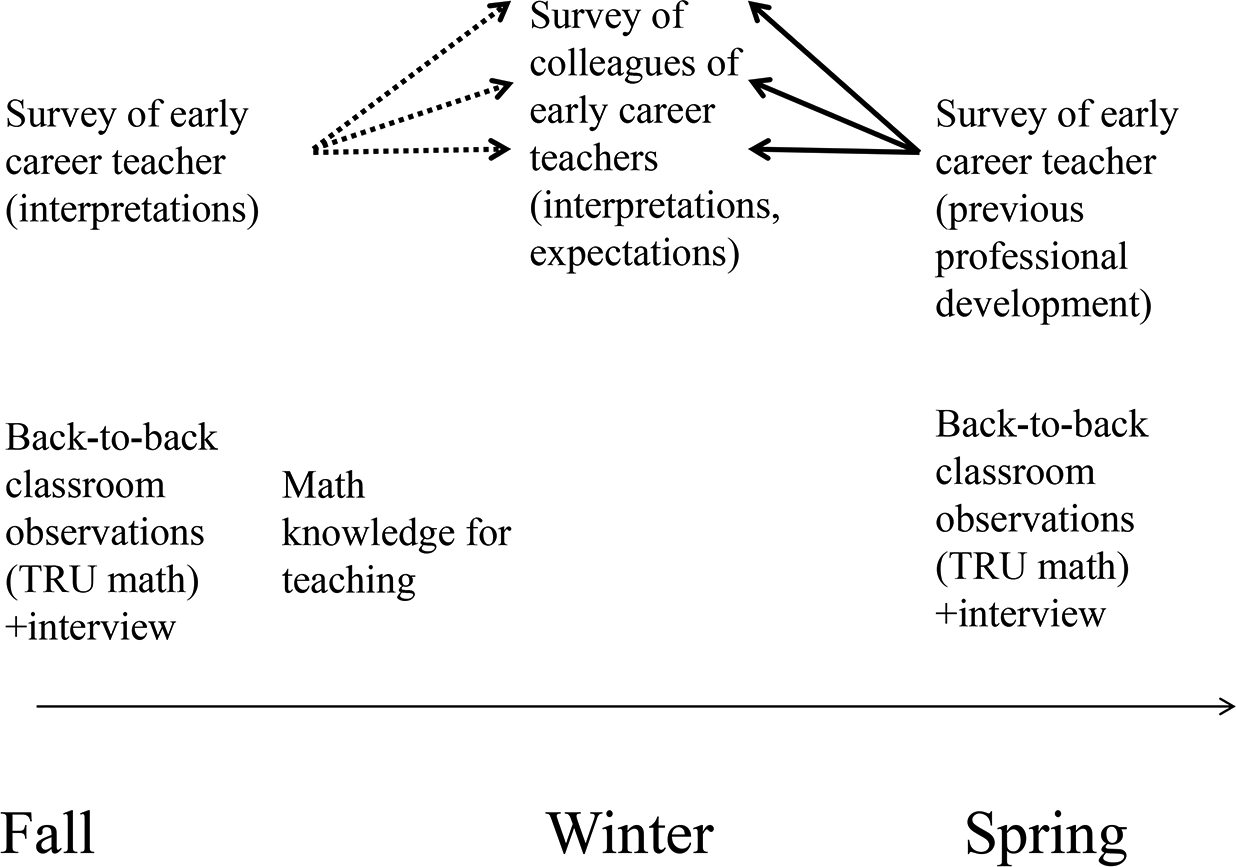
Timeline and structure of data collection.
Each ECT was also asked to complete three surveys in a given year. The fall and spring surveys included questions about planning mathematics instruction and about interpretations of state standards, evaluation, and the standardized tests that were used to construct the measure of the ECT’s interpretations of accountability pressures and curricular standards. The surveys also include measures of teacher background and other experiences that might affect instruction, which were used as covariates. Specifics are reported below in the measures section. In winter, the ECTs also completed an MKT survey (Hill et al., 2005). Since MKT was to be a covariate in our model, the winter measure best represented the ECT’s state of knowledge that might have effected change in instructional practices from fall to spring. If an ECT’s fall interpretations or interactions with network members between fall and winter affected the ECT’s MKT, then using a winter measure of MKT as a covariate leads to conservative estimates of the effects of interpretations on spring practices.
Also in winter, we contacted formal mentors and other teacher colleagues identified by the ECTs in the fall as network members. These data define a projected network, which we then confirm from the nominations an ECT made in spring (see description of the exposure term). We asked each member of the projected network to complete a survey that included the same items as in the fall ECT surveys, as well as items about their self-reported classroom practices (to be used as a covariate). The network members’ responses in winter represent the conditions to which the ECT was exposed during the school year, midway between the ECT’s baseline fall measure of instructional practices and the ECT’s spring measure, used as our primary dependent variable. 4 Furthermore, measuring the network members’ attributes in winter ensures that their attributes were measured prior to the dependent variable of the ECT’s spring instruction. This provides a sounder basis for causality by limiting reverse causality (wherein the ECT may select or influence network members based on the ECT’s spring instructional practices—see Frank & Xu, in press). In the measures subsection that follows, we describe how we use the projected network to obtain the data ultimately defining the network exposure term.
Measures
Dependent Variable
Teaching for Robust Understanding in Mathematics, or TRU Math
Our application of the sensemaking literature links interpretations of circumstances to instructional practices in the classroom. Correspondingly, our dependent variable is based on direct classroom observations using the TRU Math protocol. TRU Math is a subject-specific observational protocol developed to characterize powerful mathematics classroom instruction (Schoenfeld et al., 2014). TRU Math has five dimensions, of which we focused on the four in Figure 4.

TRU Math (Teaching for Robust Understanding in Mathematics) dimensions.
The following descriptions are from Schoenfeld et al. (2014).
The Mathematics (Dimension 1): The extent to which the mathematics in the lesson is focused and coherent and at grade level; connections between procedures, strategies, concepts, and contexts are addressed; and the lesson provides opportunities to engage in mathematical practices
Cognitive Demand (Dimension 2): The extent to which classroom interactions create and maintain an environment of productive intellectual challenge that is conducive to students’ mathematical development
Agency, Authority, and Identity (Dimension 4): The extent to which students are the source of ideas and discussion of ideas, as well as how student contributions are framed
Uses of Assessment (Dimension 5): The extent to which students’ mathematics thinking surfaces; the extent to which instruction builds on student ideas when potentially valuable or addresses misunderstandings when they arise
In addition to scores for each dimension, we constructed a combined measure by standardizing each dimension based on the spring ratings and then taking the average. As a set, the dimensions capture key elements of Lampert et al.’s (2010) conception of ambitious mathematics instruction. Dimensions 1 and 2 examine whether students are working on rigorous mathematics tasks that are at grade level. Dimensions 4 and 5 attend to how teachers create environments for students’ thinking to surface and be observed. Note that the highest levels on each dimension explicitly or implicitly include the potential for procedural and conceptual learning. For example, Level 3 of the mathematics dimension includes “connections between procedures, concepts and contexts.” It is this combination that creates the authentic learning opportunities emphasized in ambitious instruction.
We made four related modifications to adapt TRU Math to our context. These involved measurement in terms of 10-minute intervals, not measuring the third dimension of TRU Math because of inadequate interrater reliability (IRR), adaptation to elementary school classroom activities, and creating a finer 5-point scale including 5 points for which we were able to sustain IRR. See the technical Appendix B (available online) for details.
To establish baseline IRR, we first calibrated an expert rater team of three project members who all had mathematics education expertise. Once the expert team had reached a threshold of 0.50 weighted kappa on their ratings across all dimensions, we then measured IRR by calculating the intraclass correlations for a single typical rater and compared the weighted kappas of each team member with each of the expert raters. Raters were considered reliable if the team met acceptable thresholds of intraclass correlations (~.60) and a team member had a weighted kappa of about 0.50 with at least one expert team member (Bell et al., 2014). After reaching a baseline threshold for IRR in October 2015, we monitored for rater drift by asking the raters, usually twice per quarter, to rate the same class period video from a participating ECT to confirm that the raters continued to meet our thresholds for defining reliability. If particular raters did not meet the thresholds, the video episodes were discussed with an expert team member and the drifting rater rated a set of three episodes from another video (rated by other team members) until acceptable IRR was achieved (for further details, see Bieda et al., in press).
Key Predictors
Our key predictors are based on the survey measures of ECTs and their network members.
Interpretations of evaluation, standards, and tests
Recall Weick et al.’s (2005) definition: “Sensemaking involves turning circumstances into a situation that is comprehended explicitly in words and that serves as a springboard into action” (p. 409, italics added). The external circumstances on which we focus are accountability pressures, operationalized in terms of evaluation and standardized tests, and curricular standards.
The items representing interpretations of external circumstances began with the following stem: “On average across all of your mathematics lessons, to what extent do each of the following support or inhibit your ability to enact your mathematics lessons?” We used these specific elements: expectations associated with state standards and expectations associated with state mathematics tests. Our coding featured the capacity to interpret both state standards and mathematics tests as positive forces. In particular, we coded supports me to some extent as “1” and supports me to a great extent as “2”; all other responses were coded as “0.”
Our measure of interpretations also included teachers’ reports of how they directly interpreted external forces in their planning, a key bridge to practice (Ding & Carlson, 2013). The items specific to planning were in response to the following question: How often did you make use of the following in your planning: curricular standards (e.g., state standards, CCSS, National Council of Teachers of Mathematics [2014] standards); performance criteria used in teacher evaluation; and teacher evaluation results? (Responses could be 0 = never, 1 = sometimes, 2 = frequently, or 3 = always.) The final measure was generated by standardizing each of the five items and then taking the mean. Together the items represent how ECTs comprehend, explicitly in words, accountability pressures and curricular standards.
We note that because our measures are based on surveys, they can capture only limited aspects of the interpretation that is a part of the sensemaking process. Most studies of sensemaking are qualitative (see the reviews in Maitlis & Christianson, 2014; Weick et al., 2005), representing the richness with which people create narratives about their circumstances, in their own words, and translate them into practice (e.g., Coburn, 2001; Spillane, 1999). We note that our use of survey items is comparable with Tallon and Kraemer’s (2007) use of two items concerning how executives interpret the forces of profitability and market share. But as in other studies of sensemaking that use survey measures (e.g., Greenhalgh & Jick, 1989; Spielman & Lloyd, 2004; Tallon & Kraemer, 2007), our measures can be used to illuminate the link between interpretations and observed behaviors while conditioning on other attributes (e.g., MKT), other experiences (e.g., professional development), and previous behaviors.
Network exposure to interpretations of accountability pressures and curricular standards
The first component of an ECT’s exposure to network members’ interpretations was the colleagues (up to 10, including instructional coaches) the ECTs listed with whom they had discussed mathematics instruction in spring in their schools (in Figure 3, these are represented by the solid lines from spring ECT to network members). The ECTs also indicated how frequently they had talked with each person about mathematics instruction during the previous 6 months (frequency was coded as 1 = less than once a month, 2 = 1–3 times a month, 3 = 1–2 times per week, 4 = 3–4 times per week, and 5 = everyday). We also asked the ECTs to separately indicate the name of their school-based mentor and how frequently they interacted with them (ECTs typically have formal mentors assigned to them; Ronfeldt & McQueen, 2017; Smith & Ingersoll, 2004). We asked the mentor question separately from that of close colleagues to ensure that the ECTs had ample opportunity to identify informal close colleagues as well as mentors.
To create the network exposure term, we combined the sociometric items with the measure of the network member’s own interpretations of accountability pressures and curricular standards. The data were obtained from those network members who had also been nominated in the previous fall as part of the projected network (Figure 3, dotted lines). 5 Consider Ashley, the ECT who in spring indicated discussing mathematics instruction with her mentor Lisa one to three times a month (frequency coded as 2) and with her school colleague Bob everyday (frequency coded as 5). Assume that Lisa and Bob were both surveyed in winter because Ashley or another ECT had nominated them the previous fall. In this way, we ensure that the network exposure pertains to experiences occurring between the first and second TRU Math observations of ambitious mathematics instruction (see Figure 3). If Lisa’s interpretations of accountability pressures and curricular standards were 0.1 and Bob’s were 0.2, then Ashley’s measured network exposure to others’ interpretations from fall to spring would be (2 × 0.1) + (5 × 0.2) = 1.2. Thus, the network exposure term represents the sum of the positive interpretations that Ashley can draw on from her network. 6 This is consistent with our theory regarding network members serving as a resource on which an ECT can draw to interpret the demands of accountability pressures and curricular standards.
Covariates
Out-degree
Our network exposure term features the interpretations of an ECT’s network members as a form of support. But it may be that an ECT is not influenced by network members’ interpretations. It may be that network members generally provide multiple forms of support regardless of their specific interpretations of accountability pressures and curricular standards. Correspondingly, ECTs’ instructional practices may be influenced solely by the size of their network. This is implicit in network measures of centrality (e.g., Freeman, 1978). We therefore control for the ECT’s out-degree—the number of others the ECT named as close colleagues, derived from the spring survey. Out-degree accounts for the number of people nominated by the ECT, including those network members the ECT nominated but for whom we did not have data.
Intensity of mathematics professional development
As shown in Figure 2, professional development could affect instructional practices directly or indirectly through an ECT’s interpretations or MKT. Therefore, we controlled for a measure of participation in professional development based on the intensity of the experience (e.g., Desimone, 2009). The measure was based on the following question: During the past 6 months, how many hours/days did you spend addressing mathematics instruction in school or district induction or professional development activities? (Responses could be 1 = none, 2 = 1–2 hours, 3 = 3–4 hours, 4 = 5–8 hours, 5 = 2 days, or 6 = 3 or more days.) This retrospective measure was taken from the spring survey to reflect the experiences of the ECT in the interval between the fall and spring classroom observations.
Mathematics knowledge for teaching
Recognizing that much of a teacher’s practice may be a function of their content knowledge, in particular their MKT (e.g., Jacob et al., 2017), we controlled for the ECT’s number and operations of MKT (Hill et al., 2004).
Exposure to colleagues’ self-reported practices
ECTs may respond to the expressed practices of their network members instead of to their network members’ interpretations of external circumstances (Frank et al., 2011; Parise & Spillane, 2010). That is, the expressed practices of network members may represent the expectations that ECTs perceive their network members have for them (see Figure 2). The specific practices we used to define network members’ expectations are consistent with several dimensions of TRU Math. In particular, the items were based on the following stem: For a typical set of five consecutive mathematics lessons, during how many would you do each of the following? (Responses could be 0 = 0 lesson, 1 = one to two lessons, 2 = three to four lessons, or 3 = five lessons)” This was completed by one of the following: (a) have students work in pairs or groups; (b) use formative assessment techniques to check student understanding multiple times; (c) create opportunities for peer evaluation; (d) achieve equitable participation from most or all students; (e) encourage students to verbally express their thinking; (f) make connections between different strategies; and (g) discuss other students’ strategies (α = .76). We constructed a network exposure term based on the network members named by the ECTs, using an approach analogous to our primary independent variable, exposure to others’ interpretations (see the online Appendix C for details).
Data Analysis
We begin by presenting descriptive statistics for the four dimensions of TRU Math we have selected and for each of the teacher-level predictors in our models. We then estimate models with the different dimensions of TRU Math as the dependent variable, as well as a combination of all the dimensions with the ECTs’ own interpretations and that of their network members as the key predictors. Last, we present a descriptive model of the teachers’ exposure to their network members’ interpretations.
Model of Ambitious Instruction (TRU Math)
Corresponding to our measurement of TRU Math in episodes of 10 minutes, we estimated the following model for episode (i) and teacher (j):

In Equation 1, Spring TRU Math ijky is the observation score on a TRU Math dimension (or combined across dimensions) for episode i for ECT j in district k within year y. Ultimately, the data included 1,856 episodes of mathematics instruction within 158 teacher-years (a given teacher in a given year) for 119 unique teachers. We used clustered standard errors at the teacher level to evaluate the estimated effects of the network exposure term.
In Equation 1, the term β1 represents the relationship between an ECT’s own interpretations of accountability pressures and curricular standards and the ECT’s instructional practices, as in Research Question 1. This would be consistent with the sensemaking process represented by the white arc in Figure 1. A positive value of β1 would indicate that ECTs who had more positive interpretations of accountability pressures and curricular standards were more likely to increase their ambitious instruction and ECTs with negative interpretations were more likely to decrease their ambitious instruction. Similarly, the term β2 represents the relationship between an ECT’s network members’ interpretations of accountability pressures and curricular standards and the ECT’s instructional practices, as in Research Question 2. A positive relationship would be consistent with the transitional arc in Figure 1.
The term μk represents district fixed effects, recognizing that teachers may be affected by the particular circumstances of their districts, including the student demographics, curricular policies, and leadership. For example, district fixed effects would account for the unusually low levels of ambitious instruction in spring in District A due to the curriculum or limited professional development in District A. The terms β1 and β2 can then be interpreted as applying to teachers within the same district who had different interpretations of external circumstances or different networks, respectively. The term θj represents 9 fixed effects for the teachers who appeared in our sample in more than 1 year and whose fixed effects estimates were statistically different from those of the group of teachers measured only once (including 34 fixed effects for all teachers who participated in more than 1 year would have overtaxed the degrees of freedom). Fixed effects account for the dependencies due to repeated observations on a given teacher (Wooldridge, 2010) and have been used extensively in education research (e.g., Evans, 2019; Hurwitz et al., 2019; Ronfeldt et al., 2013). The term αy represents the fixed effects for the year of data collection as well as a single fixed effect for Year 3 in a specific district that had a dramatic change in curriculum and corresponding professional development. The rijky represent random errors for the episodes and are assumed to be N(0, σ2). Although Equation 1 is specified for TRU Math generally, we estimated one model for each dimension separately and then one for all the dimensions combined. In each case, we controlled for the corresponding prior measure of TRU Math averaged across all the episodes in the preceding fall (for the combined score, the fall scores were standardized based on the means and standard deviations for the spring scores, thus maintaining consistency in the construction of the measure over time).
Treatment of Missing Data
For each covariate, we created an indicator for whether the original variable was missing or not. We then set the original variable to 0 if it was missing and included the indicators for missing data in the model. These are the terms IND jky in Equation 1, with Γ being a vector of the corresponding coefficients. We also created indicators for ECTs whose network members did not provide survey data. We also tested for interactions between the indicator of the missing data and our key predictor, exposure to network members’ interpretations (see the online Appendix D). This general procedure is recommended by Cohen et al. (2014). It has been critiqued by Allison (2001), but Allison did not account for the correction based on including the interactions of the indicator for missing data with the predictor of interest (exposure to network members’ interpretations).
Causal Inference
The strongest challenge to any inference about an effect of interpretations of accountability pressures and curricular standards on the ECTs’ instructional practices would be that the ECTs’ baseline instructional practices (measured in the fall) affect their own interpretation or that of their network members as well as the ECTs’ subsequent instructional practices in spring. Consider a hypothetical teacher Ashley whose instruction in the fall reflected the principles of ambitious instruction. Based on this level of ambitious instruction, she might have elected to interact with others who interpreted the CCSS and standardized tests as supportive, and she might continue to engage in high levels of ambitious instruction in spring. Therefore, Ashley’s network exposure is confounded by the fall instruction; any observed relationship between the network exposure term and ambitious instruction in spring might be due the extent to which her instruction reflected ambitious practice in the fall, not to the network exposure (Frank, 2000). Our most direct response is to leverage our longitudinal measurement of instructional practices to control for Ashley’s baseline measure of ambitious instruction in the fall. Frank and Xu (in press) show that ordinary least squares yields unbiased estimates of network influence when selection of network members is based on information contained in the baseline measure. More generally, controls for baseline dramatically reduce the bias associated with observational studies when compared with randomized control trials (Chetty et al., 2014; Shadish et al., 2008; Steiner et al., 2010; Wong et al., 2017).
Of course, there may be other factors affecting both the selection of network members and subsequent instructional practices that did not manifest in the baseline measure. This is true for most observational studies. Therefore, we also control for key covariates (e.g., MKT, professional development, and close colleagues’ self-reported practices) that could affect mathematics instruction. Xu (2018) shows that one could also control for the dependencies occurring in full networks using latent space models, but such shared latent network spaces could not be constructed for our data, which are primarily egocentric, with only 26% of the network members nominated by more than one ECT.
Finally, we recognize that there may still be unaccounted sources of bias due to variables omitted from our models or due to our sampling procedure. In response, we quantify the percent bias necessary to invalidate the inference (Frank, Maroulis, et al., 2013). We also quantify how strongly an omitted variable would have to be correlated with network exposure and TRU Math to invalidate our inference about an effect of network exposure on TRU Math (Frank, 2000). In this way, we quantify the discourse about the uncertainty of our inferences.
Correlates of Exposure to Network Members’ Interpretations
To explore the factors related to an ECT’s exposure to network members’ interpretations of accountability pressures and curricular standards, we examined how each of the variables in our main model was correlated with the ECT’s exposure to network members’ interpretations. Thus, we considered how ECTs might be very deliberate in cultivating their social networks that provide specific knowledge or information (Spillane et al., 2012; Wilhelm et al., 2016) or allow them to express vulnerability (Baker-Doyle, 2011). These networks may be very influential in determining how reforms are implemented in schools (Daly et al., 2010; Frank et al., 2004; Frank, Xu, et al., 2018; Penuel et al. 2009), and they are critical to teacher retention (Baker-Doyle, 2010; Smith & Ingersoll, 2004). We also explored the relationship between exposure to network members’ interpretations and several other measures (e.g., use of social media, math anxiety, self-efficacy, collective efficacy).
Preliminary analyses indicated that the strongest correlates of exposure to network members’ interpretations were based on the ECTs’ survey responses to these items: “I need to earn a high teacher evaluation score to keep my job” and “I enjoy thinking about different ways to solve a mathematics problem.” The responses were on a 4-point Likert scale, with 1 = strongly disagree, 2 = strongly agree, 3 = agree, and 4 = strongly agree. After we had identified potential factors associated with the interpretations of network members, we included them in a model predicting the network exposure term, controlling for the one district that varied significantly (p = .07) from the others, year fixed effects, fixed effects for the teachers with multiple years of data whose estimates differed significantly from those of the teachers who were measured only once, the ECTs’ TRU Math scores in the fall, and the ECTs’ interpretations of accountability pressures and curricular standards.
Results
Descriptive Statistics
Descriptive statistics are shown in Table 2. The mean overall TRU Math scores ranged from 1.415 for Dimension 4 (Agency, Authority, and Identity) to 1.953 for Dimension 1 (The Mathematics). The combined measure has a mean near 0 because it was based on standardized scores of the individual dimensions. The means and standard deviations for each dimension were stable from fall to spring. There were 3% to 4% missing data on any given dimension. The ECTs’ own interpretations of accountability pressures and curricular standards had a mean of −0.007 with a standard deviation of 0.675 (recall that this was based on the mean of the standardized items). The exposure term mean was 0.919 with a standard deviation of 3.055, although there is no simple metric for this term because it is a function of frequency of interaction and interpretations of the network members. Out-degree ranged from 0 to 10, with a mean of 3.418. The mean of MKT was near 0 (−0.09 on the item response theory metric), with a range of about 4.5 points.
Descriptive Statistics

Note. N = 158 (teacher-years). ECT = early-career teacher; MKT = mathematics knowledge for teaching.
Model of Ambitious Instruction (TRU Math)
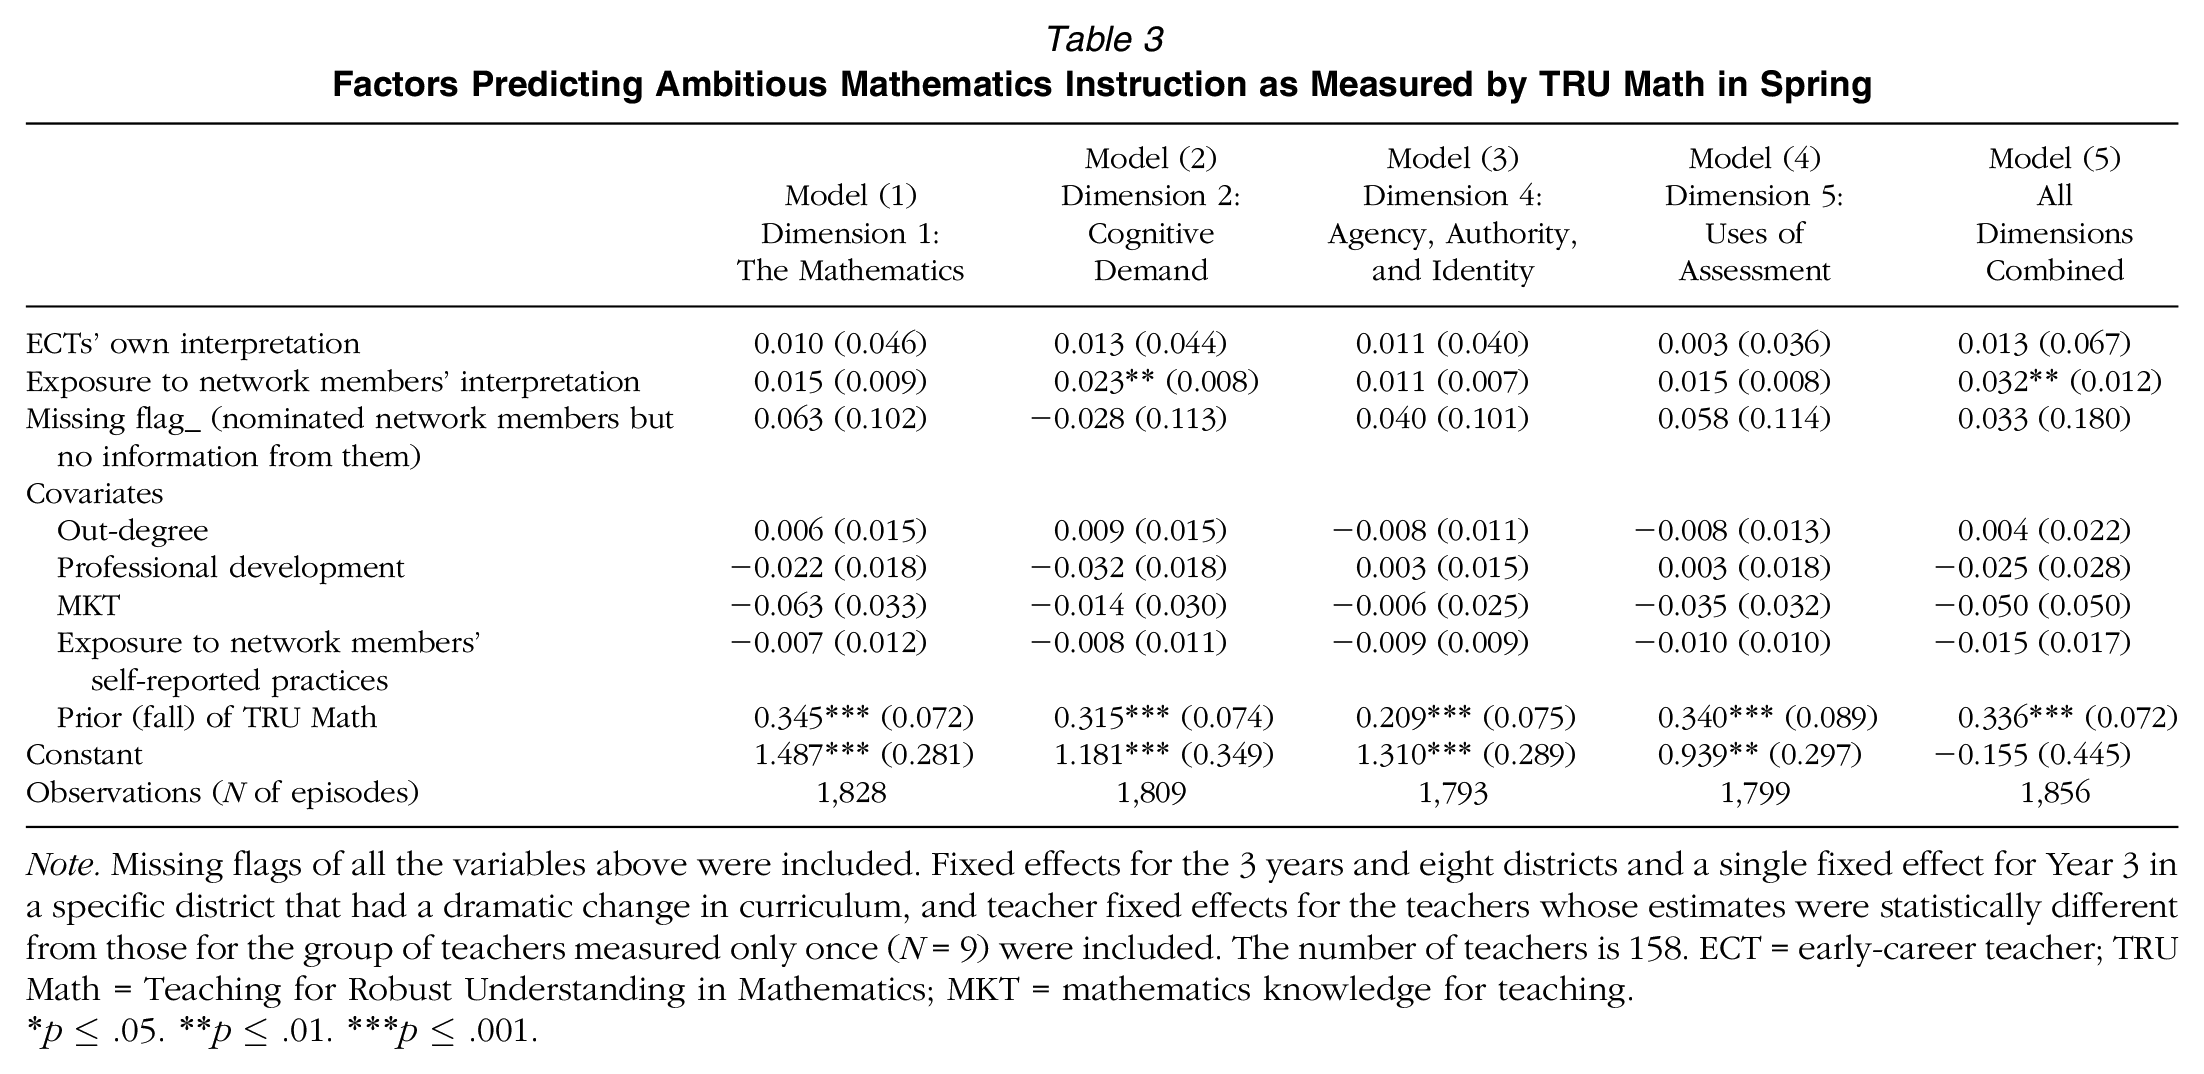
Estimates from our model predicting TRU Math are shown in Table 3. Regarding Research Question 1, the estimated effect of an ECT’s own interpretations of accountability pressures and curricular standards was considerably less than its standard error on each dimension as well as the combined dimensions; there is no evidence of an effect of an ECT’s own interpretations on changes in the ECT’s instructional practices.
Factors Predicting Ambitious Mathematics Instruction as Measured by TRU Math in Spring
Note. Missing flags of all the variables above were included. Fixed effects for the 3 years and eight districts and a single fixed effect for Year 3 in a specific district that had a dramatic change in curriculum, and teacher fixed effects for the teachers whose estimates were statistically different from those for the group of teachers measured only once (N = 9) were included. The number of teachers is 158. ECT = early-career teacher; TRU Math = Teaching for Robust Understanding in Mathematics; MKT = mathematics knowledge for teaching.
p ≤ .05. **p ≤ .01. ***p ≤ .001.
Regarding Research Question 2, the coefficient for exposure to network members’ interpretations of accountability pressures and curricular standards is positive on each dimension of TRU Math, ranging from .011 on Dimension 4 (Agency, Authority, and Identity) to .023 on Dimension 2 (Cognitive Demand, p ≤ .01), with a coefficient of .032 (p ≤ .01) for the combined measure. Because the metric of the exposure term is difficult to interpret, we compare the standardized coefficients for the exposure term with the standardized coefficients for the corresponding prior TRU Math scores (Frank et al., 2004), as ECTs balance how they respond to others versus retaining their own tendencies (Frank et al., 2010). The coefficients for the exposure term range from 22% of the size of the estimated coefficient for prior behavior (fall TRU Math) for the mathematics dimension (coefficients of .08 for exposure and .37 for prior behavior) to 43% of the size of the estimated coefficient for prior behavior for the combined dimension (coefficients of .10 for exposure and .23 for prior behavior). These are consistent with other estimates of network effects, which are typically small to moderate for teachers but present across many domains (Frank, Xu, et al., 2018). We emphasize that a positive coefficient for exposure to others’ interpretations implies that those who are exposed to colleagues who report more positive interpretations may increase ambitious instructional practices while those who are exposed to colleagues who are at low levels of interpretation may fail to improve or may even decrease their levels of ambitious instructional practice.
Note that the estimated effect of exposure to network members’ interpretations is net of the relevant prior measure of TRU Math in the fall, the ECT’s out-degree, the ECT’s MKT, the ECT’s intensity of professional development, the ECT’s own interpretations, colleagues’ self-reported practices, as well as fixed effects for districts and year of study. 7 Not surprisingly, the ECTs’ prior level of TRU Math in the fall was a strong predictor of their TRU Math scores in spring across all dimensions. None of the substantive covariates were statistically significant (p ≤ .05), although we made the conservative choice to retain them in the models because they partly explain the effect of exposure to network members’ interpretations (when the covariates were removed, p ≤ .01 for the network exposure estimate on the cognitive demand dimension and p ≤ .015 for the combined dimension). All inferences were essentially sustained when we analyzed only those who did not have missing data on the exposure term (see the online Appendix D for details).
Causal Inference
We recognize that there could be omitted variables partly responsible for the estimated effect of exposure to network members’ interpretations of accountability pressures and curricular standards on ECTs’ instructional practices. We have attempted to account for some of these by controlling for an ECT’s prior levels of TRU Math, which might reflect prior levels of motivation, training, anxiety, and so on. Therefore, one way to interpret the estimated effect of the exposure term is to say that for two ECTs of comparable levels of ambitious instruction in the fall, the ECT who can draw on her colleagues as a source of support is more likely to increase her ambitious instruction in spring. Furthermore, we controlled for covariates (e.g., out-degree, MKT), some of which may be concurrent with exposure to colleagues (e.g., professional development), making our estimate of the network exposure effect conservative.
Nonetheless, there could be other explanations for the size of our estimated network effect that we have not considered. In response, we quantify what it would take to change our inference. Using Frank, Maroulis, et al. (2013), 28% of the estimated effect of network exposure on combined TRU Math would have to be due to bias to invalidate our inference of an effect of network exposure on TRU Math. This is already conditioned on TRU Math in the fall and our other covariates. The inference for an effect of network exposure on Cognitive Demand is slightly more robust (33% of the estimated effect would have to be due to bias to invalidate the inference). These values are approximately at the median of the observational studies reported by Frank, Maroulis, et al. Using Frank (2000), an omitted variable would have to be correlated at .28 with both exposure and combined TRU Math to invalidate our inference (for an impact on the network exposure term defined by the product .28 × .28 = .078). In contrast, our strongest covariate was professional development, which was correlated at −.1 with exposure to network members’ interpretations and at −.04 with combined TRU Math (for a product of .004), partialling for fall TRU Math; the impact of the omitted variable would have to be about 20 (.06/.004 is about 19.5) times larger than the impact of our strongest covariate to invalidate our inference of an effect of exposure to network members’ interpretations on combined TRU Math. While such an omitted variable may exist, we believe our inference is robust to most plausible omitted variables.
Specific Cases of Network Exposure and TRU Math
While our quantitative evidence shows a general relationship between exposure to network members’ interpretations and TRU Math scores, we contrast a kindergarten ECT whose TRU Math score increased with a second-grade ECT whose TRU Math score decreased to illustrate. The ECTs were chosen based on their specific values of combined spring TRU Math scores and network exposure term, conditional on their fall TRU Math scores. They are from the same district, ruling out differences in their changes in instruction that might be due to the district curriculum or personnel. The teachers were observed 1 year apart, but the district curriculum and personnel changed little over the 1 year. The professional development did change between the years of observation, but both teachers participated in only 1 to 2 hours of mathematics-based professional development during the academic year, making it unlikely that any differences in the content of the professional development were responsible for the dramatic differences in the changes in their teaching practices.
Increase in TRU Math, positive interpretations of network members: In the fall of 2015, the kindergarten ECT taught lessons focused on describing shapes. Her lessons were roughly on grade level (Mathematics mean = 1.86) and characterized by limited cognitive demand (mean = 1.36). The ECT asked students to select a shape, then describe the shape they chose to their classmates. While the students were able to express their ideas, their ideas were not built on by others (Agency, Authority, and Identity mean = 1.29), nor was student thinking solicited (Uses of Assessment mean = 1.29). For example, the ECT asked the students, “What shape is this?” And the students responded with short answers, identifying their chosen shape.
In the spring of 2016, this teacher indicated having interacted with an experienced teacher one to three times per month during the past academic year (coded “2”). In the winter of 2016, the experienced teacher reported that the expectations associated with state standards and tests both supported her instruction and that she always used curricula standards in planning. She did not respond to how frequently she used the performance criteria used in teacher evaluation or teacher evaluation results for planning. Her overall interpretation score based on the sum of observed standardized items was 0.68. The corresponding exposure term for this ECT (when the sum of the standardized responses was multiplied by the frequency of interaction) was 2 × 0.68 = 1.36. The ECT’s MKT measured in winter was −0.678.
Different from the fall, in spring, the kindergarten ECT introduced the students to subtraction problems, with physical models and writing of equations (especially focusing on the equals sign and what it means). Spring lessons were consistently on grade level and also supported meaningful connections for real-world meeting (Mathematics mean = 3). The students each had their own set of manipulations and acted out the subtraction, which supported their productive engagement (Cognitive Demand mean = 2.94). Generally, the students were able to share their answers in a chorus, but the ECT was the primary driver of the conversation, and the students were not supported to build on one another’s ideas (Agency, Authority, and Identity mean = 1.56). The ECT did not actively pursue student thinking consistently throughout the spring lessons; during small groups, the teacher was able to see the students thinking through manipulative representations, yet the discussion that ensued tended to be corrective in nature, leading the students to the correct answer (Uses of Assessment mean = 1.63).
Decrease in TRU Math, negative interpretations of network members: The average scores for the second-grade ECT’s instruction on each TRU Math dimension in the fall were relatively high, close to 2.3. The ECT taught lessons involving addition and subtraction word problems, on grade level. The students explained their ideas and responded to one another’s ideas. The ECT asked the students to explain how they had solved the problems, and clarified strategies for the class. The ECT was intentional about hearing from different students. During one moment, a student provided an incorrect answer. The ECT asked direct questions to help get the student on track, yet the ECT did not scaffold away challenge or give the student the answer.
The second-grade ECT interacted with two colleagues daily between the fall of 2016 and the spring of 2017, as reported in the spring of 2017. In the winter of 2017, the first colleague reported that the expectations associated with state standards and tests are inhibiting to some extent or had no effect (scoring a 0, lower than the average in our study), while the network member used evaluation criteria, results, and state standards for planning frequently or always (about average for our study). The interpretation score for this colleague was −0.111. The second colleague held more negative interpretations, with a score of −0.5. In addition, the ECT named two colleagues for whom we did not have data. Thus, the exposure term was (−0.111 × 5) + (−0.5 × 5) = −3.1 when frequency of interaction and number of colleagues were taken into account. The ECT’s MKT measured in winter was −0.557.
Different from the fall, in the spring of 2017, the students were learning to tell the time to the hour and half-hour. The ECT’s instruction was procedural, characterized by the students providing short answers to the ECT’s questions—for example, “What time is it?” and “Write 9:00 on the digital clock.” The ECT scaffolded away challenge for the students by telling them directly what the time was. The ECT did not ask the students how they got to the answer or solicit student thinking. Noticeably, the ECT’s scores for all areas of TRU Math declined (Mathematics = 1.75; Cognitive Demand = 1.38; Agency, Authority, and Identity = 1.29; Uses of Assessment = 1.33).
Focusing on changes in the cognitive demand dimension (which had the strongest results in our quantitative models), the first ECT’s score increased from 1.36 to 2.94, while the second teacher’s score decreased from 2.33 to 1.38. Furthermore, their MKT scores were almost identical (−0.678 for the first, −0.557 for the second, with the difference less than 0.14 standard deviation). Therefore, any underlying capacities and dispositions that might affect their ambitious instruction likely overlapped considerably. But critically, the first ECT increased her level of ambitious instruction in the presence of colleagues who had positively interpreted curricular standards, standardized tests, and evaluation criteria. The second reduced her ambitious instruction level—especially on Cognitive Demand; Agency, Authority, and Identity; and Uses of Assessment—in the presence of colleagues who had negative interpretations of accountability pressures and curricular standards. Most important, these ECTs demonstrate a specific connection between interpretation of colleagues and changes in practices. And because they taught in the same district, the differences were not due to the district’s choice of curriculum, provision of professional development, or central office policies. While these are just two examples, what we observe for these two teachers is consistent with the trends we observe across the data, which also includes controls for district contexts.
Correlates of Exposure to Network Members’ Interpretations
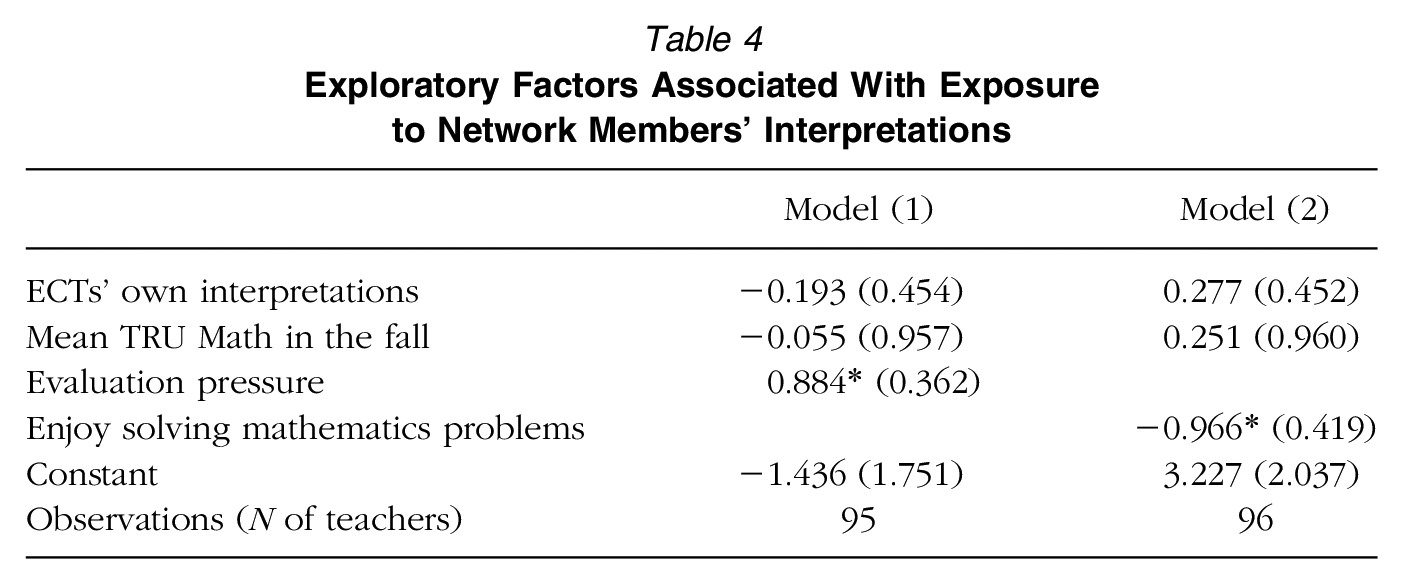
Our previous results illustrate how exposure to others’ interpretations of accountability pressures and curricular standards predicts an ECT’s classroom instruction. Therefore, here we explore the correlates of exposure to others’ interpretations to gain an initial understanding of how ECTs might cultivate resources and supports in their networks. In Table 4, we report the results for two predictors of interest separately as a basis for future exploration (the two are correlated at −.1). Interestingly, the ECTs’ interpretations of evaluation pressure were positively related to the interpretations of their network members. This could be because those who perceive evaluation pressure sought colleagues with positive interpretations they could draw on (although it is also possible that those with colleagues who had positive interpretations of standards and tests came to perceive more evaluation pressure). Second, the ECTs who reported enjoying solving mathematics problems were less likely to identify network members who positively interpreted curricular standards and standardized tests. It may be that the ECTs who enjoyed solving mathematics problems on their own were less likely to seek help in interpreting curricular standards and standardized tests (although it could be that teachers whose network members are less supportive come to enjoy solving problems on their own). Again, we emphasize that these analyses are exploratory and should only be interpreted as indicators of foci for future study.
Exploratory Factors Associated With Exposure to Network Members’ Interpretations
Note. Models include fixed effects for year and for districts as well as indicators for three teachers who had multiple years of data and differed significantly from those who had only 1 year of data. Only cases with no missing data were used. ECT = early-career teacher; TRU Math = Teaching for Robust Understanding in Mathematics.
p ≤ .05. **p ≤ .01. ***p ≤ .001.
Discussion
The current educational climate, including accountability pressures and curricular standards, places a complex set of demands on schools and teachers. These demands may create fundamental challenges that teachers have to face now and in the immediate future. Our unique data featuring classroom observations of ECTs’ instructional practices as well as survey measures of social networks of ECTs and their network members allow us to estimate how ECTs’ and their network members’ interpretations of accountability pressures and curricular standards affect ECTs’ instructional practices. In particular, we found that ECTs whose colleagues interpreted accountability pressures and curricular standards to be supportive and accounted for teacher evaluation and curricular standards in their planning were more likely to increase their enactment of ambitious mathematics instruction.
Our finding suggests an important extension of the sensemaking literature. Sensemaking is critical for members of organizations to navigate between potentially conflicting demands and obligations (Weick, 1995). In the context of this study, how teachers interpret multiple forces shapes the decisions they make about teaching (Herbst & Chazan, 2012). But given ECTs’ limited experience and limited local knowledge, it is entirely reasonable that their instruction would rely on the interpretations of their colleagues. That is, there may be a transfer in the sensemaking process from the interpretations of network members to an ECT’s practice. This transfer process adds to the development of sensegiving (e.g., Gioia & Chittipeddi, 1991) and collective sensemaking (Coburn, 2001) under the general category of social sensemaking (Maitlis, 2005). Furthermore, the transfer may not only help ECTs reduce the costs of interpreting a complex environment but can also create quasi ties connecting ECTs to the collective of the school (Frank, 2009), helping to keep the school from polarizing around different responses to external pressures (Frank, Xu, et al., 2018).
Our findings also have important implications for who has agency in implementing new reforms or responding to new institutional pressures. Certainly, teacher education programs have moved toward preparing ECTs for more ambitious instruction (e.g., Forzani, 2014). But that preparation alone may not be adequate because such ambitious instruction must be locally adapted to student composition, the school’s curriculum, and the pedagogy of others in the school, all of which may contribute to the organization’s response to external forces. Thus, others have identified the importance of district effects, for example, through formal professional development, choice of curriculum, or a formal mentoring program for all teachers (e.g., Desimone, 2009; Strong, 2009). To those we add the importance of building level colleagues’ interpretations as an informal aspect of professional development for ECTs.
Implications
Our results have important implications for the distribution of support for ECTs. If critical support comes from immediate networks, then an ECT with a more supportive network, in terms of positive interpretations of accountability pressures and curricular standards, should have greater potential for enacting ambitious mathematics instruction. The success of ECTs depends not merely in applying their preparation to their classroom but also in cultivating a network that can provide insights and support based on experience that they do not yet have.
But much of social capital is formed as a by-product (Coleman, 1988) of other behaviors and actions chosen for their immediate contribution to productivity. Therefore, administrators should consider the implications of other decisions such as room assignments (Spillane et al., 2017) and implementation of innovations (Frank, Xu, et al., 2018) for their unintended effects on the formation of teachers’ networks. Of course, many schools face immediate demands for specific actions. Therefore, we call on other stakeholders to give administrators the discretion to balance immediate demands with investment in social capital for future needs (Frank, 2014).
Administrators can directly mitigate potential deficiencies in ECTs’ networks by helping ECTs cultivate supportive networks. This goes beyond assigning a formal mentor or formal induction program (Glazerman et al., 2010). Instead, administrators may provide the conditions for ECTs to identify the supports they need. This may come in the form of provision of instructional support staff (e.g., instructional coaches), who are ideally suited to play the translational role between pressures external to the school and practices within the school (Galey-Horn, in press). The school could gain extra leverage from instructional support personnel if they are specifically trained to work with ECTs. The school might also develop high-quality professional learning communities, from which ECTs might identify supportive colleagues (Horn et al., 2020) who can help improve teacher retention (Gu, 2014; Ingersoll & Smith, 2004; Le Cornu, 2013). Or the school can arrange for release time or monetary incentives for teachers identified by the ECT to provide support. Thus, our study helps identify critical new forms of support that schools might offer ECTs (Smith et al., 2018). Furthermore, we encourage teacher-training programs to consider helping ECTs learn to navigate and cultivate networks in their schools that will support high-level practice (Bausell & Glazier, 2018; Fox & Wilson, 2015; Mansfield et al., 2016), just as training programs for other young professionals do (Uzzi & Dunlap, 2005).
The provision of support is not isolated from other aspects of an ECT’s professional life. As colleagues provide professional support, they undoubtedly shape the identity of an ECT (Rodgers & Scott, 2008). Also, given the professional challenges ECTs face, professional support may also help sustain them emotionally (e.g., Lasky, 2005) and help ECTs maintain their commitment to the profession (Allensworth et al., 2009). Finally, those providing professional support may also convey other forms of support an ECT may need (Glazerman et al., 2010).
Even with these supports, ECTs may find it challenging to seek and access help within their schools. Frank et al. (2004) describe a social capital exchange in which novices exchange their conformity for access to expertise. Since ECTs have little local knowledge or relative expertise, they may feel compelled to adopt the norms and practices of others in their school in order to access the local knowledge critical for their success. Not surprisingly, many ECTs seek resources on social media outside their school (Opfer et al., 2018; Risser, 2013; Torphy & Drake, in press), in part because it is an arena in which they do not have to trade their conformity for access to expertise. Administrators must be thoughtful in guiding how ECTs use these interorganizational networks.
Limitations
We find that ECTs’ networks are related to their own disposition toward mathematics and their perceptions of evaluation pressures. There may be a causal link: Those who do not enjoy solving mathematics problems or who perceive external evaluation pressures may be more likely to seek helpful colleagues. But unlike our primary analysis, which is based on longitudinal data, this exploratory analysis is based on only cross-sectional data. Therefore, we are very cautious and call for further study of the factors affecting who teachers seek in their networks (e.g., Wilhelm et al., 2016), but with specific emphasis on ECTs.
Because our study is focused around ECTs, we have only a small number of focal teachers per school in our sample. As a result, we have limited capacity to examine the effects of collective sensemaking, or more broadly of school culture. This would likely include contributions from administrators and instructional coaches (Coburn, 2001; Domina et al., 2015; Galey-Horn, in press). Future studies might consider saturated samples of educators (including administrators, coaches, and teachers) in schools to fully explore the school-level social dynamics in which sensemaking occurs. We also focused on the sensemaking process that occurs from fall to spring within a single school year. Future studies could involve sustained data collection over multiple years to study ongoing sensemaking, although it is not clear what form of data collection would be optimal (e.g., repeated teacher interviews or surveys, teacher journals). Such studies would allow one to better track the diffusion of professional development experienced by school colleagues and then spilling over to ECTs (Sun et al., 2013). Such studies might also attend more carefully to the content of professional development (e.g., Desimone, 2009) and how professional development interacts with a teacher’s networks (Frank et al., 2011).
Our analyses are based on a sample of elementary teachers in the upper Midwest. We believe the sample is adequate to represent the intraschool processes we studied, but it may not represent broader populations, including middle or high school teachers, teachers in urban districts, or those in other parts of the country. Our sample is also more likely to have a general certification and to have majored in education than nationally representative teachers. It is possible that this makes our results conservative, as teachers with less training than those in our sample or with training in specific areas may well have greater need to rely on their colleagues to make sense of institutional pressures in unfamiliar contexts. But this should be studied further.
Our sample included mostly White teachers (90%), which is similar to the national average for elementary schools (86% White). But further studies should focus carefully on teachers from underrepresented populations and how they form and respond to their networks, affecting interactions with students (Skiba et al., 2014). In a theory of critical sensemaking, Helms-Mills et al. (2010) argue that there may be power differentials within an organization that affect whose sensemaking dominates a narrative. This may be especially profound when a power differential between an ECT and a veteran teacher intersects with race. Helms-Mills et al. further point out that organizations can accentuate or mitigate existing power differences by creating opportunities for interaction or influencing what is valued in the organization. Further study also is needed to generalize to urban contexts that may perceive stronger pressures on test scores and evaluation that might affect instruction (Crocco & Costigan, 2007; Diamond & Spillane, 2004).
Conclusion
Our study goes beyond the isolated experiences of the ECT by examining the social networks of an ECT’s professional life. Because these networks reside in the school, our study helps us understand the role of the school as an organizational force that mediates between preservice training experiences and the immediate pressures of external institutions. The socialization process through intra-organizational networks has implications for how today’s ECTs will teach now and in the future and how they in turn will inculcate the next generation of teachers.
Supplemental Material
Online_Appendices – Supplemental material for From Interpretation to Instructional Practice: A Network Study of Early-Career Teachers’ Sensemaking in the Era of Accountability Pressures and Common Core State Standards
Supplemental material, Online_Appendices for From Interpretation to Instructional Practice: A Network Study of Early-Career Teachers’ Sensemaking in the Era of Accountability Pressures and Common Core State Standards by Kenneth A. Frank, Jihyun Kim, Serena J. Salloum, Kristen N. Bieda and Peter Youngs in American Educational Research Journal
Footnotes

Notes
K
J
S
K
P
References
Supplementary Material
Please find the following supplemental material available below.
For Open Access articles published under a Creative Commons License, all supplemental material carries the same license as the article it is associated with.
For non-Open Access articles published, all supplemental material carries a non-exclusive license, and permission requests for re-use of supplemental material or any part of supplemental material shall be sent directly to the copyright owner as specified in the copyright notice associated with the article.
