



Abstract
This article documents the patterns of White-Black and White-Hispanic enrollment gaps in Advanced Placement (AP) and Dual Enrollment (DE) programs across thousands of school districts in the United States by merging several data sources. We show that the vast majority of districts have racial enrollment gaps in both programs, with wider gaps in AP than DE. Results from fractional regression models indicate that geographic variations in these gaps can be explained by both local and state factors. We also find that district-level resources and state policies that provide greater access to AP and DE are also associated with wider racial enrollment gaps, implying that greater resources may engender racial disparity without adequate efforts to provide equitable access and support for minority students.
Advancement Placement (AP) and Dual Enrollment (DE) are the two most popular programs that allow students to earn college credits while in high school (College Board, 2017). In the 2015–2016 school year, for example, 71% of high schools offered at least one AP course and 69% offered DE opportunities (U.S. Government Accountability Office [GAO], 2018). Both are fast growing. The number of DE participants grew from 680,000 in the 2002–2003 school year to 1.4 million in 2010–2011 (the most recent national count of DE participants), and the number of AP examinees doubled from 1 to 2 million in the same timeframe (College Board, 2017; Supplementary Appendix Figure A1 available in the online version of the journal). The fast growth of AP and DE programs is rooted in the several advantages these college acceleration strategies could potentially offer, including increasing students’ competitive edge in the college application process, reducing the cost and time it takes to receive a postsecondary degree, better preparing students for college coursework and therefore easing students’ transition from high school to college (e.g., An & Taylor, 2019; Hemelt et al., 2019; Klopfenstein & Thomas, 2009).
Despite the myriad benefits AP and DE programs presumably offer, and the fast growth of these programs nationwide, a number of reports identify noticeable racial disparities in students’ participation in these programs (e.g., Education Trust, 2013; ExcelinEd, 2018; U.S. GAO, 2018). However, little is known about how racial gaps are distributed geographically and what factors may mitigate or exacerbate these disparities. These racial gaps could vary depending on a number of economic, demographic, and policy variables. Understanding factors that contribute to, or mitigate, racial gaps in students’ AP and DE participation could provide insights on policies that can be potentially implemented at scale to reduce these gaps.
Using a newly available national census of AP and DE participation among U.S. high school students in the 2015–2016 school year, this study provides a detailed descriptive analysis of the patterns of White-Black and White-Hispanic enrollment gaps in AP and DE programs within thousands of school districts in the United States. We begin by describing the geographic patterns of overall AP and DE participation rates and racial gaps among school districts to provide a rich portrait of how communities across the country have developed these college acceleration opportunities with varying success at providing equitable access. Our results reveal substantial differences in geography between AP and DE participation rates, where AP participation appears to be overrepresented in more coastal and urban areas, whereas DE participation is more concentrated in the middle of the country. Beyond the geographic differences between AP and DE participation overall, both programs have wide variations in racial participation gaps between White students and their Black and Hispanic peers across school districts, where the White-Black AP enrollment gaps are particularly pronounced. Yet, although the majority of districts have racial gaps in both AP and DE participation rates, a nontrivial number of districts are associated with high enrollment rates among minority students as well as low White-minority gaps in AP and DE participation, providing some encouraging signs that the problem can be improved.
In light of the substantial variation in overall enrollment rates as well as racial equity gaps in AP and DE participation rates across districts, the rest of the article focuses on understanding the extent to which these variations can be explained by observable local and state factors. Building on the existing studies on AP and DE enrollment as well as the broader literature on racial disparities in educational choices and outcomes, we focus on six sets of factors that theories and existing literature suggest may be correlated with racial disparities in AP and DE participation: (1) student academic preparation prior to high school, (2) family socioeconomic background, (3) racial composition in a district, (4) between-school income segregation and racial segregation, (5) average characteristics of high schools in a district, and (6) state-level AP and DE policies.
Using fractional regression models, we find that the six categories of variables are all correlated with racial gaps in AP and DE participation, though to different extent. Among all the factors examined, differences in pre–high school achievement gaps between White and minority students are the strongest predictors of racial gaps in both AP and DE participation in a district. We find that controlling for White-minority achievement gaps almost reduces AP and DE racial participation disparities to zero. Second, even conditional on prior achievement gaps, a set of variables that measure the average characteristics of high schools in a district provides marginal benefits in predicting racial gaps in AP and DE participation. Most strikingly, we find that school resources that are associated with higher overall AP participation, such as the availability of gifted/talented programs in a district, average per-student instructional expenditure, and greater number of AP courses offered, also tend to be associated with wider racial gaps in AP enrollment rates, implying that greater resources may give rise to wider racial gaps without intentional efforts to provide equitable access and necessary structural support for racially minoritized students. The argument that resources and access alone are not sufficient in addressing equity gaps is also supported by our results on state-level predictors, where districts in states with stronger mandates on access to AP and DE programs (e.g., states require high schools/districts to offer AP and/or DE opportunities) are associated with wider White-minority participation gaps. Last, among the other state-level variables examined, districts in states with stronger financial support for DE participation are associated with smaller DE racial participation gaps, highlighting the importance of removing financial barriers to participation in college acceleration programs for students from less affluent backgrounds.
Background and Relevant Literature
Background About AP and DE
During the past six decades, there has been an increasing nationwide support for programs that allow high school students to earn college credit while in high school. The largest of these programs are Advanced Placement (AP) and Dual or Concurrent Enrollment (DE), which together enroll millions of high school students each year (College Board, 2017). AP is offered by the College Board and covers college-level curriculum content. It offers students the potential to earn college credits after students achieve a minimum score on a course-specific exam. Since its inception in 1955, AP has grown substantially: With more than 2.6 million exam takers in the academic year of 2015–2016, AP has become the largest mechanism through which high school students earn college credit in the United States. DE is the second largest, with roughly 1.4 million students participated in DE in 2010–2011. Different from AP programs, which are intended to be taken by high school students and are exclusively taught by high school teachers, DE is a broad category including many types of college course-taking arrangements, and are taught by either college instructors or college-approved high school teachers and through different modalities including at the college, at the high school, and online.
Researchers have noted several benefits of college acceleration programs on students’ postsecondary outcomes, particularly their potential to improve college attendance among underrepresented students (Berger et al., 2013; Klepfer & Hull, 2012). In addition to the policy and theoretical support for expanding programs that allow high school students to earn college credits, a number of studies have also provided empirical evidence for the benefits of AP and DE on student academic outcomes. Numerous studies of the AP program have compared the academic performance of non-AP and AP students, and generally found that AP students outperform their non-AP peers in a variety of academic achievement measures, such as ACT and SAT scores, college attendance rates, admission to selective colleges, college grade point averages (GPAs), college graduation rates, and time to degree (e.g., Ackerman et al., 2013; Flowers, 2008;; Klopfenstein, 2010). Interestingly, quotes from college administrators suggest that regardless of the score received on an AP exam, college admissions decisions may be favorably affected by a student’s AP participation alone (College Board, 2013). 1
In a similar vein, a number of quasi-experimental studies also identified positive impacts of DE participation on a variety of academic outcomes, including high school graduation, college enrollment, college persistence, college GPA, and postsecondary degree completion (e.g., Allen & Dadgar, 2012; An & Taylor, 2019; Hemelt et al., 2019; Karp et al., 2007; Miller et al., 2018; Speroni, 2011). A handful of studies also examined whether the benefits of DE vary for subgroup populations of students (e.g., students from low socioeconomic backgrounds vs. those from more affluent backgrounds) and the results are mixed (e.g., An, 2013; Karp et al., 2007; Miller et al., 2018; Speroni, 2011).
Existing Evidence on Racial Gaps in AP and DE Participation
Given the likely benefits of AP and DE enrollment on college success for students, racial gaps in participation rates would serve as important indicators of educational inequality. Unfortunately, persistent racial disparities exist in AP enrollment and success rates, where Black students are most underrepresented: According to the 10th Annual AP report by College Board (2013), Black students represent only 9% of AP test takers in 2013 despite making up 15% of the 2013 graduating class. In a similar vein, disparities are also observed in dual-credit participation by race. Using the High School Longitudinal Study of 2009, National Center for Education Statistics (NCES, 2019) reported lower participation rates in DE programs among Hispanic students (30%) and Black students (27%) than White or Asian students (both 38%). These national patterns of racial gaps in DE participation are echoed in studies using data from particular states. For example, based on administrative data from Texas, Miller et al. (2017) found that while DE participation rates generally increased during 2000 to 2015 for all students, there was a persistent racial gap in participation rates, which seem to enlarge over time.
While the existing evidence on national and state-level patterns of racial gaps in AP and DE participation provides useful information about overall educational inequality in college acceleration opportunities, these aggregate statistics are less informative about whether these gaps are smaller or larger across smaller geographic units, such as school districts, therefore making it difficult to identify local contexts and factors that produce and sustain these gaps. In this article, we address this knowledge gap by providing detailed descriptive analyses of the patterns of racial gaps in AP and DE participation across thousands of school districts, and by identifying state-and district-level factors that are correlated with these gaps.
Correlates of Racial Gaps in AP and DE Participation
We draw on a rich body of literature and theories about racial disparities in educational choices and outcomes to provide a framework outlining the complex relationship between both school-related and nonschool factors that may be associated with racial gaps in AP and DE participation. Specifically, we focus on six broad categories of factors: (1) student academic preparation prior to high school, (2) family socioeconomic background, (3) racial composition in a district, (4) between-school segregation, (5) average characteristics of high schools in a district, and (6) state-level AP and DE policies. Below we discuss each category briefly.
Academic Preparation Prior to High School
It is well known that most schools use performance standards to determine eligibility for college acceleration programs. Gaining the opportunity to participate in an AP class, for example, often requires teacher referral and demonstration of academic proficiency in a prerequisite course or (and) by having a minimum GPA. Similarly, most states use specific academic eligibility criteria for DE participation, such as acquiring teacher-written recommendations, having a minimum high school GPA, or passing state-determined postsecondary assessments. 2
Because of these criteria, students with lower academic preparedness and performance levels are less likely to enroll in AP and DE programs. Since underrepresented minorities on average have lower achievement test scores than White students (Fryer & Levitt, 2004; Hemphill et al., 2011; Reardon & Galindo, 2009; Reardon et al., 2015), the substantial and persistent racial achievement gaps are likely to result in racial gaps in participating in AP and DE programs. For example, using statewide data that track cohorts of Florida public high school students, Conger et al. (2009) found that the racial disparities in AP enrollment rates are reversed when they condition on students’ pre–high school achievement. In other words, Black and Hispanic students were more likely to enroll in AP coursework than White peers with similar academic achievement.
Family Socioeconomic Background
A broad and substantial body of literature has documented the strong association between family socioeconomic background and student educational choices and achievements (e.g., Dahl & Lochner, 2012; Duncan et al., 2011). An important driving force underlying such association is the variation in family’s economic resources. For example, Berliner (2009) documented the ways schools, students, and families are affected by dimensions of intense, concentrated, and isolated poverty. Family stress, food insecurity, crime, environmental contaminants, and residential mobility could all weaken parents’ ability to help children succeed in school. As a result, racial differences in income distribution imply that racial minority students may have less economic resources at home than their White peers, which could lead to different educational choices and outcomes. Taking AP and DE participation as an example, the costs associated with the programs, such as tuition for DE classes, fees for AP exams, and the costs associated with commuting to local college campuses may impose greater challenges for minority students who are more likely to come from low-income families on average.
In addition to economic resources, sociological explanations of the relationship between family socioeconomic background and student educational achievement have also emphasized differences among families in access to cultural capital that enables children to succeed in school (Bourdieu, 1977; Lareau, 2001). Originally proposed by Bourdieu (1977), the cultural capital theory indicates that parents from lower socioeconomic background may encounter greater constraints in the skills, knowledge, and norms that are required to assist their children effectively in making educational choices and succeeding in school (Farkas, 2003; Tramonte & Willms, 2010). In terms of participation in college acceleration programs, for example, parents with less education may have less experiences with these programs in their own education, and may have limited access to adequate information about college preparation and the process for enrolling in AP and DE courses. Indeed, using the HSLS: 09, NCES (2019) reported that students whose parents had higher levels of education more commonly took DE courses in high school; 42% of students whose parents had earned a bachelor’s degree or higher took these courses, whereas 26% of students whose parents had below bachelor’s degree took advantage of these opportunities. This implies that racial disparities in parental education are likely to contribute to racial gaps in AP and DE participation.
Between-School Segregation
In addition to students’ family socioeconomic background in shaping students’ access to and participation in college-accelerated programs, racial differences in students’ schooling experiences and opportunities may also result in racial gaps in AP and DE participation. A large volume of research has stressed how social inequalities are embedded in schooling experiences (e.g., Bourdieu, 1977; Hanushek, 1989). One of the major channels through which schools reproduce social inequality is through unequal school resources and opportunities that are linked to socioeconomic and racial/ethnic composition at a school. For example, using PISA (Programme for International Student Assessment) data from 2006, Montt (2011) highlighted ways schools reproduce inequality and a key finding relevant to our study is that achievement inequality seems to be a function of characteristics of educational systems themselves, such as variations in opportunities to learn and, particularly, the extent of between-school segregation.
Along a similar vein, there are between-school differences through which lower-resourced schools are less likely to have access to college acceleration opportunities. Indeed, college acceleration opportunities, such as AP and DE courses, are resource intensive. They require adequate and informed counseling staff, high-quality teachers, and supplementary course materials, all of which increase per-pupil expenditures. As a result, lower-resourced schools, which are attended disproportionately by low-income and minority students, often have fewer AP and DE course offerings. Indeed, using data from the Common Core of Data (CCD) and the Civil Rights Data Collection (CRDC), two recent reports—one by the U.S. GAO and the other by ExcelinEd—identified gaps in access to AP and DE at high-minority and high-poverty high schools. For example, GAO noted that over 80% of low-poverty schools offered at least one AP course, as compared with about 60% of high-poverty schools. In regard to DE courses, 73% of low-poverty schools offered DE coursework, as compared with 54% of high-poverty schools. ExcelinEd also identified racial disparities in access to AP and DE coursework, finding that 38% and 31% of high-minority high schools did not offer AP and DE coursework, respectively, whereas 48% and 33% of low-minority high schools did. These results indicate that between-school income and racial segregation may result in racial disparities in participating in college acceleration programs.
Racial Composition in a District
Together with between-school segregation, a district’s racial composition is part of the local context that shapes the constraints and opportunities available to students. Both cognitive developmental theories and social psychological theories provide frameworks for understanding how school racial composition may influence students’ engagement and performance. Drawing on the concept of “disequilibrium” originally proposed by Piaget (1985)—the notion that contradiction and discrepancy spur cognitive growth—the cognitive developmental perspectives posit that critical thinking and cognitive growth is fostered when a student encounters cognitive conflicts or contradictions (Gurin et al., 2002). Accordingly, racial diversity in the student body provides opportunities of exposure to diverse perspectives and discrepancies with past experiences, which may lead to mindful thoughts and cognitive development. Social psychological theories provide another framework for understanding how school racial composition may influence student school engagement. Specifically, this perspective stresses the fundamental human need to feel connected or belong to a community (Baumeister & Leary, 1995). Thus, having more same-raced peers who share similar cultural backgrounds can help an individual to feel more connected to school (e.g., Benner & Crosnoe, 2011; Benner et al., 2008). Integrating these two theoretical perspectives together, it seems that students may potentially benefit from both diversity in overall student composition and decent representation of same-raced peers. 3
A line of research attempts to uncover whether peer racial composition, as opposed to educational resources related to it, affects student achievement causally and the findings are fairly mixed (e.g., Angrist & Lang, 2004; Hanushek et al., 2009; Rivkin, 2000). For example, based on the sophomore cohort of the High School and Beyond Longitudinal Survey, Rivkin (2000) used a value-added approach to measure school quality. The study found that school racial composition per se is not related to Black students’ education or labor market outcomes. On the other hand, using a rich panel data of more than 200,000 students enrolled in over 3,000 public elementary students in Texas, Hanushek et al. (2009) exploited racial composition changes as a result of students switching schools and the cohort-to-cohort fluctuations in demographic composition. They found that a higher percentage of Black schoolmates reduces achievement for Black students to a much greater extent than for White students, implying that a greater concentration of Black students in a district may exacerbate racial achievement gaps between Black and White students.
Average Characteristics of High Schools in a District
Aside from disparities as a result of racial segregation between schools that vary in regard to educational resources, a student’s decision to enroll in AP and DE programs may also be influenced by policies and local contexts within a school. For example, using student-level data from Texas Schools for the 1998–1999 academic year, Klopfenstein (2004) found that students across all racial groups are more likely to take an AP course if they attend a school that is smaller, in an urban area, and implements a program that incentivizes teachers to receive additional training and students to take more difficult courses. She argued that these school characteristics may also reduce racial disparity in AP enrollment, as students from lower socioeconomic family backgrounds are likely to disproportionately benefit from these resources. In addition, she also found that the presence of magnet programs at a school is associated with larger gaps between White and Black students in AP participation. 4 She argued that this might be due to within-school ability tracking that operates along lines of race.
Indeed, a large volume of research has documented that within-school tracking and other forms of homogeneous ability grouping, such as gifted programs within a school, can exacerbate educational inequity by creating a situation where students are segregated along lines of race and socioeconomic background (Gamoran, 2010; Lucas & Berends, 2002; Oakes et al., 1992). Research consistently indicates that racial minority students and socioeconomically disadvantaged students are less likely to participate in gifted education programs and are more likely to be assigned to lower academic tracks (Kettler & Hurst, 2017; Taliaferro & DeCuir-Gunby, 2008). Students placed into lower tracks are rarely afforded an equal opportunity to catch up due to the curricular differences and tend to show increased achievement gaps over time compared with peers with similar initial achievement but were assigned to a higher track (Gamoran & Mare, 1989; Hoffer, 1992; Schofield, 2010). In addition, being placed into lower tracks may stigmatize students by labeling them as less academically capable (e.g., Carter, 2012; Modica, 2015; Oakes, 2005). This may harm the development of a positive academic identity and lead to lower educational aspirations and motivation, which could in turn result in lower rates of college participation and enrollment in college acceleration programs (Hauser & Anderson, 1991; Smith et al., 2010).
State-Level Policies About AP and DE
Finally, state-level AP and DE policies may either exacerbate or ameliorate racial gaps in AP and DE participation. For example, roughly three-quarters of states include AP and/or DE participation and performance measures in district accountability reports (Education Commission of the States [ECS], 2016). These measures are often required to be broken down by demographic groups. Even though mandates like this do not set thresholds to hold districts accountable for AP and DE participation, they do signal to schools that participation and inclusion is important. In addition, considering the additional costs associated with AP programs (such as AP test fees) and DE programs (such as tuition and the cost of books), financial support for students and institutions can also influence the level of participation in these programs, particularly among students from less affluent backgrounds (Dounay, 2007; Klopfenstein & Thomas, 2010). By 2016, 29 states had offered fee reductions or waivers to low-income students taking the AP exam, and 19 states either subsidized tuition costs or fully covered them to encourage DE participation.
Data and Methodology
Data Sources
We linked multiple publicly available data sources to document geographic patterns of AP and DE racial/ethnic enrollment gaps among school districts in the United States. We describe each data source below:
Civil Rights Data Collection
CRDC is a biennial survey of all public schools and school districts. The data collection on the 2015–2016 school year targeted 17,370 districts and 96,440 schools with 99.8% of districts certifying their submitted data. The CRDC has collected information on AP course taking and school characteristics previously, and the 2015–2016 survey included questions about DE program participation for the first time. 5
American Community Survey
American Community Survey (ACS) is an annual, nationwide survey that includes demographic, social, economic, and housing characteristics for school-age children. All iterations contain data for nation, states, and school districts. The data most relevant for our study come from the Education Demographic and Geographic Estimates (EDGE), which includes tabulations of demographic and socioeconomic characteristics of families who live in each school district in the United States and who have children enrolled in public school.
Common Core Data
Common Core Data (CCD) is an annual survey of all public elementary and secondary schools in the United States. The data include basic descriptive information on schools and school districts, including enrollment counts for each grade at each school.
Stanford Education Data Archive
Stanford Education Data Archive (SEDA) is a publicly available data set about American schools, communities, and student success. The data set includes a range of detailed data on educational conditions, contexts, and outcomes in school districts and counties across the United States. We specifically used district-level measures of academic achievement, in addition to racial and socioeconomic composition in our analysis.
Integrated Postsecondary Education Data System
Integrated Postsecondary Education Data System (IPEDS) is a system of interrelated surveys conducted annually by the U.S. Department of Education’s NCES (2019). IPEDS gathers information from every college, university, and technical and vocational institution that participates in the federal student financial aid programs. We specifically used latitude and longitude data from IPEDS for each college to calculate the nearest college to each high school.
Constructing Measures for AP and DE Participation
The 2015–2016 CRDC data provide new insight into the number of students participating in AP and DE. However, a major limitation of this dataset is that it only provides enrollments at the school level (instead of at the school-by-grade level). As a result, for high schools that also offer eighth grade and below, using total school enrollment as the denominator to calculate AP and DE participation rates is inappropriate, since CRDC specifically instructed districts and schools to only report AP and DE participants among students who are in Grades 9 through 12. In Supplementary Appendix B, we describe the selection criteria we used to identify eligible high schools to be included in our analytic sample, as well as our methodology for estimating the ninth- to 12th-grade enrollment counts for high schools that offer eighth grade or below. 6
Correlates of Racial Gaps in AP and DE Participation
Following the framework outlined in the section “Correlates of Racial Gaps in AP and DE Participation,” we estimate sources of variation in AP and DE racial participation gaps that fall within one of the following six broad categories: (1) student academic preparation prior to high school, (2) family socioeconomic background, (3) racial composition in a district, (4) between-school segregation, (5) average characteristics of high schools in a district, and (6) state-level AP and DE policies. Below, we briefly describe the variables included in each category. The full list of explanatory variables used and the data source for them are presented in Supplementary Appendix Table A1 (available online).
To capture academic preparation prior to high school, we include in our analysis a variable that measures the average pre–high school achievement in a district. This variable is available in the SEDA data and is based on standardized test scores taken by over 200 million students in Grades 3 through 8 for subjects English language arts and math. White-minority achievement gaps are calculated as the standardized difference in achievement between White and minority students.
We construct two variables to measure the average socioeconomic background of a district. The first measure is proportions of students eligible for free or reduced-price lunch, which was retrieved from CCD and indicates the percent of students in each school district eligible to receive a free or reduced-price lunch. The second measure is proportions of adults with a bachelor’s degree or higher in a district. This variable is available in the SEDA data set and was constructed using ACS-EDGE data for families with school-age children enrolled in public schools. White-minority gaps in both measures are also calculated and included in models that predict racial gaps in AP and DE participation.
We also construct three sets of variables to measure the local school context, including: (1) measures of racial and income segregation across schools within a school district constructed using the Thiel index, where higher values indicate greater levels of segregation; (2) indicators of racial/ethnic composition of a school district, measured as the proportion of Black or Hispanic students within a district; and (3) measures of average characteristics of high schools in a district, including proportions of students in a school district enrolled in urban schools, proportions enrolled in magnet schools, proportions enrolled in gifted and talented programs, average per-pupil instructional expenditures among high school students, average student-teacher ratios, and average student-counselor ratios. Given that DE opportunities rely on partnerships with local colleges, we also calculate the distance in kilometers to the closest 2– or 4–year public institution that offers dual enrollment or concurrent enrollment for each high school in our analytic sample and then take the average across districts. 7 Similarly, we also calculate the average number of AP courses offered at school to capture a district’s access to AP opportunities.
Last, we include state-level variables to reflect policies that either directly or indirectly influence AP and DE participation. 8 For AP enrollment, we identify nine relevant policies, grouped into three broad categories: (1) accountability and mandates surrounding access, (2) financial incentives and program support, and (3) accountability and mandates related to student outcomes. For DE enrollment, we identify 12 policies and group them into the same three broad categories listed above. Each category includes three values that indicate whether a state has strong, moderate, or weak AP (DE) policies for that category. A state is identified as having “strong” policies if it has at least half of the policies in place within a category, “moderate” if it has more than one but fewer than half of the policies in place, and “weak” if it has none or only one policy in place. 9 Details about the number and description of distinct policies included in each broad category are provided in Supplementary Appendix Table A2 (available online).
Empirical Model for Exploring Correlates of Racial Gaps
The outcome measures in our study, such as average AP participation rates in a district, follow a fractional response nature, which typically arises from averaged binary outcomes. Specifically, students either participated or did not participate in AP or DE programs. These binary responses were used to generate participation rates at the district level (see section “Constructing Measures for AP and DE Participation” and Supplementary Appendix B, for more detail). The AP and DE participation rate is therefore a continuous variable that is bounded between 0 and 1. Standard linear models are not appropriate in modeling fractional responses, as they can generate predictions that are greater than one and smaller than zero (Papke & Wooldridge, 2008). Building on the existing literature (Wooldridge, 2011), we instead use fractional logit regression with a logistic link that captures nonlinear relationships, especially when the value of the outcome measure is close to 0 or 1 to examine associations between district-level and state-level predictors and district participation rates.
It is important to note that our second set of outcome measures—racial gaps in participation rates—have a wider range than a normal fraction (i.e., they range from −1 to 1). We therefore perform a linear transformation to bound the racial gap variables between 0 and 1. Specifically, let W be the original outcome measure of racial gaps in AP or DE participation rates that is in [−1, 1]. Then, define Y = (W+ 1)/2, where Y would be in [0, 1]. This transformation allows us to use fractional logit regression to model the relationship between the transformed outcome measure Y and district-level predictors, which writes as follows:

where

which could be further written as

or,

In other words, the relationship between the racial gaps in DE participation Wi and district-level predictors Xi would be equal to two times b1 from Equation 1. To make the coefficients easier to interpret, we report the average marginal effect. 10 As a result, the coefficient indicates the average changes in the predicted probabilities given a one unit change in an independent variable (in the case of a continuous independent variable), or as the independent variable changes from 0 to 1 (in the case of a binary independent variable).
Results
Overall Patterns of AP and DE Participation
The top panel in Table 1 shows summary statistics for AP and DE participation among all the school districts in our sample. On average, districts had 11% participation rates in both AP and DE, with standard deviations of 12% and 14%, respectively, indicating that there are substantial variations across districts. Figure 1 further uses boxplot to show the distribution of district AP and DE participation rates visually by state (left and right panels, respectively), where states are ranked in descending order by the states’ median district participation rate. Overall, there is substantial variation in district AP and DE participation both within and across states. Interestingly, it seems that the states with the highest AP participation rates concentrate on the coastal areas (e.g., Maryland, California, Florida, etc.) while the states with the highest DE participation rates are in the middle of the country (e.g., Iowa, Wyoming, Kansas, etc.).
Summary Statistics for Advancement Placement (AP) and Dual Enrollment (DE) Participation and Racial Gaps

Note. The inclusion criteria used to construct the sample for overall AP (DE) participation is different from those used to construct the sample for racial enrollment gaps. Specifically, the sample for overall AP (DE) participation includes all school districts with at least 20 total student enrollments. The sample for racial enrollment gaps further restricts to districts with sufficient number of students for the two racial groups used to calculate the specified racial enrollment gap. For example, the sample for White-Black AP participation gap includes school districts with at least 20 White students and 20 Black students. Additionally, considering that it would be misleading to report a zero percentage point gap if the district had zero AP participation for both White and Black students, we further restrict the sample to districts that have a nonzero participation rate for at least one subgroup used in calculating the racial enrollment gap. Due to these additional sample inclusion criteria, the samples used for racial gaps are substantially smaller than the sample for the overall AP (DE) participation. Supplementary Appendix B describes these selection criteria in more detail. It should be noted that although there are substantial decreases in the number of districts as we restrict the analytic samples, these restrictions mainly exclude districts with very few students overall; as a result, districts that remain in the sample still cover at least two thirds of total students enrolled nationwide.
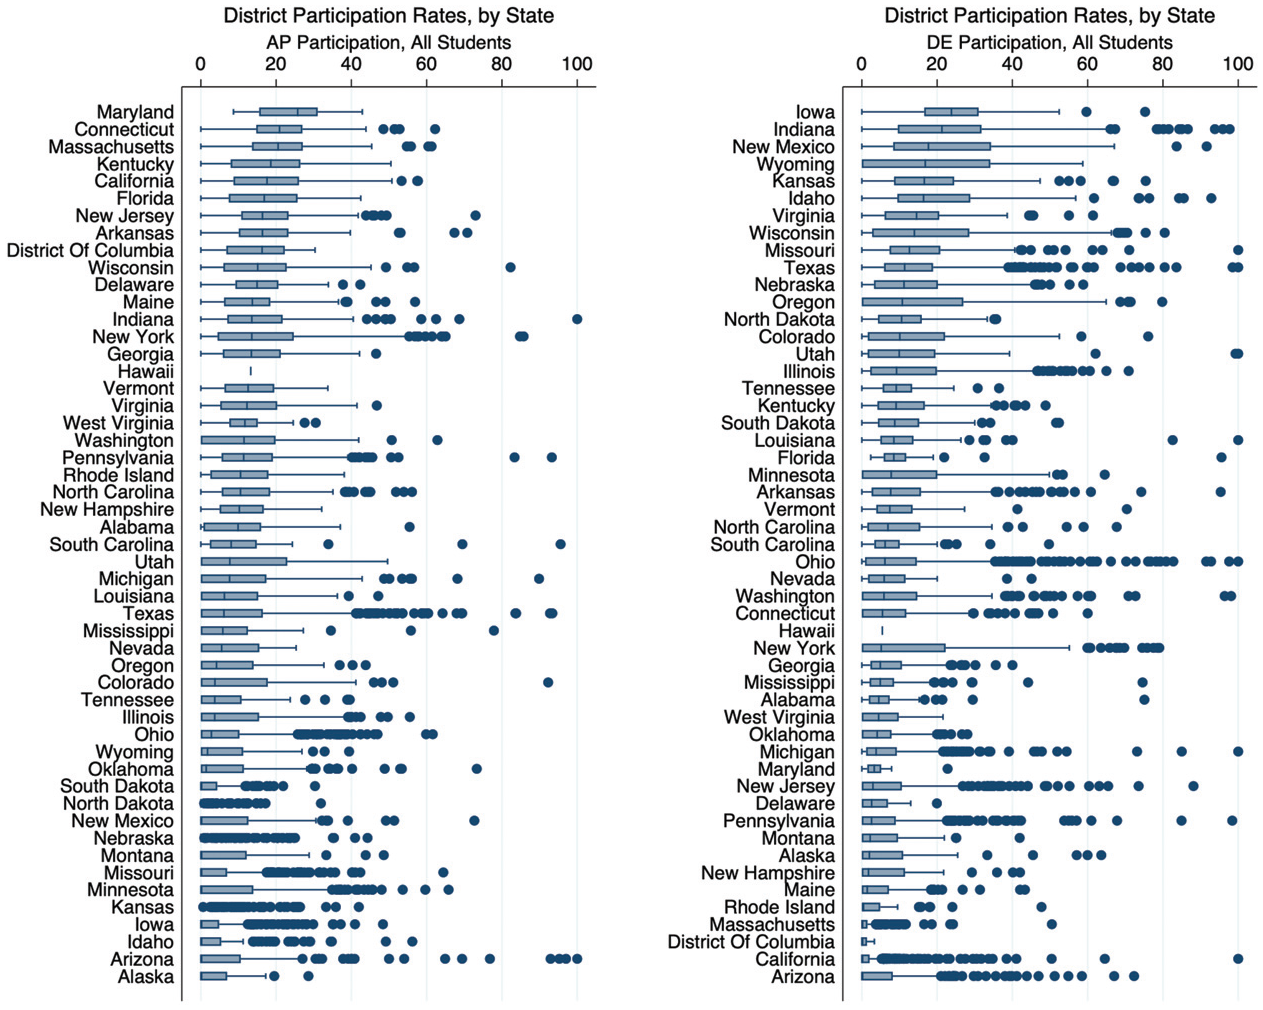
Distribution of Advanced Placement (AP) and Dual Enrollment DE participation rate among school districts, by state.
To provide a more detailed overview of the distribution of AP and DE participation rates across all the districts in our sample, Figure 2 presents choropleth maps of district AP and DE participation rates. These maps show districts geographically in progressively darker shades of gray, based on quintiles of district AP and DE participation rates. 11 Since we use the same coloring scheme for both the AP and DE choropleth maps, it allows us to compare participation rates between the two maps to gauge places of higher and lower AP or DE participation as well as regions that primarily offer AP or DE programs by comparing the color of a specific district or region between the AP and DE maps. For example, consistent with the patterns shown in Figure 1, districts in the middle of the country have higher participation rates in DE compared with AP, whereas districts in the coastal areas tend to have higher participation rates in AP.
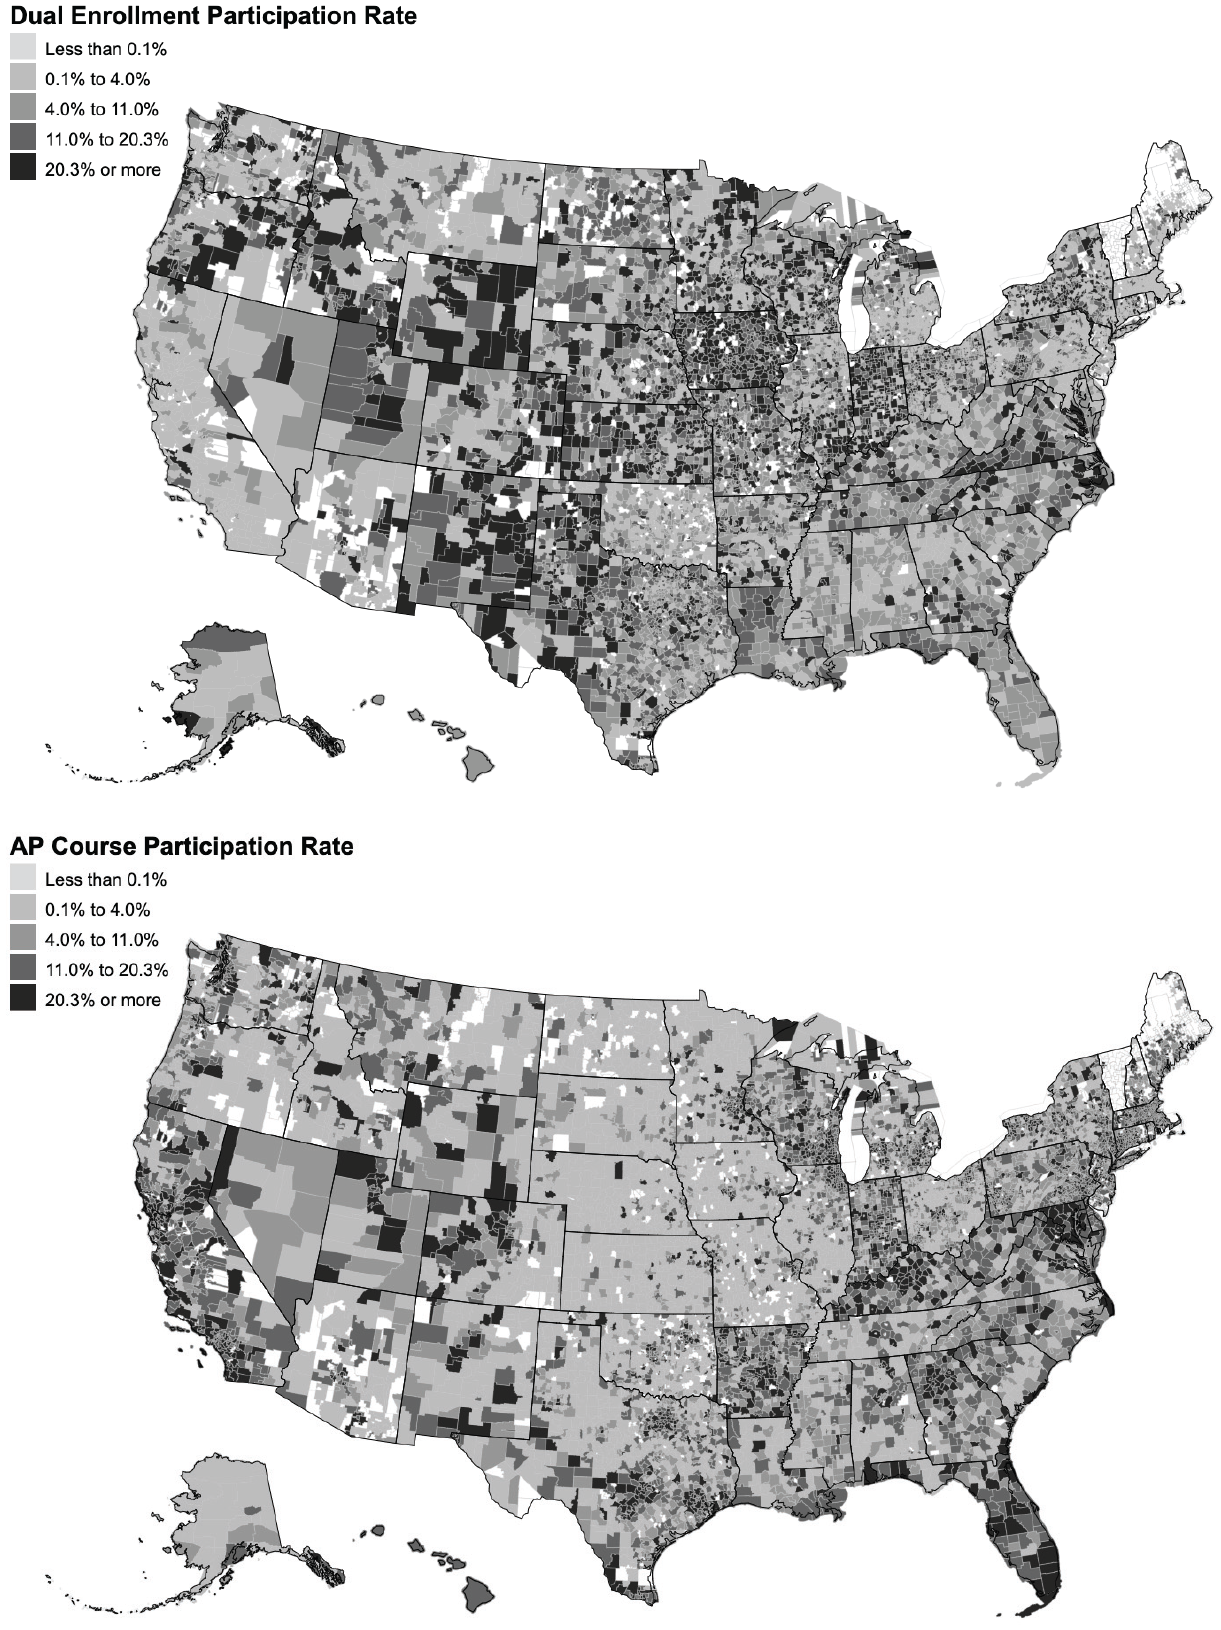
Maps of district Advanced Placement (AP) and Dual Enrollment (DE) participation rates.
Patterns of Racial Gaps in AP and DE Participation
The middle and bottom panels in Table 1 show summary statistics for racial gaps in AP and DE participation among school districts that met our inclusion criteria. 12 There are larger racial gaps in AP participation (9.8 and 6.9 percentage points for the White-Black and White-Hispanic gaps, respectively) than in DE participation (4.7 and 4.2 percentage point gaps for the White-Black and White-Hispanic gaps, respectively). The standard deviation for these gaps ranges between 7.2 to 9.1 percentage points, suggesting that there is large variation across districts in the size of racial gaps.
Figure 3 illustrates the distribution of district racial gaps in AP and DE participation within each state. Separately for White-Black and White-Hispanic gaps for AP and DE participation, states are ranked in descending order by the states’ median district gap. The figure reveals three main patterns. First, the 25th percentile of racial gaps are higher than zero in most of the states, suggesting that nationwide, the majority of districts have racial equity gaps in both AP and DE participation. This is more clearly shown in Figure 4 which presents choropleth maps of district White-Black and White-Hispanic gaps in AP and DE participation rates. 13 Second, there is substantial variation between districts within a state. At one extreme, some school districts have White-Black and White-Hispanic gaps that are greater than 50%. At the other end, however, some school districts actually have larger minority student enrollment in AP and DE programs than White enrollment. 14 Finally, it seems that a number of states that have the highest AP and DE participation overall, as shown in Figure 1, also have relatively higher racial gaps in AP and DE enrollment. For example, among the top 10 states in overall AP enrollment, seven of them are among the top one third of states with the largest White-Black AP enrollment gaps.
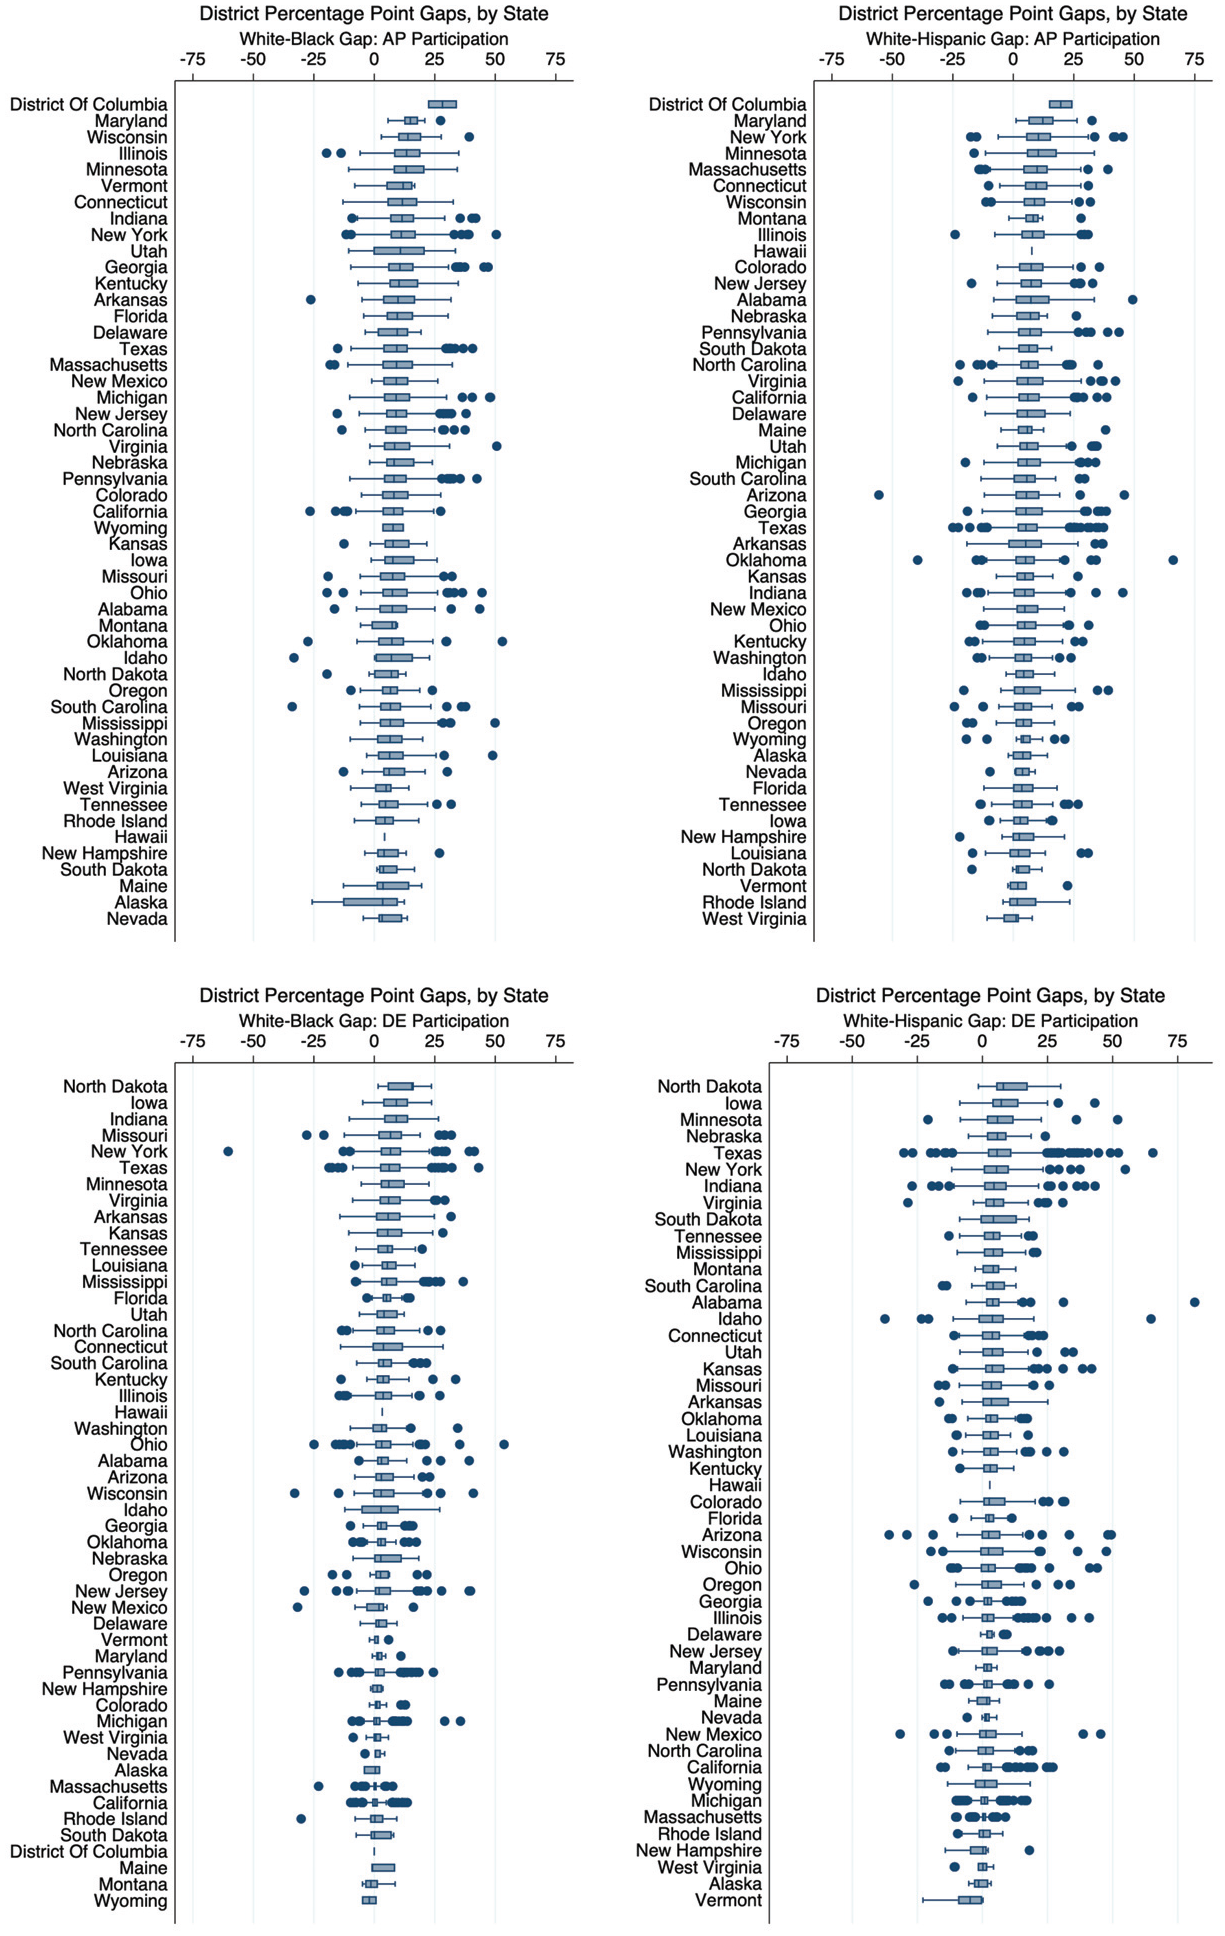
Distribution of racial equity gaps in Advanced Placement (AP) and Dual Enrollment (DE) participation among school districts, by state.
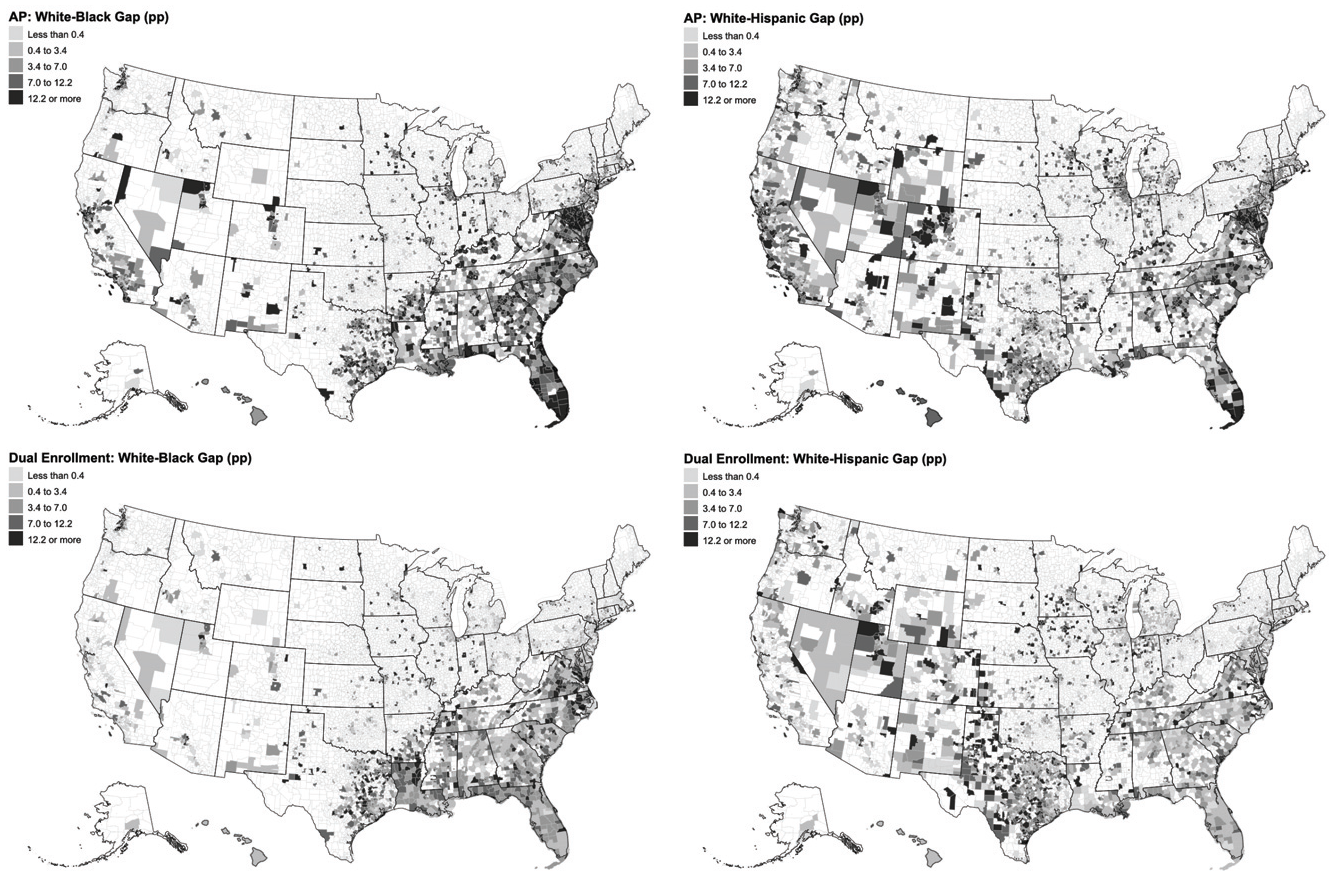
Quintile maps of district racial equity gaps in Advanced Placement (AP) and Dual Enrollment (DE) participation.
In light of the results presented above, we then examine whether there are districts where minority students have both high AP and DE participation rates and where White-minority gaps are small. In identifying these “star districts,” we first narrow down to districts where the AP (DE) participation rates among the specified minority group reach above the national median. We then further zoom in on districts with a White-minority gap below 1 percentage point in AP (DE) enrollment rates to identify districts where minority students do well in both absolute levels and relative to their White peers. Among the thousands of districts examined, we identify 318 star districts in term of AP enrollment among Black students (i.e., districts that have above-median AP enrollment among Black students and also below 1 percentage point White-Black AP participation gap), 649 districts in AP enrollment among Hispanic students, 595 districts in DE enrollment among Black students, and 968 in DE enrollment among Hispanic students. The overlap among the four categories of districts is fairly small, where only 15 districts are “stars” in all four categories.
To better understand the characteristics of districts with high minority enrollment rates and smaller racial gaps, Table 2 provides the summary statistics for these “star districts” using both the district- and state-level variables grouped into six broad categories. To ease interpretation, we standardize all the continuous variables (such as number of AP courses offered). Thus, a positive value for a continuous variable indicates that the districts have an average value that is above the national average. In a similar vein, for the binary variables (such as whether the district is in a state with strong financial incentives for AP/DE participation), we report the difference between the average value and national average.
Districts With Above-Median Enrollment Rates Among Black/Hispanic Students and <1 Percentage Point Racial Enrollment Gap
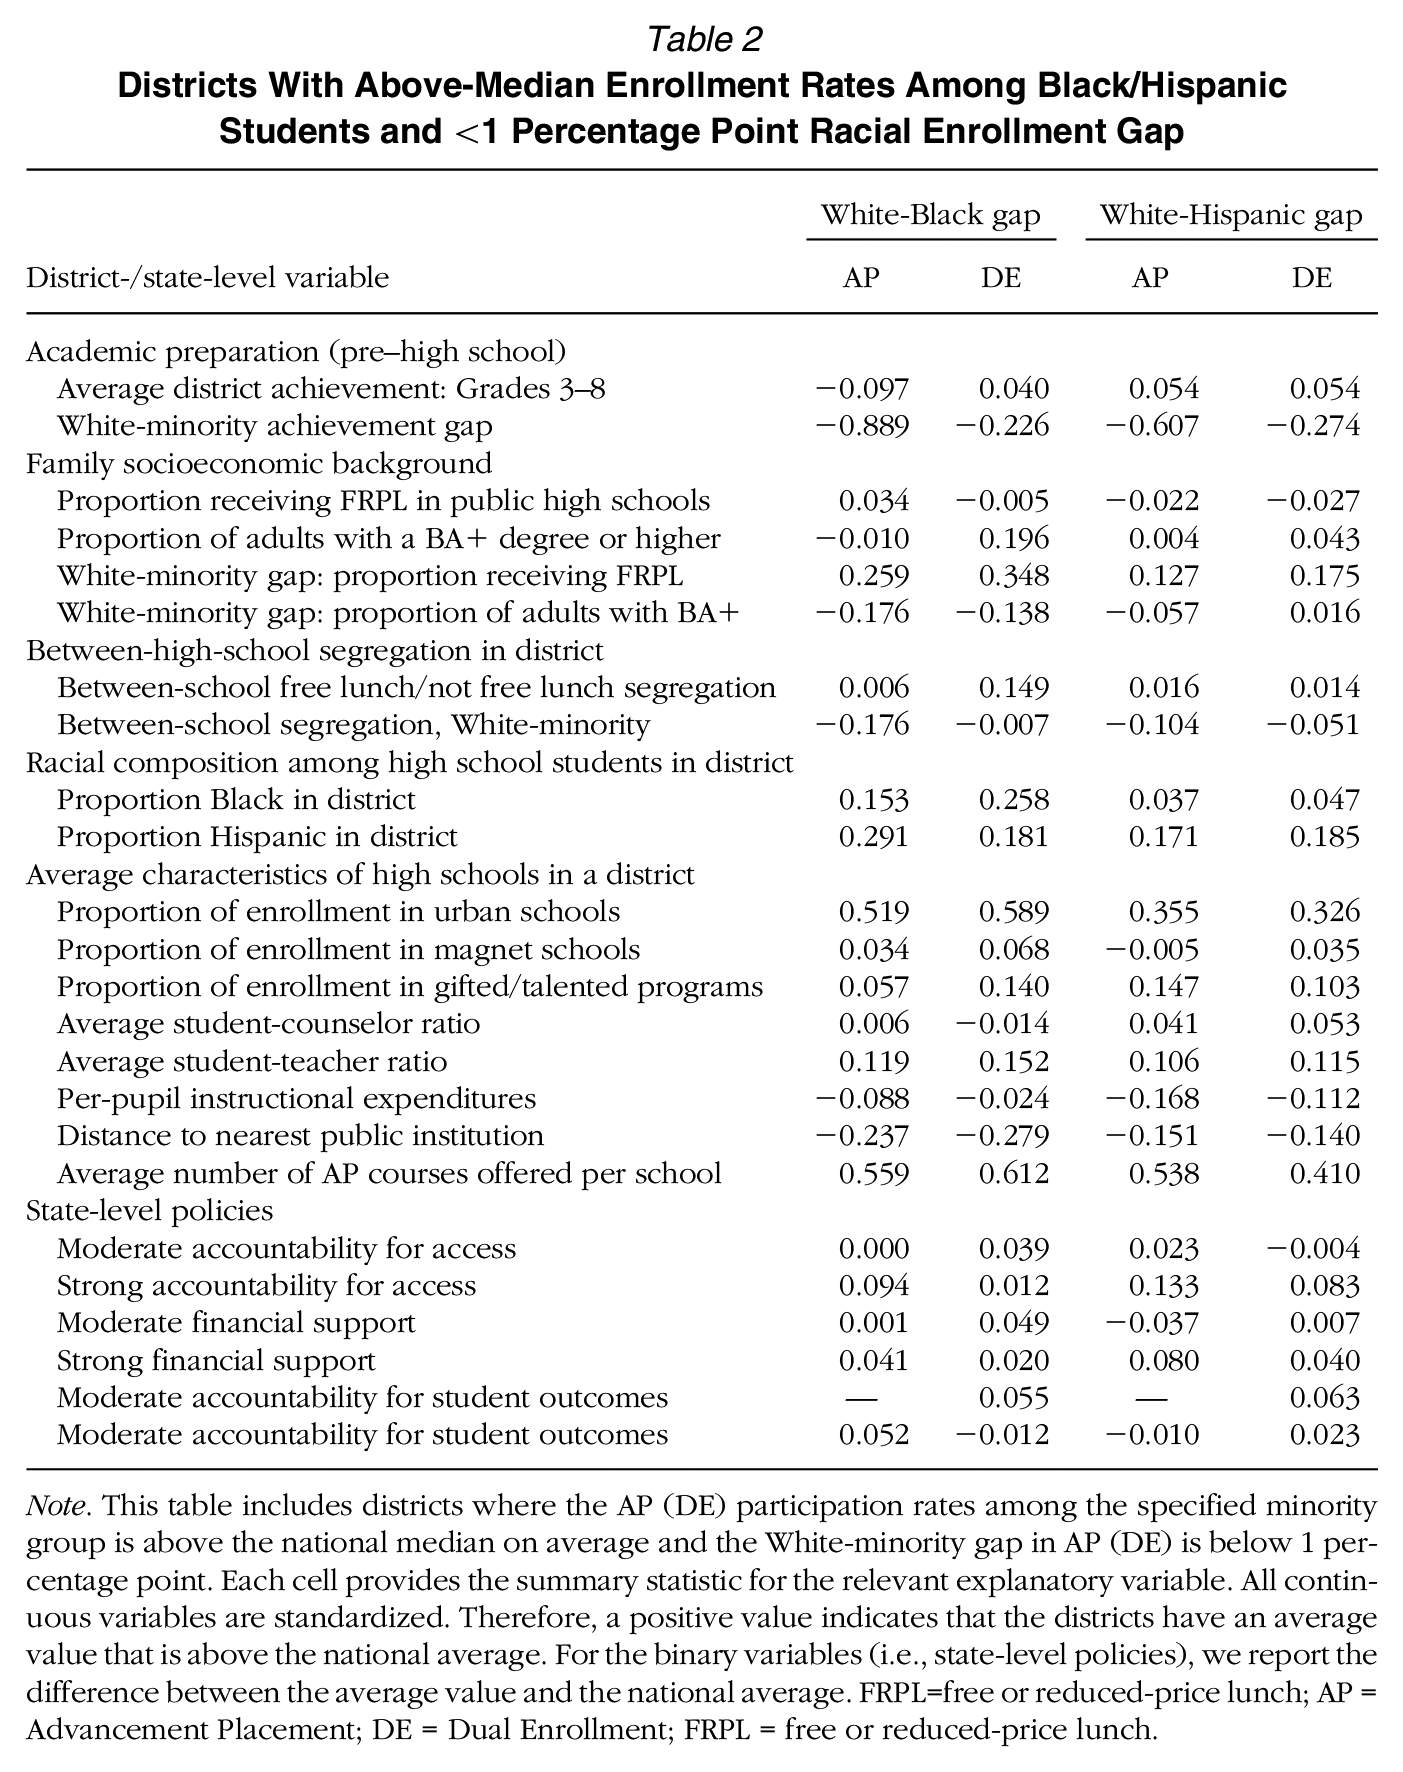
Note. This table includes districts where the AP (DE) participation rates among the specified minority group is above the national median on average and the White-minority gap in AP (DE) is below 1 percentage point. Each cell provides the summary statistic for the relevant explanatory variable. All continuous variables are standardized. Therefore, a positive value indicates that the districts have an average value that is above the national average. For the binary variables (i.e., state-level policies), we report the difference between the average value and the national average. FRPL=free or reduced-price lunch; AP = Advancement Placement; DE = Dual Enrollment; FRPL = free or reduced-price lunch.
Although the summary statistics vary widely across the four groups of “star districts,” shared patterns still emerge for a number of district-level and state-level variables. Overall, it seems that these districts tend to have substantially smaller White-minority gaps in both pre–high school achievement and income (as measured by eligibility to free or reduced-price lunch at school). They also tend to be more racially diverse than the national average, more likely to be located in urban areas, closer to local postsecondary institutions, and have a greater number of AP courses offered. Interestingly, these districts do not seem to be necessarily better resourced in general than the national average. For example, districts in all four categories have a student-teacher ratio that is above the national average, and a per-pupil instructional expenditures below the national average. Finally, these districts seem to concentrate in states with stronger accountability regarding access and financial support for AP and DE participation.
Taken together, these raw descriptive patterns seem to suggest that star districts tend to have lower racial baseline gaps, greater access to college acceleration opportunities, and have stronger financial support. In the next section, we use regression adjusted models to identify the relationship between specific variables and AP (DE) gaps holding other factors constant.
Correlates of AP and DE Participation
We begin by estimating the correlations between these factors and overall AP and DE participation in a district using fractional logit regression models explained in the section “Empirical Model for Exploring Correlates of Racial Gaps.” Since all the continuous variables are standardized, the coefficient of a continuous variable indicates the changes in AP or DE participation rates given a 1–standard deviation change in that variable. The results are presented in Table 3 and reveal three general patterns. First, a handful of local-level factors are correlated with greater levels of participation in both AP and DE programs. Specifically, districts that have greater levels of between-school income segregation are related to lower levels of participation in AP and DE programs. In contrast, per-pupil instructional expenditures and academic acceleration opportunities before high school, such as the proportion of students enrolled in gifted and talented programs, are associated with higher levels of AP and DE participation.
Regression Estimates Predicting Advancement Placement (AP) and Dual Enrollment (DE)
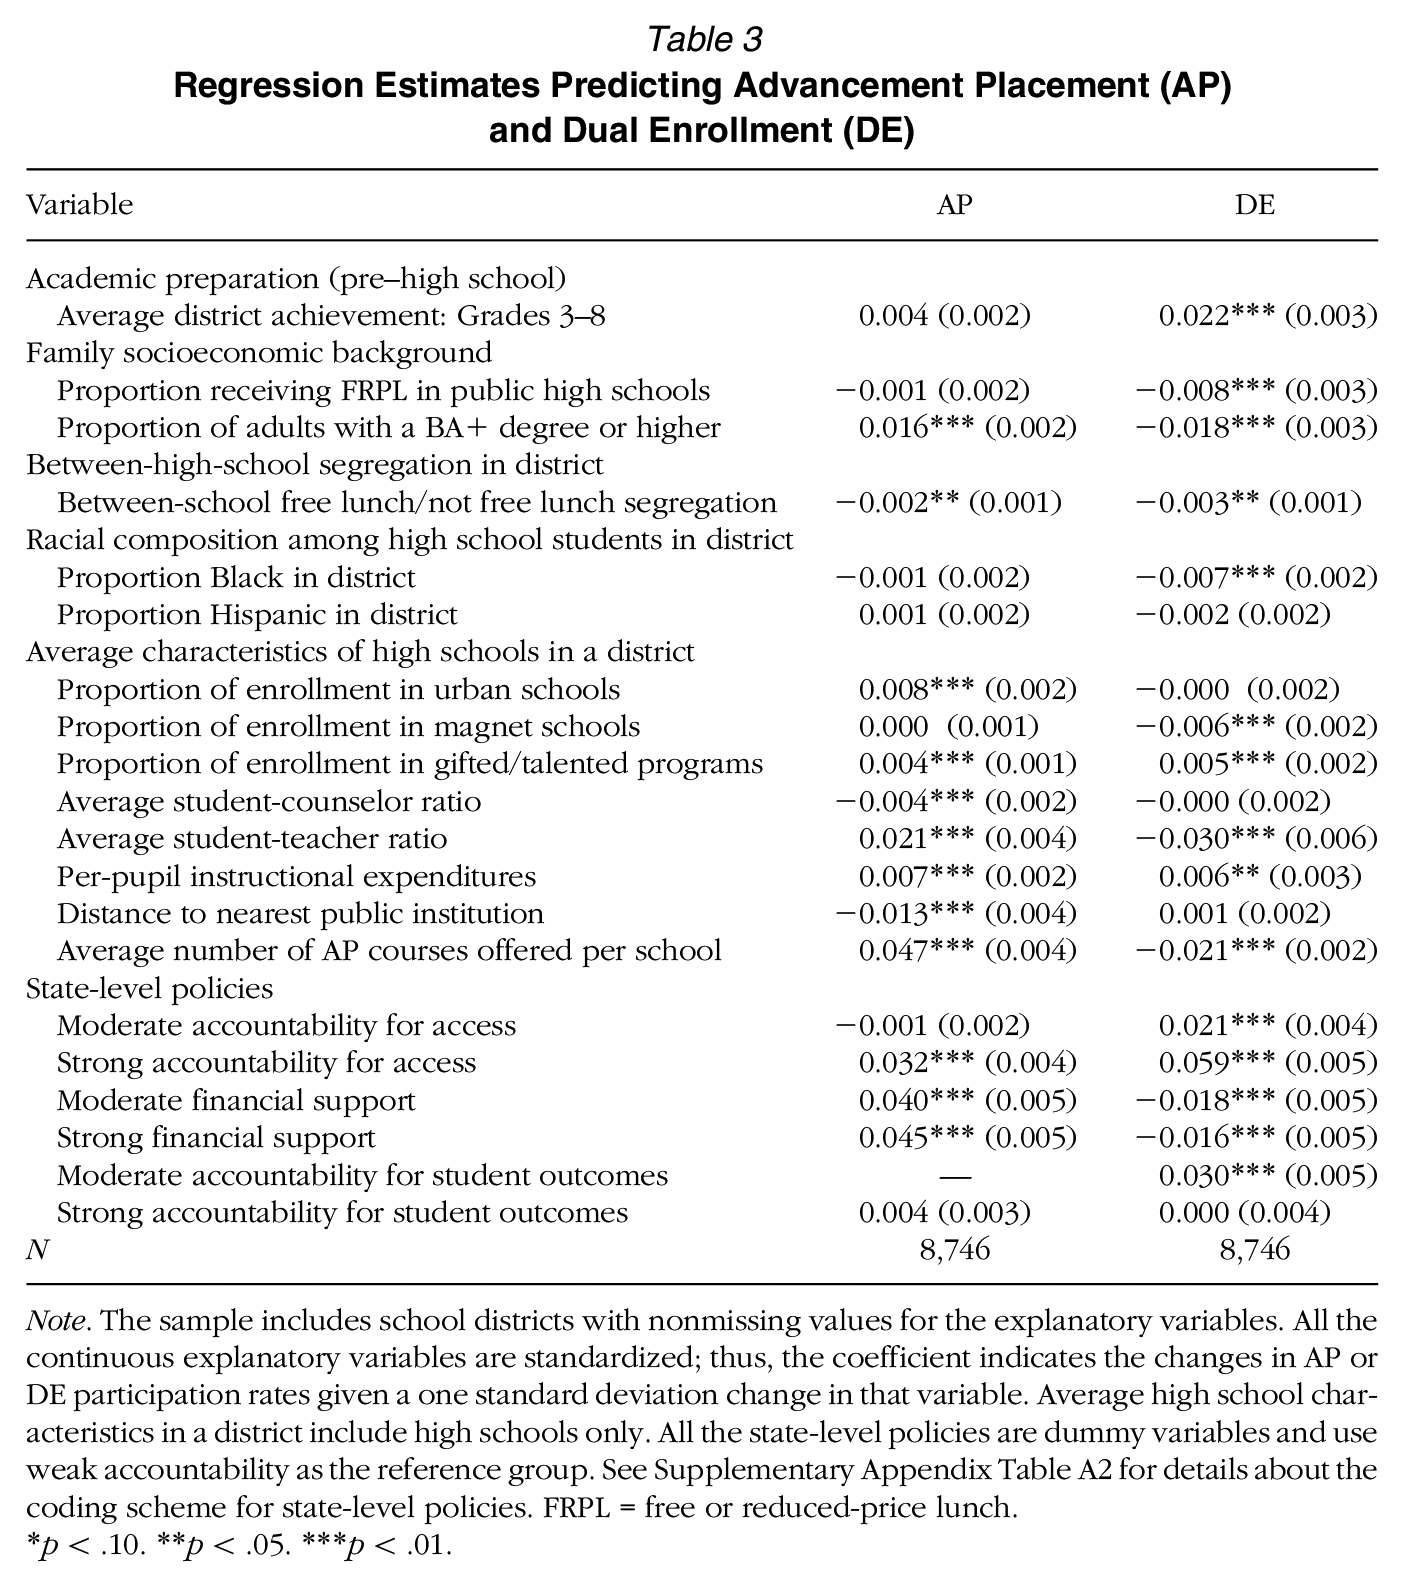
Note. The sample includes school districts with nonmissing values for the explanatory variables. All the continuous explanatory variables are standardized; thus, the coefficient indicates the changes in AP or DE participation rates given a one standard deviation change in that variable. Average high school characteristics in a district include high schools only. All the state-level policies are dummy variables and use weak accountability as the reference group. See Supplementary Appendix Table A2 for details about the coding scheme for state-level policies. FRPL = free or reduced-price lunch.
*p < .10. **p < .05. ***p < .01.
Second, there are a number of cases where the local-level variables are associated with both AP and DE enrollment, but in opposite directions. For example, the proportion of educated adults with school children in a district is associated with an increase in AP participation rates but a decrease in DE participation rates. Similarly, the average number of AP courses offered at a school is associated with higher participation rates in AP programs but are negatively associated with DE enrollment. These patterns suggest that AP and DE programs may serve as substitutes to each other when schools are allocating resources among different college acceleration programs. These patterns also suggest that students with more educated parents may interpret the value these programs have to offer differently.
Last, among the state-level variables, having strong accountability mandates seems to be an important predictor for both AP and DE participation— districts in states with strong accountability and mandates for access to AP (DE) programs are associated with higher AP (DE) participation rates than states without or with weak accountability. Additionally, strong financial incentives are important for AP participation. Specifically, states that offer moderate to strong financial incentives for participating in AP programs, such as reducing or waiving exam fees for low-income students, have AP enrollment rates that are five percentage points larger than states without or with weak financial incentives.
Correlates of Racial Gaps in AP and DE participation
Table 4 presents results that further use the local- and state-level variables to predict racial gaps in AP and DE participation. In addition to all the variables included in Table 3 that examines general AP and DE participation, we further add four additional variables into the model to better capture racial gaps in pre–high school academic achievement and in their socioeconomic status. 15 Columns 1 and 2 present the results for White-Black enrollment gaps and columns 3 and 4 present the results for White-Hispanic gaps. Following our conceptual framework presented in the section “Correlates of Racial Gaps in AP and DE Participation,” below, we discuss the key findings for each of the six categories of variables examined.
Regression Estimates Predicting White-Black and White-Hispanic Participation Gap
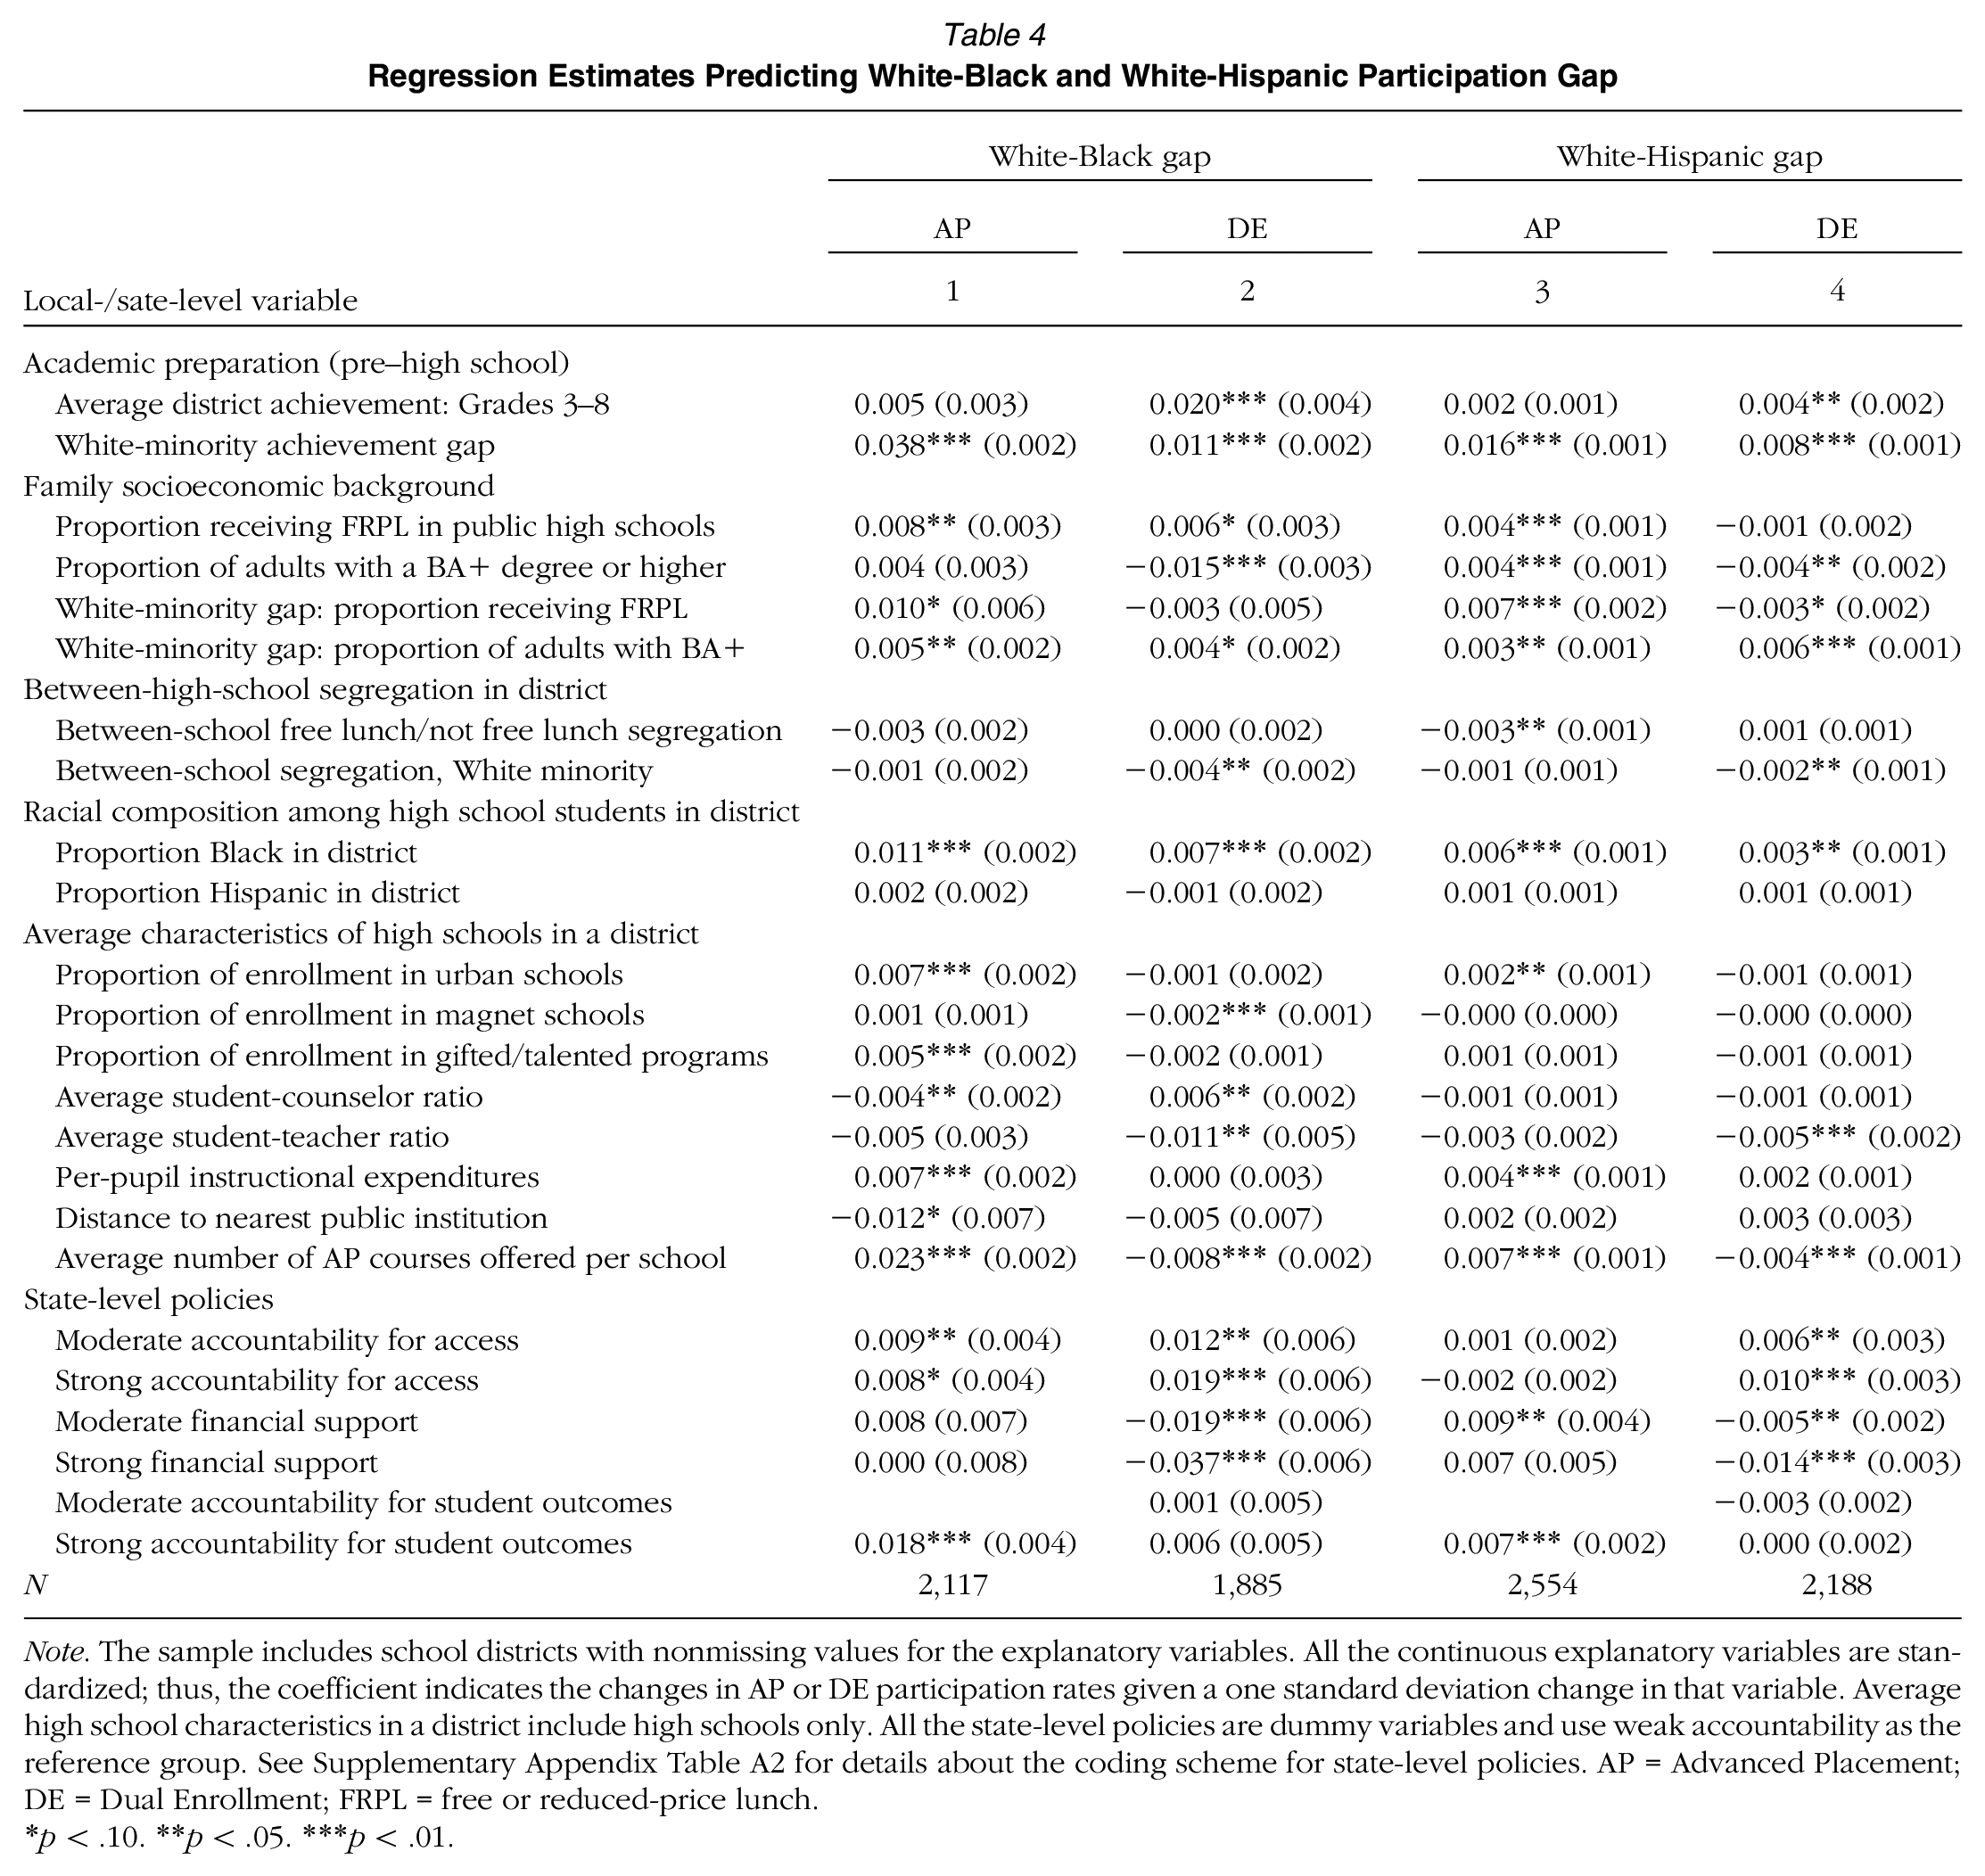
Note. The sample includes school districts with nonmissing values for the explanatory variables. All the continuous explanatory variables are standardized; thus, the coefficient indicates the changes in AP or DE participation rates given a one standard deviation change in that variable. Average high school characteristics in a district include high schools only. All the state-level policies are dummy variables and use weak accountability as the reference group. See Supplementary Appendix Table A2 for details about the coding scheme for state-level policies. AP = Advanced Placement; DE = Dual Enrollment; FRPL = free or reduced-price lunch.
*p < .10. **p < .05. ***p < .01.
Pre–High School Achievement
Among all the district-level and state-level variables examined, the White-minority gap in pre–high school academic achievement, averaged across Grades 3 to 8, is the strongest predictor of the participation gaps for both Black and Hispanic students and across both AP and DE programs. The size of the coefficient is particularly large for the White-Black gap in AP enrollment. Specifically, a 1–standard deviation decrease in the White–Black pre–high school achievement gap would be associated with smaller gaps between White and Black students in AP participation by almost four percentage points. The summary statistics of the variable indicates that Black students are more than 2 standard deviations lower than White students on average. This implies that adjusting for pre–high school differences in achievement between White and Black students would almost explain away the White–Black AP enrollment gaps completely. That is, districts where Black and White students have similar levels of pre–high school achievement would be equally likely to enroll in the AP program holding other factors constant.
Family Socioeconomic Background
Even conditional on student achievement level, average family socioeconomic backgrounds are still significantly associated with racial gaps in AP and DE participation. Specifically, districts with higher average poverty levels— measured as proportions of students receiving a free or reduced-price lunch—are generally associated with wider racial gaps in AP and DE participation. Such relationships are more robust for AP than DE participation gaps. Unsurprisingly, the White-minority gap in eligibility to free or reduced-price lunch is also associated with wider gaps in AP enrollment. In addition, a larger White-minority gap with regard to the proportion of adults in a school district with a bachelor’s degree is also associated with larger racial participation gaps for both AP and DE programs. These results imply that racial gaps in college acceleration programs may be partly driven by disparities in family socioeconomic background.
Between-School Segregation in a District
We do not observe a clear pattern between racial participation gaps and between-school segregation in income (as measured by proportions of students eligible for free or reduced-price lunch), which is only weakly correlated with the White-Hispanic AP enrollment gap. While districts with greater degrees of between-school racial segregation are associated with smaller racial gaps in DE participation for both Black and Hispanic students, the coefficients are both small in size. These results suggest that income and racial segregation are not necessarily directly linked to racial participation gaps in AP (DE) programs. Rather, a major source of such disparity is likely to be unequal resources and opportunities that are linked to socioeconomic and racial/ethnic composition at a school. As a result, the correlation between segregation and racial AP (DE) participation gaps would be substantially reduced once differential access to resources and peer compositions are adjusted. Indeed, the raw correlation between racial gaps in AP (DE) participation and between-school racial segregation is much stronger and statistically significant (e.g., the raw correlation coefficient between White-Black segregation and White-Black AP enrollment gap is 0.315); however, the association reduces sharply to zero as we include other measures of racial disparities in access to resources, such as the White-Black gap in eligibility to free or reduced-price lunch in a district.
Racial Composition Among High School Students
Greater proportions of Black students in a district are consistently associated with wider racial gaps in AP and DE participation, though the effect sizes are fairly small. Using White-Black AP and DE participation gaps as an example, a 19–percentage point increase in the proportion of Black students at the district-level (which represents 1–standard deviation increase) is associated with a 1.1 percentage point increase in the White-Black AP and DE participation gap (columns 1 and 2). The same pattern also holds for White-Hispanic gaps in AP and DE participation (columns 3 and 4), although with smaller sizes of effect. In contrast, proportions of Hispanic students are not associated with racial gaps in either AP or DE participation.
Average Characteristics of High Schools in a District
The most striking finding from this category of predictors is that a set of factors that are correlated with greater AP participation overall in Table 3—namely, proportions of students enrolled in urban schools, proportions of students enrolled in a gifted and talented program, average per-pupil instructional expenditures among high school students, and offering more AP courses—are also associated with wider AP racial enrollment gaps, and for the most part, for both Black and Hispanic students. Taking AP course offering as an example, a one standard deviation increase in the average number of AP courses offered per school in a district (approximately seven courses) would be associated with a wider White-Black AP enrollment gap by more than two percentage points, and White-Hispanic gap by close to one percentage point.
State-Level Policies
Similar to the results presented in Table 3 where state-level policies are associated with overall AP and DE participation rates, these policies are also important predictors of racial enrollment gaps in AP and DE programs. Specifically, states with stronger accountability measures for access and student outcomes have larger White-minority gaps for both AP and DE compared with states with weak accountability measures, with point estimates ranging from one to two percentage points. In contrast, stronger financial incentives for DE participation are associated with smaller racial enrollment gaps in DE programs. The associations are particularly pronounced for White-Black DE participation gaps: When there are state mandates in place for local or state agencies to cover full or part of students’ tuition for DE programs (strong financial incentives), the White-Black enrollment gaps in DE programs are almost four percentage points smaller than districts where parents and/or students are solely responsible for the costs associated with participating in DE programs (weak financial incentives). Taken together, these results suggest that financial resources and support may be critical in expanding access and participation in DE programs among minority students.
Discussion and Conclusion
This study takes advantage of recent data from the U.S. Department of Education’s CRDC to provide a national perspective on racial gaps in participation in two major programs intended to help high school students get a jump start in college. While there have been a number of studies that examine students’ enrollment in AP programs, our study makes the first attempt in describing racial inequity at the district level in both AP and DE at the national scale, and are able to shed light on similar or differential patterns across school districts between the two largest college acceleration programs.
Variation Across Districts
First, our results suggest that the majority of districts have nontrivial racial gaps in both AP and DE programs, with more pronounced gaps in AP than DE and with wider White-Black gaps than White-Hispanic gaps in both programs. Yet, even for White-Black gaps in AP participation, the largest gap on average among the four, our descriptive findings identify several hundred districts where Black students both have high participation rates—defined as reaching above the national median—and White-Black participation gaps are near-zero or even negative. The variation we display presents an opportunity to examine and scale innovations to both expand access to college acceleration opportunities and close gaps in participation. A sensible next step would be for researchers, practitioners, and policymakers to collaborate in identifying and documenting the policies and practices among districts (and their partner colleges in the case of DE coursework) that are highly effective in serving students through college acceleration programs.
Choice Between AP and DE Programs
Second, we find suggestive evidence that AP and DE programs may serve as substitutes to each other for schools—when they are allocating resources among different college acceleration programs, and for parents—when they are considering which program to enroll their children in. While there have been a growing number of studies that assess the benefits of AP and DE separately, there is less information about what factors families and students consider when they choose between different types of college acceleration programs. To help students and schools make informative decisions, future research may wish to examine whether the relative benefits of different college acceleration programs vary depending on specific student characteristics, such as academic ability, family socioeconomic background, and type of college intended.
Predictors of Equity Gaps
Third, among all the factors examined, the White-minority achievement gap prior to high school is the strongest predictor of racial gaps in AP and DE participation. Once we take into account the White-minority achievement gap, White and minority students are predicted to be equally likely to participate in AP and DE classes. This finding is consistent with a number of other studies that identified substantially smaller or even reversed racial gaps in models that condition on measures of academic achievement (e.g., Conger et al., 2009). We also find that conditional on the achievement gap, differences in district- and state-level contexts are only able to explain a small amount of variation in equity gaps. However, it is not entirely clear how to unpack this finding.
One possible explanation is that the pre–high school achievement gap has “caused” minority students to have a smaller chance to be admitted into AP and DE programs. For example, the emphasis on performance criteria in determining a student’s eligibility could serve as a strong obstacle for many students to take advantage of AP and DE opportunities and influence minority students disproportionately. A potential problem with this approach is that students’ school grades only have low to moderate correlations with their performance on AP examinations, 16 suggesting that a student’s probability of success in AP programs may vary along dimensions other than school grades (College Board, 1998). Thus, incorporating additional measures of students’ likelihood of success in AP and DE programs and multiple eligibility criteria for AP and DE participation would enable districts to improve the accuracy of the screening process and may also have implications for the racial gaps in AP and DE participation (Richardson et al., 2016).
An alternative explanation, however, is that the factors underlying racial achievement gaps, such as school resources and policies, largely overlap with the factors that explain racial gaps in AP and DE participation. This type of scenario suggests that a single policy or practice may be insufficient to eliminate or narrow the current racial gaps in AP and DE participation, and the goal of integrating minority students into college acceleration programs can hardly be achieved alone without comprehensive and persistent efforts to reform the social and school structure where racial achievement gaps are rooted.
Resources and Access Alone May Be Insufficient
Fourth, our results indicate that a handful of local factors that are associated with higher overall program participation, such as a larger number of AP courses offered and higher per-student instructional expenditures, are associated with wider racial gaps in AP enrollment. This is consistent with our descriptive results that districts with higher AP and DE participation overall also tend to have larger racial gaps in AP and DE enrollment. Along a similar vein, districts in states with stronger mandates in access to AP and DE programs have larger White-minority gaps than districts in states with weak mandates, indicating that White students, as compared with minority students, might be in a better position to take advantage of these types of incentives.
An important implication of these findings is that districts with greater resources surrounding college acceleration programs, while achieving strong AP and DE participation overall, may also engender racial disparity if there are inadequate efforts to prioritize equitable access to and success in such programs. For example, racially minoritized students—particularly those from lower-income families—may, as a result of accumulated educational disadvantage, experience other barriers in accessing college acceleration programs even when they meet the performance criteria, such as limited guidance about how to take advantage of AP and DE programs. In addition, research indicates that better-resourced schools are often more likely to use academic tracking and other forms of homogeneous ability grouping, such as gifted programs (Loveless, 2009). While these programs may provide targeted instruction early on to prepare students for more advanced coursework such as AP, they may also serve as a driver of segregation within schools along lines of race and family socioeconomic background (Roda, 2015; Rui, 2009). To the extent that curricular rigor influences students’ educational aspirations and college choices (Cabrera & La Nasa, 2000; Hauser & Anderson, 1991), the underrepresentation of minority students in gifted programs and high ability tracks could engender racial disparities in their probability of participating in college acceleration programs even when they are eligible to.
Thus, in addition to increasing educational resources and offering abundant college acceleration opportunities, it is also critical for districts and schools to be committed to integration and make intentional efforts to alleviate racial gaps in utilizing college acceleration resources. A number of studies have documented several promising efforts in this regard. Among these discussions, one promising avenue that has received great emphasis is more effective advising processes from teachers and school counselors, such as targeting students for advising, providing advisors with professional development opportunities to learn about college acceleration programs, and making information easily available to both parents and students (e.g., Flores & Gomez, 2011; Goldhaber et al., 2015; Kerr, 2014; Kettler & Hurst, 2017; Quintero, 2019; Whiting & Ford, 2009). For example, Kerr (2014) documented the efforts made by teachers in a high school to close the non-White/White AP enrollment gap. Specifically, the teachers created a space for middle and high school teachers to collaborate which, first and foremost, made middle school teachers aware of the racial disparities that existed in advanced courses and their role in closing them.
In addition, given the critical role teachers’ recommendation plays in determining a student’s eligibility to AP and DE programs, it is important that school districts provide professional development opportunities around explicit and implicit bias training to ensure that those who advise students for college acceleration programs do not hold biases that disadvantage underrepresented minorities. Prior literature has documented the way in which implicit biases can foster negative attitudes and lead to stereotypical beliefs about individuals from different backgrounds (Carnes et al., 2012; Gershenson & Dee, 2017). A number of studies focused on teaching and advising practices surrounding AP and DE and identified mixed findings regarding the existence of these biases and how they affected who was targeted and encouraged to pursue college acceleration opportunities. For example, based on interview data with teachers and counselors in Texas, Miller et al. (2018) found little evidence to support the existence of implicit biases or discrimination in advising practices. On the other hand, using an adapted audit study where the authors asked a sample of school counselors to make AP recommendations based on transcripts that had identical information but were randomly assigned student names suggestive of gender and race, Francis et al. (2019) found that Black female students were less likely to be recommended for AP Calculus and were rated as being the least prepared. Other research has also shown the extent to which teacher biases and expectations are systematically related to student racial/ethnic background and how this affects the course recommendation process (Archer-Banks & Behar-Horenstein, 2012; Campbell, 2012; Francis et al., 2019; Grissom & Redding, 2016; Ho & Cherng, 2018; Oakes, 2005). Implicit bias training has the potential to make teachers and counselors aware of their role as gatekeeper and learn about ways to move past biases so that all eligible and potentially successful students are encouraged to enroll in college acceleration courses.
Policies to Remove Financial Barriers
Finally, districts in states with stronger financial support to DE participation are associated with smaller White-minority DE participation gaps. This is not surprising given that the financial hurdles in regard to DE participation faced by students from less affluent families have been well documented (e.g., Karp et al., 2004; Museus et al., 2007; Roach et al., 2015). These barriers include both direct costs of participation, such as the tuition associated with college courses, and indirect costs, such as textbooks and transportation to local colleges. Results from our analysis further highlights the importance for policymakers to take into consideration the financial constraints of potential participations, especially those from less affluent backgrounds, in the allocation of funding and targeted support.
Limitations
Our study is subject to a number of limitations and caveats. First, dual enrollment participation is new for the 2015–2016 CRDC data collection. Dual enrollment programs and courses are offered in different modalities and taught by both high school and college instructors, compared with AP coursework, which is more standardized. Although the CRDC has provided detailed definitions regarding what counts as DE and requires that schools and districts certify the accuracy of their data on submission, there may still be measurement errors (beyond what may be expected in this type of national administrative data) on the reporting of DE participation.
Additionally, the broad definition of DE used by the CRDC also prevents us from differentiating between different types of DE programs in this study. Since DE programs vary substantially in multiple dimensions, the type of students enrolled in different DE programs may vary considerably. As a result, the way various local- and state-level factors predict overall participation and racial gaps in DE participation may largely depend on the specific characteristics of particular DE programs. Therefore, it is critical for future data collection to include detailed information regarding the specific attributes of a DE course or program.
Furthermore, since the primary focus of our article is on racial gaps in AP and DE participation, we had to restrict our sample to districts with at least one racial group having a nonzero participation rate. As a result, our findings may not speak to the factors that are associated with the availability of AP (DE) programs in general, especially local factors that lead to complete absence of AP or DE opportunities in a district.
Finally, though the focus on this study was on access to college acceleration programs, educational leaders and policymakers should also be focused on student success in AP and DE courses, tracking student progression and momentum into and through college. For example, previous research, including documentation from the College Board, indicates that there remain racial and socioeconomic gaps in AP exam pass rates, even among AP course participants (College Board, 2017). Our study uses a broader definition of access to AP, counting students as participating if they ever took an AP course. As a result, the racial gaps reported in our study are likely to be larger if we were able to also take into account disparities in the number of students who take and pass the AP exam.
Despite these limitations and caveats mentioned above, our analysis provides several important policy implications regarding college acceleration programs. Although we cannot make any causal claims based on the observed correlations between racial gaps in AP and DE participation and district-level and state-level factors, they point to potential channels that may affect minority students’ participation in college acceleration opportunities. In light of the positive relationship between these opportunities and important student educational outcomes, such as subsequent college enrollment and performance, channels identified in this study could contribute to racial gaps in education attainment and labor market opportunities. Further analysis of these associations through longitudinal research designs that enable researchers to draw causal conclusions would be a valuable direction for future work and has the potential to inform broader policy discussions around college access and completion.
Supplemental Material
sj-pdf-1-aer-10.3102_0002831221991138 – Supplemental material for College Acceleration for All? Mapping Racial Gaps in Advanced Placement and Dual Enrollment Participation
Supplemental material, sj-pdf-1-aer-10.3102_0002831221991138 for College Acceleration for All? Mapping Racial Gaps in Advanced Placement and Dual Enrollment Participation by Di Xu, Sabrina Solanki and John Fink in American Educational Research Journal
Footnotes
Notes
D
S
J
References
Supplementary Material
Please find the following supplemental material available below.
For Open Access articles published under a Creative Commons License, all supplemental material carries the same license as the article it is associated with.
For non-Open Access articles published, all supplemental material carries a non-exclusive license, and permission requests for re-use of supplemental material or any part of supplemental material shall be sent directly to the copyright owner as specified in the copyright notice associated with the article.
