



Abstract
Resource exposure was a key mechanism linking patterns of racial segregation and student outcomes during the Brown v. Board of Education era. Decades later, past progress on school desegregation may have stalled, raising concerns about resource equity and associated student outcomes. Are recent trends in segregation associated with racial disparities in district revenue? Drawing on national data from the School Funding Fairness Data System and the Common Core of Data, this study examines the association between contemporary patterns of segregation between districts within a state and racial disparities in school district revenue over time. We find that increases in racial segregation, net of racial socioeconomic segregation, and other racial differences between districts are associated with racial disparities in revenue.
It has long been theorized that disparities in resource exposure are a key mechanism linking racial segregation to student outcomes. After Brown v. Board of Education of Topeka (1954) ended de jure racial segregation in public education, evidence suggests that Black students’ expanded access to school resources, such as smaller class sizes and increased school spending, contributed to improved educational attainment, socioeconomic status, and health outcomes, with no negative impact on White students (Johnson, 2011; Reber, 2010). These findings indicate desegregation worked in part through redistributing resources important for student performance.
Decades later, past progress on school desegregation has stalled (Reardon & Owens, 2014). Racial segregation increased during the 1990s, driven predominantly by increases in segregation between school districts. While between- and within-district segregation declined moderately during the 2000s, both remain high, and students are still more racially segregated across district boundaries than among schools. Segregation between Black/Latinx and White students, in particular, is high (Stroub & Richards, 2013). Moreover, students experience high levels of economic segregation; indeed, rates of economic segregation both between- and within-districts increased by over 15% through the 1990s and 2000s (Owens et al., 2016). These trends are concerning because racial segregation remains closely related to racial disparities in academic achievement. The more unevenly Black versus White students are spread across districts, metropolitan areas, and counties, the higher the Black-White disparity in academic achievement, due in large part to racial differences in poverty (Reardon et al., 2019). Moreover, legal remedies to funding inequities have taken a backseat to other reform initiatives (Wilson, 2016), raising further concerns about resource equity and associated student outcomes. These trends raise the question: If desegregation resulted in increased resources for Black students, are recent trends in segregation related to racial disparities in funding?
The current study answers this question by exploring how recent patterns of racial segregation and racial differences in poverty are related to racial differences in school district revenue. We investigate the contemporaneous relationships among within-state (and between-district) racial segregation, racial differences in poverty, and disparities in school district total, federal, state, and local revenue over time. As racial segregation and racial differences in poverty between school districts within a state change, does district revenue shift in a way that favors or disfavors a specific racial or ethnic group? Much of the focus of school segregation research is on racial segregation (as opposed to racial differences in poverty). The school segregation research also tends to focus on racial segregation within-districts (between-schools). This within-district focus is due to practical, legal, and policy constraints that make it easier to affect within-district racial segregation as compared with racial segregation between-districts (Reardon & Owens, 2014). As such, there is arguably more variation in racial segregation between-districts than within-districts. However, analyses of racial segregation between-districts (Stroub & Richards, 2013) and racial differences in poverty between-districts (Fahle et al., 2020) find substantial geographic variation in these forms of segregation, which complicate narratives about greater variation in school segregation within-districts. Our study deviates from the norm of segregation research by focusing on segregation and school funding patterns between districts within states instead of segregation between schools within districts (Reardon & Owens, 2014). This is because school funding policies, decisions, and allocations largely take place at the state level, and districts within the same state are subject to many of the same education, school funding, and local property taxation policies (Green et al., 2021). Also, states generally grant districts the power to draw, create, and dissolve attendance boundaries in ways that would directly affect segregation.
This descriptive inquiry is the first to examine how between-district segregation and revenue disparities trend over time. Past studies are generally cross-sectional (and thus more subject to confoundedness), over a short period of time, focused on a single school district, or do not examine both segregation and racial disparities in revenue. For example, recent research documents racial disparities in school district revenue, but the role of or relationship to racial segregation or racial differences in poverty is not empirically tested (Baker et al., 2020; EdBuild, 2019). Our national data include finance and demographic information for nearly every traditional school district in the country over the course of 15 years, allowing a unique opportunity to study both finance disparities and racial segregation and racial differences in poverty patterns over time.
This study finds that descriptive and unadjusted total revenue is greater in the typical Black and Latinx student’s district relative to the typical White student’s district. However, once adjusted, we find that as racial segregation between districts within a state increases, racial disparities in total and local revenue shift in a way that disfavors the typical Black student’s district relative to the typical White student’s district, even after accounting for racial differences in exposure to poverty. Furthermore, we find no significant relationships between racial differences in poverty and racial disparities in revenue at any level. These findings suggest that racial disparities in local funding are one mechanism through which contemporary segregation might affect students, and that federal and state revenue do not appear to be sufficiently compensatory in the context of increasing racial differences in exposure to poverty. Ultimately, our findings advance the empirical knowledge on the potential consequences of high levels of between-district sorting.
Conceptual Model
Our conceptual model is concerned with the extent to which racial composition is related to school resources in a way that would produce disparities in student outcomes. Since we are concerned with gaps in resources (i.e., total, federal, state, and local revenue) between groups, we use the variance ratio index to measure segregation. The variance ratio index is a relative measure of segregation that adjusts for underlying student composition across units—here, districts within a given state—and can be interpreted as the difference in exposure to Black students between Black students and White students, for example (Monarrez et al., 2019). While segregation can be measured in myriad ways, if we believe gaps in student performance are driven by associated gaps in resources, then the variance ratio index is the appropriate measure for this study because it corresponds to gaps in racial composition across districts (Monarrez et al., 2019; Reardon & Owens, 2014). Essentially, our econometric model uses racial gaps in district composition to explain racial gaps in district revenues.
Overview of School District Funding Policies and Practices
The mechanisms linking segregation to disparities in school district revenue are directly related to local, state, and federal funding policies. Historically, patterns and processes of local, state, and federal revenue for school districts have been intimately tied to inequity. In the sections to follow, we discuss historical context surrounding public school funding and race, and provide a summary of contemporary district funding policies. Because racial discrimination is dynamic and regenerative (Boddie, 2016), the purpose of this overview is to make clear how school funding has been directly connected to race in the past in order to understand how contemporary policies and practices may have adapted to reproduce racial funding inequities through segregation. This context drives the formulation of our hypothesized mechanisms linking patterns of racial segregation and racial differences in poverty to racial disparities in school district revenue.
Historical Relationships Between Inequality and Local, State, and Federal Funding
While public education today is funded by a combination of local, state, and federal dollars, the presence and prominence of these funding sources has changed over time. In northern states, the original common schools were funded primarily through state endowments and were often supplemented by funds generated through land grants, license fees, and lotteries (Walters, 2001). Policymakers soon realized some form of taxation was needed to ensure the long-term financial viability of universal schooling and to increase popular support for public education. States began requiring local governments to levy local taxes in order to receive state funds, often mandating them to match state funding amounts. By the early 19th century, local property taxes were the main source of public school funding in the North. State taxation did not become a significant source of school funding until the mid-20th century (Walters, 2001).
In southern states, the primary source of public education revenue through the 1890s was state funding that was largely targeted at the education of poor Whites (Walters, 2001). Southern Whites opposed local taxation because their relative wealth meant they would provide the bulk of local revenue to both White and Black segregated schools. White southerners did not support local taxation until the post-Reconstruction disenfranchisement of Blacks made it possible for White politicians to redistribute educational resources to favor White schools (Walters, 2001). As large numbers of southern Blacks migrated to northern states beginning in the early 20th century, discriminatory housing policies led to high levels of residential segregation (Rothstein, 2017), creating racial disparities in school funding in the North as well (Walters, 2001). Thus, both segregation and the dependence on local taxation to fund public education led to disparities in resources by race in the 19th and 20th centuries.
The Civil Rights Era ushered in broad shifts in the funding of public education. The federal Elementary and Secondary Education Act was signed into law in 1965 and established Title I funding for public schools (Cascio & Reber, 2013; Walters, 2001). Title I block grants provided compensatory federal funding for children in poverty, doubling the amount of federal dollars going to public schools (Cascio & Reber, 2013). Southern states in particular received large amounts of funding through Title I due to the high levels of child poverty in the South (Cascio & Reber, 2013). By the end of the 1960s, federal funding of public schools accounted for 17.2% of total per pupil expenditures in the South, a sharp increase from the 1964 share of 3.4% (Cascio & Reber, 2013). Lawmakers used the nondiscrimination provision of the Civil Rights Act of 1964 to tie the receipt of those federal funds to the desegregation of public schools (Cascio & Reber, 2013; Walters, 2001). The result was an increasing presence of the federal government in the oversight and enforcemeng of district funding in public education that has been causally linked to decreases in segregation (Frankenberg & Taylor, 2015).
Following these Civil Rights Era legislative milestones, a series of school finance reform court cases also led to shifts in the role of state funding in public education. Early cases were litigated on the grounds that school finance systems relying heavily on local taxation and resulting in large inequalities in funding on the basis of wealth were a violation of the equal protection clause of the Constitution (Koski & Reich, 2006). However, the 1973 ruling in San Antonio v. Rodriguez held poverty was not a “suspect class” and therefore inequity in funding based on poverty was not an equal protection violation (Koski & Reich, 2006). Plaintiffs then turned to state constitutional provisions for equitable education to make a case for court-mandated school finance reform. In cases such as New Jersey’s Robinson v. Cahill (1973), the goal was a funding system that either produced equal funding across districts or ensured that funding levels would not be correlated with property wealth (Koski & Reich, 2006). Select states reformed finance systems to rely more heavily on state funding sources as a means to equalize per pupil spending across districts. Court-ordered school finance reforms successfully induced increases in district level funding, more progressive funding patterns, and narrower gaps in expenditures between high- and low-income districts in states undergoing these reforms (Candelaria & Shores, 2017; Card & Payne, 2002; Jackson et al., 2016; Lafortune et al., 2018). Though, in the context of our current study of racial disparities, it is important to note that school finance litigation of the 1960s and 1970s focused on wealth inequalities while explicitly ignoring racial inequality. Legal experts cited political concerns that making school finance reform a racial issue would not gain the support of politicians (Alemán, 2007).
In sum, local, state, and federal funding have long been tied to patterns of racial and socioeconomic inequity. Historically, local taxation in combination with racial segregation and disenfranchisement made it possible for funds to be unequally distributed across Black and White schools. Desegregation orders, court-mandated school finance reforms, and the growth of compensatory state and federal funding all helped target some of the imbalance in educational resources that existed across districts and were associated with both race and socioeconomic status. Have contemporary policies and practices continued to make progress toward equitable school funding, or has discrimination adapted to retrench funding gains for Black and Latinx students?
Contemporary School Funding and Related Tax Policies
In the present era, school districts continue to receive funds from local, state, and federal sources. While most funding for school districts comes from state and local revenue, there is variation both between and within states. Aside from direct funding policies, external policies and practices at the state and local levels could also help explain how and why segregation might be related to racial disparities in revenue.
Local
Local funding for school districts continues to rely heavily on local taxation, most often from property taxes. Since tax rates and property values vary between districts, there are large disparities in local revenue (McGuire et al., 2015; Verstegen & Knoeppel, 2012). Poverty is negatively correlated with property wealth, and higher poverty is related to lower revenue from property taxes (Baker & Corcoran, 2012). Even though low property wealth districts may tax at a higher rate than high property wealth counterparts, the increased effort may be insufficient to make up for lower property values in high-poverty districts (Baker & Corcoran, 2012). Residential segregation, which for Black and Latinx residents is associated with depressed home values, is in part responsible for racial inequalities in property wealth (Flippen, 2004).
Further contributing to revenue disparities between districts are tax laws and related housing practices that produce racially and socioeconomically disparate tax benefits and burdens. For example, Martin and Beck (2017) found Black homeowners reported higher property tax rates than those reported by comparable White homeowners, especially in states with property tax limitations. While all homeowners on average benefitted from the property tax savings that accompanied tax limitations, Black homeowners benefited the least because they tended to own homes of lower value. Latinx homeowners, who were more likely to have recently purchased a home, also received minimal benefit from a policy designed to favor long-term homeowners (Martin & Beck, 2017). Inequality in property tax rates is not directly attributable to discrimination in setting tax rates, but instead may arise indirectly from racial/ethnic discrimination in the valuation of property (Harris, 2004; Martin & Beck, 2017). Moreover, because state funding policies limit the use of state funds for capital outlay, districts must typically rely on local revenue to cover capital expenditures. Local funding for capital expenditures is primarily derived from voter-approved bond issues, and property tax revenues are used to cover the debt service costs associated with voter-approved bonds. This practice can also lead to disparities in the funding capacity and tax burdens of school districts with varying levels of property wealth (Plummer, 2006).
State
School districts generally rely heavily on aid from state sources to compensate for local disparities. Contemporary state aid is largely generated from income and sales tax. State revenues cover district costs such as general formula assistance, special education, bilingual education, gifted and talented programs, and staff improvement programs. Each state uses a formula to distribute state funds to districts. These formulas generally attempt to adjust for anticipated differences in the funding capacity between districts. Foundation formulas, the most common type of funding formula, set a base funding level that is deemed necessary for a basic or adequate education, determine the required amount of local effort that has to be put toward raising the funds, and specify the amount of state funds needed to cover the difference (Verstegen & Jordan, 2009). Foundation programs adjust for student and district factors such as poverty, disability, English language status, and district size, and then assign a funding weight or multiplier (and therefore more dollars) to each formula factor (Verstegen & Knoeppel, 2012). The goals of education funding formulas vary across states and typically prioritize either adequacy (i.e., sufficient resources to provide all students with an adequate education) or equity (i.e., equal resources for all students, or greater resources for students with greater needs; Chingos & Blagg, 2017). These differing goals mean districts with similar student body composition may receive different levels of funding depending on which state they are in.
State policies related to taxation may also shape funding conditions for districts. For example, many states have limits on government tax revenues and expenditures at either the district, municipal, county, or state levels. These tax and expenditure limits (TELs) have been found to have a substantial impact on education budgets. More specifically, TELs do not impose universal constraints across districts, but instead are the most constraining in lower wealth districts that rely on higher tax rates to fund schools (Mullins, 2004). That is, because tax caps (e.g., of 2%) are proportionate to the local revenue districts raise, districts with lower local revenue will be limited to smaller increases in revenue (Baker, 2011). At the same time, voters in high-wealth districts are more likely to override a TEL. Zabel (2014) suggests TEL overrides can create a multiplier effect where higher-wealth communities funnel more money into their districts, thereby increasing the quality (or perceived quality) of local schools, which is then capitalized into housing prices, further lifting local wealth and producing even greater differences between high- and low-wealth districts.
Federal
The federal government’s role in public education finance continues to be primarily compensatory. The largest shares of federal funding for school districts come from Title I of the Elementary and Secondary Education Act, the Individuals with Disabilities Education Act, and the Child Nutrition Act (Camera, 2016; U.S. Census Bureau, 2018; U.S. Department of Education, 2014). The federal government allocates revenue to states (and sometimes districts directly) based on specific eligibility criteria and formulas (Cornman, 2015). These generally include counts of eligible students in states or districts, which may be multiplied by base factors in order to give greater weight to special populations, such as students in poverty (National Center for Education Statistics, 2016; Sonnenberg, 2016). States then suballocate these federal funds to districts directly based on formulas or eligibility criteria.
In summary, local funding for school districts is driven by local taxation, and its reliance on property taxes means funding varies across districts based on local wealth. States directly and indirectly shape the funding conditions of school districts through the provisioning of compensatory and general aid and funding and tax policies. The federal government determines processes and policies through which states can receive compensatory federal funding to suballocate to school districts. Given these distinctions among funding sources, we expect segregation to have different associations with revenue based on the level of government in question (i.e., federal, state, or local). Each level, in turn, may contribute to disparities in total revenue. For these reasons, we hypothesize patterns separately for each level of government and for total revenue as well.
Why and How Might Segregation Be Related to Racial Disparities in School Revenue?
Race and Socioeconomic Status
Segregation may cause funding disparities through mechanisms related to race and socioeconomic status, as socioeconomic status plays a key role in federal, state, and local funding allocations. At the federal and state levels, funding formulas typically give extra weight to student and district factors that include poverty, allocating more funding to districts that serve higher shares of low-income students. If the relationship between race and poverty is driving the relationship between segregation and funding disparities at the state and local level, we would expect significant relationships between racial differences in poverty and funding disparities, but no relationships between racial segregation and funding disparities, after accounting for poverty. In other words, nothing in federal and state funding formulas explicitly allocates funding based on race, so there should be no independent association between racial segregation and racial disparities in federal and state revenue after accounting for poverty and other formula factors that might be related to race, such as English language status. However, given the compensatory role of federal and state funding, we expect that increases in racial socioeconomic segregation (i.e., racial differences in poverty) will be related to more federal and state revenue for Black and Latinx districts with higher rates of poverty relative to White districts with lower rates of poverty.
We expect the relationship between segregation and racial disparities in local revenue to follow the opposite pattern. Local funding is not compensatory in that it generally does not take student poverty into account and instead is highly dependent on local characteristics such as property tax rates and property values. We therefore expect that the level of local poverty and resources in Black, Latinx, and White neighborhoods should drive local funding disparities. Blacks and Latinos/as experience higher levels of concentrated neighborhood poverty than Whites (Quillian, 2012), and higher poverty is related to lower revenue from property taxes (Baker & Corcoran, 2012). A weaker tax base in poorer, less White neighborhoods means Black and Latinx students concentrated in higher poverty districts will likely have less local revenue despite greater tax effort.
The relationship between segregation and racial disparities in local revenue may also be driven by racial differences in property wealth. For reasons of historical and continuing discrimination, property wealth remains linked to race even after accounting for poverty. Historical discrimination in financing and home sales limited Black access to property ownership and higher income neighborhoods, exacerbating patterns of residential segregation that persist today and remain linked to depressed home values (Flippen, 2004; Rothstein, 2017). While discriminatory practices like redlining are no longer legal, recent evidence suggests racial stereotypes continue to play a role in assessing the value of homes (Korver-Glenn, 2018). As a result, middle-class Black families with annual incomes comparable to White families have lower property wealth on average. Indeed, among families with children—the group that stands to feel the greatest effects of education funding—Black families have the lowest levels of home equity, with racial wealth gaps persisting at all levels of the wealth distribution (Percheski & Gibson-Davis, 2020). Therefore, property wealth and, as a result, local capacity for school funding may be related to race over and above a relationship with poverty.
Socioeconomic status may also play a key role in the ability of districts to secure nonformula public and private funds. Financial and institutional knowledge, networks, and other experiences and resources can be leveraged to secure higher levels of local funding, such as private donations, discretionary grants (e.g., for capital outlay), or borrowing against future tax income. These conditions favor wealthier districts with greater administrative and community capacity (Eikenberry & Kluver, 2004). Additionally, school districts with higher property tax revenues per pupil and higher median household income have higher probabilities of receiving private donations from school-supporting nonprofits (e.g., parent teacher organizations, alumni associations, booster clubs, school foundations, and local endowments), as well as higher levels of per pupil contributions (Nelson & Gazley, 2014). While private contributions comprise just a small fraction of school district budgets, those that yield high revenues are more likely to benefit affluent, predominantly White schools (Murray et al., 2019), evincing another mechanism by which Whiter and wealthier school locales receive a slight boost in local funding for education.
Taken together, when Black and Latinx students’ districts are increasingly exposed to greater rates of poverty than White districts, we would expect decreases in local revenue for higher-poverty Black and Latinx districts relative to lower-poverty White districts. However, the compensatory nature of federal and state revenue (e.g., weights for poverty) should make up for local revenue shortfalls. Thus, increases in racial socioeconomic segregation would not be related to racial disparities in total revenue. However, when Black and Latinx students are increasingly segregated in districts with other Black and Latinx students, we would expect decreases in local revenue for the typical Black and Latinx students’ districts because of the relationships among race, concentrated poverty, property wealth, and districts’ ability to secure nonformula funds. See Hypothesis 1 in Table 1 for a summary of these relationships.
Hypothesized Relationships Between Segregation and Black-White and Latinx-White Disparities in School District Funding

Race and the Willingness to Fund Public Education
A second pathway connecting segregation to racial disparities in district revenue may be a more direct link between race and the willingness to fund public education. People are less willing to fund public spending when there is a perception that the public goods will be shared with out-group members (Alesina et al., 1999). When income inequality is attributable to inequities between racial and ethnic groups (as opposed to within), there is less local investment in public goods. This phenomenon holds for education spending; school district spending is lower in districts with higher levels of racial income inequality, and this negative relationship is especially strong in districts with higher discretion over the use of their funds (i.e., a greater proportion of total revenue is derived locally). However, when controlling for racial income inequality, there is a positive relationship between racial diversity and school district spending, a finding which may be driven by the fiscally liberal preferences of voters of color who tend to support spending on education (An et al., 2018). Indeed, districts with greater ethnic heterogeneity, as well as districts with greater proportions of Black residents, are associated with significantly higher per pupil education spending (Lee et al., 2016). White voters, on the other hand, are less likely to support increased taxation and progressive taxation when new residents are not White (O’Brien, 2017). This control of resources as a means to exclude out-group members from reaping accrued benefits is a form of opportunity hoarding (Tilly, 1998). Put together, this evidence suggests a u-shaped trend where White constituents in majority-White locales and voters of color in locales with high levels of racial and ethnic diversity are most likely to support public goods.
Willingness to fund public education, especially when spending is perceived to benefit students of other racial and ethnic groups, may drive the relationship between segregation and district revenue in separate and distinct ways, based on the racial composition of states and districts. In a state with more between-district racial segregation and racial socioeconomic segregation, White constituents might be less likely to vote for state legislators who advocate for increases in state taxes for education, or support referenda aimed at more equitable school funding, if it means out-group members would accrue greater benefits. In states where White voters are the majority, this unwillingness to fund public education could disfavor Black and Latinx students. Conversely, states with greater shares of voters of color may leverage the political process to achieve more progressive education funding that benefits Black and Latinx students. In states where political power is shared evenly among racial groups, racial and ethnic diversity may actually diminish support for public goods because of difficulty in agreeing on heterogeneous preferences (An et al., 2018), yielding a null effect on funding for Black and Latinx students. It should be noted that efforts to suppress the vote among citizens of color may dilute their political power even in states where they compose a substantial share of the voting-age population, further disfavoring Black and Latinx students even when their communities support increased educational spending. From 2001 to 2010 (a majority of the years of our sample), state legislatures enacted 99 disenfranchisement policies, such as voter ID requirements and the denial of voting rights to convicted felons, that affect voter turnout (Blessett, 2015). For example, while voter ID requirements suppress voter turnout across racial groups, they have disproportionately negative suppressive effects among Latinx voters and are more likely to be implemented in states with greater shares of Black and Latinx voters (Darrah-Okike et al., 2020). The presence of voter ID requirements skews voting rates in favor of conservative and Republican voters (Hajnal et al., 2017), a bloc that historically has not supported progressive education funding.
While the relationships among racial segregation, willingness to fund education, and disparities in district revenue may affect state funding, this relationship is likely strongest at the local level. Compared with state politics, local stakeholders can more easily intervene to change funding levels, such as through school board elections or votes on tax levies. At the same time, there are ways to opt out of local district funding while still generating revenue for in-group members. White and economically advantaged constituents in diverse districts who want more funding for their children’s education can circumvent district funding mechanisms (e.g., tax increases) by donating money directly to their local school and/or leveraging school choice policies. Such practices are especially common in gentrifying neighborhoods (Good & Nelson, 2020; Pearman & Swain, 2017), and are examples of opportunity hoarding that could disfavor Black and Latinx students. In sum, the more local the funding source, the more we would expect racial disparities to increase for Black and Latinx districts relative to White districts as racial segregation increases. Since federal and state funding formulas target disadvantage and not race per se, they are not designed to compensate for disparities at the local level driven by racial segregation. Thus, if a direct relationship between race and the willingness to fund public education drives the relationship between segregation and funding disparities, we would expect that increases in racial segregation (net of racial socioeconomic differences) will not only be related to racial disparities in local revenue but will also be related to less total revenue for Black and Latinx districts relative to White districts. See Hypothesis 2 in Table 1 for a summary of these relationships.
Methodology
Data
For this study, we utilize national, public-use data collected at the district level. The compilation of this data is described in detail elsewhere (Sosina & Weathers, 2019) and in brief here. The main data for these analyses were compiled by Baker et al. (2016). This collection includes longitudinal data at the school district level on finance and demographics from (1) the U.S. Census Bureau’s Annual Survey of School System Finances (F33) and Small Area Income and Poverty Estimates (SAIPE), (2) the National Center of Education Statistics’ Common Core of Data, and (3) the Bush School of Government and Public Service’s Comparable Wage Index (CWI). Additionally, Sosina and Weathers (2019) linked this school-district data to a data set of imputed demographics on the school-level Common Core of Data and state-level (as opposed to district-level) CWI measures. The result is a district-by-year data set with measures of school district revenue by source and local demographic characteristics.
Our goal is to measure average revenue disparities between districts within a state and year. We therefore use district-by-year data to construct state-by-year measures of disparities. Since our measures capture between-district disparities, our population of interest includes states with multiple traditional school districts, thereby excluding the District of Columbia and Hawaii. For districts to be included in the construction of our between-district measures, they must (1) be operational in a given fiscal year, (2) provide services beyond vocational training or special education alone, (3) enroll actual students (this excludes federal, regional, or other local education agencies that provide services but do not have actual students), (4) enroll students who are not in the juvenile justice system, (5) not be charter districts, and (6) have nonmissing revenue and expenditures data.
We exclude charter school districts, special education districts, juvenile justice districts, and vocational/technical districts for three reasons. First, roughly 90% of district-year observations for charter districts are missing revenue and expenditure data. Thus, not only are these districts ineligible for analysis, such a high rate of missingness on our outcome of interest also suggests that there are different financial reporting requirements for charter school districts as compared with traditional school districts. Second, funding structures and governing bodies for charter school districts, juvenile justice districts, special education districts, and vocational/technical districts as compared with traditional school districts are arguably different, and these districts may have unique reasons for different funding patterns. Third, special education districts and vocational/technical districts only exist in a handful of states and thus are inadequate for our population-based analysis of U.S. districts across states.
We further exclude district-year observations with outlying values for total per pupil revenue and expenditures and where SAIPE reports no 5- to 17-year-olds. The resulting data set spans 15 years, including fiscal years 1999 through 2013. The sample includes an average of about 13,417 school districts per year for a total of 201,257 district-year observations. See Table A1 in the online supplementary appendix for the number of district-years excluded for each of the aforementioned conditions.
Since we are measuring average revenue disparities between districts within a state, our measures are properties of a given state and year combination. In other words, we have one measure of the between-district disparities for each state and year in our data for a total of 735 observations (49 states, 15 years). Because there are state-year combinations missing key control variables, we further restrict our analysis to state-years with nonmissing data. This results in an analytical sample of 641 state-year observations. See Supplemental Appendix Table A2 in the online version of the journal for more information about missingness.
Measures
Our measures of racial disparities in revenue, racial segregation, racial socioeconomic segregation, and controls are analogous to those explained in Sosina and Weathers (2019), but describe disparities in revenue contexts instead of expenditure patterns.
Dependent Variables
Our dependent variables are Black-White and Latinx-White total, federal, state, and local revenue disparities between districts within a state. Note, we do not use student level data to construct these measures nor do we connect dollars to individual students. Instead, to calculate the average per pupil revenue in the average Black student’s district, we compute the average per pupil CWI-adjusted revenue among districts within a state and year, weighting by the number of Black students in each district. We also compute the average per pupil revenue in the average Latinx student’s district and in the average White student’s district, weighting by Latinx and White enrollment, respectively. The difference between these weighted averages is the racial dollar difference in district revenues. Positive values indicate that the average Black or Latinx student’s district receives more revenue than the average White student’s district. Given that we difference per pupil revenue that is weighted by racial/ethnic groups, we consider our outcome measure to represent a racial disparity in per pupil revenue, where
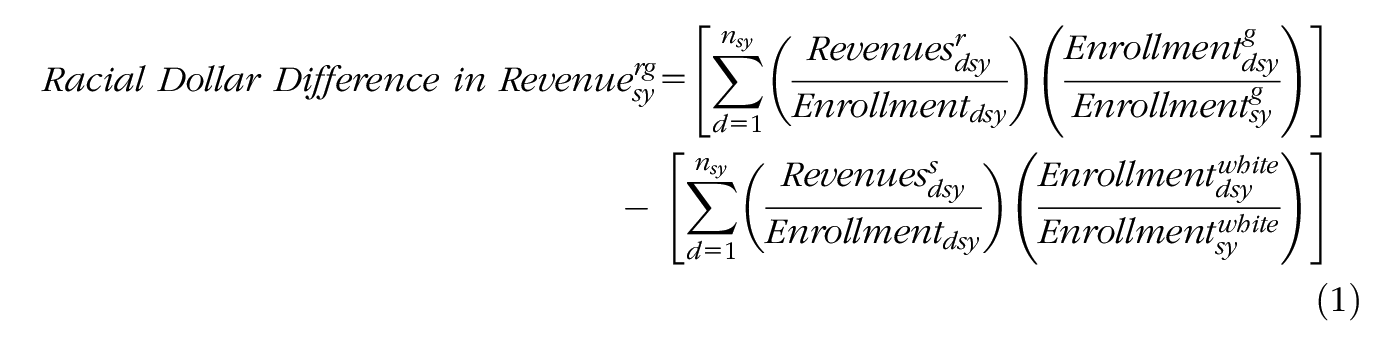
In order to make reasonable comparisons across varied geographies, we make two adjustments to the dollar values of revenue. First, to address differences in revenue resulting from geographic variations in labor market costs, we adjust base district revenue amounts using the CWI prior to calculating our weighted averages (Taylor et al., 2007). 1 Second, we adjust the racial dollar difference measures to account for typical revenues in a state. This addresses the fact that a difference of one dollar will be more substantial in a state with lower revenue (e.g., North Carolina, which received $8,926.30 in per pupil revenue in fiscal year 2013) than it will in a state with higher revenue (e.g., New York, which received $23,282.87 in per pupil revenue in the same year). We use average total revenue in 2006 to represent typical revenues in a state. We divide our dollar differences by this value and multiply by $10,000. This value can be interpreted both in terms of dollar values and in terms of the percent of a state’s typical revenue (e.g., a dollar value of $500 is equivalent to 5% of typical revenue). Findings presented here are robust to these two adjustments. Futhermore, this racial dollar difference is a ratio of dollars to dollars in the same year and is thus unaffected by inflation.
Independent Variables
The independent variables are measures of segregation. The first measure of segregation captures Black-White and Latinx-White between-district racial segregation and is equivalent to the variance ratio index when there are only two racial groups (Reardon & Owens, 2014). This measure is the difference between the weighted average of Black/Latinx enrollment in Black/Latinx students’ districts versus White students’ districts.
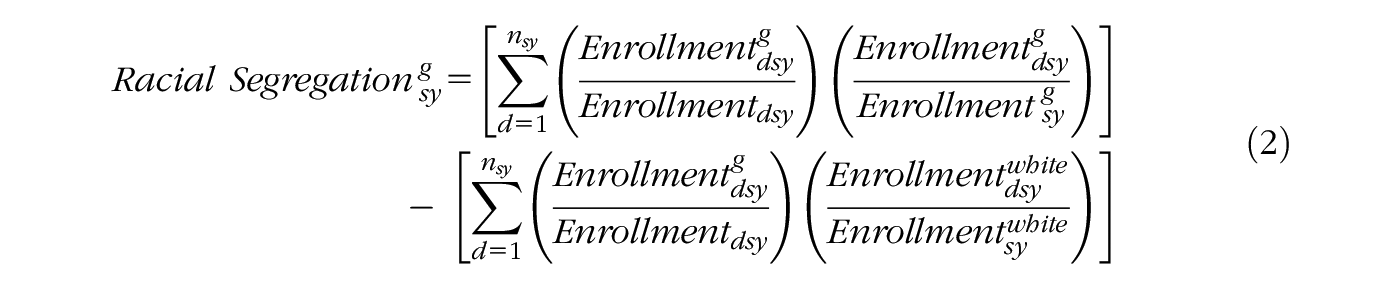
Positive values mean that the average Black or Latinx student is in a district with greater Black or Latinx enrollment than the average White student (thus greater racial segregation). A value of zero indicates racial parity in enrollment across districts within a state.
To capture disparities in poverty contexts, we use a variation of Equation (2) to calculate Black-White and Latinx-White socioeconomic segregation, using SAIPE estimates of child poverty rates within school district boundaries. Analogous to the racial segregation measure, positive values mean that the average Black or Latinx student is in a district with a higher rate of neighborhood child poverty than the average White student. While education studies often use free- or reduced-price lunch (FRL) eligibility as a proxy for school and district poverty rates, SAIPE has several advantages for our study. First, because SAIPE poverty estimates are for those living in the district boundaries as opposed to those actually attending schools in the district, it relates more to neighborhood contexts that may be driving funding levels. Second, SAIPE is based on surveys of households, whereas FRL is based on students and families voluntarily returning applications for the FRL program. This suggests that SAIPE more accurately captures true poverty rates (Knight & Mendoza, 2019). Third, SAIPE poverty estimates are used for the administration of federal programming, distributing funding to localities, and managing programs (U.S. Census Bureau, n.d.). As such, we would expect that changes in this measure of poverty would more accurately align with changes in federal funding allocated to districts than FRL rates.
Control Variables
We control for a similar set of confounding variables as in Sosina and Weathers (2019). To account for changes in segregation that result from demographic trends among other racial groups (e.g., changes in Black-White segregation that result from changes in the Latinx population), we control for Black-White differences in Latinx enrollment and Latinx-White differences in Black enrollment. We also control for disparities in district size (measured as the number of schools for every 1,000 students), English language learner (ELL) enrollment, special education enrollment, urbanicity (see Supplemental Appendix Table A3 in the online version of the journal for details on the construction of our measure of urbanicity), and average state-level racial composition and child poverty.
Empirical Model
Our empirical model is represented in the following equation:

In this model, revenue disparities in subcategory
While the evidence in this article cannot cleanly identify a causal relationship between racial disparities in school district revenue and our measures of segregation, there are several benefits to the specification used in this analysis. First, using state fixed effects that limit our analysis to variation within states over time eliminates unobserved time-invariant state-specific confounders, accounting for differences between states that are constant over time. Second, using year fixed effects accounts for secular trends across states. For example, one concern might be that segregation is changing over time as states are simultaneously adopting more equitable funding policies. Adding year fixed effects helps address this possible source of confoundedness between states. There may be concern about the variation we are leveraging in our analyses or that our coefficients will not be stable due to collinearity. We obtain the correlation between the residuals of a regression of racial segregation on state and year fixed effects and the residuals of a regression of racial socioeconomic segregation on state and year fixed effects. See Supplemental Appendix Figure A1 in the online version of the journal. 2
Second, by differencing average per-pupil revenue by race (i.e., using racial disparities in revenue), we eliminate any state-by-year factors that are correlated with segregation that may affect Black or Latinx and White students’ revenues equally and is a more robust approach than simply using average per-pupil revenue by race as the outcome. Though, there may still be differences in the unobserved determinants of per-pupil revenue between Black and White and Latinx and White students (Card & Rothstein, 2007).
School segregation is in part the product of lingering effects of historical social policies (e.g., redlining), existing education policies (e.g., school district secession), and family choices and constraints on where to live and where to attend school (Hanushek & Rivkin, 2009). These systematic factors complicate the ability to isolate exogenous variation in segregation that can be used to identify the causal effect of segregation on racial disparities in school district revenue. While the use of state and year fixed effects greatly reduces confoundedness between our measures of segregation and racial disparities in school district revenue, our models are still subject to time-varying omitted variable bias. One such threat is that students and families move in and out of school districts (e.g., Michigan allows for choice between districts). If students and families are exercising choice and this changes the composition of a district in ways that are not directly related to race or socioeconomic status, this could bias our estimates. We are unable to capture such patterns in this analysis.
A second concern is simultaneity bias. It is possible that changes in segregation and racial disparities in revenue are determined simultaneously. A school district’s revenues could influence family enrollment decisions, which would directly influence the racial and socioeconomic composition of a district. We are unable to determine whether changes in our measures of segregation influence changes in racial disparities in revenue or if changes in racial revenue disparities influence changes in segregation. However, given the structures of school funding policies and practices that give funding weights to specific student characteristics to allocate funding across districts, particularly at the federal and state levels, it seems more theoretically plausible that the characteristics of school districts influence the allocation of school district revenues. Given these analytical challenges, we emphasize that our estimates are not causal, but descriptive.
Results
Levels and Trends in Segregation and Revenue Disparities
Figure 1 shows levels of total revenue by revenue source in the typical Black and White students’ districts for each state in the 2013 fiscal year. These levels do not account for student need. States are sorted by total revenue in the typical White student’s districts. From Figure 1, we see that there is variation in the proportion of state and local revenue across states. We also see that some of the states with the highest per pupil total revenue, such as Connecticut, New York, and New Jersey, have sizeable racial gaps in local revenue. In New York, it appears that state and federal sources do not fully make up for that gap, leaving the typical Black student’s district with slightly less total revenue than the typical White student’s district. Whereas in New Jersey, federal and state revenue make up for local revenue shortfalls, leaving the average Black student’s district with slightly more total revenue than the average White student’s district. Similar patterns are evident for revenue in the typical Latinx and White students’ districts (Figure 2).

Black and White levels of total revenue, by revenue source.
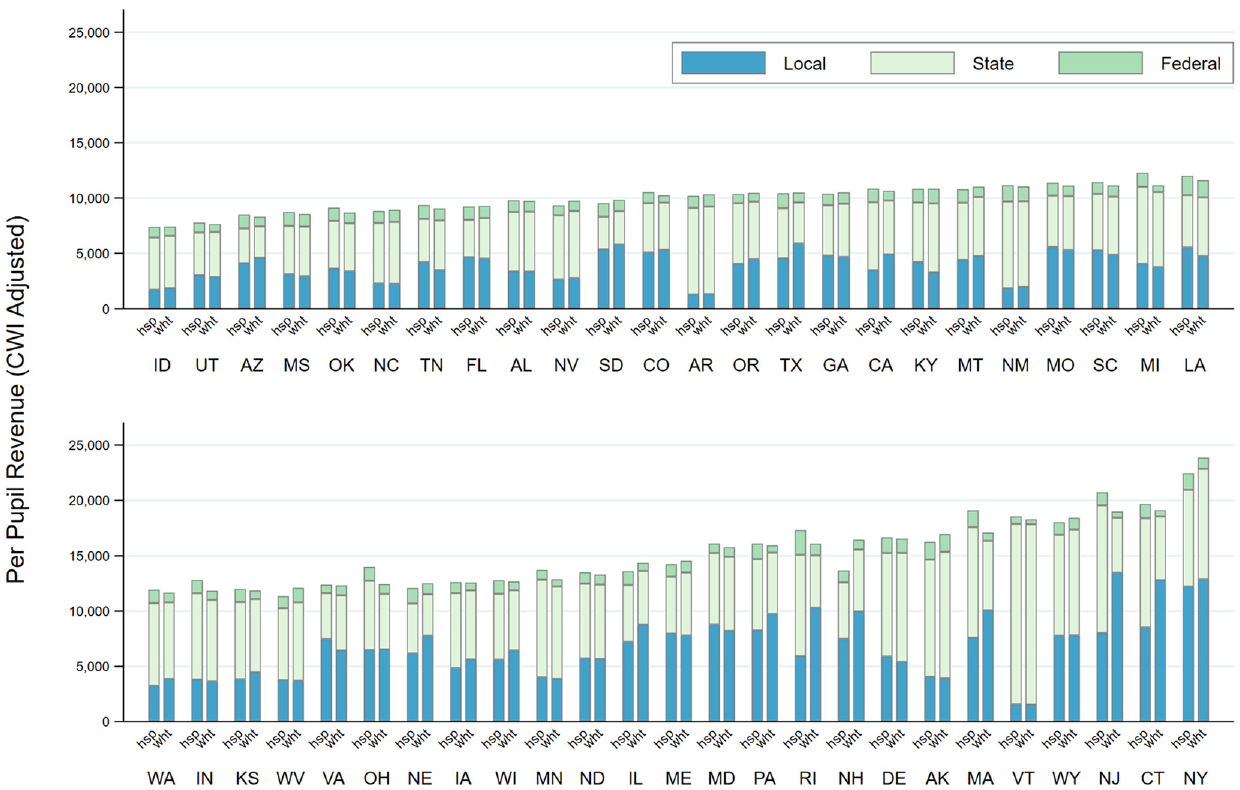
Latinx and White levels of total revenue, by revenue source.
Table 2 details the levels of CWI cost-adjusted revenue disparities as well as the predictors and controls in our models. From Table 2, we can see that across all states and years in the sample, the average Black and Latinx student’s district has less local revenue and more state and federal revenue than the average White student’s district. On average, the typical Black student’s district has $310.84 less per pupil local revenue than the typical White student’s district. The typical Latinx student’s district has $289.70 less per pupil local revenue than the typical White student’s district. Table 2 also shows that, on average, state, federal, and total revenue is higher in the typical Black and Latinx student’s districts relative to the typical White student’s district. Note that the means presented in Table 2 (and Figures 1 and 2) are descriptive and not adjusted for factors such as poverty or disability status that indicate different levels of student need. These descriptive patterns are to be expected if Black and Latinx students tend to be enrolled in districts with higher rates of poverty, lower local capacity for school funding, and less local funding as a result. The average positive difference between Black/Latinx and White students’ districts is consistent with the compensatory nature of state and federal funding formulas that target student need. Furthermore, Black and Latinx students tend to be in districts with greater proportions of free lunch-eligible students, higher rates of neighborhood child poverty, and more Black and Latinx students relative to White students.
Levels and Trends of Outcome Variables, Predictors, and Controls (Unadjusted)

Note. N = 49 states. For levels, means are first calculated within states across all years and then calculated across all states. Revenue dollar differences are standardized by dividing per pupil differences by total revenue in each state in 2006 (the median year of data) and multiplying by 10,000. They can be interpreted as dollar disparities in per pupil revenue per $10,000 of average revenue in the state. Trends are based on regressions of each variable on year in separate regressions for each state. Descriptive statistics of these trends are calculated across all states. ELL = English language learner; SAIPE = Small Area Income and Poverty Estimates.
To examine typical trends across years within a state, we regress our outcomes and key predictor variables on fiscal year in separate regressions for each state. The slope of the fiscal year variable gives an indication for how each variable has changed across the years in our sample for each state. We then compute the mean of this slope across all states in our sample. Table 2 presents the mean and other descriptive statistics for the trends in outcome variables and key predictors. For example, the mean of the trend in Black-White total revenue dollar differences is $16.16, meaning that, on average, across states, the Black-White difference in total revenue has been growing by $16.16 each year. This could occur if the typical Black students’ district is receiving more, the typical White students’ district is receiving less, or some combination of both those trends are occurring. In contrast, the Black-White difference in local revenue has been getting smaller, on average, shrinking by $11.55 each year.
Figures 3 and 4 depict the change in between-district racial segregation and racial socioeconomic segregation between the first (1999 for most states) and last (2013 for most states) years a state is in our analytical sample. The markers are weighted by Black or Latinx student enrollment in the state in the last year a state is in the analytical sample. As highlighted in Figure 3, Black-White racial segregation decreased across most states. Though, some states with relatively low enrollment of Black students experienced increases in Black-White racial segregation. Of note is the roughly 0.20 decrease in Black-White segregation between districts in Michigan. Latinx-White racial segregation between districts declined in states with the largest enrollment of Latinx students, though the magnitude was smaller than the Black-White racial segregation trend. Moreover, there are more states that experienced small increases in Latinx-White racial segregation during the sample years. This trend aligns with prior literature that found decreases in Black-White between-district racial segregation and modest increases in Latinx-White racial segregation in the 2000s (Reardon & Owens, 2014). Figure 4 depicts changes in racial socioeconomic segregation. We include a vertical line at zero to represent equal poverty in the typical Black and White (or Latinx and White) students’ districts in the first analytical year. Across most states, poverty rates were higher in the typical Black and Latinx students’ districts than the typical White student’s district at the start of the analytical sample. Moreover, there is greater variation in the direction of racial socioeconomic segregation trends and the magnitude of the changes is smaller than for racial segregation.
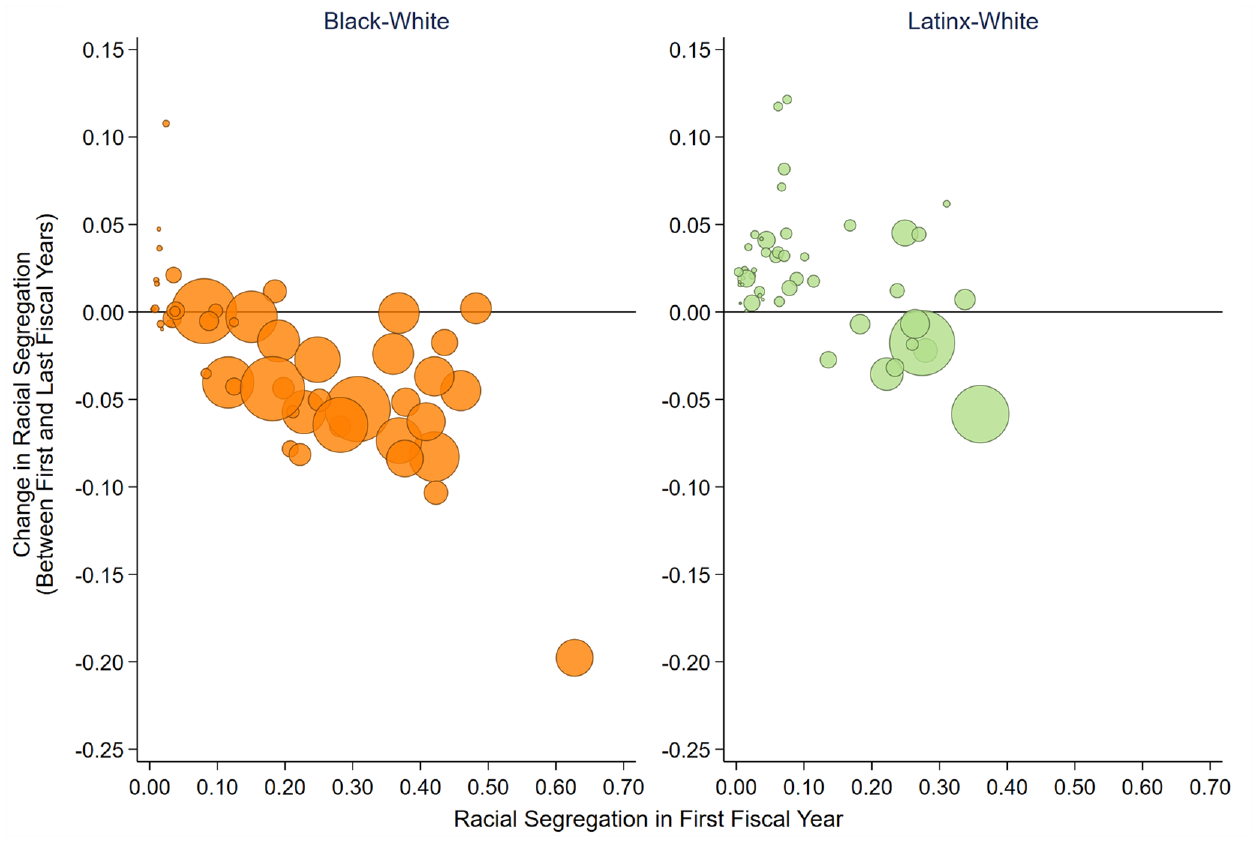
Change in between-district racial segregation from first to last fiscal years.
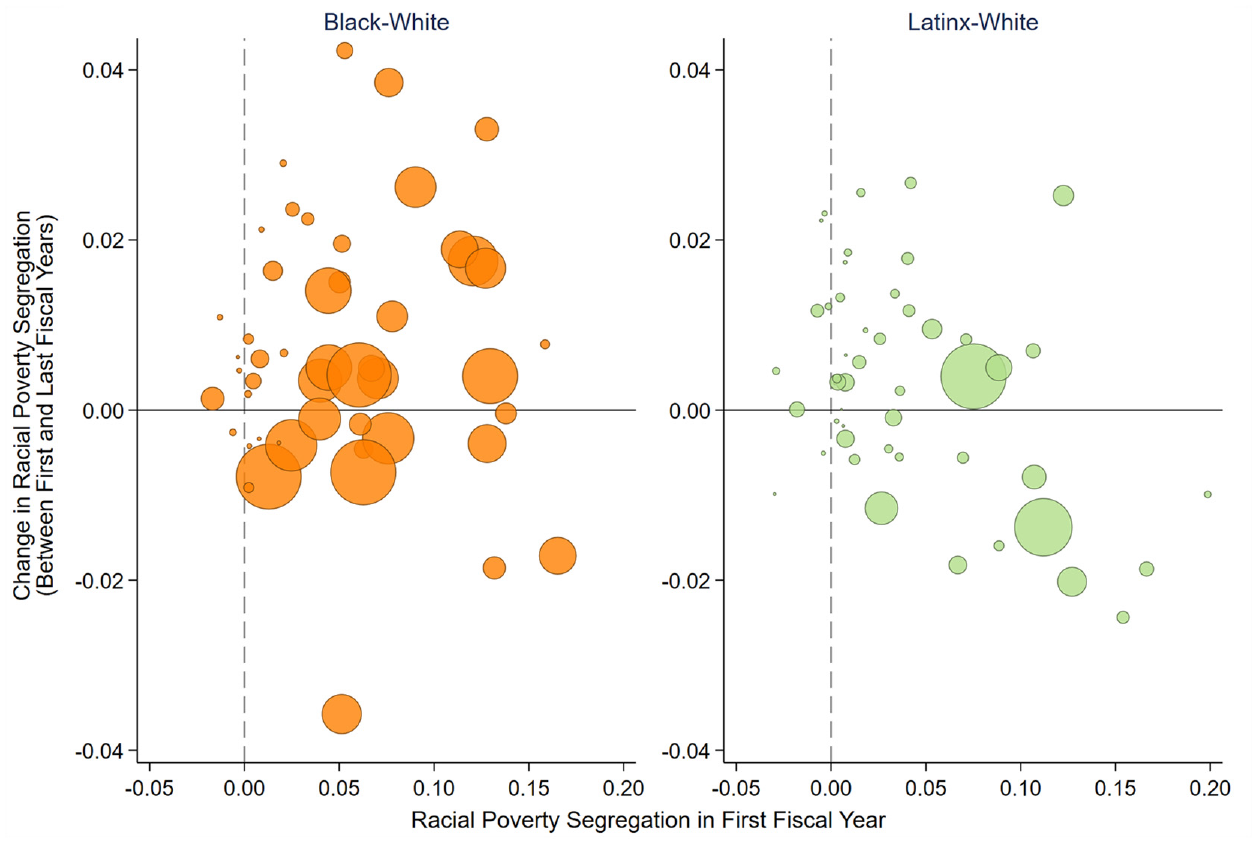
Change in between-district racial socioeconomic segregation from first to last fiscal years.
Black-White Revenue Disparities
The top panel of Table 3 presents results from our main models. We regress Black-White revenue dollar differences on Black-White racial segregation, Black-White socioeconomic segregation, Black-White other group racial segregation, Black-White differences (i.e., number of schools, special education enrollment, ELL enrollment, and urbanicity), state-level student demographics, state invariant differences, and time-invariant differences with clustered standard errors. Recall that negative coefficients indicate relative shifts in revenue that disfavor the average Black student’s district (and thus favors the average White student’s district), while positive coefficients indicate relative shifts in revenue that favor the average Black student’s district (and thus disfavors the average White student’s district). 3 If the average Black student’s district starts out with more per pupil revenue than the average White student’s district and there is a relative shift away from the average Black student’s district, this could be seen as a reduction in the Black-White funding disparity that favors the average White student’s district. However, if the average Black student’s district starts out with less or equal amounts of per pupil revenue as compared with the average White student’s district, a relative shift away from the average Black student’s district could be seen as an increase in the Black-White funding disparity that disfavors the average Black student’s district. While our analyses cannot distinguish between these nuances, examining whether revenue shifts in any direction in the context of increasing racial and racial socioeconomic segregation can identify potential contributors of inequities in educational opportunity and has important implications for school finance and tax policy.
Estimated Partial Associations Between Segregation and Racial Disparities in Revenue
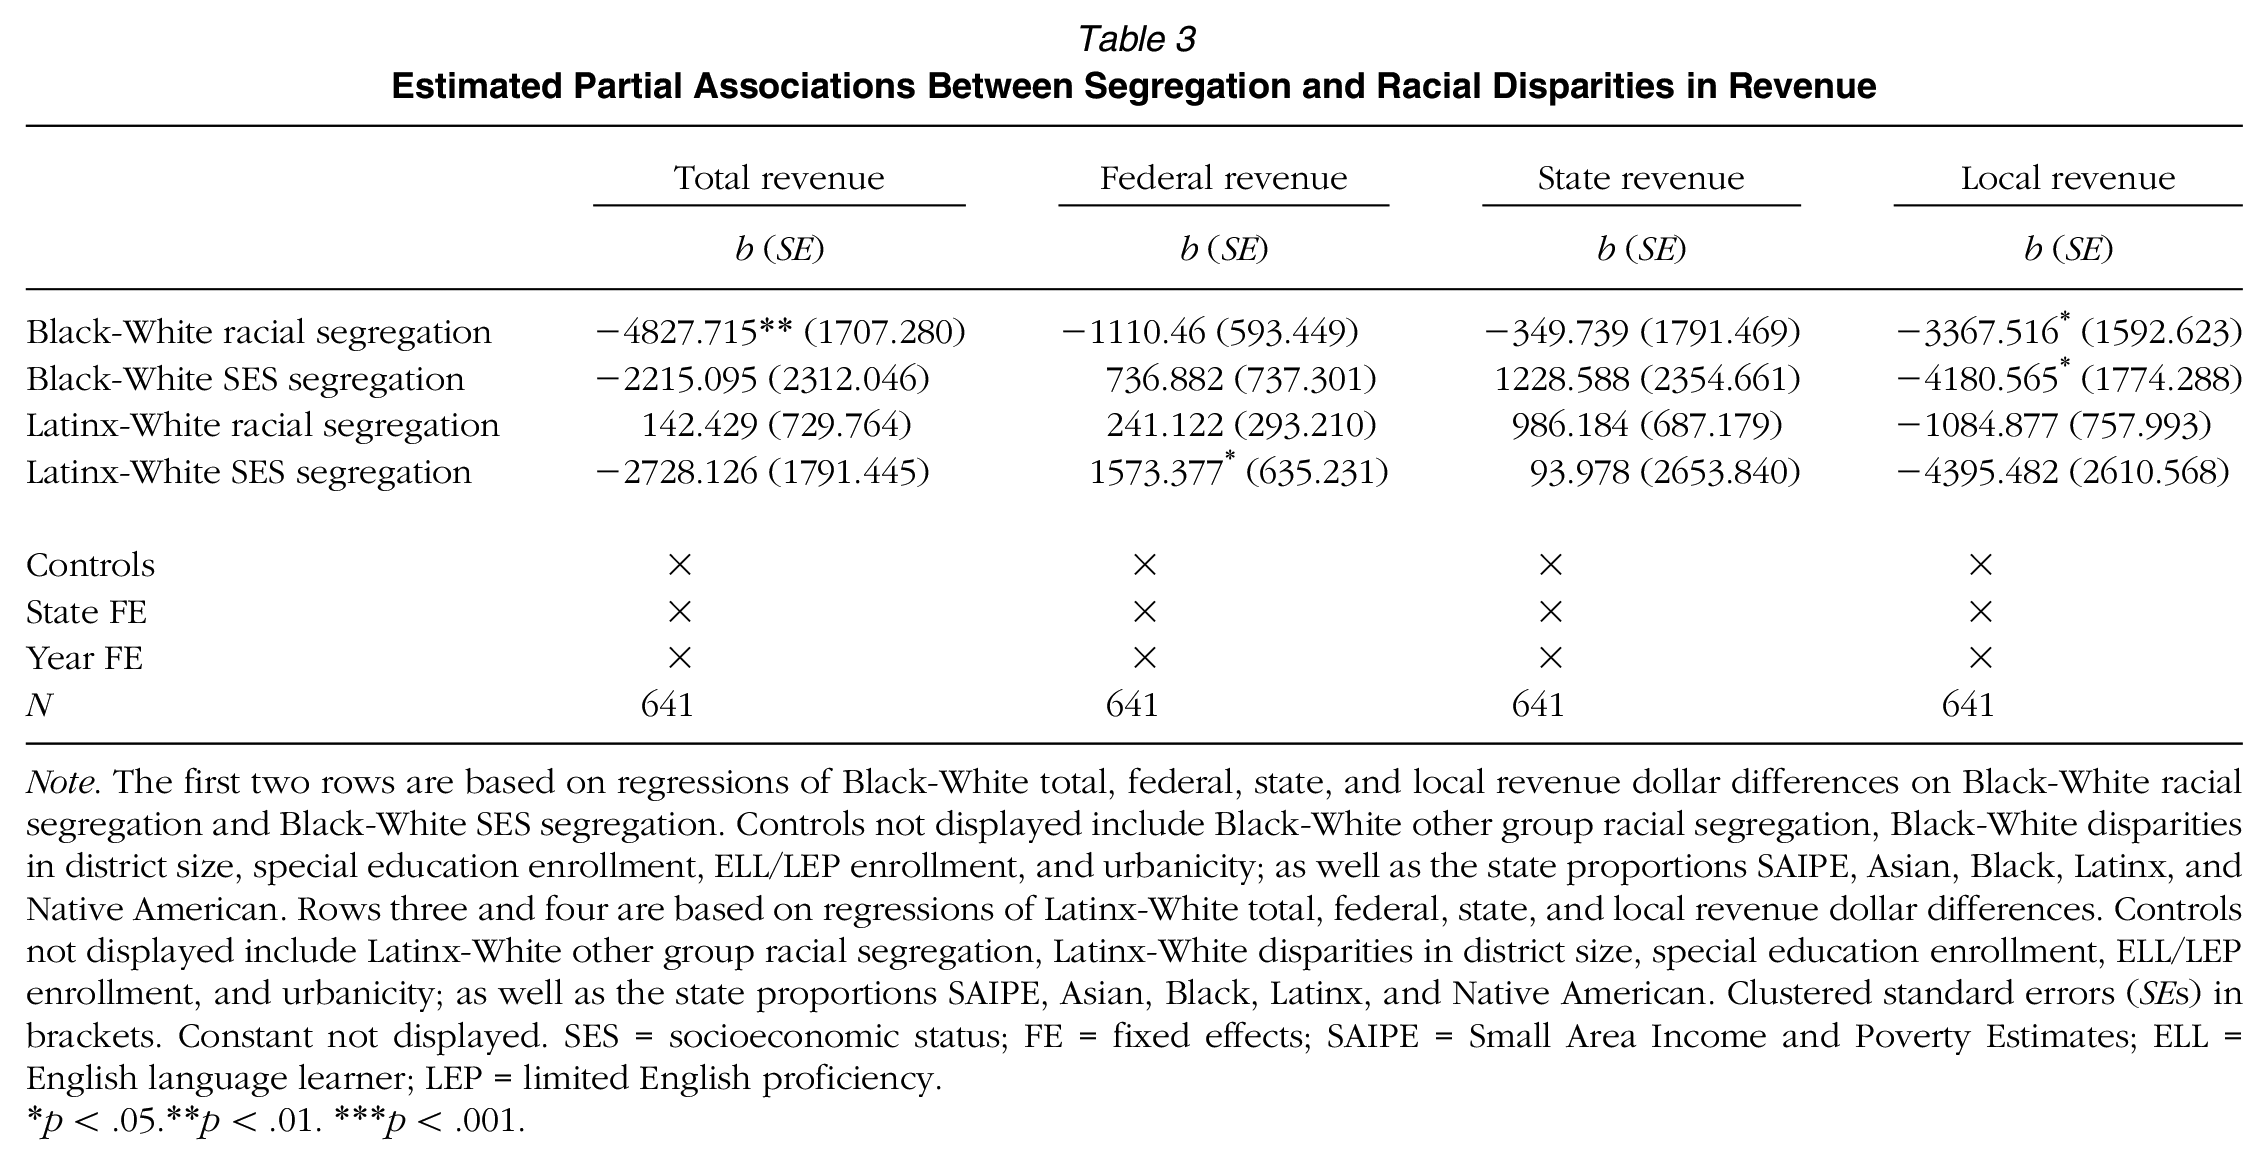
Note. The first two rows are based on regressions of Black-White total, federal, state, and local revenue dollar differences on Black-White racial segregation and Black-White SES segregation. Controls not displayed include Black-White other group racial segregation, Black-White disparities in district size, special education enrollment, ELL/LEP enrollment, and urbanicity; as well as the state proportions SAIPE, Asian, Black, Latinx, and Native American. Rows three and four are based on regressions of Latinx-White total, federal, state, and local revenue dollar differences. Controls not displayed include Latinx-White other group racial segregation, Latinx-White disparities in district size, special education enrollment, ELL/LEP enrollment, and urbanicity; as well as the state proportions SAIPE, Asian, Black, Latinx, and Native American. Clustered standard errors (SEs) in brackets. Constant not displayed. SES = socioeconomic status; FE = fixed effects; SAIPE = Small Area Income and Poverty Estimates; ELL = English language learner; LEP = limited English proficiency.
p < .05.**p < .01. ***p < .001.
Since a one-unit change in segregation, or going from no segregation to complete segregation, is large in magnitude and unlikely in practice, our results can be contextualized by thinking of segregation in smaller units of change that better reflect the variation in segregation over the sample period. For example, we consider the within-state standard deviation of Black-White racial segregation trends of 0.004 or 0.056 over 14 years, the number of year-to-year changes in our panel. We scale all results according to this value.
Black-White racial segregation is a significant predictor of Black-White total and local dollar differences even after controlling for Black-White socioeconomic segregation. As Black-White racial segregation increases, the Black-White total and local dollar difference decreases in a way that shifts funding away from the average Black student’s district relative to the average White student’s district. 4 More specifically, a one unit increase in Black-White racial segregation is associated with a $4,827.72 decrease in total per pupil revenue and a $3,367.52 decrease in local per pupil revenue (for every $10,000 of total revenue) in the typical Black student’s district relative to the typical White student’s district. When we scale our results (as highlighted earlier), the typical Black student’s district in a state that experienced a 0.056 unit increase in Black-White racial segregation would experience a $270.35 relative decrease (i.e., −$4,827.72 × 0.056) in total per pupil revenue and a $188.58 relative decrease (i.e., −$3,367.52 × 0.056) in local per pupil revenue for every $10,000 of average total per pupil revenue. The magnitude of these changes represents roughly 2.7% and 1.9%, respectively, of a state’s average total per pupil revenue in 2006. While we cannot rule out null effects at conventional levels, Black-White racial segregation is also marginally negatively associated with the Black-White federal revenue dollar difference.
Black-White socioeconomic segregation is a significant predictor of the Black-White local revenue disparity. A 0.056 unit increase in Black-White socioeconomic segregation is associated with a $234.11 relative decrease (i.e., $4,180.57 × 0.056) in local per pupil revenue. Contrary to our predictions that Black-White federal and state revenue disparities would increase (i.e., shift money toward the average Black student’s district) as Black-White socioeconomic segregation increased, we did not find evidence to support these predictions.
Latinx-White Revenue Disparities
The bottom half of Table 3 presents results from our models regressing Latinx-White revenue disparities on Latinx-White racial segregation, Latinx-White socioeconomic segregation, Latinx-White other group racial segregation, Latinx-White differences (i.e., number of schools, special education enrollment, ELL enrollment, and urbanicity), state-level student demographics, state invariant differences, and time-invariant differences, and with clustered standard errors. Contrary to our findings for Black-White revenue disparities, there is no significant relationship between Latinx-White racial segregation and Latinx-White total, federal, state, or local revenue disparities.
Latinx-White socioeconomic segregation significantly predicts Latinx-White disparities in federal per pupil revenue. A 0.056 unit increase in Latinx-White socioeconomic segregation is associated with a $88.11 relative increase (i.e., $1,573.38 × 0.056) in federal per pupil revenue. Latinx-White socioeconomic segregation is marginally and negatively related to the Latinx-White local dollar difference. While we cannot rule out null effects at conventional levels, these findings are suggestive of a relationship between Latinx-White socioeconomic segregation and Latinx-White local revenue disparities.
Additional Analyses
We perform several additional analyses to explore state level policies and local characteristics, including court-ordered school finance reforms, tax and expenditure limits, fiscal dependency, and the progressiveness of local funding. We also conduct a robustness check by limiting the analytic sample to state-years where at least 1% of the state’s student population is Black (for Black-White regressions) and Latinx (for Latinx-White regressions). Background and rationale for these additional analyses can be found in Supplemental Appendix B in the online version of the journal. Results for these additional analyses are detailed in Supplemental Appendix Tables B1 to B6 in the online version of the journal and are also explained in the Supplemental Appendix.
Discussion
Using longitudinal data for the population of school districts in the United States, we estimate the contemporaneous association between several measures of racial and socioeconomic segregation and multiple forms of racial disparities in school district revenue. We construct standardized dollar differences that capture the funding disparity in average per pupil total, federal, state, and local revenue between the typical Black/Latinx student’s school district and the typical White student’s school district. Standardized dollar differences are adjusted for geographic differences in labor market costs (i.e., CWI cost adjustments). Our models additionally control for a range of factors that may confound the relationship between segregation and funding disparities and approximate some common factors of student need used by some state finance systems, including racial disparities in urbanicity, ELL enrollment, special education enrollment, district size, and the enrollment of other racial groups. We also control for average racial composition and neighborhood child poverty within states.
We expected to find that Black-White and Latinx-White socioeconomic segregation would be related to revenue disparities because of federal and state funding allocations that are linked to school district poverty rates and because of the relationship between poverty and local property tax revenue (see Hypothesis 1 in Table 1 for a recap). Yet we only found that Black-White socioeconomic segregation is negatively associated with the Black-White local revenue disparity and Latinx-White socioeconomic segregation is positively associated with the Latinx-White federal revenue disparity. We also predicted that Black-White and Latinx-White racial segregation might be related to racial disparities in revenue after controlling for Black-White and Latinx-White socioeconomic segregation because of a link between race and willingness to fund public education. Furthermore, we expected this relationship to be strongest at the local level (see Hypothesis 2 in Table 1 for a recap). This prediction partially held. As Black-White racial segregation increases, total and local revenue decreases in the average Black student’s district relative to the average White student’s district. The significant and negative association between Black-White racial segregation and Black-White total and local standardized dollar differences net of racial differences in poverty suggests that in the context of increasing Black-White racial segregation, funding inequality between Black and White students is widening. However, this relationship does not occur for Latinx-White racial segregation and Latinx-White revenue disparities. Last, additional analyses find a positive relationship between racial socioeconomic segregation and racial disparities in local revenue in states with more progressiveness in local funding as well as some evidence that fiscal independency of school districts moderates the relationship between segregation and revenue disparities.
Taken together, we draw two conclusions based on our primary regression models. First, purportedly race-neutral local funding policies do not appear to be race neutral after all and could be reproducing educational inequality. At the local level, Black-White racial segregation is negatively related to funding disparities even after accounting for racial disparities in neighborhood child poverty contexts. The disparity at the local level also drives the Black-White disparity in total revenue. This pattern might be a result of a reliance on local property values and taxes to fund schools, practices with historically racist roots. Caps on property tax rates, private donations, and other forms of opportunity hoarding that could be correlated with race in ways above and beyond poverty may be other explanations for our findings. The relationships between fiscal independency, local funding progressiveness, and racial disparities in local revenue further underscore the importance of local stakeholders’ willingness and ability to make decisions about local district spending that prioritize resource equity.
Second, federal and state funding formulas that are designed to be compensatory amidst concentrated poverty appear to be insufficiently so. At the state level, this shortfall could result from the design of funding programs. Features such as hold harmless or minimum aid provisions, additional aid not adjusted for property tax capacity, discretionary grants, using average daily attendance for student counts, flat grants, and property tax relief for higher income districts can all result in regressive, or at least not progressive, funding systems (Baker & Corcoran, 2012). For example, aid outside states’ main equalization formulas that does not adjust for variation in local capacity can end up directing funds toward districts that already have the capacity to raise enough funds locally (Baker & Corcoran, 2012). If the purpose of state aid is to assist districts struggling to raise money locally and to provide additional funding for the educational services in disadvantaged contexts, these results suggest that states, on average, are falling short.
While the findings in this descriptive analysis are based on a sample from 1999 to 2013, recent trends and events in education policy suggest their implications may be even more salient today. For example, racial wealth gaps have widened, and Black families in particular have experienced declines in home equity levels (Percheski & Gibson-Davis, 2020). State-level school funding reforms aimed at increasing equity have tapered off and given way to market-based reforms like vouchers and charter schools that have actually exacerbated school segregation (Monarrez et al., 2019; Wilson, 2016) and likely complicate school funding equity. Policies aimed at suppressing the vote of constituents of color have accelerated following the 2013 Supreme Court decision Shelby County v. Holder (Shah & Smith, 2021), making it more difficult for Black and Latinx communities to leverage political processes to improve school funding. Put together, these factors raise concern that the relationship between segregation and funding disparities may have worsened over the past decade (i.e., 2013 through 2021) and provide further evidence of how racial discrimination adapts over time to exclude Black and Latinx students from the resources available to White students.
Racial differences in revenue that change with increasing segregation are concerning given evidence of a causal relationship between school funding and academic achievement. Along with evidence that segregation is related to student outcomes, our study suggests that school revenue policies may be exacerbating racial inequality in education. Our descriptive findings warrant further inspection into school funding formulas, education finance policies, and tax policies, particularly at the local and state level, to understand whether and how poverty and race are factors in school finance decisions at any level of government.
The primary takeaway of our descriptive analysis is that purportedly race neutral school funding formulas and policies appear to be racialized, which has several implications for research and policy. Research. While school finance research has been policy relevant, one criticism is that much of the scholarship on school funding is ahistorically grounded (Alemán, 2006), ignoring school funding’s overtly racist past. While contemporary school funding policies and practices may not be overtly racist, it is important to remember that racial discrimination is dynamic and regenerative (Boddie, 2016). As such, we urge researchers to contexualize and critically interrogate histories of racism, discrimination, and disenfranchisement in analyses of contemporary education funding policies and practices. Furthermore, what theoretical frameworks and analytic strategies can be put forth to both understand and empirically test “race neutrality” of school funding? Policy. Similarly, we encourage states and locales to explicitly examine race and the allocation of school district revenue. For example, is there something correlated with racial disparities in revenue that is also correlated with race/racial segregation for which we do not or cannot account for in our analysis? Additionally, our results suggest that federal and state revenue insufficiently compensate for local revenue shortfalls in the context of increasing racial segregation (net of racial socioeconomic segregation). As such, if equitable school funding is the goal, should state revenue formulas include funding weights or multipliers for racial segregation and/or racial socioeconomic segregation? Finally, we encourage states and locales to examine the implementation of and adherence to current funding formulas, policies, and practices. Some questions to consider include: What is the role of stakeholder decision making, and does the role and power of stakeholders vary across districts within states? Do features of funding formulas contribute to racial inequality in school district revenue? The latter is particularly relevant given findings from a recent analysis of Pennsylvania’s school funding formula. In 2016, Pennsylvania created “The Fair Funding Formula” to distribute state equalization aid to school districts based on student and district need. The Fair Funding Formula was accompanied by a technical provision that ensured every district would receive at least the same amount of state aid prior to the implementation of the Fair Funding Formula regardless of current student and district need. This provision resulted in less than 10% of state equalization aid actually being distributed based on current student and district needs. The school districts that were negatively impacted by this provision were disproportionately Black and Latinx (Kelly, 2021).
While the current study was not causal in nature, the fact that racial segregation and racial disparities in revenue trend together (net of racial socioeconomic segregation) suggests that there is work to be done for researchers and policymakers to understand purportedly race neutral policies that impact the equitable allocation of school district revenue.
Supplemental Material
sj-pdf-1-aer-10.3102_00028312221079297 – Supplemental material for Separate Remains Unequal: Contemporary Segregation and Racial Disparities in School District Revenue
Supplemental material, sj-pdf-1-aer-10.3102_00028312221079297 for Separate Remains Unequal: Contemporary Segregation and Racial Disparities in School District Revenue by Ericka S. Weathers and Victoria E. Sosina in American Educational Research Journal
Footnotes
Supplemental material for this article is available online.
Notes
E
V
References
Supplementary Material
Please find the following supplemental material available below.
For Open Access articles published under a Creative Commons License, all supplemental material carries the same license as the article it is associated with.
For non-Open Access articles published, all supplemental material carries a non-exclusive license, and permission requests for re-use of supplemental material or any part of supplemental material shall be sent directly to the copyright owner as specified in the copyright notice associated with the article.
