



Abstract
Challenges in the measurement of racial disparities in school discipline are a significant barrier to identifying policy and programmatic reforms that are effective at closing gaps. This article reviews key measurement issues and presents a set of empirical analyses as an illustrative case study. Specifically, we reframe the interpretation of discipline data in light of initiatives designed to reduce racial discipline disparities. We also characterize common metrics and recognize several additional ones for use in discipline disproportionality outcome evaluations. Leveraging a statewide policy reform as an example, we report findings from a quasi-experimental evaluation, which demonstrated that the various metrics can point to differing conclusions. We conclude with proposed guiding principles for the selection and use of discipline disproportionality metrics in evaluations.
Keywords
School discipline reform efforts have gained traction at the federal, state, and local levels in response to general recognition of the harmful effects of exclusionary discipline on students (Skiba & Losen, 2016). Exclusionary discipline is the punitive removal of a student from the learning environment as a means of enforcing student compliance with school rules and behavioral expectations (Allman & Slate, 2011). It often takes the form of office discipline referrals (removing students from the classroom; e.g., Anyon et al., 2018), in-school suspensions (placing students in alternative settings within the school; e.g., Cholewa et al., 2018), out-of-school suspensions (OSS; temporary school removal; e.g., Griffin et al., 2020), and expulsions (permanent school removal; e.g., Camacho & Krezmien, 2020). Research has consistently shown this approach to managing discipline is ineffective and potentially harmful (American Psychological Association [APA], 2008), and that it is excessively used with minoritized students, including students with disabilities and students of Color (Camacho & Krezmien, 2019). As such, exclusionary discipline has been critiqued for both mirroring and contributing to societal injustices (Gregory et al., 2021).
Despite evidence of harm and consistently differential impacts, exclusionary discipline is used at extraordinarily high rates in public schools, with some top-suspending districts suspending 45% to 62% of their entire secondary school student enrollments in a given year (Losen et al., 2015). Nationally, about 2.5 million K–12 students are suspended out-of-school one or more times in a school year (an overall rate of 4.9% in the 2017–2018 school year; U.S. Department of Education, 2021). Of these, nearly 1 million are Black and African American public-school students, who are suspended at a rate that quadruples that of their White peers (12.9% versus 3.3%) and triples that of their Hispanic or Latine peers (3.8%; 2017–2018 data; U.S. Department of Education, 2021). When focusing on students at secondary grade levels (i.e., in middle and high schools), suspension rates are even higher (Losen et al., 2015), and Black students in secondary schools are especially subjected to high rates of suspensions (Camacho & Krezmien, 2019). For example, in one year, the state of Wisconsin suspended 34% of its entire Black secondary student enrollment (Losen et al., 2015). Racial discipline disparities also increase exponentially at intersections of Black students’ other identities. National data suggest that Black boys in secondary school are in the range of seven to eight times as likely as White girls to be suspended (28.4% vs. 3.8%; Losen et al., 2015). These alarming rates and discrepancies illustrate the overwhelming extent to which some schools and districts rely on exclusion as a discipline tool and disproportionately utilize it with Black students in particular.
Although research identifying racial disparities in discipline data date back nearly 50 years (Children’s Defense Fund, 1975), states, districts, and schools have been held more accountable for addressing these disparities in recent years through federal guidance and state policy reforms focused on disproportionate exclusionary discipline. Yet a major obstacle in both the effective implementation of such reforms and assessment of their effects is a lack of valid and reliable methods for identifying and surveilling discipline disparities over time. Operationalizing discipline disparities for evaluations of change over time has proven exceedingly challenging (Curran, 2020; Girvan et al., 2019). There is a lack of consensus on a single metric of discipline disproportionality, which has impeded state and district efforts to monitor progress, as well as research efforts to assess intervention effectiveness. Building consensus on appropriate, psychometrically sound methods to evaluate change in discipline disparities over time is a critical next step in our efforts to identify and refine promising and effective policy reforms and equity-driven discipline models.
In this article, we contextualize the historical interpretation and use of discipline disproportionality metrics and associated discipline rates in education. We then highlight educational initiatives intended to reduce discipline disparities, leveraging an example from one state-level policy reform targeting disproportionate discipline impact as an illustration through which we identify measurement and analytic challenges. Next, we characterize and illustrate, through examples, the strengths and weaknesses of common disproportionality metrics and recognize several potentially more valid and reliable metrics for researcher and practitioner use when evaluating policy or programmatic effects. Finally, we present an illustrative analysis of statewide, longitudinal data highlighting how examination of the various disproportionality metrics as outcomes can lead to differing conclusions about improvement over time and intervention effectiveness. Based on these findings, we propose a set of principles to guide the field in establishing best practices in the selection and use of metrics for evaluating program and policy effects on discipline disparities.
Reframing the Interpretation of Discipline Data
Data on exclusionary discipline sanctions have historically been utilized in education as an indicator of student problem behavior (e.g., rule- or norm-breaking behaviors; Sugai et al., 2000), school disorder (e.g., Bradshaw et al., 2015), or a a student’s need for social-emotional, mental, or behavioral health supports (McIntosh et al., 2009). For example, many schools use office discipline referral (ODR) data to identify students in need of more intensive interventions (Irvin et al., 2004; Pas et al., 2011). However, this interpretation and use of discipline data fails to recognize the complex underlying processes and dynamics within the social and institutional space of the school, including racial and cultural biases, which can lead to challenging student behaviors and adults’ punitive responses to it (Eccles & Roeser, 2011). As such, the interpretation and use of disciplinary data as an indicator of student behavior alone inappropriately decontextualizes students and risks overlooking root causes leading to student disciplinary consequences (e.g., inequities and bias within school institutional policies and the sociocultural environment of the school), which, in turn, can lead to the use of less effective solutions. Moreover, this approach reflects a deficit-centered explanation of the problem of racial disparities in discipline. The view that racial discipline disparities are a reflection of shortcomings in Black students’ social, emotional, and behavioral competencies has been firmly rebutted by ample research showing that these disparities cannot be explained solely by racial differences in the frequency or severity of student misconduct (Bradshaw et al., 2010; Girvan et al., 2017; Huang, 2020; Peguero & Shekarkhar, 2011; Skiba et al., 2014).
Rather, there is a growing body of research highlighting that racial bias explains racial disparities in discipline data (Chin et al., 2020; Gilliam et al., 2016). For example, several studies have found that Black students are significantly more likely to receive ODRs and suspensions for accumulated subjective, teacher-perceived relational offenses (also called “soft” offenses, e.g., defiance, insubordination, disrespect), whereas White students are more likely to receive ODRs and suspensions for objectively evident violations (e.g., graffiti, smoking on school property, physical fights; Girvan et al., 2017; Skiba et al., 2002). Moreover, when controlling for teachers’ own ratings of behavior problems and classroom covariates, Black students are still 24% to 80% more likely than White students to receive an ODR (with the range reflecting different types of perceived offenses resulting in an ODR; Bradshaw et al., 2010). Other research has shown that White teachers’ negative racial attitudes about Black students influence their assessments of Black students’ behavior problems (Kang & Harvey, 2020) and that, when primed to expect difficult behavior, teachers gazed longer at Black children (Gilliam et al., 2016). More recent research has established direct associations between racial biases with school racial discipline disparities, including finding that racial discipline disparities were associated with teachers’ (Chin et al., 2020) and principals’ (Gullo & Beachum, 2020) implicit and explicit biases. Other studies have shown that racial disparities in school discipline were associated with county- and community-level rates of racial bias (Girvan et al., 2021; Riddle & Sinclair, 2019).
These data reflect a strong need to reframe the interpretation and use of exclusionary discipline rates and metrics of discipline disproportionality. An underlying assumption of such a paradigm shift is that the excess and disproportionate use of exclusionary discipline is at least partially an indicator of biased disciplinary practices in local school systems and that staff (principal, teacher) behaviors, rather than student behaviors alone, must change for racial discipline gaps to close. Toward that end, some states and local education agencies (e.g., Maryland State Department of Education [MSDE, 2017]) have established formal root cause analysis processes to build consensus on the interpretation of these metrics as part of a process in which the problem and its causes are agreed upon, before developing solutions. Through this review process, which can be facilitated through disproportionality review teams (DRTs; i.e., staff assigned to assess disproportionate discipline practices within the school; MSDE, 2017), alternative interpretations are formulated. For example, rather than implicit assumptions about student deficits, DRTs may identify breakdowns in student-teacher relationships, which have racial dimensions that necessitate further attention. DRTs may identify specific locations and times of day with heightened risk of these racialized, relational breaks during disciplinary encounters (consistent with research on sources of discipline disparities, e.g., Anyon et al., 2018; McIntosh et al., 2021). An outcome of this process is that the meaning and interpretation of metrics of racial discipline disproportionality then shifts from a reflection of Black student behavior or needs alone to a broader view of Black youth in sociopolitical context, whereby schools are analyzed as a racialized space that either supports or hinders Black youth’s positive development. Thus, root cause analyses have the potential to decenter deficit-based stances and instead support school staff to ally themselves with Black youth. This is one such approach that states and school divisions have taken to try to change the narrative on discipline data and helps contextualize our review of various approaches to reducing and measuring discipline disparities.
Educational Initiatives to Reduce Discipline Disparities
Policy Initiatives
Although revoked under the Trump administration, the Biden administration has signaled it will reinstate Obama-era civil rights guidance on the disproportionate discipline of Black students (Green, 2021). In addition, in its broadened definition of school success, the Every Student Succeeds Act (ESSA; 20 U.S.C. § 6301, 2016) imposed accountability in state plans to include at least one nonacademic factor reflective of school quality—including discipline—and to be able to disaggregate data to show how it affects different subpopulations within the school, including by race/ethnicity. Even more explicit accountability mechanisms for racial disparities in exclusionary discipline have emerged at the state level in recent years.
For example, Maryland is one state that has been ahead of the curve in implementing regulations to hold its schools and school districts accountable for reducing racial disparities in their use of exclusionary discipline. In the mid-2010s, Maryland invested in a comprehensive, community- and expert-informed process to develop a method for measuring, monitoring, and ultimately reducing racial discipline disparities. In 2013, the Maryland State Board of Education passed regulatory amendments that required local boards of education to adopt positive discipline policies, stating that OSS and expulsions should be used as a consequence of last resort. The revised regulation further required the MSDE to develop a disproportionate impact model to detect schools and local school systems where exclusionary discipline disproportionately impacts minoritized groups and develop a plan to correct it. As outlined in the Code of Maryland Regulations (COMAR; 13A.08.01.21), the “Reducing and Eliminating Disproportionate/ Discrepant Impact” amendment required that MSDE operationalize a metric of the extent of the disparity in discipline by racial and ethnic group for local school systems to use to surveil disproportionate impact. Local school systems with identified schools were required to conduct root causes analyses and implement corrective action (i.e., plans to reduce disproportionate impacts in one year and eliminate it within 3 years).
Programmatic Initiatives
As an accompanying resource to the Maryland disproportionate impact regulation rollout, the state provided a menu of alternative discipline models and interventions local school systems could employ (MSDE, 2017). Positive behavioral interventions and supports (PBIS; Sugai & Horner, 2006) was one of the key approaches supported in this resource. Although research examining the effects of school-wide PBIS (SW-PBIS) has found that it reduces behavior problems and discipline referrals (Bradshaw et al., 2012; Pas et al., 2019), research on the effects of PBIS on racial disparities in suspensions is mixed. Specifically, some studies have found positive effects of statewide implementation of SW-PBIS on racially disproportionate discipline (Gage et al., 2019), and others have shown that SW-PBIS narrowed but did not close discipline gaps (Vincent & Tobin, 2011; Vincent, Swain-Bradway, et al. 2011). However, another study in SW-PBIS trained schools found that SW-PBIS coaching had no impacts on discipline disparities compared to those who did not receive additional coaching (Vincent et al., 2015).
The lack of definitive findings that SW-PBIS reduces racial discipline disparities prompted the development of culturally responsive or equity-focused versions of PBIS (CR-PBIS; Bal et al., 2014; Leverson et al., 2019; McIntosh et al., 2021; Vincent, Randall, et al., 2011) along with other augmentations to PBIS (e.g., Double Check; Bradshaw et al., 2018). Other school-wide positive discipline models are thought to have potential to reduce disproportionate discipline impacts, especially if adapted to more explicitly address cultural and racial dimensions of intervention targets (Gregory et al., 2021), such as transformative social-emotional learning (T-SEL; Jagers et al., 2019) and racial justice-oriented approaches to restorative practices (Manassah et al., 2018; Valandra & Waphaha Hokšila, 2020). Although these more recent equity-focused adaptations were not available at the time Maryland rolled out its disproportionate impact model, engagement-related interventions like Check & Connect (Anderson et al., 2004), as well as other SEL and restorative practices, were provided on its menu of options to local school systems. Some local school systems in Maryland also opted to incorporate these more equity-elaborated models in their implementation plans.
Measurement Challenges
Despite growing interest in efforts to monitor racial discipline disparities affecting Black youth and to assess the impacts of these and other policy and programmatic approaches, there is limited consensus on what metric(s) should be used to measure disproportionality (for a review, see Girvan at el., 2019). Disproportionality, the term most commonly used in education settings to refer to metrics of disparity in school discipline, has been operationalized at the broadest level as the extent to which the representation of a group in a category (e.g., the proportion of Black students receiving suspensions) differs from an agreed-upon benchmark (e.g., the proportion of White students receiving suspensions; Skiba et al., 2008). Although there is general agreement on this definition, disproportionality metrics with differing benchmarks have been used to measure racial discipline disparities. This has been called out in prior research as a critical problem for the field—both that so many metrics are used and that there is a lack of agreement on which to use in which circumstances given limitations and advantages of each (see Curran, 2020; Girvan at el., 2019; Scanlan, 2016; and our recommendations in the Discussion section).
In this muddled landscape of discipline disproportionality measurement, Maryland held a community- and expert-informed process to develop a method for measuring racial discipline disproportionality as part of its implementation of the COMAR regulations (MSDE, 2017). Below, we extend prior research that has identified these disproportionality measurement challenges generally (e.g., Curran, 2020; Girvan et al., 2019) by applying these complexities to the context of assessing policy and programmatic intervention impact over time. This section describes advantages and limitations of the disproportionality metrics typically used in research and by state and local education agencies for monitoring racial discipline gaps. We define and operationalize two of these metrics in terms of Black students relative to White students (and subsequently discuss the rationale for this). We also present metrics that compare suspensions among Black students within a school to all other students, metrics that highlight counts of Black students who would not have been suspended under equitable discipline circumstances, as well as metrics that compare suspensions among Black students to what would be expected given their level of enrollment in the school. However, other appropriate focal groups and benchmark groups can be selected based on the research question of interest (e.g., rates of Black females to all other females; rates of Latino boys with and without disabilities).
Common Metrics: Risk, Risk Ratios, and Alternate Risk Ratios
The terms risk and risk ratio come from other disciplines (i.e., health sciences) and can carry a deficit connotation and support those narratives (i.e., “at-risk students”). Given that these are the terms commonly in use to describe disproportionality metrics, we retained them below. However, we clarify in the terminology for each metric that the interpretation here is not a risk of student conduct problems or delinquency but, rather, a risk of exposure to exclusionary discipline practices in a given educational setting, consistent with our view of race as a social construct and the appropriate use of race as a social location marker, rather than an identity indicator, in disproportionality research. A brief review of the advantages and limitations of the metrics is below, whereas formulas and full definitions are in the appendices in the online version of the journal.
Risk of exposure to exclusionary discipline (commonly called “risk”)
The risk metric is the proportion of students in a specific demographic group (i.e., based on race, ethnicity, gender, ability status) within a given setting (e.g., a classroom, school, or school district) who were given a disciplinary consequence during the school year. The risk is not a relative metric and thus not a measure of disparity or disproportionality per se; however, when disaggregated by racial and ethnic group, or another identity characteristic, it conveys directly the degree to which disciplinary exclusion is impacting a student demographic within a classroom, school, district, or state. This metric is informative on its own and functions as a base calculation for several other disparity metrics. The risk metric also has the advantage of accounting for differences in enrollment across schools or over time, as it includes the enrollment size within racial and ethnic group in the denominator, and therefore can be used to make comparisons between schools over time (e.g., as in a school-level cluster randomized controlled trial, where intervention and control schools might be compared at baseline, post, and follow-up).
Ratio of risk of exposure to exclusionary discipline (commonly called “risk ratio”)
The risk ratio is a simple comparative metric; it is the relative risk for a student demographic group of a disciplinary infraction within an educational setting, compared to an agreed-upon benchmark demographic group, and builds upon the risk metric. The risk ratio is an intuitive and readily understood metric of disparity and, thus, is a very common indicator selected for use by states and districts to monitor disproportionate discipline impact. Nevertheless, the risk ratio has shortcomings. Primarily, the risk ratio quantifies disproportionalities as the same when there are meaningful differences in the underlying magnitude of impact across settings or across time.
For example, two schools could have the exact same risk ratio with very different levels of suspensions (e.g., the Black-White risk ratio = 3.0 for a school with rates of 3% and 1% for Black and White students respectively, but it would be the same risk ratio for a school with much higher rates of 30% and 10%, respectively). Further, it does not well account for zero and very low rates of suspension (e.g., the risk ratio is invalid for a school with rates of 3% and 0% for Black and White students, respectively). That is, the risk ratio is undefined when the denominator (i.e., benchmark group risk) is zero. When examining change over time, if a school improved in one year to the next (e.g., from 10% down to 1% White students suspended, and from 20% down to 3% of Black students suspended), the risk ratio would indicate counterintuitively that the disproportionality has gotten worse (i.e., the risk ratio would increase from 2.0 to 3.0). This latter example highlights the frustration schools can experience in making improvements that are not recognized by the accountability metric used by governing entities to identify and surveil discipline disproportionality over time.
Finally, mathematical principles highlight limitations of the risk ratio when examining disparities over time. Specifically, when there are changes in overall prevalence of an outcome (e.g., overall reductions in suspension rates), the group with the lower baseline risk (i.e., typically White students) tends to experience a larger proportionate change in its risk for the outcome, while the group with higher baseline risk (i.e., typically Black students) tends to experience a smaller proportionate change in its risk (Scanlan, 2016). Thus, when exclusionary discipline rates are decreasing overall, Black-White risk ratios will often necessarily increase.
In sum, changes in the magnitude of impact over time are not necessarily conveyed by the risk ratio, which is unfortunate, given base rates rightly matter a great deal to educators and decisionmakers. Underlying rates are important to keep in mind because disciplinary exclusion has the potential to cause harm and because the aim of most policy and programmatic efforts is to reduce the risk of suspension in addition to disparities in risk (Losen et al., 2015). Despite its significant limitations, the risk ratio is commonly used to monitor progress in reducing disproportionality. To mitigate the noted concerns about the exposure risk ratio, however, some states have opted to include a second metric along with the risk ratio. For example, in Maryland’s statewide disproportionality monitoring approach (in accordance with its COMAR regulations), the state chose to incorporate a second metric—the alternate risk ratio.
Alternate ratio of risk of exposure to exclusionary discipline (commonly called “alternate risk ratio”)
The alternate risk ratio utilizes an external benchmark from the broader educational setting it is nested within (i.e., classrooms are nested within schools, which are nested within districts, which are nested within the state). In the case of Maryland’s alternate risk ratio, the agreed-upon benchmark was risk of exposure to exclusionary discipline across the entire state, at either the elementary or secondary level (i.e., because discipline rates are much higher in secondary grades). The alternate risk ratio mitigates the shortcomings of the risk ratio in situations where there are small counts or zero cells in the calculation of the benchmark group’s risk. Borrowing from a larger educational setting to set a predetermined benchmark for the alternate risk ratio allows the metric to avoid the instability or invalidity in the calculation of disproportionality. However, by essentially standardizing the metric with a common denominator across schools and districts, it adds little additional information over and above the risk metric in the context of outcome and correlational analyses.
Better Metrics? Risk Difference, Raw Differential Representation, and e-Formula
Other metrics of disproportionality have been advanced for consideration to improve upon these identified issues with risk and risk ratio metrics. One such metric recommended and utilized in prior research on racial discipline disproportionality is the discipline exposure risk difference (Bottiani et al., 2017; Curran, 2020; Girvan et al., 2019).
Difference in risk of exposure to exclusionary discipline (commonly called “risk difference”)
The risk difference simply subtracts the risk for a benchmark group from the risk for the demographic group of interest to identify absolute excess risk. The risk difference circumvents some of the shortcomings of the risk ratio as it can be calculated even when the benchmark group’s discipline risk is zero. This helps to retain the maximum sample when using a disproportionality metric (i.e., as compared to missing values when using the risk ratio; see sample size differences for the risk ratio metrics relative to the risk difference in Tables 2a and 2b, below). In addition, the risk difference, unlike the risk ratio, conveys the degree of excess risk affecting students compared to a benchmark group.
However, the risk difference, similar to the risk ratio, does not retain meaningful information on the overall degree of risk (i.e., overall rates are once again lost, and, therefore, two schools can have the same risk difference where one has a much higher discipline rate than the other, for both groups). In addition, the discipline exposure risk difference is affected by variation in overall prevalence of disciplinary exclusion over time or across settings. If the overall prevalence of disciplinary exclusion goes from being rare to being more common over time, the risk difference will tend to increase; conversely, if the overall prevalence of disciplinary exclusion goes from being common to being very rare, absolute differences will tend to decrease (Scanlan, 2016). Since the broader reform goal is that disciplinary exclusion is utilized only as a last resort and thus becomes increasingly rare, perhaps this mathematical feature of the risk difference is not problematic, as a shrinking risk and risk difference are both desirable outcomes of intervention. However, it does obscure meaningful comparisons across schools and over time when the overall prevalence of disciplinary exclusion varies greatly.
Raw differential representation (RDR)
The RDR metric (Girvan et al., 2019) is the estimated number of students in a specific group who were suspended but would not have been under equitable discipline circumstances (i.e., had their rate of discipline been the same as students in the reference group). The benefit of the RDR metric is that it quantifies the actual number of students impacted by a school’s disproportionate use of disciplinary exclusion. Thus, the RDR may be a particularly useful indicator for informing policymaker decisions and translating research findings regarding interventions to reduce disproportionality to policymakers. However, a downside of the RDR is that it is positively correlated with the enrollment size of the demographic group of interest (e.g., the larger a school’s enrollment of Black students, the larger the size of its RDR). This feature of the metric makes it harder to use for comparisons across settings with different racial and ethnic compositions. Girvan and colleagues (2019) suggested scaling the RDR metric to enrollment to make it comparable across settings; however, Curran (2020) critiqued that suggested approach, noting that scaling to the educational setting’s overall enrollment was not sufficient to facilitate comparisons across settings, and scaling would reduce the RDR mathematically to simply be the risk difference. Thus, Curran (2020) concluded there was not a way to make the RDR comparable across settings. However, in the context of cross-sectional studies, analytically controlling for school enrollment size and racial and ethnic composition could support the use of the RDR as an outcome. Furthermore, within the context of repeated measures research evaluations examining the impact of interventions to reduce discipline disproportionality within schools, it may not be necessary to include these controls or adjust the RDR if enrollment counts and demographic composition are relatively stable over time. In such circumstances, the unadjusted RDR is recommended (Girvan et al., 2019; see, e.g., McIntosh et al., 2021).
e-Formula
One additional metric of interest is the e-Formula (Bollmer et al., 2014), which utilizes the composition index (see Table S2 in the online appendices) for definition of this base metric and its calculation), rather than the risk index. Whereas the risk index asks, “What proportion of Black students was suspended?” the composition index asks, “What proportion of suspended students was Black?” For disproportionality metrics making comparisons of risk, the benchmark is the risk among an agreed-upon other group of students. For disproportionality metrics making comparisons of composition, the benchmark is in reference to the same student demographic group’s representation within the student enrollment. Specifically, if a school’s Black student enrollment is 15% of the total school enrollment, it would follow in equitable circumstances that the racial composition of the school’s suspended students also be around 15% Black. If, however, 90% of that school’s suspended students are Black, this would clearly raise concerns regarding disproportionate impact, as the proportion of Black students suspended would be six times as high as the proportion of Black students enrolled at the school. Yet if only 21% of suspended students were Black, it may be less clear as to whether this would constitute practically meaningful and significant disproportionality.
The e-Formula helps to answer this question by determining a threshold over which the composition of a demographic group among its suspended students should raise cause for concern. To determine if Black students are overrepresented among those suspended at a school, the proportion of suspensions given to Black students is compared to the e-Formula value; if the proportion of Black suspensions is greater than the e-Formula value, the school is identified as having an overrepresentation of Black students among all suspended students. The e-Formula approach to determining disproportionality has some potential theoretical advantages. First, it circumvents the issue of determining an agreed-upon benchmark. Though we argue that employing White students’ risk as a benchmark actually decenters Whiteness by explicitly naming racial power differences (see discussion), disparities metrics are sometimes critiqued for their use of White rates as the standard. This is particularly concerning in research that may theoretically frame achievement or discipline as a student outcome, and thus conceptualize gaps in achievement or discipline as representative of student deficits, which we have cautioned against in this article. The e-Formula approach sidesteps this quandary by removing cross-race comparisons from the equation altogether, allowing the focus to be on what is proportionate within one’s racial and ethnic group, where student groups (e.g., Black students) provide their own benchmark in the assessment of racially equitable discipline. Another unique feature of the e-Formula approach is that it incorporates a built-in criterion for significant disproportionality.
In summary, there are many metrics of school discipline racial disproportionality in use, including ones not included in the present study due to data limitations, such as the incident rate (i.e., suspensions per student in each group per school year or per day; see Girvan et al. [2019] and Table S2 in the online appendices). Each offers unique advantages and limitations. A consensus in the field has emerged on the need to use multiple metrics to monitor disproportionality (Girvan et al., 2019; Nishioka et al., 2017), yet disagreement in triangulating results across metrics may present a stumbling block for drawing conclusions about the effectiveness of policy and programmatic reforms. Below, we discuss this concern further in the context of an illustrative case study.
Illustrative Case Study
Given these disproportionality metrics and the overlap in their use and interpretation, we conducted an illustrative set of analyses with the following three aims and research questions:
To characterize each metric’s stability over time and convergence with other disproportionality metrics. Specifically, we asked, How stable, and how correlated with other disproportionality metrics, is each metric across the 8-year study period?
To examine the nomological validity of each metric with dimensions of school climate theorized to be related to discipline disproportionality (Bottiani et al., 2017). Specifically, we asked, To what extent does each metric correlate with school-level aggregated, student-reported teacher connectedness, culture of equity, and positive discipline?
To assess the utility of each metric as an outcome measure in evaluations of educational policy and programmatic impacts. Specifically, we asked, To what extent is there agreement across metrics regarding the effects of Maryland’s statewide scale-up of positive behavioral interventions and supports over the 8-year study period?
Method
Data Sources and Implementation Setting
Data for the sample of schools analyzed in this study came from three primary sources. For Aims 1 through 3, data on schools’ counts of one or more OSS disaggregated by race and ethnicity were utilized drawing from the Civil Rights Data Collection (CRDC; U.S. Department of Education, 2019). In addition, for Aim 2, we leveraged secondary data on student-reported school climate that our research team collected through a series of federally funded research projects focused on safe and supportive school climate (i.e., the Maryland Safe and Supportive Schools projects for middle and high schools; Bradshaw et al., 2014). Student report data within each school were averaged and merged with available CRDC data to assess correlations between school-level averaged school climate reports and school disproportionality metrics. For Aim 3, MSDE provided data on schools’ receipt of PBIS training, which allowed us to examine the utility of the disproportionality metrics in outcome evaluations.
As mentioned above, PBIS (Sugai & Horner, 2006) is a framework that promotes systematic, data-based decision-making to guide the selection and implementation of evidence-based practices across multiple tiers of intervention. In our third aim, we examined the effects of universal (Tier 1) or SW-PBIS in Maryland’s scale-up of this tier of the framework. The PBIS Maryland Consortium, with personnel from the Sheppard Pratt Health System (SPHS), functioned as the implementation partner and provided statewide training and technical assistance in PBIS implementation. SPHS also collected data on the years in which schools received training and their implementation status over time (the 2008–2009 through 2014–2015 school years, i.e., seven time points). These data were shared with the university-based research partners for the present analysis. In total, there are 24 districts or local education agencies in the state of Maryland, all of which have some schools participating in the Maryland PBIS Initiative.
Sample and Sample Restriction
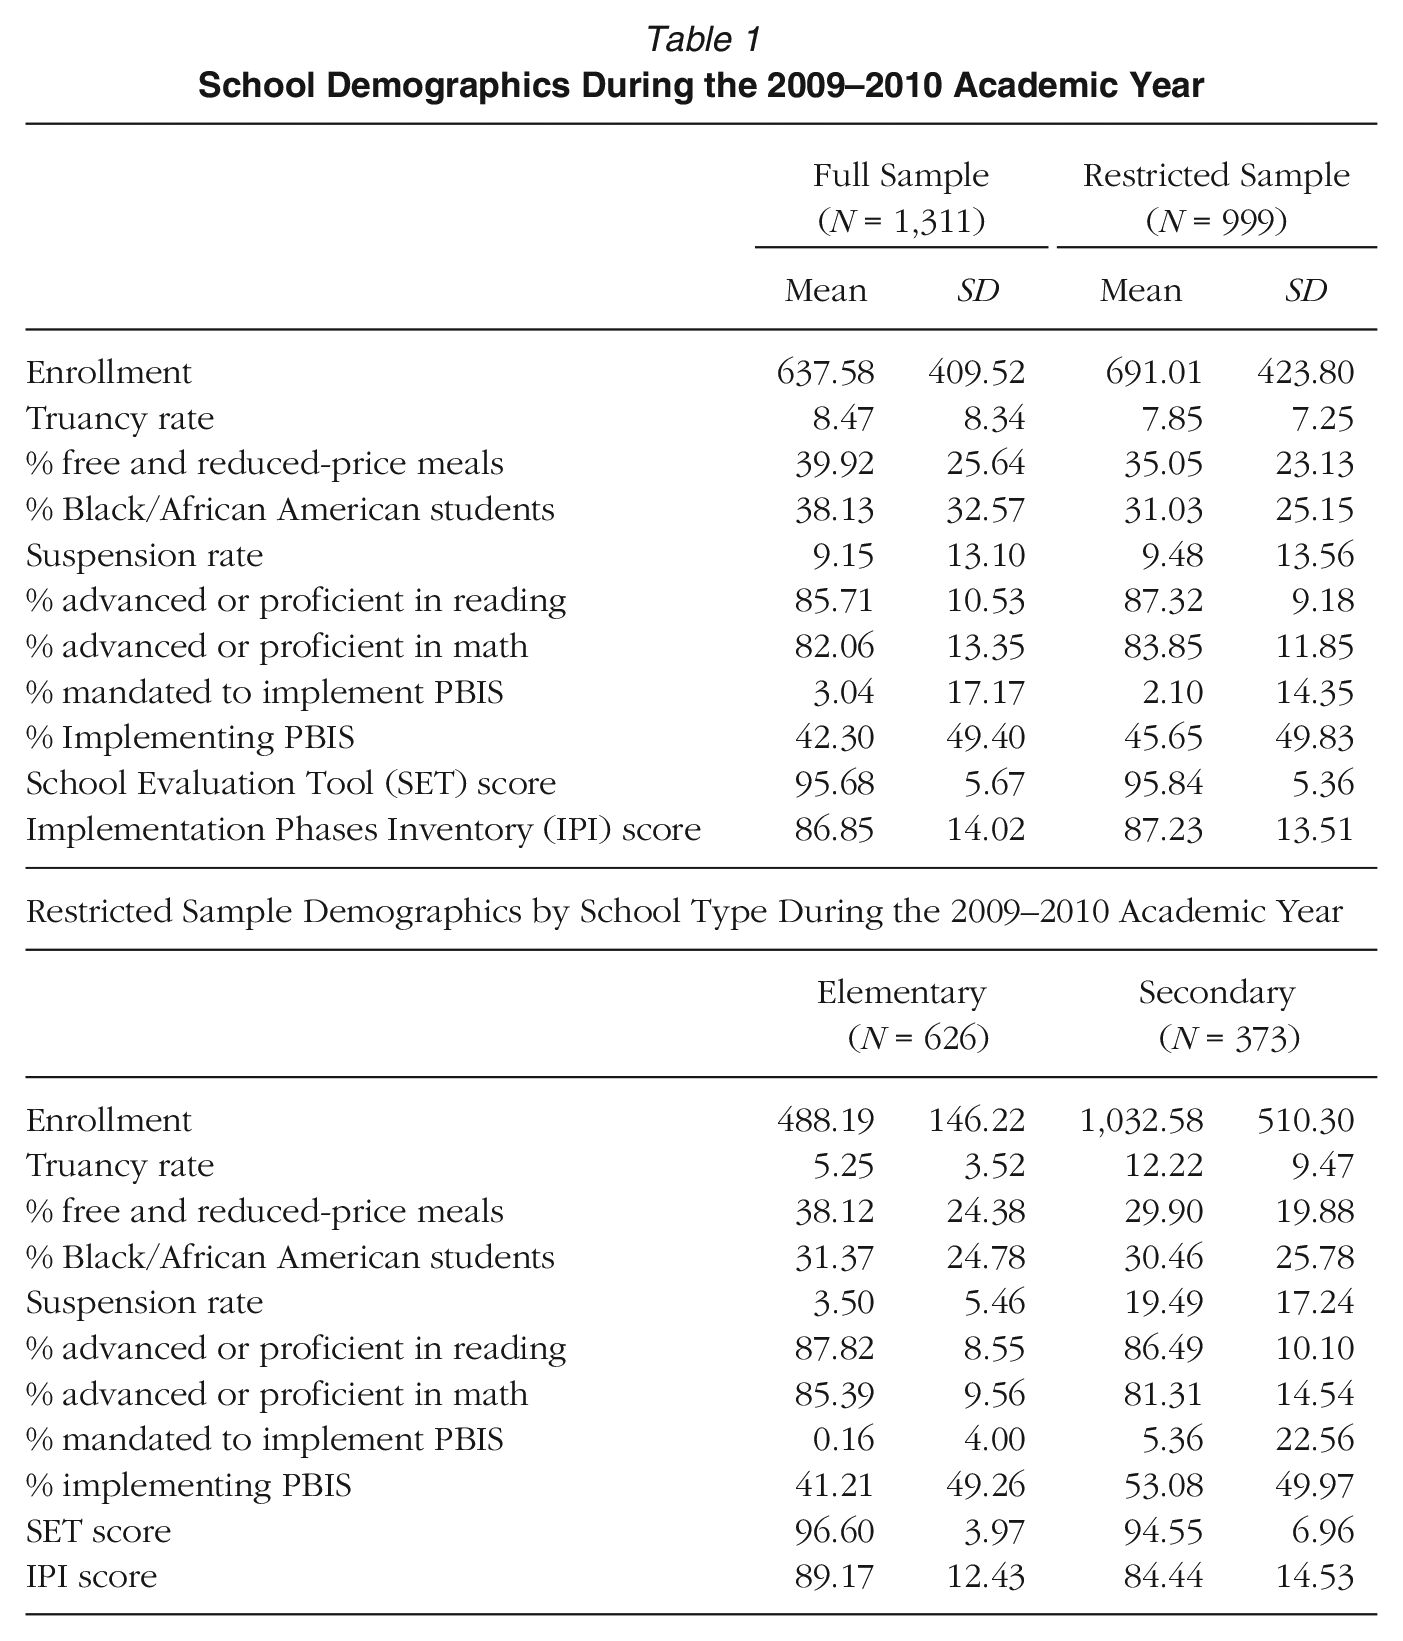
To help mitigate invalid discipline disproportionality metrics caused by zero cells, inclusion criteria were applied to the sample. Specifically, we applied two inclusion criteria: (a) total student enrollment must be at least 200 students in all of the 4 years of the outcome (i.e., 2009–2010, 2011–2012, 2013–2014, or 2015–2016) and (b) Black and White student enrollment must be a minimum of 10 students each per racial group in all 4 years. Thus, all schools in the analytic sample had at least 200 students enrolled in each year and at least 10 Black and 10 White students enrolled in each year (see Table S3 online and Table 1 for comparisons of the full and restricted final samples). In addition, known PBIS implementation status in each of the 4 years was required for inclusion. This study included traditional elementary, middle, and high schools; special education and alternative settings were excluded from analyses. Elementary schools included K–5, K–6, and K–8 grade configurations (referred to from here on as elementary schools); secondary schools included traditional middle schools (Grades 6–8), traditional high schools (Grades 9–12), and combined middle and high schools (i.e., Grades 6–12). As shown in Table 1, the final analytic sample for Aims 1 and 3 was N = 999 schools, with NES = 626 elementary schools, and NSS = 373 secondary schools. The sample for Aim 2, which required additional climate data, was n = 100 schools.
School Demographics During the 2009–2010 Academic Year
Variables Collected
Data on PBIS training status as the predictor of interest were provided by the PBIS Maryland partners on the year in which schools were trained in PBIS. The year in which a school was initially trained was provided and was recoded to training status (0 = not trained, 1 = trained). We used prior year PBIS as the predictor in our models because schoolwide PBIS takes time to “take effect” following training, and suspensions accrue across an entire school year. The trainings took place in the spring or summer, and therefore same-year training would not truly precede the suspension outcome. We did a sensitivity check and found that same-year and prior-year PBIS had very close to the same results, however. In our data, no PBIS implementers in prior years stopped implementing in subsequent years. Other covariates included student enrollment, truancy rate, percentage of students qualifying for free or reduced-price meals, the percentage of African American students enrolled, and the percentage of students who were proficient or advanced on the Maryland School Assessment in reading, based on prior research with these data examining suspension outcomes (Pas et al., 2019) and an intervention study examining discipline disproportionality outcomes (Bradshaw et al., 2018). These covariates were collected through publicly available state data. The five outcomes were the risk ratio, alternate risk ratio, risk difference, RDR, and e-Formula metrics, which were compiled across 8 years at four time points. This included the 2009–2010, 2011−2012, 2013−2014, and 2015−2016 school years. Discipline data from MSDE were not available disaggregated by race/ethnicity and gender, thus necessitating the use of CRDC data. However, CRDC data also had limitations, precluding our inclusion of the incident rate (i.e., suspensions per student in each group per school year or per day; see Girvan et al. [2019] and Table S2 online), another useful metric to consider in addition to those noted here. Publicly available data from CRDC included disaggregated, biennial discipline data by race/ethnicity and gender. CRDC OSS data were provided as counts of the number of students who received one or more suspensions per school in a given school year, as well as the total number of students enrolled during the school year, allowing for the calculation of OSS disproportionality metrics.
The school climate measure was collected using a school climate survey in select Maryland middle (n = 42) and high schools (n = 58) that were participating in two school cluster randomized controlled trials (Bradshaw et al., 2014) in 2016 and 2014, respectively. All students in Grades 6 through 12 were asked to complete this online measure, anonymously. Student-reported school climate variables included teacher connectedness, culture of equity, and positive discipline (see Bradshaw, Waasdorp, et al., 2014, for specifics on these survey measures and constructs). Data were approved for analysis by the investigators’ Institutional Review Board.
Analytic Approach
For Aim 1, descriptive statistics and correlations for each of the disproportionality metrics are provided to assess metric stability and convergence across metrics, followed by correlations with student-reported school climate data as an additional validity check related to the broader nomological net for Aim 2. To demonstrate the utility of these measures in evaluations of the impact of interventions on racial discipline disproportionality for Aim 3, we examined the effects of PBIS on our five disproportionality outcomes of interest (i.e., exposure risk ratio, alternate exposure risk ratio, exposure risk difference, RDR, and e-Formula). We also included the Black to non-Black risk ratio metric (i.e., the risk of OSS among Black students relative to all other students in the school) as a sensitivity check on the model results with the primary metrics. These primary and sensitivity analyses were conducted through a series of panel models with lagged-regressions among the outcomes, which were estimated using Stata software (14.2; StatCorp, 2015) for 2009−2010, 2011–2012, 2013−2014, and 2015−2016 data. For a given disproportionality metric, prior timepoint values predicted the outcome at the following timepoint (e.g., 2009−2010 risk ratio predicted 2011−2012 risk ratio). Prior year PBIS implementation status predicted the outcome value of the following year (e.g., 2008−2009 PBIS predicted 2009−2010 disproportionality outcome).
Because PBIS implementation was self-selected by schools, propensity score methods were used to balance the baseline differences (Rosenbaum & Rubin, 1983) to account for possible selection bias and other nonrandom differences between schools that opted to participate in PBIS training versus not (Rosenbaum & Rubin, 1983). We conducted propensity score weighting using the twang package (Ridgeway et al., 2016) in R (R Core Team, 2021), in which the probability of implementing PBIS in a given year was estimated using various covariates from the same year. The weights were calculated using the average treatment effect for the treated (ATT), as our interest was in the effects of PBIS for schools implementing PBIS (McCaffrey et al., 2004; Winship & Morgan, 1999). See the online supplemental appendices and Table S1 for information on the estimation of propensity score weights used in this analysis. Each year-specific propensity score weight was included to ensure that all schools were included in the models with varying weights at each time point.
PBIS data were from all 24 school districts in the state of Maryland, all of which had some schools participating (see Pas et al., 2019). Annual PBIS implementation status was the independent variable of interest, in which a school’s status could change from comparison (0) to intervention (1) over time (intervention could turn “on” over time, but not “off”). Therefore, the number of schools implementing PBIS increased over time, consistent with our expectation given the statewide scale-up of the model. For elementary schools, 41.2% were implementing PBIS in 2008−2009, while 63.6% were implementing PBIS in 2014−2015. Likewise, for secondary schools, 53.1% were implementing PBIS in 2008−2009, while 67.8% were implementing PBIS in 2014−2015. All models were fit separately for elementary and secondary schools and estimated using maximum likelihood estimation with robust standard errors (StataCorp, 2015). A figure representing this path model can be found in the online supplemental appendices in Figure S1.
Results
Aim 1: Descriptives to Assess Metric Stability and Convergence Over Time
In Tables 2a and 2b, we present descriptive statistics (means, medians, and interquartile ranges [IQRs]) for the disproportionality metrics, disaggregated by elementary (n = 626) and secondary (n = 373) schools. In elementary schools, where the prevalence of OSS was lower overall than in secondary schools, we saw some instability over time, where the exposure risk for Black youth, the exposure risk difference between Black and White youth, and the alternate exposure risk ratio increased in 2012 and then returned to near baseline in subsequent years (2014 and 2016). However, in contrast, the exposure risk ratio between Black and White youth increased in 2012 from 2010, but did not return to baseline. This suggests that the exposure risk ratio is functioning differently in elementary schools, relative to other primary metrics, in capturing disparities over time. This aberration may be due in part to a higher degree of lost data relative to other metrics due to invalid outputs of the risk ratio metric due to zero cell counts. Specifically, OSS risk for the benchmark group (White students) in 2010 was 0% for 440 schools in that year (which may have been due to the confidentiality constraints applied that year to CRDC data). When the denominator is zero, as previously noted, the risk ratio formula is undefined. Because we then converted this invalid output to missing, the number of non-missing observations for the risk ratio totaled only 123 schools in 2010. By comparison, nonmissing observations for the risk ratio ranged around ~250 for other years (2012, 2014, and 2016) and nonmissing observations for other primary metrics are much higher, ranging between 562 and 564 observations. Our inference is that low overall prevalence of disciplinary exclusion in elementary schools creates considerable missingness and instability in the risk ratio as an outcome indicator. As a sensitivity check, we examined zero cells and missingness in risk ratios calculated with non-Black (all other) students’ risk as the denominator, as an alternative to using White students’ risk in the denominator. Although the non-Black risk metric had fewer zero cells than the White risk metric did, zero cells and missingness still were relatively high for the non-Black risk and related risk ratio metrics in elementary compared to secondary schools (see Tables 2a and 2b, as well as Table S6 online).
Disproportionality Metrics in Restricted Elementary School Sample (n = 626)

Note. Mn = mean, Md = median, IQR = interquartile range, B-W = Black to White, B-NB = Black to non-Black, RDR = raw differential representation, Alt risk ratio = alternate risk ratio; Risk Diff = risk difference.
Disproportionality Metrics in Restricted Secondary School Sample (n = 373)
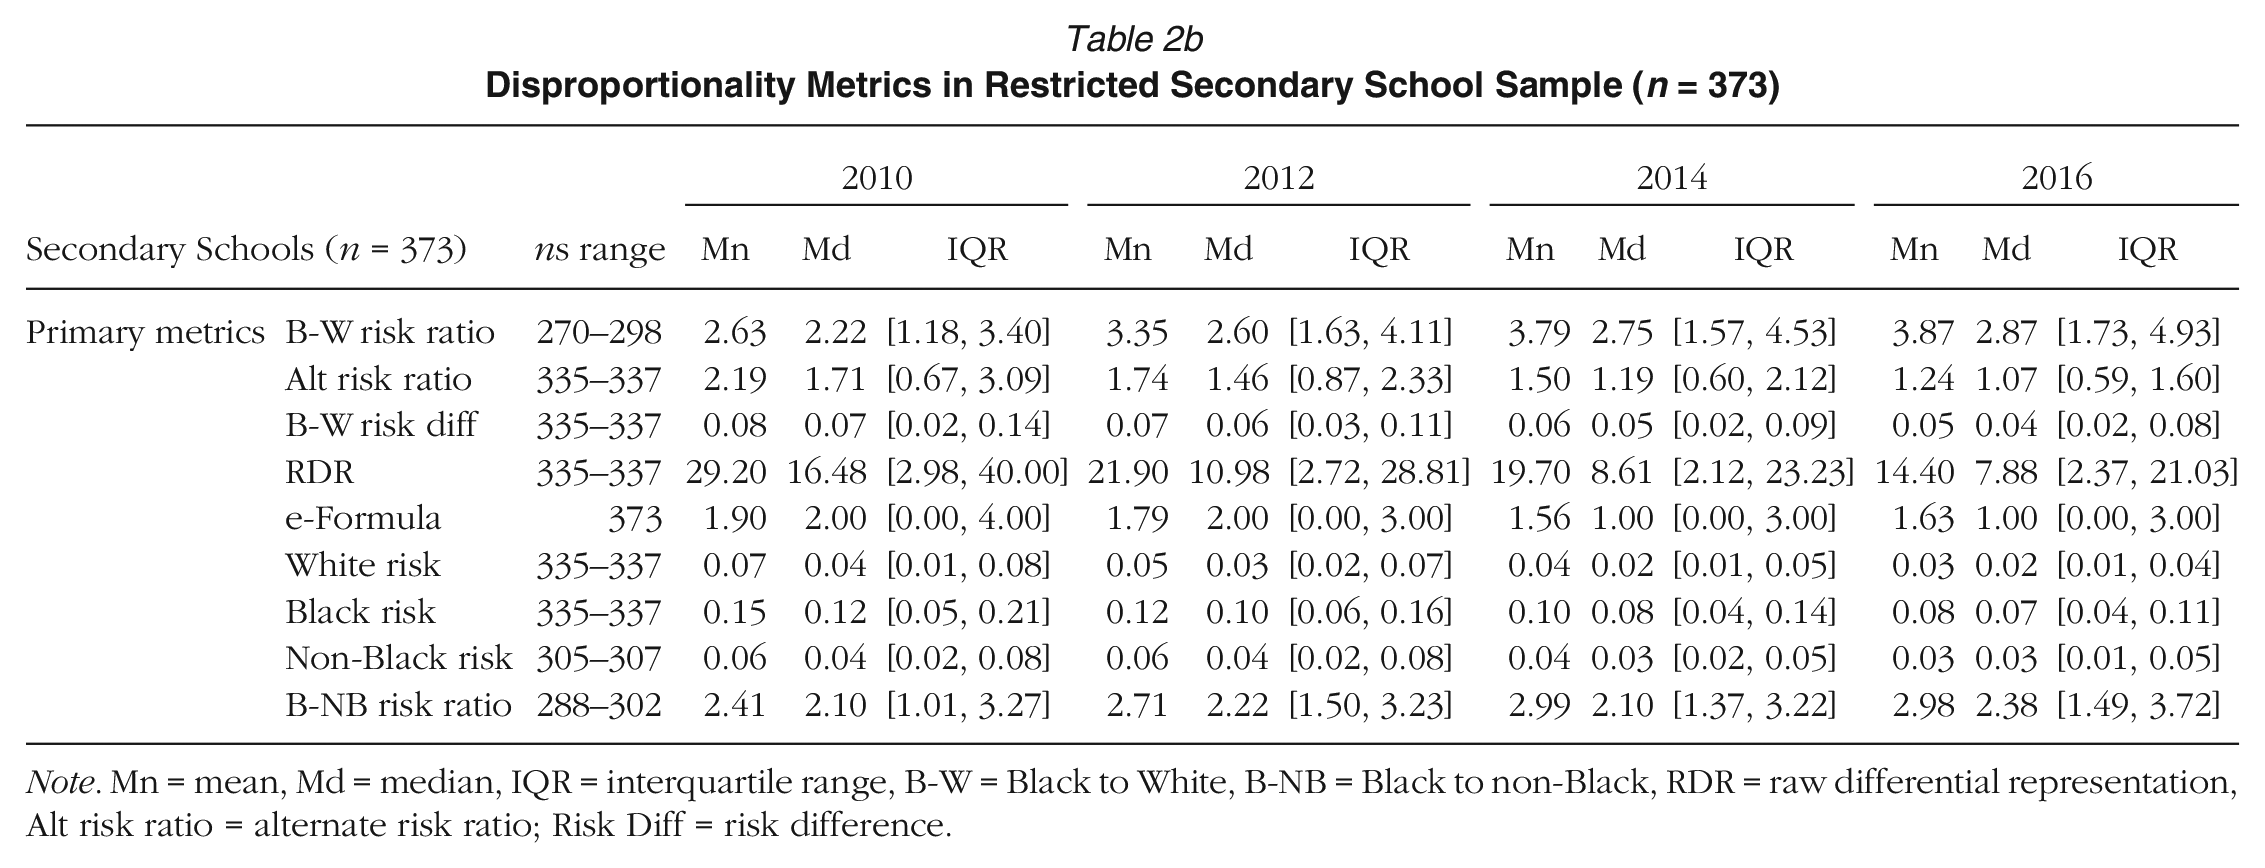
Note. Mn = mean, Md = median, IQR = interquartile range, B-W = Black to White, B-NB = Black to non-Black, RDR = raw differential representation, Alt risk ratio = alternate risk ratio; Risk Diff = risk difference.
In Table 2b depicting secondary school findings, this pattern of higher missingness of the risk ratio observations was similar but less pronounced, likely due to higher overall prevalence of exclusionary discipline in secondary schools. Yet, in high schools, a clear overall reduction in the prevalence of exposure among Black students and White students, as well as in the alternate exposure risk ratio, risk difference, and RDR over the 4 years can be seen, whereas the mean exposure risk ratio is unequivocally increasing during this same time period. This inverse pattern in the exposure risk ratio is inconsistent with the inferences one would make from change over time in all other disproportionality metrics and illustrates the points previously made about the mathematical tendency of risk ratios to increase over time as overall prevalence decreases (Scanlan, 2016), which can lead to spurious conclusions.
In Table 3, we summarized the correlations and found that the exposure risk and the alternate exposure risk ratio correlate precisely with an r = 1.0; this is because the denominator in the alternate risk ratio does not vary (it is predetermined and applies to all schools). Thus, the metric does not contribute new information in the assessment of disproportionality as an outcome of intervention, over and above the risk, as noted in the Introduction. We also found that the risk difference and risk correlated highly with one another with a mean r = .86, and the risk difference and the alternate risk ratio correlate highly with one another with a mean r = .86 as well, suggesting some redundancy in these metrics. The RDR, on the other hand, had consistently lower rs with other disproportionality metrics, suggesting it may convey new information distinct from the risk metric. The e-formula had moderate rs with other disproportionality metrics with the exception of the RDR, but only in elementary schools.
Pairwise Correlations Among Disproportionality Metrics in Restricted Sample (N = 999 schools)
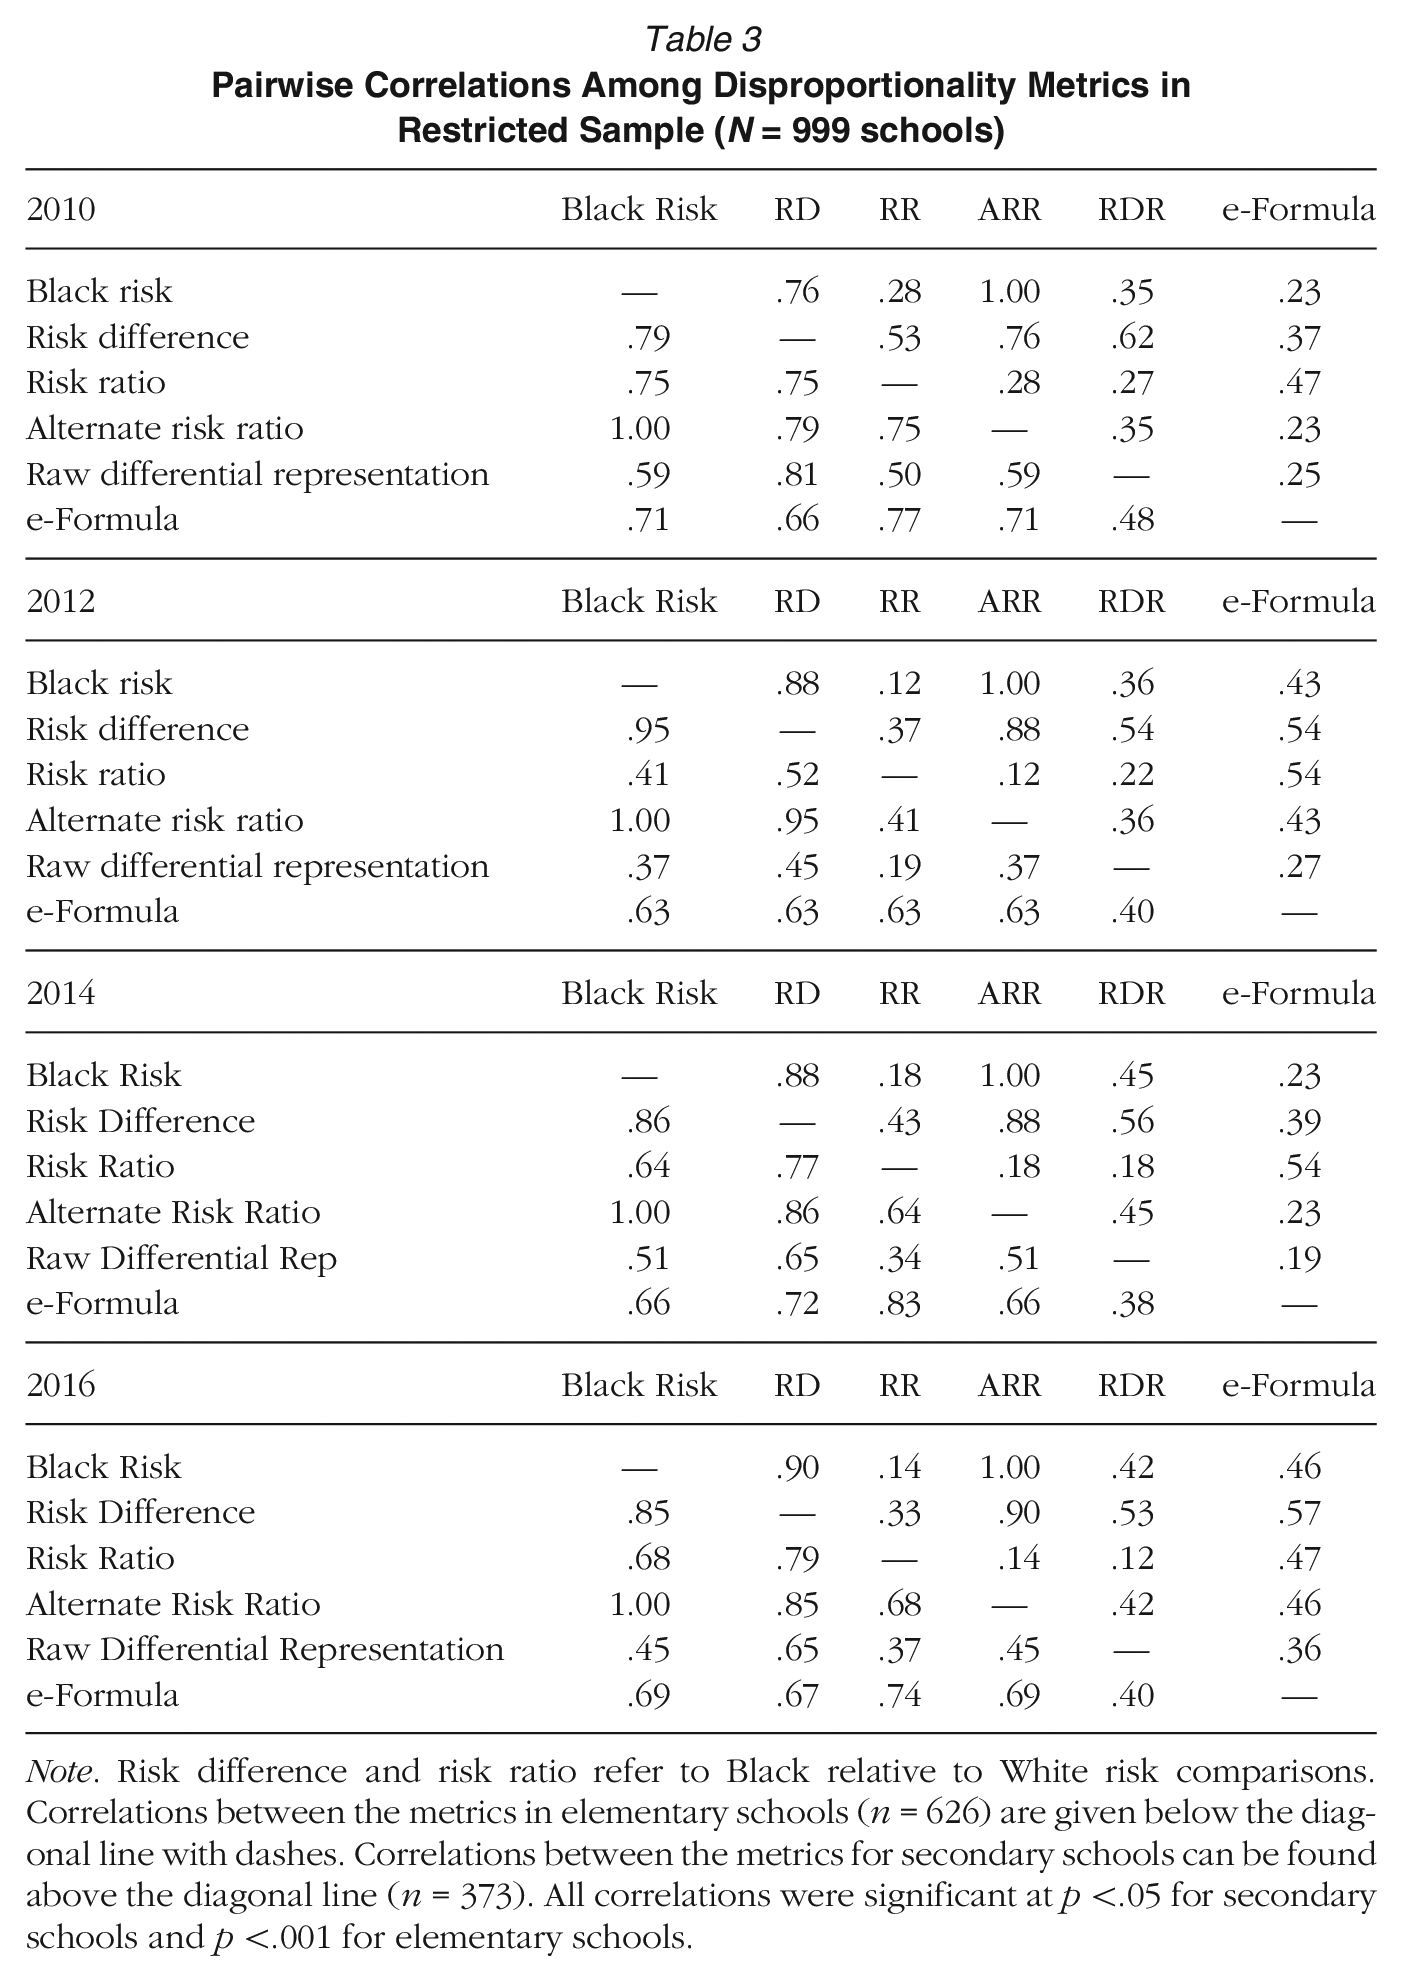
Note. Risk difference and risk ratio refer to Black relative to White risk comparisons. Correlations between the metrics in elementary schools (n = 626) are given below the diagonal line with dashes. Correlations between the metrics for secondary schools can be found above the diagonal line (n = 373). All correlations were significant at p <.05 for secondary schools and p <.001 for elementary schools.
Pairwise Correlations With Student-Reported School Climate in a Subset of Maryland Secondary Schools (N = 100 schools)
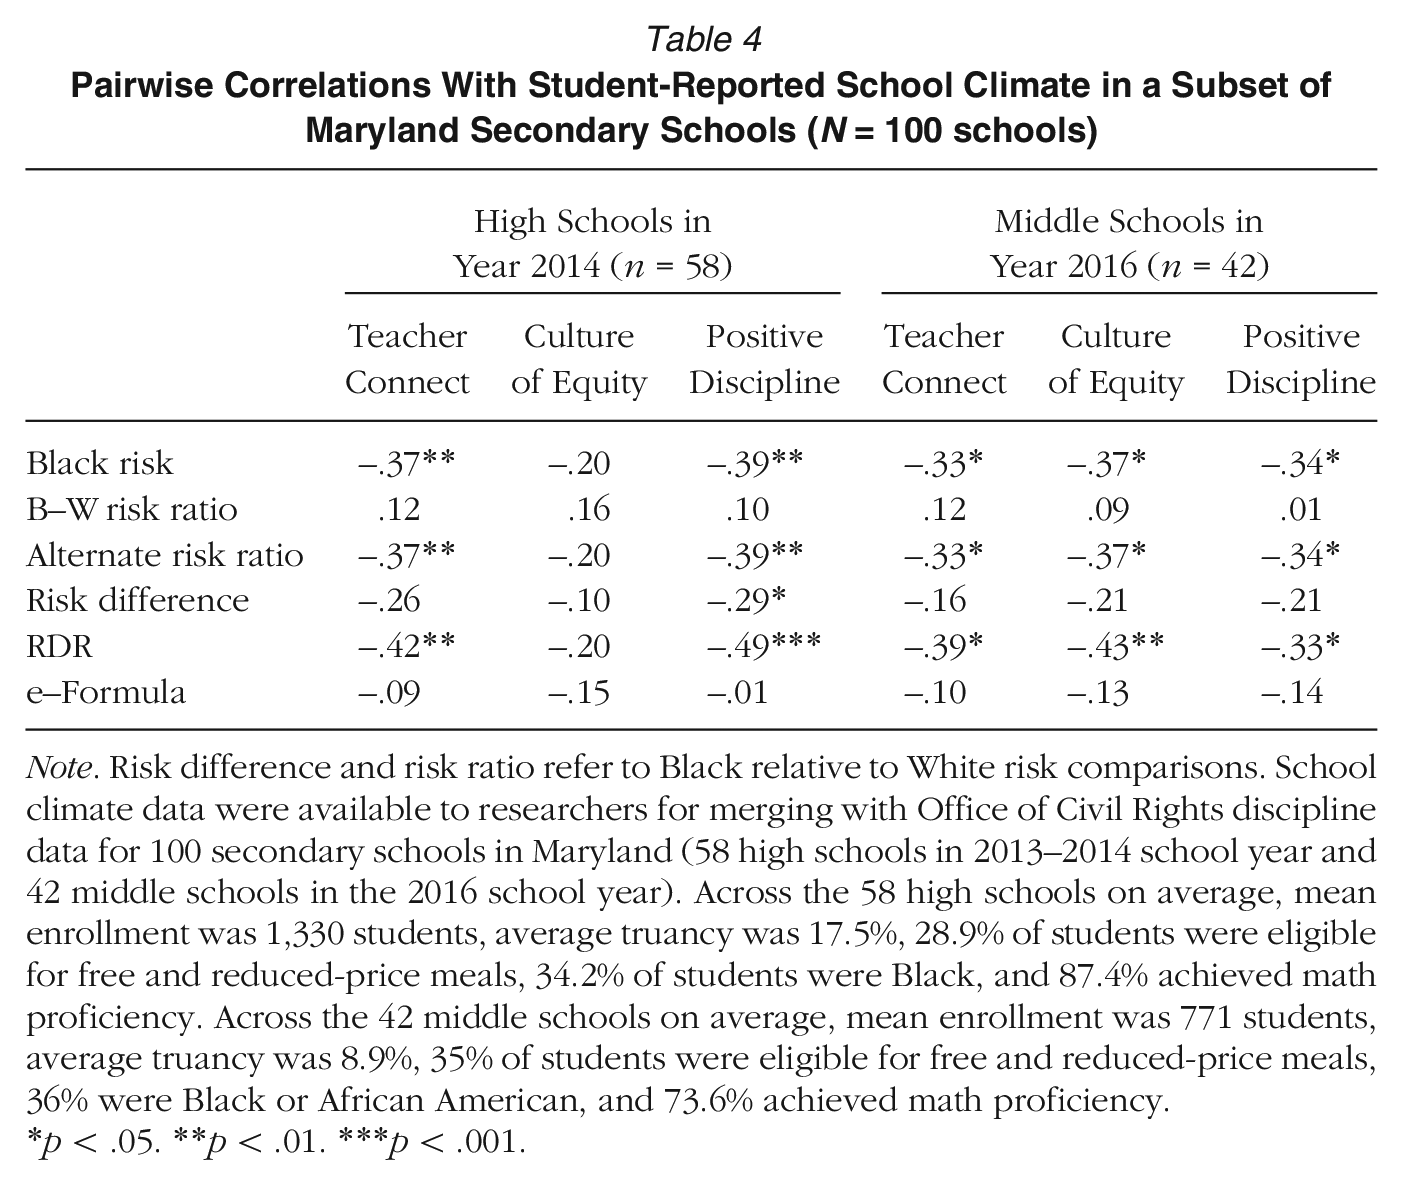
Note. Risk difference and risk ratio refer to Black relative to White risk comparisons. School climate data were available to researchers for merging with Office of Civil Rights discipline data for 100 secondary schools in Maryland (58 high schools in 2013–2014 school year and 42 middle schools in the 2016 school year). Across the 58 high schools on average, mean enrollment was 1,330 students, average truancy was 17.5%, 28.9% of students were eligible for free and reduced-price meals, 34.2% of students were Black, and 87.4% achieved math proficiency. Across the 42 middle schools on average, mean enrollment was 771 students, average truancy was 8.9%, 35% of students were eligible for free and reduced-price meals, 36% were Black or African American, and 73.6% achieved math proficiency.
p < .05. **p < .01. ***p < .001.
In examining consistency over time in elementary schools, rs ranged for the risk, .29–.44; for the risk ratio, −.05–.35 (some ps ns); for the risk difference, .09–.24; for the alternate risk ratio, .28–.44; for the RDR, .20−.43; and for the e-Formula, .11−.23 across the four time points (p <.001 for all rs). For secondary schools, the rs ranged for the risk, .42−.58; the risk ratio, .23−.37; the risk difference, .25−.33; the alternate risk ratio, .42–.58; the RDR, .35–.58, and the e-Formula, .41–.57 (p <.001 for all rs) across four time points. In general, reliability over time was considerably lower in elementary schools, where the prevalence of exposure to exclusionary discipline is lower.
Aim 2: Validity Correlations With School Climate
As a validity check on the interpretation and use of disproportionality metrics as an indicator of biased disciplinary practices in local school systems (Bottiani et al., 2017), we ran pairwise correlations with three dimensions of student-reported school climate—teacher connectedness, equitable treatment, and positive discipline—using available data. In Table 4, we present pairwise correlations for a subsample of schools reporting on both disproportionality metrics and student-reported school climate data. We found the RDR was significantly and moderately correlated with these three climate constructs, in the expected (inverse) direction (respectively for high schools and middle schools: teacher connectedness rs = −.42, p < .01 and −.39, p < .05; culture of equity rs = −.20, p = ns and −.43, p < .01; and positive discipline rs = −.49, p < .001 and −.33, p < .05). The risk and the alternate risk ratio, which were correlated with one another at r = 1.0, were also correlated to the same degree and direction with school climate (respectively for high schools and middle schools: teacher connectedness rs = −.37, p < .01 and −.33, p < .05; culture of equity rs = −.20, p = ns and −.37 p < .05; and positive discipline rs = −.39 p < .01 and −.34, p < .05). The risk difference was less correlated with climate; we found a significant inverse association only with positive discipline in high schools (r = −.29 p < .05). Finally, the risk ratio was the only metric of disproportionality not associated with any student report of school climate variable in either middle or high schools.
Aim 3: Effects of a Statewide PBIS Scale-Up on Disproportionality
Elementary School Findings
Figure 1 (top) depicts unadjusted suspension rates for Black and White students over time, for elementary PBIS and non-PBIS schools. The school average suspension risk scale ranges only up to 4% for elementary schools. Overall, in 2009–2010, the suspension risk is higher among Black students than White students at baseline, and this pattern persists over time, regardless of whether a school is implementing PBIS or not. However, among PBIS-implementing schools, suspension risks at baseline are higher for Black and White students alike relative to non-PBIS implementing schools, suggesting a possible selection bias of higher suspending schools to enroll in PBIS. Whereas suspension rates remain fairly constant over time for Black and White students in PBIS and non-PBIS schools, there was a small spike in exposure risk for Black students in PBIS schools in 2012.

Suspension rates across time in elementary schools (top) and secondary schools (bottom), unweighted.
Figure 2 (and Table S4 online) shows results for the panel model with lagged regressions for our five outcomes of interest across the 4 years for elementary schools. For the 2009–2010 school year, prior year PBIS implementation was significantly, positively related to the alternate risk ratio (β = 0.63, p < .001), risk difference (β = 0.01, p = .015), and e-Formula (β = 0.29, p = .001), suggesting that PBIS implementation was associated with higher levels of disproportionality in the baseline year. However, for the 2011–2012 school year, prior year PBIS implementation was significantly related to lower rates of RDR (β = −1.94, p = .045), while significantly related to higher values of the e-Formula (β = 0.23, p = .032), suggesting mixed effects of PBIS. In the 2013–2014 school year, PBIS was not significantly associated with any disproportionality outcomes. Finally, for the 2015–2016 school year, prior year PBIS implementation was negatively related to the alternate risk ratio (β = −1.09, p = .003) and e-Formula values (β = −0.43, p = .020), suggesting improvements in disproportionality. As a sensitivity check on the elementary findings, we report the results of the same models with the Black relative to non-Black risk ratio as the outcome in Table S7. This sensitivity check shows results largely overlap with the Black-White risk ratio, and to some extent the alternate risk ratio. In summary, the findings suggest that effects of PBIS on disproportionality metrics were not consistent from year to year, and, to some extent, differential conclusions regarding intervention effectiveness can be drawn depending upon the metric of disproportionality used.
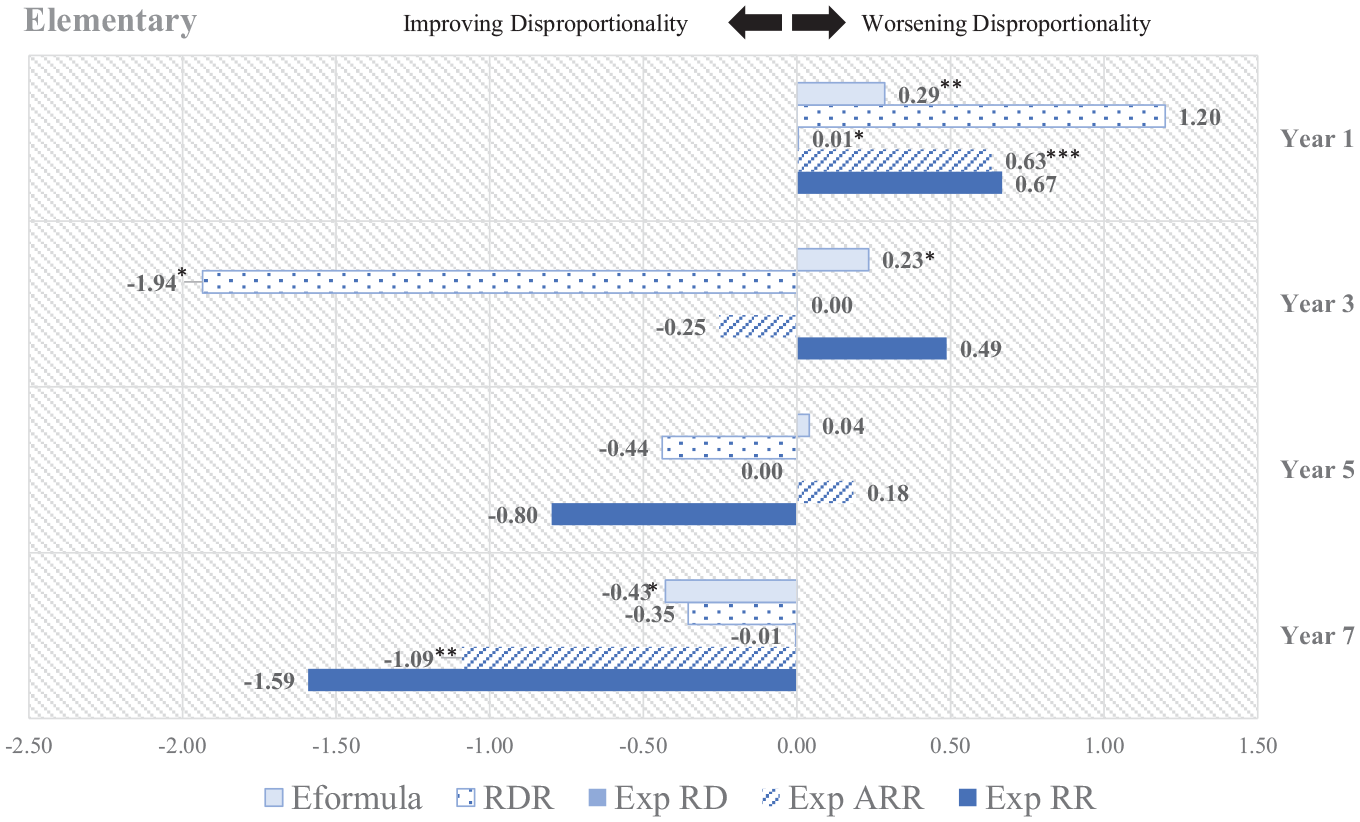
Effects of PBIS on racial disproportionality metrics in Maryland elementary schools over time.
Secondary School Findings
Figure 1 (bottom) depicts suspension rates for Black and White students over time, for secondary PBIS and non-PBIS schools. The school average suspension risk scale ranges up to 20% for secondary schools. As shown in Figure 1, in 2009–2010, suspension risk is higher among Black students than White students at baseline; however, gaps appear to close to some extent between Black and White students, regardless of whether a school is implementing PBIS or not. Overall, there is a downward linear trajectory over time in suspension rates for both Black and White students in PBIS and non-PBIS schools. As in the elementary results, among PBIS-implementing schools, exposure risks at baseline are higher for Black and White students alike, relative to non-PBIS schools, suggesting a possible selection bias of higher suspending schools to enroll in PBIS.
Figure 3 and Table S5 provide results for the panel model with lagged regressions for our five outcomes of interest across the 4 years for secondary schools. For the 2009–2010 school year, prior year PBIS implementation was significantly, positively related to all five disproportionality outcomes, suggesting that PBIS implementation was associated with higher rates of disproportionality. Conversely, however, in 2011–2012, prior year PBIS implementation was significantly, negatively related to all five disproportionality outcomes, suggesting an improvement in disproportionality. Further, whereas prior year PBIS implementation was not related to any of the five outcomes in 2013–2014, implementation was negatively related to the risk ratio in secondary schools during 2015–2016 (β = −2.34, p = .027). As a sensitivity check on the secondary findings, we report the results of the same models with the Black relative to non-Black risk ratio as the outcome in Table S7. This sensitivity check shows results largely overlap with the Black-White risk ratio and, to some extent, the alternate risk ratio.
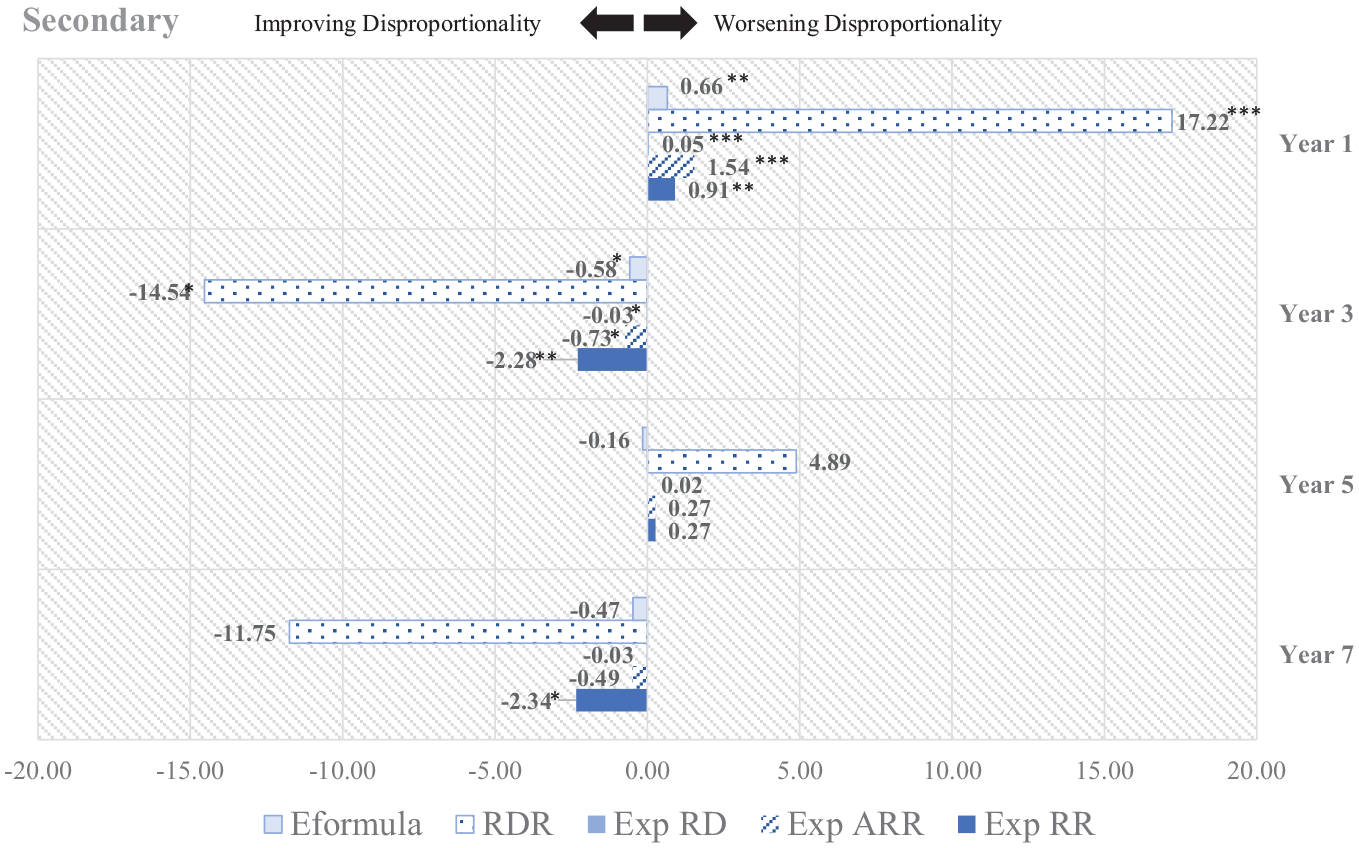
Effects of PBIS on racial disproportionality metrics in Maryland secondary schools over time.
In summary, the secondary school findings from this illustrative study of PBIS suggest that intervention effects on the disproportionality metrics were not consistent across time; however, unlike in elementary settings, there was greater consistency across metrics within each year in secondary settings. This supports the notion that, where there is a higher prevalence of suspension, metrics may be more stable, and triangulating across metrics may support valid inferences about intervention effects with less contingency on the particular metric of disproportionality chosen.
Discussion
Attention to disproportionality in discipline has led to a paradigm shift, from an interpretation of exclusionary discipline metrics as an indicator of student behavior problems, to one more focused on racial injustices enacted via institutional and relational biases and barriers to positive youth development. As educational equity initiatives emerge with the goal of reducing discipline disparities, the measurement of disproportionality in the context of outcome evaluations is increasingly important. Unfortunately, commonly used disproportionality metrics have a number of shortcomings, which this study confirmed. Specifically, despite its wide use for research, evaluation, and policy purposes, our results suggested that the risk ratio performed poorly in validity and reliability (stability) checks. In contrast, we found that validity checks on the RDR suggest this novel disproportionality metric may add new information over and above other disproportionality metrics. In addition, we observed, for most disproportionality metrics, relatively low correlations with student perceptions of connectedness to their teachers, of students at their school being treated equitably, and of positive discipline at the school. However, the RDR was an exception, as it was moderately and relatively consistently associated with student report of connectedness, equity, and positive discipline. As such, it is important to recognize that some metrics may be better (i.e., RDR) than traditional metrics (i.e., risk ratios) for use in research assessing effects of policy or programmatic initiatives on racial disparities in school discipline. Additional research is needed to replicate and confirm these findings with data from other states.
In our application of these metrics in a quasi-experimental evaluation of the effects of SW-PBIS in Aim 3, we found that differing conclusions could be drawn based upon use of the various disproportionality metrics at different time points. This finding raises concerns about the potential for invalid inferences to be made from short-term analyses of effects on disproportionality and where only one or two indicators of disproportionality are used. For example, the findings from the illustrative analysis suggested that, when looking over an 8-year period at the statewide scale-up of PBIS, we found an overall trend in which PBIS was associated with initially worse disproportionality in Year 1 across metrics, then subsequently improved disproportionality across metrics over time. The implication from the elementary school findings suggests that when exposure risk of exclusionary discipline is low, report of multiple metrics may be required to ensure that valid inferences can be drawn regarding the effects of policy and programmatic initiatives.
It is important to note some limitations of our study. First, in the CRDC data, when disaggregating by race and ethnicity (as was necessary in this study), only a count of the number of students suspended was available; the count of the number of suspension incidents at a school was not available in race-disaggregated form. Unfortunately, this limitation of the data meant that we could not calculate and include the incident rate per student as a related metric, though this metric is included in other guidance on disproportionality metrics (see Girvan et al., 2019, and Table S2). Second, although CRDC data are available for the 2017–2018 school year, we only had access to PBIS data through the end of the 2014–2015 year, leading into the 2015–2016 year of CRDC data in our analysis for Aim 3. As we do not have 2015–2016 data for PBIS that would predict 2017–2018 CRDC outcomes, we did not include these more recent data in our analyses.
Nevertheless, our findings speak to the need for robust guidelines for future research assessing the impacts of interventions on discipline disproportionality. The need for this guidance is particularly time-sensitive, given the recent proliferation of initiatives focused on racial justice in education (e.g., National Education Association, 2021). There have also been calls to center equity in school-based discipline reforms (e.g., Gregory et al., 2021) and renewed emphasis on culturally responsive and sustaining teaching as a solution to such disparities and other instances of cultural and racial bias in schools (e.g., Holcomb-McCoy, 2021). Without a clear path towards the measurement of disproportionality reduction as an intended outcome of these approaches, we will struggle to draw valid conclusions on effectiveness and appropriately direct resources to approaches that work.
Recommendations
Guidance on the assessment of disproportionality should include information to support critical decision points, including selecting the base index (e.g., risk, odds, composition, incidence), the method of comparison (e.g., relative or absolute differences), the benchmark (comparison group), and a criterion for significance (e.g., using standard deviations or other indicators of significance to set thresholds). For example, with regard to the selection and use of a base index, we note that risk of exposure to suspension can be, but rarely is, calculated intersectionally with reference to students’ multiple overlapping identities (e.g., Crenshaw et al., 2015). This is due to the fact that such data are rarely collected and made available in disaggregated form based on important variables relating to positionality and oppression including gender identity (e.g., cisgender, transgender) or sexual orientation (GLSEN, 2016), within-group heterogeneity within basic racial and ethnic categories (e.g., Asian versus Pacific Islander; Nguyen et al., 2019), and intergenerational migration statuses (e.g., asylees, undocumented, second-generation immigrant; Dunning-Lozano et al., 2020). Thus, far too little is known about risk of exclusionary discipline based on these identities and demographics. Guidance regarding the measurement of disproportionality must also address these gaps in our ability to monitor the compounding effects of student positionality in sociopolitical context on disparate exposure to exclusionary discipline. Student-centered, intersectional assessment approaches that better capture complex student identities and students as whole persons are vital to incorporate to reduce marginalization in research.
Regarding the selection of an appropriate benchmark, federal regulations indicate that the denominator for risk ratio calculations should be the risk index for all other students (e.g., Black students’ rates relative to those of all other non-Black students; see “Determining Significant Disproportionality,” n.d.). This approach has the advantage of reducing the likelihood of zero cells in the denominator. For example, as shown in Table S6, the percentage of elementary schools with 0% White risk ranged from 49.7% to 70.3%, whereas the percent of elementary schools with 0% risk for all other (non-Black) students ranged from 31.9% to 52.6%. Some have also suggested that this “all other students” benchmarking approach may help to decenter Whiteness, from the perspective that White students are too often assumed to be the default norm and benchmarking against White students specifically would function to reinforce Whiteness as a tacit, race-neutral standard (Girvan et al., 2019; McIntosh et al., 2014).
However, we argue that benchmarking using a combined rate including White students and all other students of Color may veil the influence of White racial power on outcomes being studied through a color-evasive frame (Feagin, 2020; Garay & Remedios, 2021). In this article, we have explicitly reframed racial disproportionality metrics as indicators of a school’s racial bias in disciplinary practices (not as indicators of differences of student behavior). Because Latine, multiracial, Indigenous, and other students of Color are minoritized, marginalized, and in some instances also subjected to elevated rates of exclusionary discipline (though not at the scale that Black students are), grouping White students with all other students of Color as the benchmark may obscure, and thus uphold, the underlying institutional and interpersonal White racial power dynamics that ultimately maintain racial disparities in school discipline.
Consistent with this point, in Table 2b (secondary schools), we show that the mean Black–non-Black risk ratio (i.e., where White students and all other students of Color are combined as the benchmark) is in every instance smaller than the mean Black-White risk ratio (i.e., where White students only are the benchmark). This illustrates the concern; benchmarking against all other (non-Black) students leads to an interpretation that there is less disproportionality than there really is, when looking at Black-White disparities starkly. The approach obscures both the extent of the problem of punitive discipline use with Black students and the relative leniency with White students. As such, we recommend to benchmark schools’ disproportionate discipline risk for each group—Black, Latine, Indigenous, and other racially minoritized and marginalized students—against that school’s White students’ risk of exclusionary discipline, as this most unequivocally captures the inequitable contexts of White racial privilege and racially minoritized students’ punitive treatment within a school.
One significant caveat to this is that the above noted pattern did not hold in elementary schools. As shown in Table 2a (elementary level), risk ratios benchmarking against all other non-Black students (White and all other students of Color combined) were, in three out of four years, higher than the Black-White risk ratios, suggesting the concern we raise may only be relevant in secondary school settings. This inverse pattern in elementary schools may be attributable to a pattern in which Latine students are underrepresented among suspended students in elementary school years (e.g., see Skiba et al., 2011); however, it may also be mathematical artifact of the tendency of two relative differences to change in opposite directions as the prevalence of the outcome changes (Scanlan, 2016).
Overall, this recommendation to utilize White risk as a benchmark in the risk ratio, despite issues with zero cells, is relevant to just one of the five metrics of disproportionality that we presented as primary metrics in this study. The other metrics either do not use White students’ risk as a benchmark (i.e., as in the Alternate Risk Ratio, e-Formula, and RDR), or were otherwise devised as a solution to the limitations of the risk ratio when prevalence is low (i.e., the risk difference metric, which uses subtraction rather than division to minimize the zero-cell issue). At the broadest level, our recommendation is to include other metrics with alternate benchmarks and limit or avoid the use of the risk ratio when possible, given its many limitations.
With regard to instability in metrics over time and discrepancies between them, our guidance for a robust evaluation approach highlights the need for longitudinal analyses over multiple years as well as multiple metrics of disproportionality to draw conclusions on intervention effects. Further, the sample restriction we applied for Aim 3 demonstrates the guidelines we recommend on sample constraints to account for low prevalence of suspension (i.e., zero- and low-cell counts) and procedures for handling overall declines in prevalence. In the online supplemental appendices, we provide detailed methodological guidance on the definition, calculation, coding of the metrics used in this study, sample constraint considerations, and other issues pertinent to quasi-experimental and experimental evaluations of policy and programmatic initiatives’ effects on discipline disproportionality.
A principle of harm reduction is also key to consider (Losen et al., 2015). Specifically, it may be that the suspension risk metric, though not strictly a measure of disproportionality, is the most informative metric to use in identifying whether an educational policy or program is reducing the use of suspensions for Black students. This may particularly be the case in circumstances where the risk ratio shows worsening disproportionality in the context of overall declines in suspension risk. However, regardless of the selection of metric, the findings from the illustrative case study together with the extant literature reviewed suggest that disproportionality metrics are ultimately blunt measures with inherent limitations in capturing meaningful progress on racial equity in school discipline. Suspensions “on-the-record” may not accurately characterize actual suspensions. Moreover, lower recorded student suspensions may not necessarily reflect reductions in biased discipline practices in students’ lived experience.
As such, a principle of racial justice is essential to apply in disproportionality impact evaluations of educational programs and policies. More nuanced, proximal measures that are less easily manipulated under accountability pressures are needed to assess whether we are really moving the needle on racial disparities in discipline. For example, observational and/or student-report measures of teachers’ use of racially biased—or, on the other hand, culturally responsive or antiracist—discipline and student engagement practices in the classroom might provide a clearer and more proximal measure of the intended outcomes of initiatives targeting disproportionality (Bottiani et al., 2018). This measurement research can help to facilitate greater consensus on the complex causal pathways leading to disproportionality. For example, some initial research has demonstrated that teacher stress may interact with racial biases to exacerbate racially differential responses in classroom disciplinary interactions (Smolkowski et al., 2016). These findings also highlight the need for more research on processes underlying racial bias and its enactment by teachers in the classroom. Advancing measurement of these processes in the classroom can support a shared understanding of the problem, which, in turn, can lead to a more unified theory of change from which we can postulate and test key mechanisms to inform the development of interventions with potential to yield real change.
Conclusion
As new initiatives and policies emerge to reduce racial disparities in schools’ use of exclusionary discipline, the field is in need of valid approaches for evaluating impacts on discipline disparities. Although the optimal approach to measuring racial discipline disparities continues to be debated in research, practice, and policy contexts, a consensus has emerged that use of multiple metrics to ascertain disproportionality is necessary, and no one metric is sufficient (Curran, 2020; Girvan et al., 2019; Nishioka, 2017). The current findings support this assertion and seem most necessary in contexts where the prevalence of OSS was low or declining. Triangulating several metrics over a longitudinal (i.e., at least three time points) time frame was necessary, but perhaps still insufficient, to facilitate practical and substantively meaningful interpretations of the data and draw conclusions regarding effects. We highlighted critical considerations and principles as guidance on the use of disproportionality metrics, with particular attention to steps needed to draw valid conclusions when the metrics disagree, and to develop more nuanced measures of racially biased discipline, as well as antiracist discipline practices, for use in future outcome evaluations.
Supplemental Material
sj-pdf-1-aer-10.3102_00028312221140026 – Supplemental material for Are We Moving the Needle on Racial Disproportionality? Measurement Challenges in Evaluating School Discipline Reform
Supplemental material, sj-pdf-1-aer-10.3102_00028312221140026 for Are We Moving the Needle on Racial Disproportionality? Measurement Challenges in Evaluating School Discipline Reform by Jessika H. Bottiani, Joseph M. Kush, Heather L. McDaniel, Elise T. Pas and Catherine P. Bradshaw in American Educational Research Journal
Footnotes

Supplemental Material
Supplemental material for this article is available online.
Notes
J
J
H
E
C
References
Supplementary Material
Please find the following supplemental material available below.
For Open Access articles published under a Creative Commons License, all supplemental material carries the same license as the article it is associated with.
For non-Open Access articles published, all supplemental material carries a non-exclusive license, and permission requests for re-use of supplemental material or any part of supplemental material shall be sent directly to the copyright owner as specified in the copyright notice associated with the article.
