
Abstract
This article responds to arguments by Skidmore and Thompson (this issue of Educational Researcher) that a graph published more than 10 years ago was erroneously reproduced and “gratuitously damaged” perceptions of the quality of education research. After describing the purpose of the original graph, the author counters assertions that the graph changed perceptions or that this was anything more than a case of unintentional editorial sloppiness.
Keywords
Educational Researcher invited me to comment on an article by Skidmore and Thompson (this issue, pp. 163–170) that highlighted some errors in the reproduction of a graph we first published more than 10 years ago (Petrosino, Boruch, Rounding, McDonald, & Chalmers, 2000). Skidmore and Thompson’s article expresses concern that these errors in reproducing the graph might have “gratuitously damaged” perceptions about the quality of education research in the United States and maybe even influenced funding decisions by the nation’s most influential education research agency, the Institute of Education Sciences (IES). They also hypothesize that “confirmation bias” may have been a factor in the erroneous reproductions.
The Original C2-SPECTR Graph
The goal of the graph was very simple: to illustrate cumulative progress at the time by the Campbell Collaboration (C2) toward populating a register of randomized controlled trials (RCTs) or possible RCTs in the social sciences (Petrosino et al., 2000). The C2 Social, Psychological, Educational and Criminological Trials Register (C2-SPECTR) was modeled after the highly successful Cochrane Collaboration in health care and the Cochrane Controlled Trials Register. Like Cochrane before it, the Campbell Collaboration envisioned an active network of researchers and practitioners collaborating to prepare, update, and disseminate high-quality scientific reviews of research on the effects of social and educational interventions. In a perfect world, any studies identified for C2-SPECTR would be provided to C2 reviewers to assist them in preparing and updating their reviews. We were never able to attract the kind of funding needed for building and maintaining such a register and efforts to populate the C2-SPECTR eventually stalled.
Inconsistencies in Reproduction and Confirmation Bias
Skidmore and Thompson suggest several explanations for the erroneous reproduction, including human error, confirmation bias, and a desire on the part of the key players to build urgency around the need for more RCTs in the field of education. Robinson’s investigation (this issue of Educational Researcher, 171–173) into the erroneous reproductions of the C2-SPECTR graph seems to have uncovered the most compelling explanation about what happened. An incorrect version of the graph may have been hastily created and rushed into production by a magazine (Cook, 2001), and others unknowingly carried that reproduction forward, including public presentations by the then-director of IES, Grover Whitehurst. I am not certain that confirmation bias would trump last-minute editorial sloppiness—which is more common than we would like—as a good explanation.
In response to the suggestion that several of those involved allowed the incorrect reproductions to go forward because they were interested in championing RCTs, Boruch and I were lead authors of the two articles with correct versions of the graph (Petrosino et al., 2000; Petrosino, Boruch, Soydan, Duggan, & Sanchez-Meca, 2001); Boruch never once asked that the graph be changed to portray education as lagging in RCTs. Furthermore, neither Cook nor Boruch discuss the lagging of education RCTs in their articles.
Finally, Skidmore and Thompson mention a 2003 report, Scientific Research and Evidence-Based Practice (Hood, 2003), published by WestEd, in their section that begins, “How could this have happened?” (p. 167). The question raised is why would Petrosino, also a WestEd researcher, not make sure the correct graph was used in the 2003 report? Since I did not begin working at WestEd until 2005, I first learned of the report in question when asked to read Skidmore and Thompson’s article. And confirmation bias would not explain the author’s (a distinguished researcher named Paul Hood) use of the graph data. The report was designed to inform the company of the latest developments in education research policy, and it contained no advocacy for a particular design approach. In fact, Hood would likely describe himself as ambivalent at best about the role of RCTs in education.
Did the Graph Gratuitously Damage the Perceptions of Education Research?
Skidmore and Thompson’s article reinforces how difficult it is to do rigorous historical research that clearly shows the relationship of one event (the graph) to another (views about education research quality). Historical research, even under the best of circumstances, is very tricky business. It requires examining multiple sources, and attempting to prove and disprove findings, until a reasonable description can be developed with confidence (cf. Hacsi, 2002).
My own recollection is that in the late 1990s there were many concerned persons meeting and writing about the need for RCTs—well before the graph appeared. The legendary statistician Frederick Mosteller teamed up with colleagues on several presentations and papers in the late 1990s, calling randomized experiments of educational practice a “rare design” (first published in Nave, Miech, & Mosteller, 2000). Jon Baron, president of the Coalition for Evidence-Based Policy, and a former chairperson and member of the National Board for Education Sciences, which governs IES, confirmed in a personal correspondence to me that this was his view as well:
In 2002, very little scientifically rigorous, replicated evidence existed about “what works” in education. Randomized experiments were relatively rare in education—regardless of whether there were any discrepancies in reporting of the exact numbers. And what randomized experiments had been done prior to 2002—e.g., those included in the National Reading Panel’s widely cited meta-analysis in 2000 that motivated Reading First—tended to be of the preliminary variety conducted in research settings, as opposed to sizable field trials (e.g., the typical experiment in that meta-analysis had a sample of 30 students, six-week follow-up, researcher-designed outcome measures, and measurement of intermediate outcomes such as decoding skills, rather than final outcomes such as comprehension). (Personal communication, March 7, 2012)
Reinforcing this perception are data from the late 1990s on RCTs as a proportion of outcome evaluations across six areas of childhood intervention, including K–12 education, based on systematic searches of citations and abstracts from leading bibliographic databases (Petrosino, 2003). 1 As Table 1 indicates, the percentage of outcome studies that were RCTs or possible RCTs ranged across these childhood intervention areas from 16% in K–12 education to 68% in health care. Although abstracts may be a miserable proxy for scientific production in education, they reinforce the perception about the relative scarcity of RCTs in education.
Proportion of RCTs and PRTs for Six Major Areas of Childhood Intervention
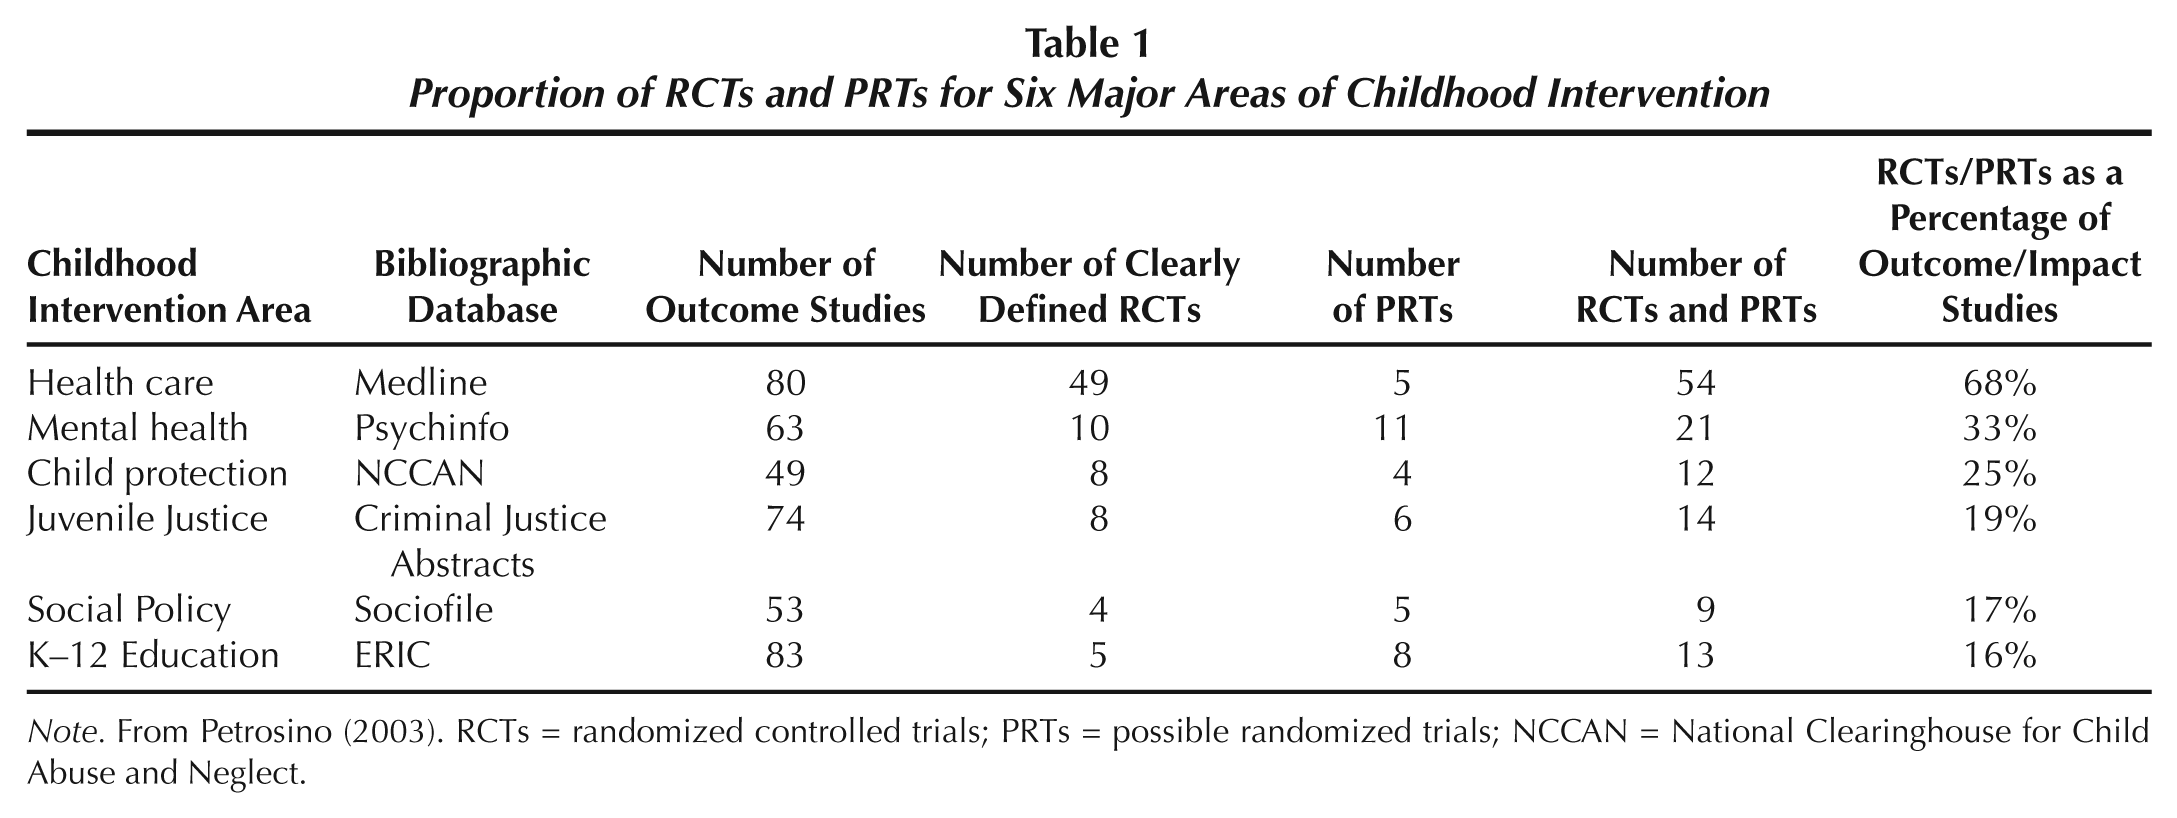
Note. From Petrosino (2003). RCTs = randomized controlled trials; PRTs = possible randomized trials; NCCAN = National Clearinghouse for Child Abuse and Neglect.
In addition to the view that few RCTs of quality on school practice and policy were being implemented and reported, there was a perception that federal support for educational experiments was lacking. Table 2 (reproduced from Cook, 2001) shows that of the 84 funded projects that the U.S. Department of Education supported in its portfolio in 2000, only 1 was an RCT (1%). The perceived lack of support for RCTs prior to the creation of IES may explain why the newly created agency would adopt a stronger position about experimentation.
Where the Research Dollars Flow
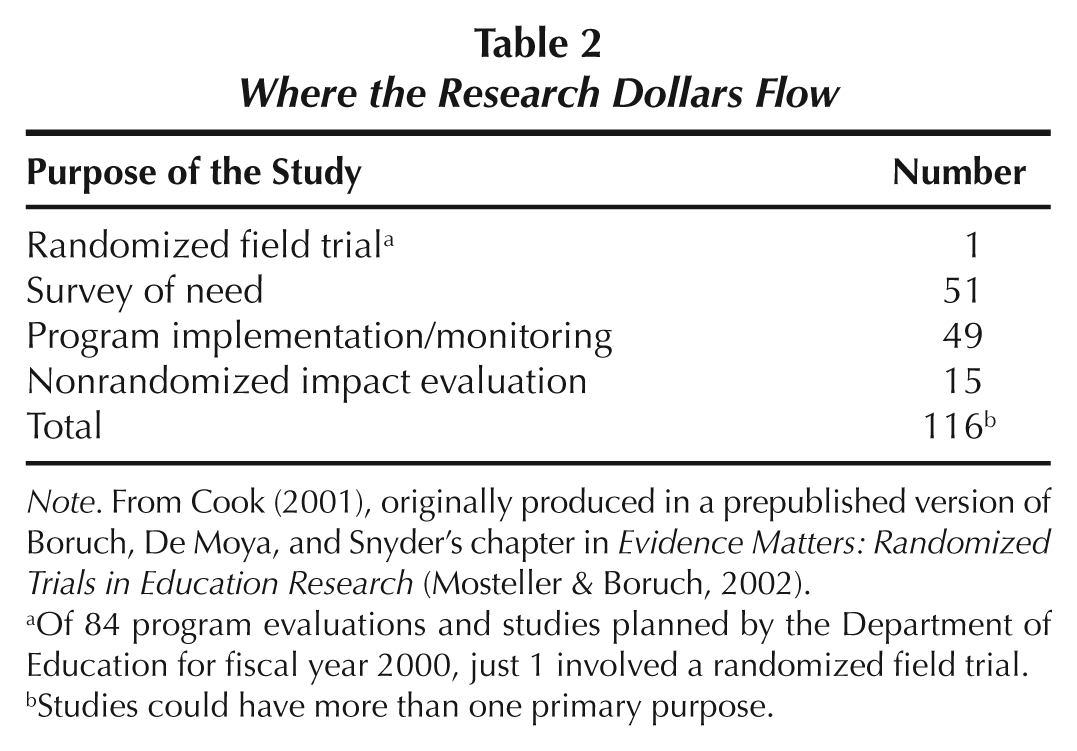
Note. From Cook (2001), originally produced in a prepublished version of Boruch, De Moya, and Snyder’s chapter in Evidence Matters: Randomized Trials in Education Research (Mosteller & Boruch, 2002).
Of 84 program evaluations and studies planned by the Department of Education for fiscal year 2000, just 1 involved a randomized field trial.
Studies could have more than one primary purpose.
Conclusion
Articles like those by Skidmore and Thompson remind us of the need to be cautious about our own work and that of others. But, without more extensive historical research, I would be equally careful about suggesting that a simple graph, whether faithfully reproduced or not, had much of a role—if any—in how the quality of education research was perceived more than a decade ago.
Footnotes
Notes
Author
ANTHONY PETROSINO is a senior research associate at WestEd, 300 Unicorn, Park Drive, 5th Floor, Woburn, MA 01801;