
Abstract
This article uses data from California to analyze the results of the proposed accountability system in the Senate’s Harkin-Enzi draft Elementary and Secondary Education Act reauthorization. The authors analyze existing statewide school-level data from California, applying the accountability criteria proposed in the draft law. Comparing the proposed system to the No Child Left Behind Act’s Adequate Yearly Progress provisions, they draw conclusions about the stability of the proposed identification schemes and the types of schools likely to be identified. They conclude with several policy recommendations that could be easily incorporated into the law, based on their analysis and the existing literature.
As policymakers debate the reauthorization of the Elementary and Secondary Education Act (ESEA), a primary focus is on redesigning accountability systems. The current accountability measure, Adequate Yearly Progress (AYP), is criticized for focusing on achievement level rather than growth (Ho, 2008; Kelly & Monczunski, 2007; Neal & Schanzenbach, 2010), targeting students in a narrow band of the achievement distribution (Ladd & Lauen, 2010; Neal & Schanzenbach, 2010; Reback, 2008), and identifying too many schools as failing (Linn, 2003). In response to these criticisms and a growing desire to return control of accountability to the states, Congress appears poised to replace AYP with more flexible accountability rules.
There are multiple proposed ESEA revisions, but most share two themes: reducing the number of schools deemed failing and creating a fairer system that moves beyond holding schools accountable for student inputs. In this article, we analyze a current draft of the revised ESEA, the Senate’s Harkin-Enzi proposal, 1 as a policy analysis case study in terms of reaching these two desired changes and improving on the critiques of AYP. We also demonstrate how existing public data sets can be used to explore the likely consequences of proposed accountability systems. Similar to prior NCLB research (Balfanz, Legters, West, & Weber, 2007; Chester, 2005; Linn, Baker, & Betebenner, 2002; Porter, Linn, & Trimble, 2005), our findings can help policymakers choose from among various design considerations in ESEA reauthorization.
The Harkin-Enzi plan proposes identifying several groups of low-performing schools for intervention. The first group is persistently low achieving schools (PLAS)—the 5% of elementary, middle, and high schools with the lowest achievement defined by achievement level. The PLAS can also be identified by growth in achievement or a combination of growth and level. Of non-PLAS, a second group of achievement gap schools comprises two different groups—the 5% of schools with the largest achievement gaps (AGS), and the 5% of schools with the lowest subgroup achievement (LSAS). The proposal also allows states to use 1 to 3 years of data. Thus, under Harkin-Enzi, the number of sanctioned schools in a given year will be limited to 15% of Title I schools.
Before policymakers implement a new federal accountability system, it would be beneficial to marshal evidence as to the expected outcomes of such a system. Although we cannot see into the future, we use existing data to explore likely outcomes of the Harkin-Enzi proposal. We first evaluate the stability of the PLAS, AGS, and LSAS designations using level- and growth-based measures of school performance over 1, 2, and 3 years of data. Stability is defined as the year-to-year consistency in identification in each accountability designation (Heck, 2006; Kane & Staiger, 2002; Linn & Haug, 2002). We do not offer a criterion for stability, as none exists in the literature. However, although we do not expect perfect year-to-year stability, we also do not want a system that identifies schools primarily on the basis of random measurement error—thus we assume it is desirable for stability to be reduced from current levels under AYP (where it is very challenging for schools to improve enough to exit accountability) but to remain reasonably high for schools that are not improving. We then evaluate whether the proposal creates a fairer accountability system (i.e., reduced relationship between school and student characteristics and accountability standings) by examining the extent to which the proposed measures disproportionately identify schools with the most challenging student characteristics (Balfanz et al., 2007; Darling-Hammond, 2007; Heck, 2006; Kane & Staiger, 2002; Krieg & Storer, 2006).
In short, we offer guidance to policymakers, drawing on the literature and our own findings, to help improve the proposed accountability provisions before they are enacted. To that end, we impose the proposed rules on prior school-level longitudinal achievement data (2003–2004 to 2010–2011) from California to investigate two questions:
How stable would PLAS, AGS, and LSAS classifications be?
To what extent would these classifications identify the types of schools they are designed to identify?
California is an ideal site for this analysis because of its large size and its dual accountability system that uses both status and school-level growth-to-proficiency measures of achievement, which are increasingly common in state accountability systems (McNeil, 2012). California is a unique state, owing to its size and educational policy history, but it is not straightforward to predict how the unique features of the state affect the results we identify. We believe the most likely effects are that California’s large AYP subgroup size (100 vs. a national modal value of 40 to 50; Harr-Robins et al., 2012) and large school size (609 vs. 486; United States Department of Education, 2010) would lead to an inflation of stability estimates; thus, the results in this study may provide an upper bound on the stability of the Harkin-Enzi proposal compared to evaluations using data from smaller states and states with smaller schools (Kane & Staiger, 2002; Linn & Haug, 2002).
We acknowledge that the enacted revisions will likely differ from the Harkin-Enzi proposal. However, our research provides timely evidence to help next-generation accountability policies achieve their intended effects. We assume accountability policies can only be effective insofar as they properly identify the “targets” that need intervention. Thus, for school-level accountability, we assume the goal is to identify consistently low-achieving schools or schools with large achievement gaps that are not improving over time.
We also acknowledge that our methods and findings are not totally novel; indeed, our work is informed by earlier NCLB research (Balfanz et al., 2007; Darling-Hammond, 2007; Ho, 2008; Linn et al., 2002; Porter et al., 2005) and research on the design of accountability systems (Balfanz et al., 2007; Clotfelter & Ladd, 1996; Kane & Staiger, 2002; Krieg & Storer, 2006; Ladd & Walsh, 2002; Linn, 2003, 2004; Linn & Haug, 2002). However, we show that the current draft legislation does not account for the collective knowledge of the education research community about accountability system design, suggesting a need for a clear reminder. Thus, we identify several straightforward approaches to properly identifying the schools most in need of improvement that could be incorporated into future ESEA drafts or state NCLB waiver plans.
Background
Prior Literature
There is extensive literature on the intended and unintended consequences of accountability policies (Carnoy & Loeb, 2002; Cullen & Reback, 2006; Dee & Jacob, 2011; Figlio, 2006; Figlio & Getzler, 2002; Figlio & Loeb, 2011; Hanushek & Raymond, 2005; Jacob & Levitt, 2003; Krieg, 2011; Krieg & Storer, 2006; Neal & Schanzenbach, 2010; Reback, 2008) and the design and measurement problems associated with school-level accountability systems (Dunn & Allen, 2009; Hill & DePascale, 2003; Ho, 2008; Ho, Lewis, & Farris, 2009; Ladd & Walsh, 2002; Linn, 2000, 2004; Linn et al., 2002; Linn & Haug, 2002; Porter et al., 2005; Weiss & May, 2012). In this review, we briefly outline the accountability literature on the stability and fairness of the school-level performance measures under AYP.
Most accountability systems assume that student achievement, measured by annual achievement tests, adequately represents school quality. This assumption presumes that student achievement test results are strongly related to future labor market outcomes (Chetty, Friedman, & Rockoff, 2011). However, research indicates several validity issues related to the use of student achievement to assess school quality. First, it is difficult to compare proficiency across states because of variation in proficiency cut scores (de Mello & McLaughlin, 2009; Fuller, Wright, Gesicki, & Kang, 2007; Linn et al., 2002; Reed, 2009). Second, AYP’s use of a status measure of achievement, rather than growth, does not adequately consider schools’ student composition or academic improvement (Heck, 2006; Kim & Sunderman, 2005; Krieg & Storer, 2006; Porter et al., 2005; Weiss & May, 2012). Third, it is difficult to compare school performance over time as changes in school-level proficiency rates are unreliable (Ho, 2008; Kane & Staiger, 2002; Linn, 2004). Fourth, the growth-to-proficiency models allowed under NCLB (i.e., growth model pilots, safe harbor) do not meaningfully account for school improvement (Ho et al., 2009; Polikoff & Wrabel, 2012; Weiss & May, 2012).
A desirable accountability system would consistently hold low-performing schools accountable for only that portion of student performance under the school’s control. A few pre-NCLB accountability systems used statistical adjustments to remove the variance in students’ test scores unrelated to school-controlled factors (Clotfelter & Ladd, 1996). However, AYP holds schools accountable solely for student proficiency rates. Thus, research indicates that several types of schools are more likely to fail AYP: larger, more diverse schools with more significant subgroups (Balfanz et al., 2007; Krieg & Storer, 2006); schools with significant populations of particular disadvantaged subgroups such as students with disabilities or English-language learners (Balfanz et al., 2007; Krieg & Storer, 2006); and schools with lower initial achievement (Riddle & Kober, 2011). Together, these problems suggest AYP is not well designed for fairly identifying schools based on their performance in improving student learning (Darling-Hammond, 2007; Linn, 2003; Neal & Schanzenbach, 2010).
The Harkin-Enzi proposal improves on some but not all of these issues. For instance, the proposal allows states to make more use of growth than is true under AYP; however, it is unclear if the proposal allows student growth (i.e., year-to-year improvements in individual students’ test scores) or the school-level growth-to-proficiency models proposed by most states applying for NCLB waivers. The proposal would also reduce but not eliminate the diversity penalty, because the AGS and LSAS would focus only on the largest achievement gap and the lowest subgroup proficiency rate. Furthermore, the proposal would solve the problem of varying school failure rates across states, because the bottom 15% of schools in each state would be targeted for accountability. However, the revised law would not appear to solve the problem of schools with challenging student inputs bearing the brunt of accountability, based on the continued use of a status model of accountability. Nor is it clear whether it would be as difficult for schools to improve enough to move out of the failing category as it is currently. Thus, there remain important questions about the proposed measures, and our analysis contributes to the national discussion on these issues.
Adequate Yearly Progress
The AYP provisions hold schools and districts receiving Title I funds accountable for student achievement. States must test students in Grades 3–8 and at least once in high school in mathematics and English language arts (ELA); these are the results used for AYP. Each state is required to set proficiency cutscores and proficiency rate goals (the annual measurable objective [AMO]), and these goals are increasing to 100% in 2014. The same proficiency goal is used for the whole school and for subgroups defined by race/ethnicity, poverty, special education, and English-language learner status. Only numerically significant subgroups that exceed a state-chosen size are used for accountability; in California, the minimum subgroup size is 100 or, if the subgroup is 15% or more of the school population, 50. A school or district where one subgroup fails one AMO fails AYP and is potentially subject to sanctions. Schools failing AYP in 2 straight years enter Program Improvement (PI) status; schools progress through the five PI levels and sanctions each year they fail AYP. There are some exceptions to these rules such as the safe harbor provisions and the pilot growth program (in participating states).
Public School Accountability Act
In 1999, the California State Senate passed the Public School Accountability Act (PSAA), which created the Accountability Performance Index (API; EC 50251). The API is a weighted average of students’ ELA, math, history, and science California Standards Test (CST) performance levels. Each performance level is associated with a point value: 1000 for advanced, 875 for proficient, 700 for basic, 500 for below basic, and 200 for far below basic. Furthermore, each subject is given a specific weight, with most of the weight for ELA and mathematics. The schoolwide API target is 800. Schools are also accountable for subgroup API scores. However, we only use schoolwide API here because the Harkin-Enzi proposal does not mention the use of growth measures for the AGS or LSAS designations.
If schools have an API below 800, they must meet annual growth targets, where growth is defined as the difference between the current year’s and the previous year’s API scores. Schools with APIs above 800 do not have growth targets; thus, we replace these schools if they fall in the bottom 5%, with the adjacent lowest-performing school with an API below 800. 2 In this article, we use API growth to evaluate the possibility of using growth measures under the proposed ESEA, as this would likely be the growth measure used in California.
Data
To investigate how the proposed ESEA revisions would likely impact California accountability, we use an 8-year panel of school-level data from the California Department of Education (available at http://www.cde.ca.gov/ta/ac/ay/) to establish the PLAS, AGS, and LSAS. The AYP data set includes school and subgroup proficiency rates on annual math and ELA tests, school demographics, and indicators for whether each subgroup was significant under AYP. Although most special education students take the CSTs, these results include alternate achievement test results that are used for AYP accountability. 3 The data set also includes basic school characteristics such as total enrollment and indicators for Title 1 receipt and school level (elementary, middle, or high). The API data set includes schools’ API level and growth scores. We focus only on elementary and middle schools in this analysis, because we are more focused on design issues related to the use of achievement test data (as opposed to graduation rates), and because API and AYP calculations in California high schools use different assessment data, making comparisons of status and growth models less clear.
We do not have access to statewide student-level data for California and thus cannot estimate student-level growth models. Given the findings of others (e.g., Ladd & Walsh, 2002; Weiss & May, 2012) we believe student-level growth models are superior to school-level growth and growth-to-proficiency models like those used in California and proposed in the large majority of states currently seeking NCLB waivers (McNeil, 2012). Thus, we view our findings as to growth and combined status/growth models as a “lower bound” on the quality of those estimates.
Methods
Identifying Schools
We use three different measures of school performance to find the PLAS: status, growth, and combined. For the status approach, we averaged each school’s ELA and math proficiency rates for a given school year, rank-ordered the schools according to the average proficiency rates, and labeled the schools in the fifth-percentile or lower as the PLAS (status). For the growth approach, we ranked schools by API growth each year and labeled the schools in the fifth-percentile or lower as the PLAS (growth). For the combined approach, we standardized each school’s average proficiency rates and API growth using state means and standard deviations, ranked the schools using the simple average of the two standardized measures, and grouped the schools in the fifth-percentile or lower as the PLAS (combined). We also ran these analyses using 2- and 3-year rolling averages of each measure.
We used subgroup proficiency rates to find the AGS and LSAS. Per the Harkin-Enzi proposal, we excluded the PLAS from the LSAS and AGS. For both designations, we used the average of ELA and math proficiency rates for significant subgroups. To find the LSAS, we ranked schools according to the combined ELA/math proficiency rate from their lowest-performing subgroup, classifying the schools in the fifth-percentile or lower as LSAS. To find the AGS, we took the difference between each school’s highest- and lowest-performing significant subgroups, rank-ordering them to identify the schools in the fifth-percentile or lower as the AGS.
We use descriptive and multivariate analyses to answer our research questions. We first measure the stability of the five accountability rankings in three ways. First, we compare how many schools identified in each category in year t are still identified in years t + 1 to t + 3. Second, we identify the number and proportion of schools that fail under each of the five classifications across the 8-year period. Finally we examine how non-PI, PI1–PI2, and PI3+ schools fare under the PLAS status, growth, and combined systems using 1 and 3 years of data. In each case, we compare to the AYP status quo. Finding that 3-year averages result in improved stability, we answer the second question using 3-year averages.
Next, we compare the characteristics of schools failing under each of the five categories using descriptive statistics and panel logistic regressions with time fixed-effects and cluster-robust standard errors. Specifically, we use the five accountability categories as separate dichotomous outcomes and regress them on: the first lag of the dependent variable (prior year’s status in the accountability category); school proportions of special education and non-Asian minority students; indicators for significant Asian or White populations in the school; a count for the number of significant minority/traditionally underserved subgroups (i.e., Hispanic, ELL, FRL, special education, Black, American Indian, Pacific Islander, and Filipino); the natural log of the school’s enrollment; and an indicator for elementary schools.
Results
How Stable Are Classifications?
As expected, the five criteria result in markedly different stability. The top section of Table 1 reports the stability of each measure over a 2-, 3-, and 4-year period based on 1 year of data. The most stable measures are PLAS status and AGS. Approximately two-thirds of schools identified on these measures are identified again the next year, 50% the next 2 years, and 40% the next 3 years. The next most stable is the LSAS, which identifies 57% of the same schools the subsequent year, 33% the next 2 years, and 25% the next 3 years. These three classifications are only slightly less stable than the current NCLB system (rightmost column). In contrast, PLAS growth and combined measures have little stability. The combined measure identifies just 12% of schools across 2 years and 2% or less across 3 or more years. The growth measure has less than 1% stability over a 2-, 3-, or 4-year period.
Share of Schools Identified as Low Performing Under the 5 Accountability Groups Across 2, 3, and 4 Consecutive Years
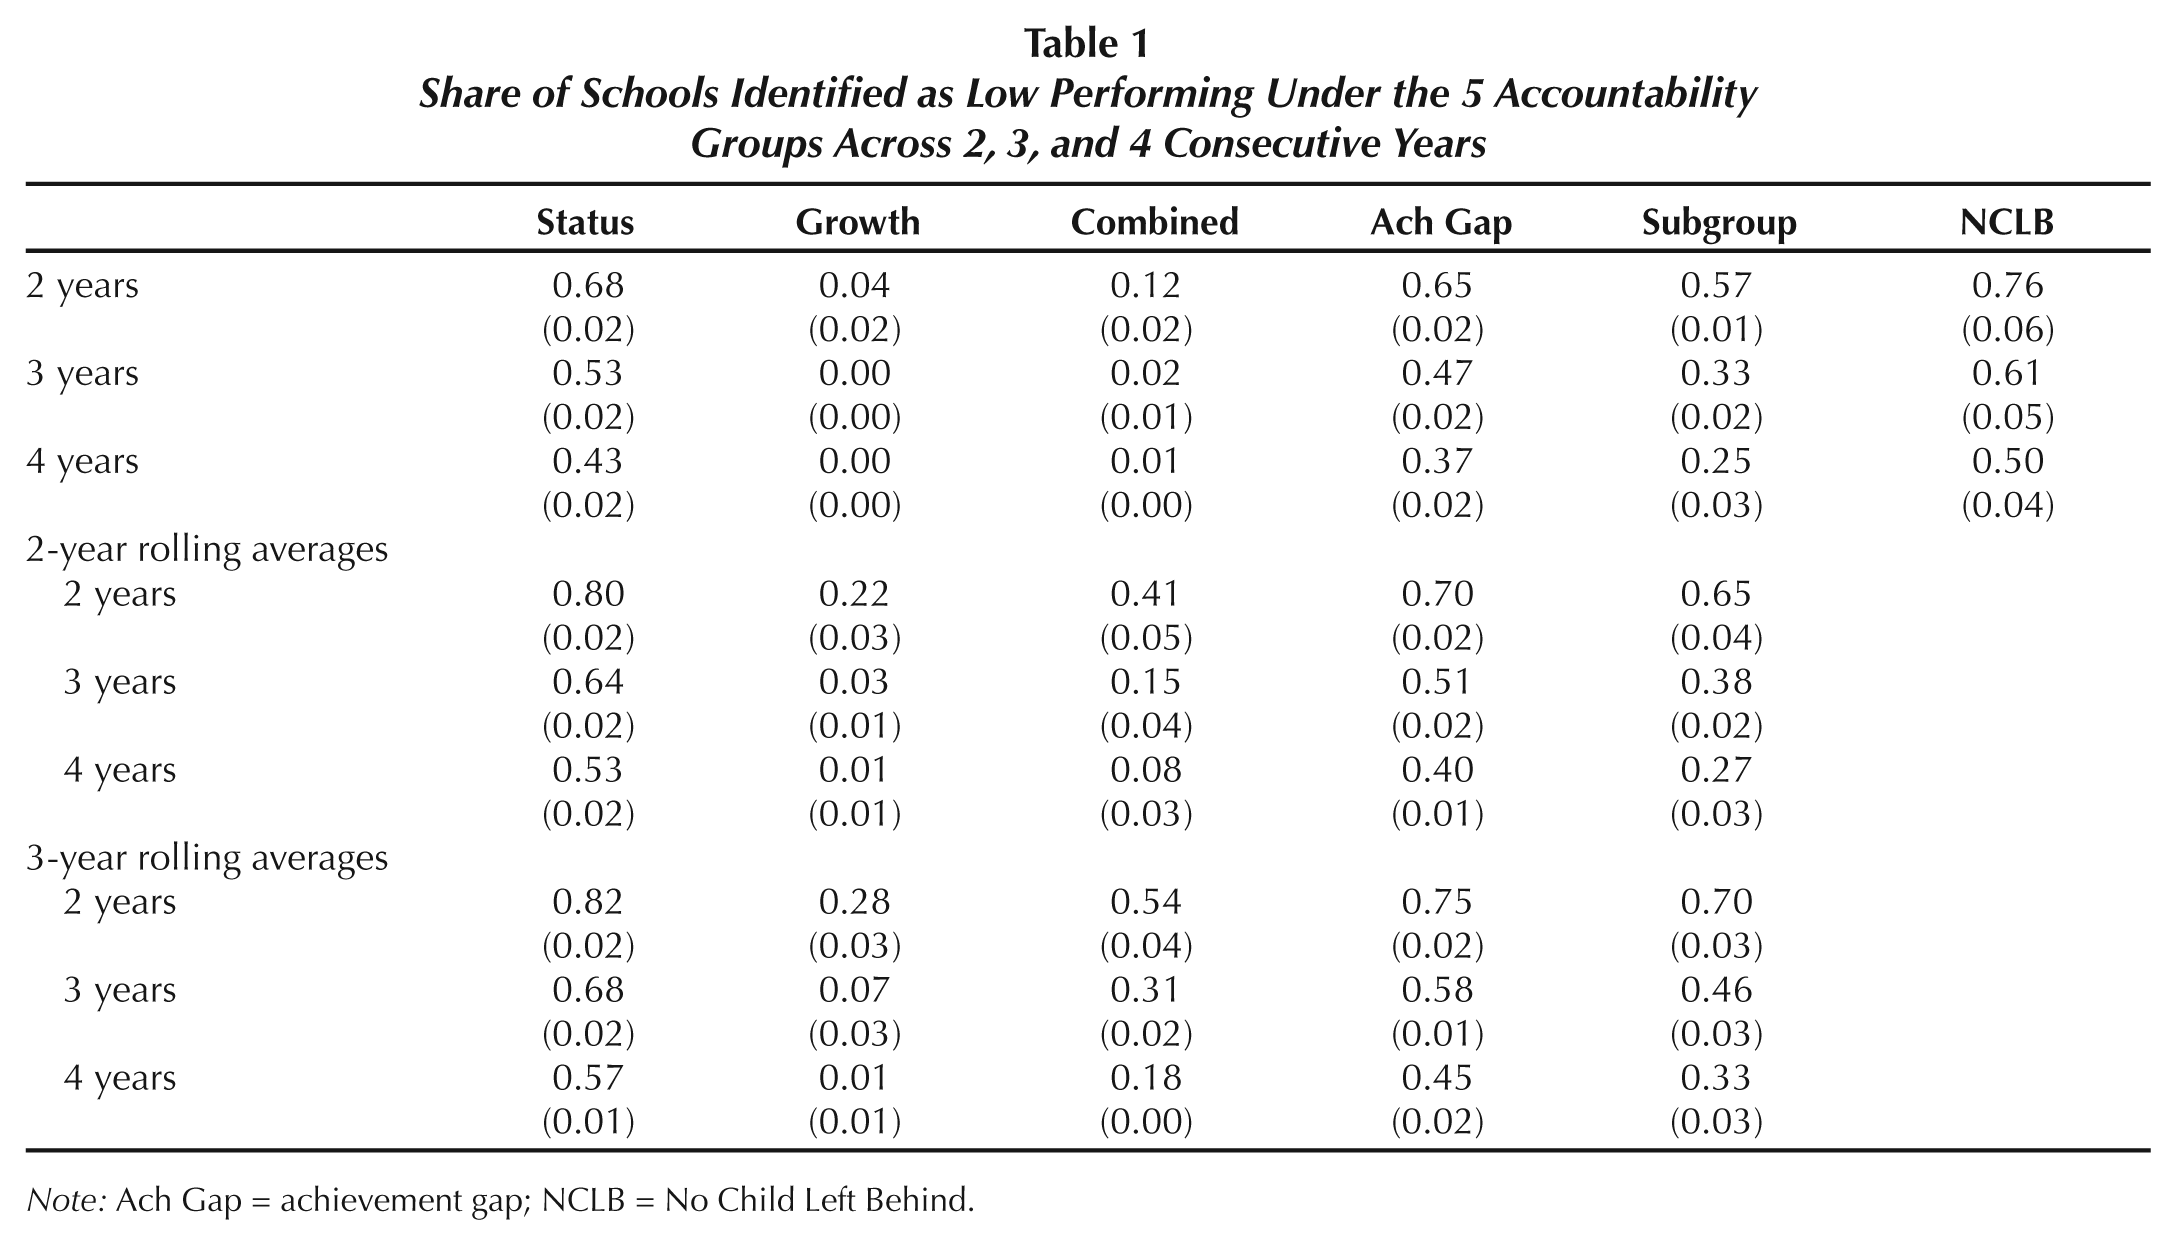
Note: Ach Gap = achievement gap; NCLB = No Child Left Behind.
Not surprisingly, 2- and 3-year rolling averages increase the stability of all five accountability classifications, as seen in the bottom two panels of Table 1. The LSAS growth and combined classifications improved the most, with growth measures improving from 4% stability to 22% and 28% and combined measures improving from 13% to 41% and 54% stability, respectively, using 2- and 3-year averages.
In Table 2, we present stability differently, identifying the proportion of schools that fail under each classification across a 6-year period (2005–2006 to 2010–2011) using 1 and 3 years of achievement data. The proportion of schools failing at least once could range from 5% (a perfectly stable system identifying the same schools each year) to 30% (a perfectly random system that identifies schools no more than once). The PLAS status, AGS, and LSAS categories identify approximately 11% of Title 1 elementary and middle schools as failing using 1 and 3 years of data, compared with 14% to 21% for PLAS growth and combined categories. Table 2 also highlights that PLAS status, AGS, and LSAS schools are often identified as failing for many years. For instance, 25% of the schools identified as PLAS or AGS at least once over the 6-year period were in the bottom 5% for 4 or more years. In contrast, almost none of the LSAS growth or combined schools, except for combined schools based on a 3-year average, were in the bottom 5% for that many years. Indeed, the large majority of LSAS growth and combined schools that fell into the bottom 5% did so exactly once. Overall, just 59% of Title I schools fell into the bottom 5% of at least one of the five measures in at least one of the 6 years, fewer than the 89% of schools that failed AYP during the period.
Number of Times a School Fell Into One of the Following Accountability Categories Over a 6-Year Period Using 1 and 3 Years of Data
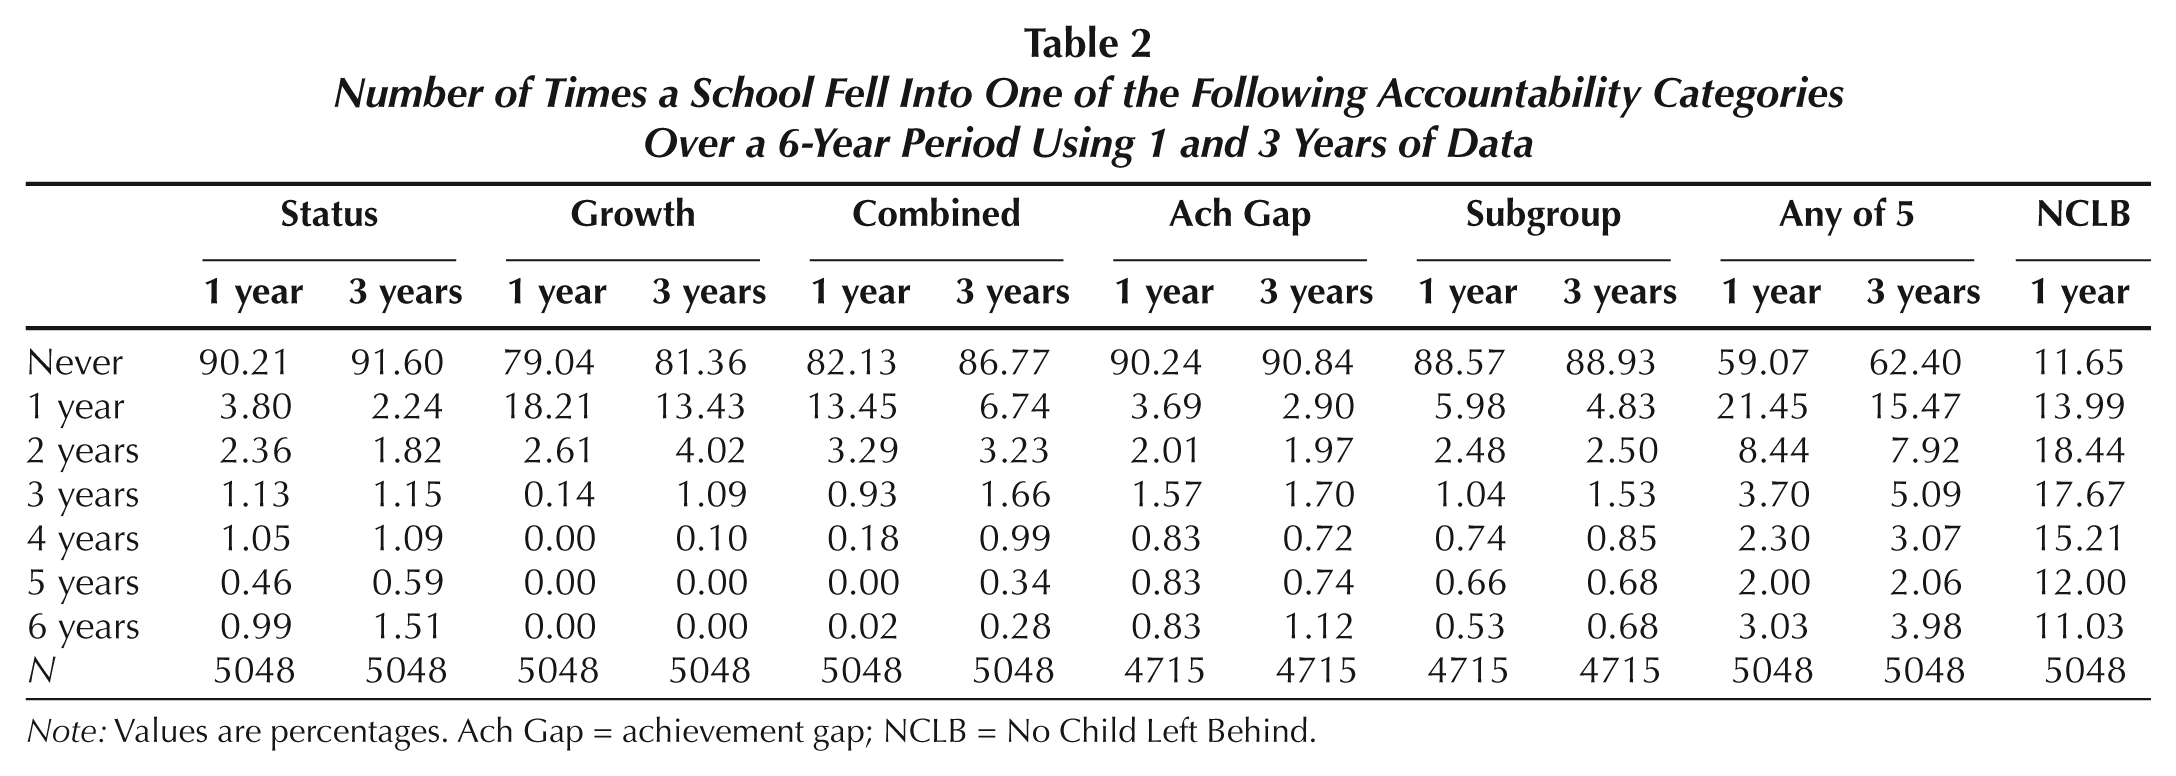
Note: Values are percentages. Ach Gap = achievement gap; NCLB = No Child Left Behind.
We finally compare how the current AYP system relates to the proposed system by evaluating the identification patterns across the proposed PLAS status, growth, and combined categories based on schools’ PI status (not in PI, in PI1 or PI2, or in PI3–PI5) entering the 2005–2006 school year. A few interesting patterns emerge. First, Table 3 shows that most of the schools identified by PLAS status in 2006 through 2011 were in PI in 2005–2006, and this trend increases when using 3 years of data. In contrast, most of the PLAS growth schools using either 1 or 3 years of data were not in PI status as of 2005–2006, indicating that a growth-only approach would identify different schools than are currently identified. The combined measure is a blend of the status and growth measures. It is only when using 3 years of data that the PLAS combined measure approaches the patterns of the PLAS status category.
Share of Schools in the PLAS Status, Growth, and Combined Category by Schools’ 2005–2006 PI Status From 2006 to 2011
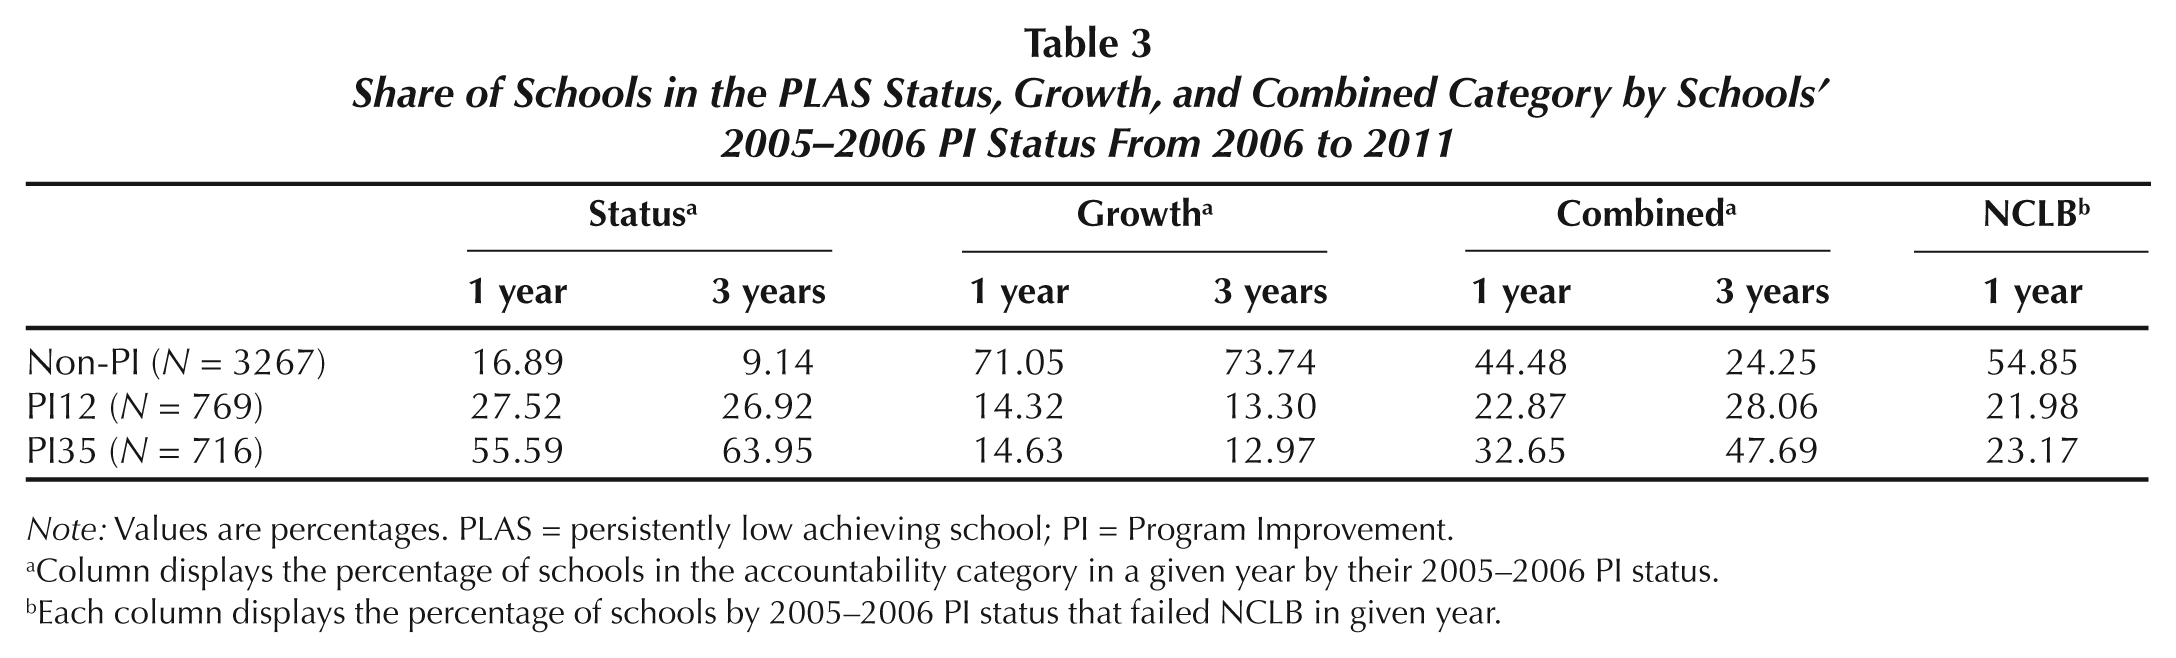
Note: Values are percentages. PLAS = persistently low achieving school; PI = Program Improvement.
Column displays the percentage of schools in the accountability category in a given year by their 2005–2006 PI status.
Each column displays the percentage of schools by 2005–2006 PI status that failed NCLB in given year.
As predicted by prior research, the status measures are the most stable, followed by combined and growth measures (Linn, 2000; Linn & Haug, 2002). Three-year rolling averages are more stable than 1-year measures. Given that a 3-year average combined measure accounts for growth without the stability problems of a growth-only system, it is the preferred system for PLAS. The LSAS and AGS classifications are also quite stable using rolling averages. Thus, in the next analysis, we analyze the types of schools identified in the PLAS, AGS, and LSAS categories using 3-year rolling averages.
Which Schools Would Be Identified?
We next examine descriptive statistics for the failing schools in each category in 2011 based on 3-year averages (Table 4). For the three PLAS classifications, there are dramatic differences in school demographics and performance. The defining characteristics of schools failing under a status model are their racial/ethnic and poverty concentrations and school level. The typical school failing on proficiency status is 85% Black or Hispanic and 90% free/reduced-price lunch eligible, compared to statewide Title 1 averages of 68% and 75%. These schools are more likely to be middle schools (63%) than is typical (16%), and they are 30% larger than average. Finally, although these schools by definition have the lowest proficiency rates, they average in the 46th percentile in API growth.
Demographics of Schools Falling in the Bottom 5% Under Each Classification in 2011
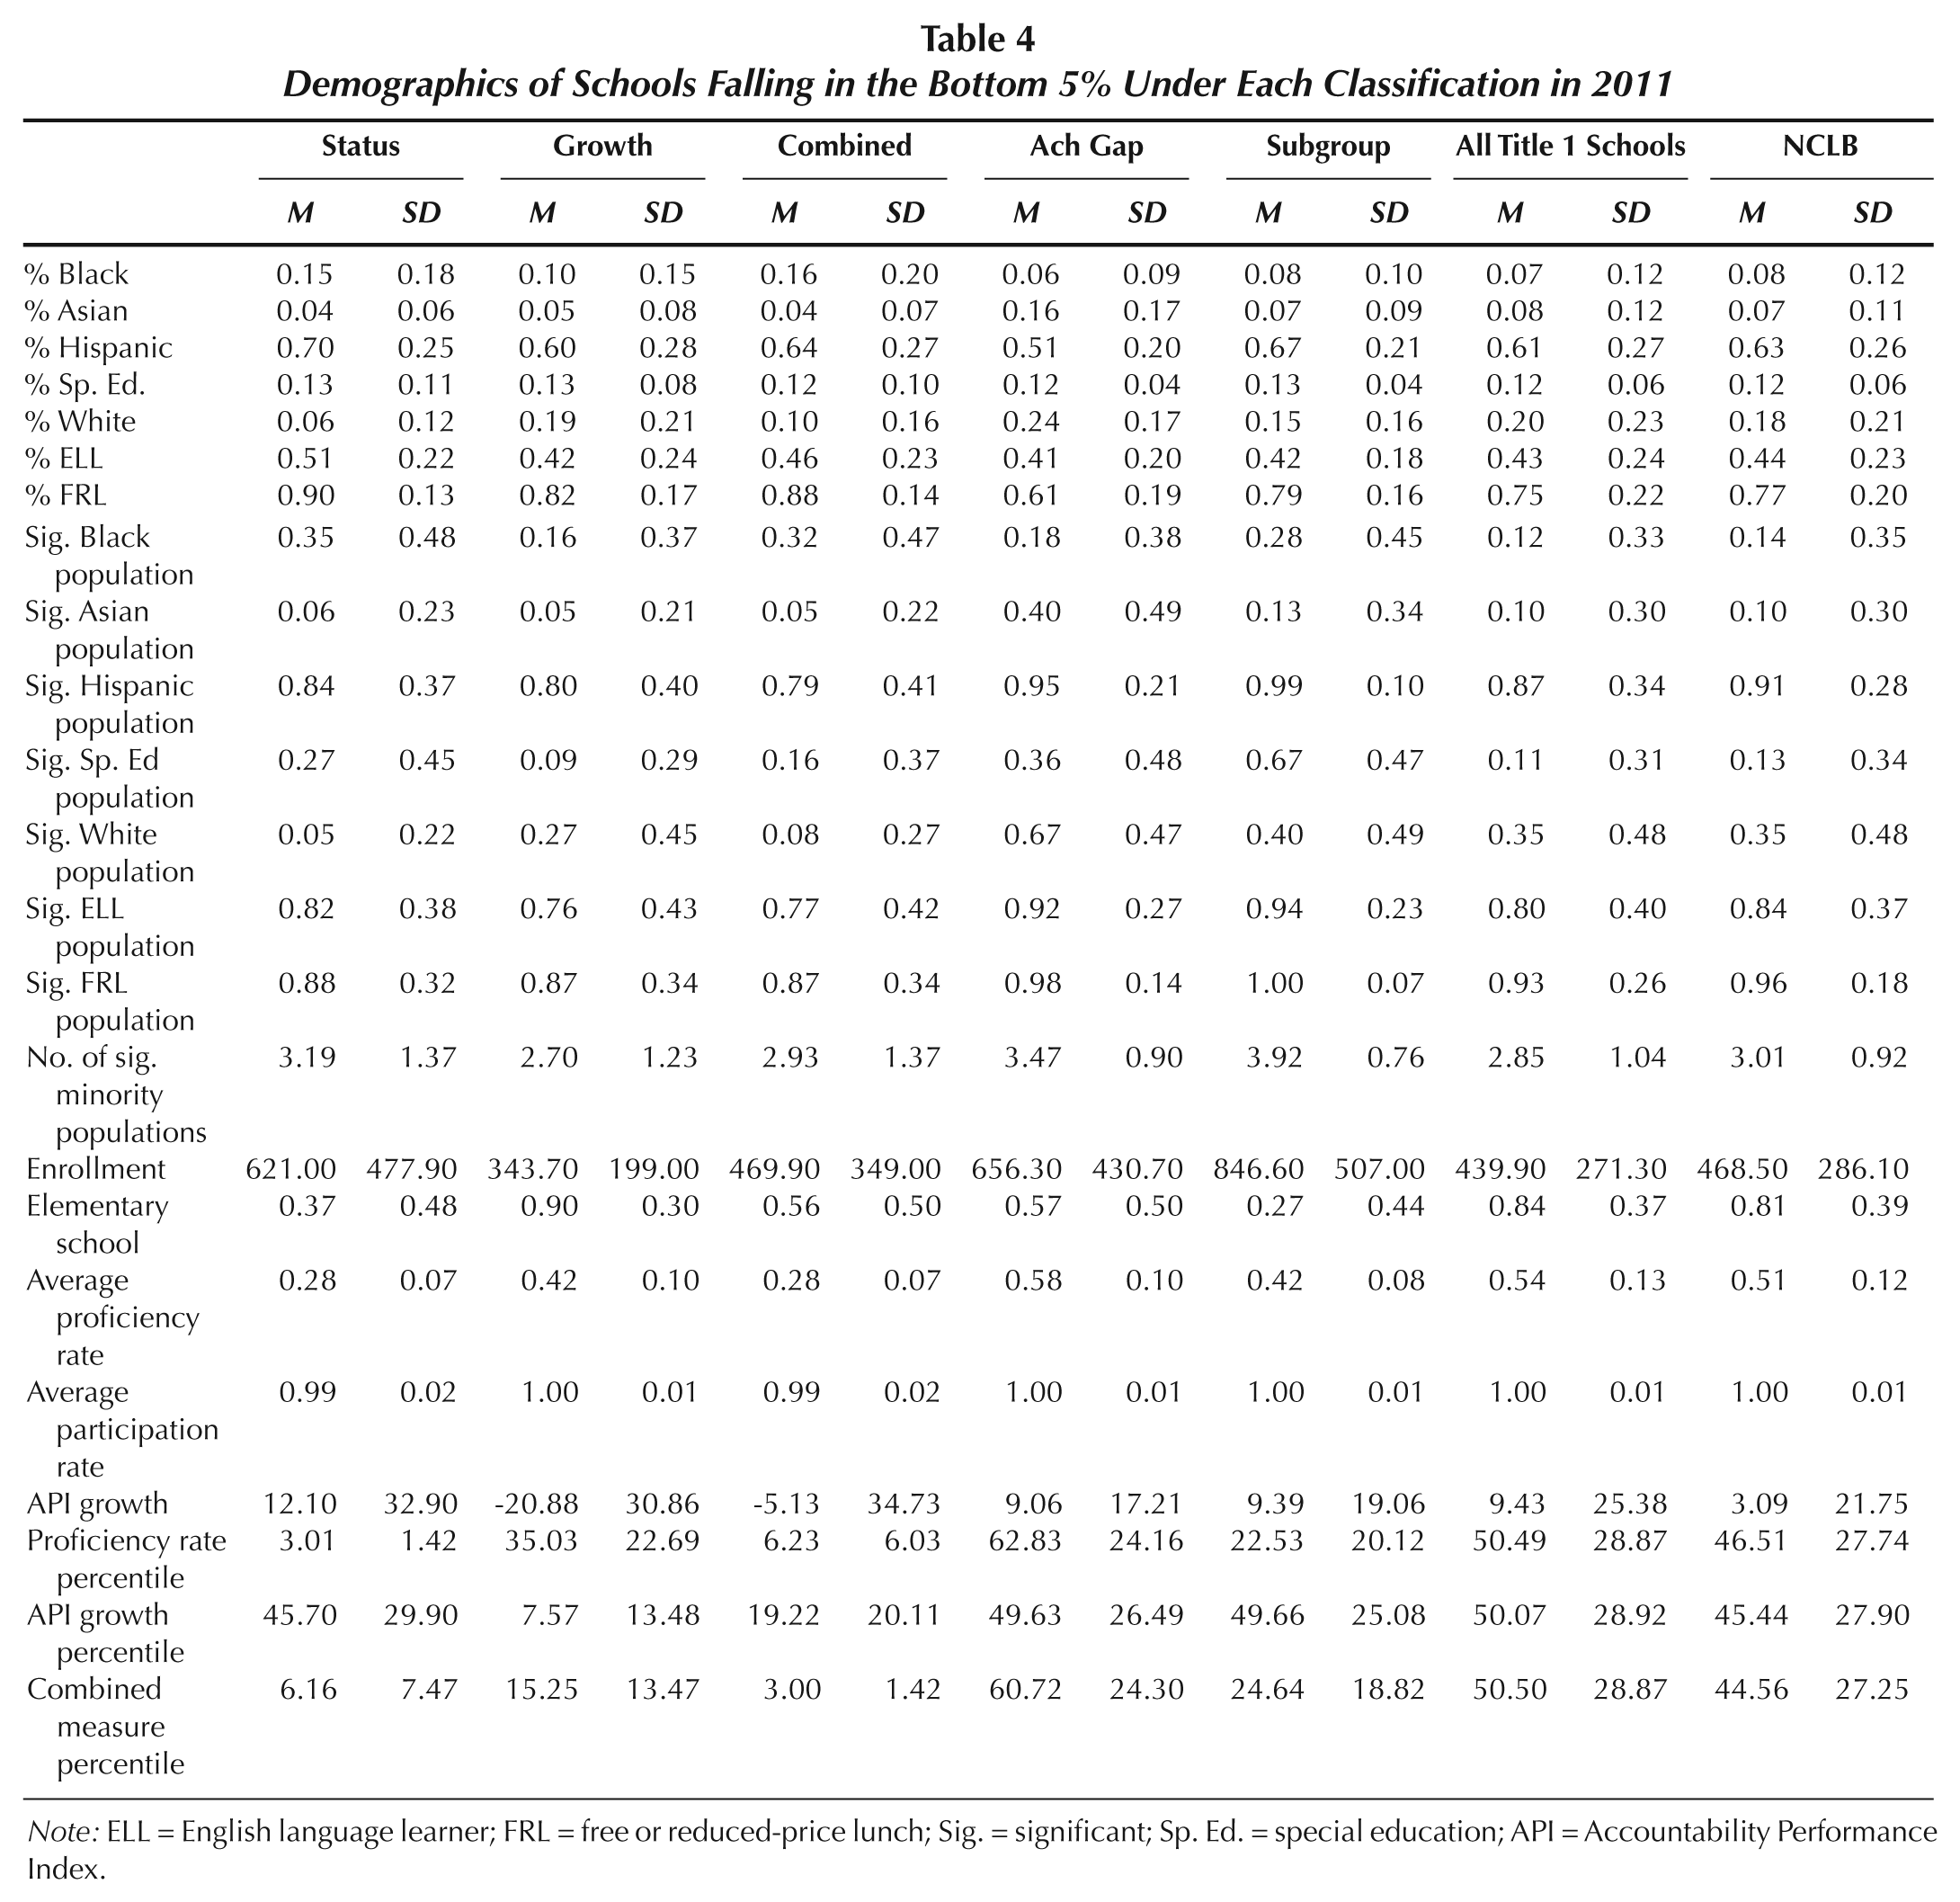
Note: ELL = English language learner; FRL = free or reduced-price lunch; Sig. = significant; Sp. Ed. = special education; API = Accountability Performance Index.
In contrast, the defining characteristic of schools failing under a growth-only model is their small size. Growth-only schools are demographically similar to all Title 1 schools; however, growth-only schools are 22% smaller than the statewide average. These schools are moderately low achievers, with proficiency rates in the 35th percentile. Clearly, a growth-only system disproportionately identifies small schools with larger year-to-year test score fluctuations.
Identifying PLAS by combining status and growth results in the identification of schools that are in between those identified under growth-only and status-only models. For instance, these schools are average in size, despite being 28% more likely to be middle schools than is typical. These schools look similar in racial/ethnic and poverty distribution to status-only schools except that they are 4% more White and 6% less Hispanic than status-only schools. Finally, these schools are low achievers on status (6th percentile) and growth (19th percentile).
As for the AGS, they have more White and Asian students and more significant White and Asian subgroups than is typical. Indeed, every AGS school over the study period was identified because of a gap including either White (57%) or Asian (43%) students. On average, these schools are two-thirds larger and have fewer students in poverty than average. Last, AGS are not low-achieving schools, with average status, growth, and combined rankings in the 49th to 62nd percentiles. These are different schools than have been identified under NCLB or PSAA.
The LSAS are schools with many subgroups; they are more likely than other schools to have a significant special education subgroup, and they have more significant subgroups than other schools. Predominantly (73%) middle schools, they are nearly double the statewide average size for Title 1 schools. The vast majority of these schools fail due to special education (74% of failing schools during the study period) and ELL subgroups (18%). Finally, these are low-achieving schools in proficiency level (23rd percentile); however, they are average in growth.
Logistic regressions
Table 5 displays logistic regressions predicting identification in the bottom 5% on each classification in 2011. Among the PLAS models, the status-only approach is stacked against schools that failed last year, schools with more minority students, and middle schools. In contrast, growth-only approaches are more moderate in their relationships with observable school characteristics, with the exception of penalties for schools with more special education students, fewer Asian students, and smaller sizes. The combined approach is generally in between the other approaches, penalizing schools with more minorities and that failed last year, but not as much as a status-only approach. For the AGS, schools with significant Asian or White populations are more likely to be in the bottom than schools without significant populations. Also, schools with more significant minority subgroups and schools that were in the bottom 5% on AGS last year are more likely to be in the bottom. Last, the LSAS model shows that schools with more special education students are more likely to be in the bottom 5%, as are schools with more significant minority subgroups and schools that fell in the bottom 5% in LSAS in the previous year.
Logistic Regressions Predicting Bottom 5% Classification in Five Categories and Under NCLB, 2006–2011

p < .10. *p < .05. **p < .01. ***p < .001.
A few patterns appear across all five models. In none of the classifications are larger schools significantly more likely than smaller schools to fall in the bottom 5%; however, the opposite is true under AYP (rightmost column). On the other hand, elementary schools are significantly less likely than middle schools to fail under all five classifications and the current AYP system. This indicates that when an accountability system groups large schools, small schools, and elementary and middle schools together, there will be an unequal distribution of bottom 5% classifications across school types and sizes.
Discussion
Our results have implications for policymakers currently debating ESEA reauthorization. The first is that the types of schools identified as being in the bottom 5% will vary dramatically depending on whether status, growth, or a combination is used. Status models identify middle schools serving more poor and minority students. Although low-achieving, these schools are near the average in terms of proficiency growth. In contrast, growth models identify smaller schools that are demographically typical, perhaps suggesting they are mainly identifying random year-to-year fluctuations. A combined model –here the average of the standardized proficiency rate and API growth scores—identifies schools that are low-performing on achievement status and growth. These are the schools we most want to identify for improvement.
The second finding is that the stability of classifications in a growth or combined model is near zero if only 1-year data are used. This suggests that, as with evaluating teachers’ contributions to student learning, year-to-year comparisons are noisy (Kane & Staiger, 2002). However, simple 3-year averages of combined proficiency level and growth measures dramatically reduce this noisiness and still focus the PLAS on low-achieving, low-growing schools.
Third, the AGS criterion expands accountability to a different set of schools—schools with moderate and improving achievement but consistently large achievement gaps. These AGS are stable across time—nearly as stable as PLAS defined by status.
Fourth, the subgroup criterion for identifying the bottom 5% is mainly a measure of the performance of students with disabilities in schools that have a significant number of those students. This is likely not what lawmakers have in mind for this measure. This finding may highlight a tension between inclusion and universal accountability (Thurlow, 2004).
Last, elementary schools are favored over middle schools under all criteria, as they were under AYP. Unless we really believe that elementary schools are so dramatically better than middle schools, this finding speaks to a flaw in the proposed methods of identifying schools.
Given these findings, we offer six policy recommendations for a revised ESEA:
Persistently low-achieving schools should be identified using status and growth data, ideally incorporating information from the full achievement distribution to reduce gaming (Clotfelter & Ladd, 1996; Ladd & Lauen, 2010; Neal & Schanzenbach, 2010). This approach captures low-achieving, low-growing schools and improves on the fairness issues of status-only systems and the stability issues of growth-only systems.
Because the PLAS combined rankings are unstable with 1 year of data, 3-year averages should be used (Kane & Staiger, 2002; Linn, 2004; Linn & Haug, 2002).
Accountability should be administered separately by school level. Thus, if the goal is to hold 15% of schools accountable, the policy should ensure that 15% of each type of school—elementary, middle, and high—is sanctioned each year.
The policy should first group schools on enrollment and/or student characteristics and then find the bottom 5% of each group. This method should alleviate some of the fairness issues found in the second question. For example, schools could be grouped into quantiles on net enrollment and then ranked on their performance (Kane & Staiger, 2002). This would even out the allocation of school sizes in the bottom 5%.
Policymakers should consider alternatives to the proposed LSAS criteria, which, as written, target schools serving significant numbers of students with disabilities. One alternative would be to stratify the LSAS by subgroups, identifying the bottom 5% in Hispanic achievement, the bottom 5% in special education achievement, etc. A second alternative would be to reallocate the 5% of LSAS schools to PLAS or AGS.
Researchers and policymakers should conduct thought experiments like the one presented here (e.g., Heck, 2006; Porter et al., 2005; Ladd & Walsh, 2002). The data are often easy to obtain and analyze and could inform accountability system design. Although many of our results will hold across states, each state has unique demographics and prior accountability histories, and it would be valuable to engage in an analysis like this for all states.
Although few of these findings are unique to the current analysis, it is quite clear that policymakers have not gleaned from the extensive existing literature in constructing the current proposed policy. Thus, our evidence is useful for the current policy debate and suggests that the proposed policy changes will result in a system that more precisely identifies the schools for intervention that need the most improvement—schools that have low average achievement, little achievement growth over time, and large achievement gaps. Whether the interventions targeted for these schools will help address these achievement problems is another issue worthy of investigation.