
Abstract
We describe an innovative automated test construction algorithm for building aligned achievement tests. By incorporating the algorithm into the test construction process, along with other test construction procedures for building reliable and unbiased assessments, the result is much more valid tests than result from current test construction practices. The test construction process is efficient and versatile in its application. The target domain could be state content standards, a particular curriculum, or even an intervention. The algorithm, which draws on Surveys of Enacted Curriculum (SEC) procedures, can be employed in the context of English language arts and reading, mathematics, or science. We demonstrate the algorithm’s use and benefits for constructing tests, guiding item writing, and creating subtests from an existing test such that the subtests.
Despite the requirements of No Child Left Behind Act (NCLB) and theories underlying standards-based educational reforms, the tests used to measure student mastery of state content standards under NCLB have been weakly aligned to those standards (Polikoff, Porter, & Smithson, 2011). Aside from the obvious inefficiencies posed by this disconnect, misalignment carries with it a number of practical problems. For one thing, poorly aligned tests send confusing messages to teachers about the content they should be teaching. Misalignment also undermines the clear communication of content in the standards. And it fails to provide teachers with robust information about the extent to which their instruction has helped students learn core content.
The need for increased alignment has taken on new urgency as educators transition to the Common Core State Standards (CCSS). The U.S. Department of Education is funding two major consortia to develop assessments that are aligned to the CCSS by the 2014–15 academic year.
In what follows, we present an algorithm for automated test construction that yields more tightly aligned assessments. The use of the algorithm makes the validity argument of alignment or content validity a more transparent and replicable part of item writing and item selection in test construction. The result is much more highly aligned and so more valid tests than result from current test construction procedures. One of the primary benefits of our algorithm is that the target domain is generalizable; the domain could be content standards, a specific set of curriculum materials, or an intervention designed to improve participants’ knowledge. Similarly, our approach allows for numerous types of items, including multiple choice, short answer, and extended response. Our algorithm is efficient, versatile, and results in more tightly aligned assessments than those created by existing test construction techniques. When use of the alignment algorithm is added to test construction procedures that ensure reliability and lack of bias, the result is much better information on student achievement levels.
We first situate our work in the commonly accepted standards for testing. Next, we describe the study that motivated the work. Finally, we introduce our algorithm and illustrate its uses. We conclude with implications for policy and practice.
A Brief History of Call for Alignment
The Standards and Alignment
According to Linn (2006), the Standards for Educational and Psychological Testing “are widely recognized as the most authoritative statement of professional consensus regarding the development and evaluation of educational and psychological tests” (p. 27). Although the Standards do not contain the term alignment (American Educational Research Association [AERA], American Psychological Association [APA], & National Council on Measurement in Education [NCME], 1999), they do refer to the concept of alignment in various ways.
In the section “[Validity] evidence based on test content,” the Standards state that “plausible rival hypotheses can often be generated by considering whether a test measures less or more than its proposed construct. Such concerns are referred to as construct underrepresentation and construct irrelevant variance” (p. 10), and both contribute to lack of alignment between the test and its target (Liu & Fulmer, 2008; Martone & Sireci, 2009).
Typically, when constructing student achievement tests, the first step is to specify a framework for the test that describes the scope of the domain to be measured. The next step is to establish test specifications. The third step, according to the Standards, is to assemble items into a test: “relevant consideration in item selection may include the content quality and scope, the weighting of items and subdomains, and the appropriateness of the items selected for the intended population of test takers” (AERA, APA, NCME, 1999, p. 39). Standard 3.11 states, “Test developers should document the extent to which the content demand of a test represents the defined domain and test specifications” (p. 45).
And finally, Standard 13.3 calls for the concept of alignment—as well as clear evidence of it—in the following passage, again without using the exact term:
When a test is used as an indicator of achievement in an instructional domain or with respect to specified curriculum standards, evidence of the extent to which the test samples the range of knowledge and elicits the processes reflected in the target domain should be provided. Both tested and target domains should be described in sufficient detail so their relationship can be evaluated. The analyses should make explicit those aspects of the target domain the test represents as well as those aspects that it fails to represent. (AERA, APA, NCME, 1999, p. 145)
Alignment in NCLB and CCSS
At least since the enactment of NCLB, alignment has been the preferred term to describe the strength of the relationship between what is actually tested and what test makers want to test. The law requires states to align assessments with academic content standards.
The next generation of standards is the CCSS (Common Core State Standards Initiative, 2010a, 2010b) in English language arts and mathematics. As we mentioned in the introduction to this article, the U.S. Department of Education is funding two multistate testing consortia to develop assessments aligned to the CCSS and ready for use by the 2014–15 academic year.
Under NCLB, the U.S. Department of Education requires states to provide evidence that their assessments are aligned to their content standards. However, NCLB does not define alignment precisely. In response, researchers have developed several procedures for measuring alignment (Ananda, 2003; Bhola, Impara, & Buckendahl, 2003; Olson, 2003; Porter, 2002; Rothman, 2003).
Measuring Alignment
Webb (2002) developed the most widely used method to investigate test-standards alignment. Webb’s procedure relies on expert judgment of the relationship between the assessment and the target content standards in four areas; judgments of alignment are based on surpassing minimum standards in each area. Webb’s procedure is applicable only to investigating the degree of alignment of a particular assessment to a particular set of content standards; it does not produce a single alignment index.
The second most commonly used method to investigate alignment was developed by Porter and colleagues (Gamoran, Porter, Smithson, & White, 1997; Porter, Floden, Freeman, Schmidt, & Schwille, 1988). This procedure produces an index of alignment ranging from 0 to 1. It can be used to investigate the degree of content alignment between any two statements of content, including content standards, assessments, curriculum materials, and teacher reports of the enacted curriculum (Porter, 2006). Because it is generalizable, and because it yields a single index of alignment, we adopted Porter’s alignment procedure as the basis of our test construction algorithm.
The Problem
The problem that led us to create the test construction algorithm was the need to develop student achievement tests and teacher knowledge tests for a yoked pair of large randomized field trials to test education interventions. One intervention involved the use of cognitive science principles (analogical and diagrammatic reasoning, and misconceptions) to modify middle school science curricula (Bransford & Schwartz, 199l; Chi, 2005; Hegarty, Kriz, & Cate, 2003). The other intervention used professional development to improve teacher content knowledge. The work involved testing the effects of the two interventions against each other and against a business-as-usual control.
We built two 90-school randomized field trials, one using Holt curriculum materials and the other using Full Option Science System (FOSS) curriculum materials. For each trial, the interventions targeted three curriculum units.
Two research questions guided our work: First, does the content knowledge intervention improve teacher content knowledge as compared to the control group? Second, which of the two interventions results in the greatest improvements to student achievement? To answer the first question, we needed to develop six tests of teacher content knowledge, one for each unit in the professional development intervention. To answer the second question, we needed to build six tightly aligned student achievement tests.
Our Approach
Our approach was to collect two populations of high-quality (reliable and unbiased) previously used science items, one for teacher content knowledge and one for student achievement, and to draw items from the populations to construct the 12 tests. Items for the student assessments came from National Assessment of Educational Progress science assessments, publicly released state assessments, and the My Pals Are Here Science Tests (Hwa, 2009). Items for the teacher assessments came from the Educational Testing Service’s Praxis exams for middle school science and other Praxis items, as well as the Diagnostic Science Assessments for Middle School Teachers (Saderholm, Ronau, Brown, & Collins, 2010), the Geosciences Concept Inventory (Linbarkin & Anderson, 2005), and the Misconceptions-Oriented Standards-Based Assessment Resources for Teachers (Sadler, Coyle, Cook-Smith, & Miller, 2007).
Describing the Content Using the Surveys of Enacted Curriculum
The Porter (2002) alignment measure begins by using a standard language to describe the content of the target domain and the available test items. The procedures are known as the Surveys of Enacted Curriculum (SEC) and are available through the Wisconsin Center for Educational Research. Content languages are available for English language arts and reading, mathematics, and science. Each content language has two dimensions: topics and categories of cognitive demand. Topics are fine-grained (e.g., transport of cellular material), and each fine-grained topic is nested within a coarse-grained topic (in this case, components of living systems). In all, the SEC language for science encompasses 211 fine-grained topics; when crossed with the five categories of cognitive demand, the SEC makes 1,055 content distinctions to describe K–12 science content. We describe the topics and cognitive demand categories in the online appendix. While the SEC frameworks have five levels of cognitive demand and approximately 200 topics, the algorithm will work on any framework for describing content that results in formal replicable distinctions among different content in a content domain. Content can be defined using distinctions at any “grain size” using one, two, or more dimensions of content types. We favor descriptions of content that result in distinctions in what is and is not taught that predict variance in measured value added to student achievement.
Each of the content languages has evolved over time. The goal was to create languages inclusive enough to capture virtually all of the science, math, and English language arts and reading taught in K–12 U.S. schools. The distinctions made among topics and categories of cognitive demand reflect distinctions teachers say they make in deciding what to teach and what not to teach. Over time, teachers, curriculum experts, and researchers have tested the languages, and changes have been incorporated (Porter, 2002).
Analyzing the Content
Porter’s content analysis techniques are described in detail elsewhere (Porter, Polikoff, Zeidner, & Smithson, 2008); here we provide a brief overview, as the techniques apply to our pair of randomized trials.
For the units and the achievement items collected, we asked content experts to independently analyze the material. For each of the smallest chunks of material being analyzed (e.g., an item), each content analyst determined which of the cells (defined by the intersection of a topic and cognitive demand) in the language were implied by the content. Analysts were restricted to selecting no more than three cells per item. If an analyst placed an item in multiple cells, the score points associated with that item were divided equally between those cells. The materials being content analyzed were weighted equally unless there was an indication of differential weighting (e.g., a 2-point test item gets twice as much weight as a 1-point item); for pieces of material in the six units, there was no other source of information from which to create differential weighting, so each was weighted 1.0.
After our content experts analyzed all the material for a unit, we converted frequencies in cells to proportions by dividing by the total number of pieces of instructional content analyzed. We then formed a matrix of proportions from the data of each content analyst, and averaged these across content analysts. The end result for each unit is a 211-by-5 matrix of proportions, which, across all cells, sums to 1.0.
Measuring Alignment
To investigate the alignment of a test to a unit, we compared the matrix for the unit to the matrix of proportions for the test. The alignment index is defined by the formula:
where xi = the assessment proportion in cell i and Y i = the target unit proportion in cell i (Porter, 2002). The index ranges from 0 (no alignment) to 1.0 (perfect alignment). The SEC and its alignment index have been used to investigate the alignment of state assessments to state standards (Polikoff et al., 2011), the alignment of state standards to one another (Porter, Polikoff, & Smithson, 2009) and to the CCSS (Porter, McMaken, Hwang, & Yang, 2011a, 2011b), and the alignment of instructional content as delivered by teachers to both standards and assessments (Polikoff, 2012).
Testing Data Quality
There are several indications of the SEC procedure’s validity and reliability. Porter (2002) and Porter et al. (2008) examined reliability among raters and found that, on average, the generalizability coefficient when four raters were used was .80 or higher when examining standards or tests.
Tests of an earlier version of the SEC content grid (using a sample of 62 teachers in 12 districts) showed high agreement between teacher reports of their instruction, classroom observations, and daily logs on the days observed (correlations of .70 and .80). Agreement between daily logs aggregated to a full school year and end-of-semester teacher surveys was also strong (most correlations between .60 and .80) (Porter et al., 1993). Further, the tool has been used to predict student achievement gains (Gamoran et al., 1997) and to estimate the effects of a professional development intervention (Porter, Smithson, Blank, & Zeidner, 2007). Using the SEC to quantify the alignment of teacher-reported instruction to a student achievement test using teacher/class as the unit of analysis, alignment uniquely explained more than 25% of the between-class variance in achievement gains (Gamoran et al., 1997). Using alignment as a dependent variable in a randomized field trial of a math and science professional development intervention, the alignment index was correlated .6 to .7 across 2 years, and the intervention group showed a .22 standard deviation increase in alignment resulting from the treatment (Porter et al., 2007).
The most telling pieces of this array of reliability and validity evidence for the SEC are (a) the strength of the relationship between the alignment index and student achievement gains (Gamoran et al., 1997) and (b) the statistically significant effect size of .22 on the alignment index in the randomized field trial of the professional development intervention (Porter et al., 2007). How could the index predict achievement gains or detect an effect in an experiment if (a) teacher self-report of the content of their instruction wasn’t valid, (b) content analyses weren’t valid, and (c) the index didn’t capture alignment between the two?
The Test Construction Algorithm: An Overview
We describe the test construction algorithm in detail in the Appendix. In brief, the procedure comprises seven steps:
Content analyze the target domain.
Decide the test length in terms of number of score points.
Content analyze each item in the population of items.
Calculate the alignment of each item to the target.
Select the most aligned item (if a tie, randomly select from among tied items 1 ) and adjust the target to account for content of the item.
Recalculate the alignment for each item.
Repeat Steps 5 and 6 until enough items have been selected to generate a test of the desired length.
For a desired allocation of test formats across item types (e.g., 10 multiple choice, 10 open response), the algorithm could be constrained such that, after it has selected 10 items of one type, that type could no longer be selected. In the trials that motivated us to build the algorithm, we limited student achievement tests to 18 multiple choice items and teacher content knowledge tests to 20 multiple choice items. Table 1 shows the alignment of each of the 12 tests to their targets. For the student achievement tests, alignment ranged from a low of 0.42 to a high of 0.70, with a median of 0.54. For the teacher content knowledge tests, the alignment ranged from a low of 0.32 to a high of 0.54, with a median of 0.41.
End of Unit Student and Teacher Achievement Test Alignments With Target Domains

Note. Alignment is the unadjusted alignment index of the assessment. Agree max is the maximum possible alignment assuming complete agreement among content analysts. Disagree max is the maximum possible alignment assuming complete disagreement among content analysts. Agree adjusted is the raw alignment index adjusted for the maximum alignment given complete agreement. Disagree adjusted is the raw alignment index adjusted for the maximum alignment given complete disagreement. ITM = Introduction to Matter; IRE = Inside the Restless Earth; EH = Earth History; WW = Weather and Water; DOL = Diversity of Life.
How Large Are These Alignment Indices?
The size of the alignment index is not only a function of how well the items in the population of items fit the target domain (i.e., a unit), but also of (a) the breadth of the target domain as reflected in the number of cells covered and (b) the number of items to be included in the test (Fulmer, 2011; Polikoff & Fulmer, in press). The broader the target and the fewer the items, the lower the maximum possible alignment. We include proof of these claims in the Appendix.
Given these facts, we sought to adjust the obtained alignment indices to calculate maximum possible alignment using simulations. Each simulation assumed four raters and three cells per item per rater, and that an infinite item pool was available that covered all the cells in the target in every possible combination. One simulation assumed complete rater agreement and the other complete rater disagreement. The two assumptions bound the maximum possible alignment given a target domain (e.g., unit) and a test length. The assumption of complete rater agreement is a lower bound, and the assumption of complete rater disagreement is an upper bound. Generalizability studies suggest that the maximum possible alignment typically lies closer to the lower bound (Porter et al., 2008). The simulation methods, which we describe in more detail in the Appendix, result in maximum alignment indices that can be used to adjust our raw alignment indices. For instance, if we obtained a raw alignment value of .5, but the maximum possible alignment was .8, then the adjusted alignment index is .5/.8 or .625.
Table 1 shows maximum possible alignments for each of our boundary assumptions. To illustrate, we interpreted these values for the Holt Cells and FOSS Earth History units. Given complete rater agreement, the maximum alignment of an 18-item test was .74 for the Cells curriculum and .80 for the Earth History curriculum. The maximum alignments of the 20-item teacher tests for Cells and Earth History were each .62. The alignment index adjusted for the maximum alignment (i.e., the raw value divided by the maximum value) for the Cells student achievement test was .70; for the Earth History assessment, .53. Adjusted alignment indices for the teacher knowledge tests were .52 for Cells and .61 for Earth History.
Under the assumptions of complete rater disagreement, the maximum alignment of an 18-item test was .89 for the Cells curriculum and .93 for the Earth History curriculum. The maximum alignment of the 20-item teacher tests to professional development for both the Cells and Earth History was .91. Again, given that the maximum for each of the targets is less than 1.0, the actual alignments are larger than the raw values imply. The alignment index adjusted for the maximum was .58 for the Cells student achievement test and .45 for the Earth History assessment. For the teacher tests, the adjusted alignments were .35 for Cells and .42 for Earth History.
Another way to judge the size of a test’s alignment to its target domain is normatively. Polikoff et al. (2011) investigated the degree of alignment between student achievement tests and state content standards in the NCLB era, when states were required to have student achievement tests aligned to their content standards and provide evidence of their alignment. That study found that for the nine states for which science alignment data were available, the average alignment was 0.26, with a range from 0.16 to 0.37. Clearly, the methods used to align those state science tests with their corresponding content standards are significantly less effective than our automated test construction algorithm. Of course, the six target units represent narrower targets than state grade-specific science standards. The end-of-unit tests were limited to 18 multiple-choice items, and so they were much shorter than state science tests.
Other Uses of the Test Construction Algorithm
In addition to using our algorithm to create highly aligned assessments, we used it to build subtests and to measure teacher knowledge.
Building subtests
In the same pair of randomized field trials we describe earlier, a research question asked about the combined effects of the three units on a state-administered science test. We hypothesized that the cognitive science and teacher content knowledge interventions might be sufficiently robust to show effects on the state science test; however, because the state science test was written against state science standards and the interventions included only three science units, such effects would certainly be small.
We obtained item-level student performance data on the state science test for each student participating in one or more of the Holt target units. While one analysis used student total score on the state science test as a dependent variable in our impact analysis, we also used the algorithm to construct subtests from the state test, one aligned to each of the three target units. For the subtests, however, we did not know the length in advance. As before, we content analyzed the state test items using the SEC framework. We ran the algorithm for tests of varying lengths, starting with one item and increasing to the full number of items on the state test. We examined how the subtest alignment to the target unit changed as a function of test length, and we chose the shortest length where adding more items did not further increase alignment of the subtest to the target unit.
The state science test had 64 items. Using the algorithm to build a subtest aligned to the Cells unit, alignment increased as subtest length increased from one item up to seven items and decreased thereafter. The alignment of the seven-item subtest for Cells was 0.25. For the Introduction to Matter unit (ITM), alignment increased to a subtest of eight items with alignment of 0.26. For the Inside the Restless Earth unit (IRE), alignment increased to a subtest of 10 items with alignment of 0.24. We allowed subtests to share common items; no items were common across all three subtests, but cells and IRE had two items in common, and IRE and ITM had five items in common.
Measuring teacher knowledge
A third use of the alignment algorithm is illustrated by how we constructed the teacher content knowledge tests for the units. This set of tasks involved two variants in the algorithm. The first variant was that there was no set of curriculum materials to content-analyze to define the target domain; rather, science content experts created and delivered professional development to improve teachers’ content knowledge for each unit. Instead of content-analyzing materials, we asked each of the four content professional development experts to complete the SEC survey, indicating what topics and levels of cognitive demand they included in their professional development. We used the results of these four surveys to define the target domain.
The second variant was motivated by the fact that the population of items was not strong enough to produce a reasonably aligned teacher content knowledge test. The content of the item pool can be represented graphically using something analogous to a topographical map, where topics represent the North/South dimension and cognitive demand represents the East/West dimension (Porter et al., 2007). The SEC data are nominal scale, but the graphs are nevertheless accurate at the intersection of a particular topic and a particular cognitive demand. Figure 1 shows two topographical maps, one for content in the Cells teacher content knowledge target domain and one for the content of the constructed teacher content knowledge assessment. Comparing the two graphs indicates where there is content in the domain that is not represented by the items, leading to less than perfect alignment. For example, several topics in the target domain contain the “communicate” cognitive demand, but no items on the constructed test contain that demand. Figure 1 also illustrates that because items may cover multiple cells, the algorithm can select items that are aligned to the target while also assessing content not in the target. This occurred with communicate organ systems, which is covered on the test but not in the target domain.
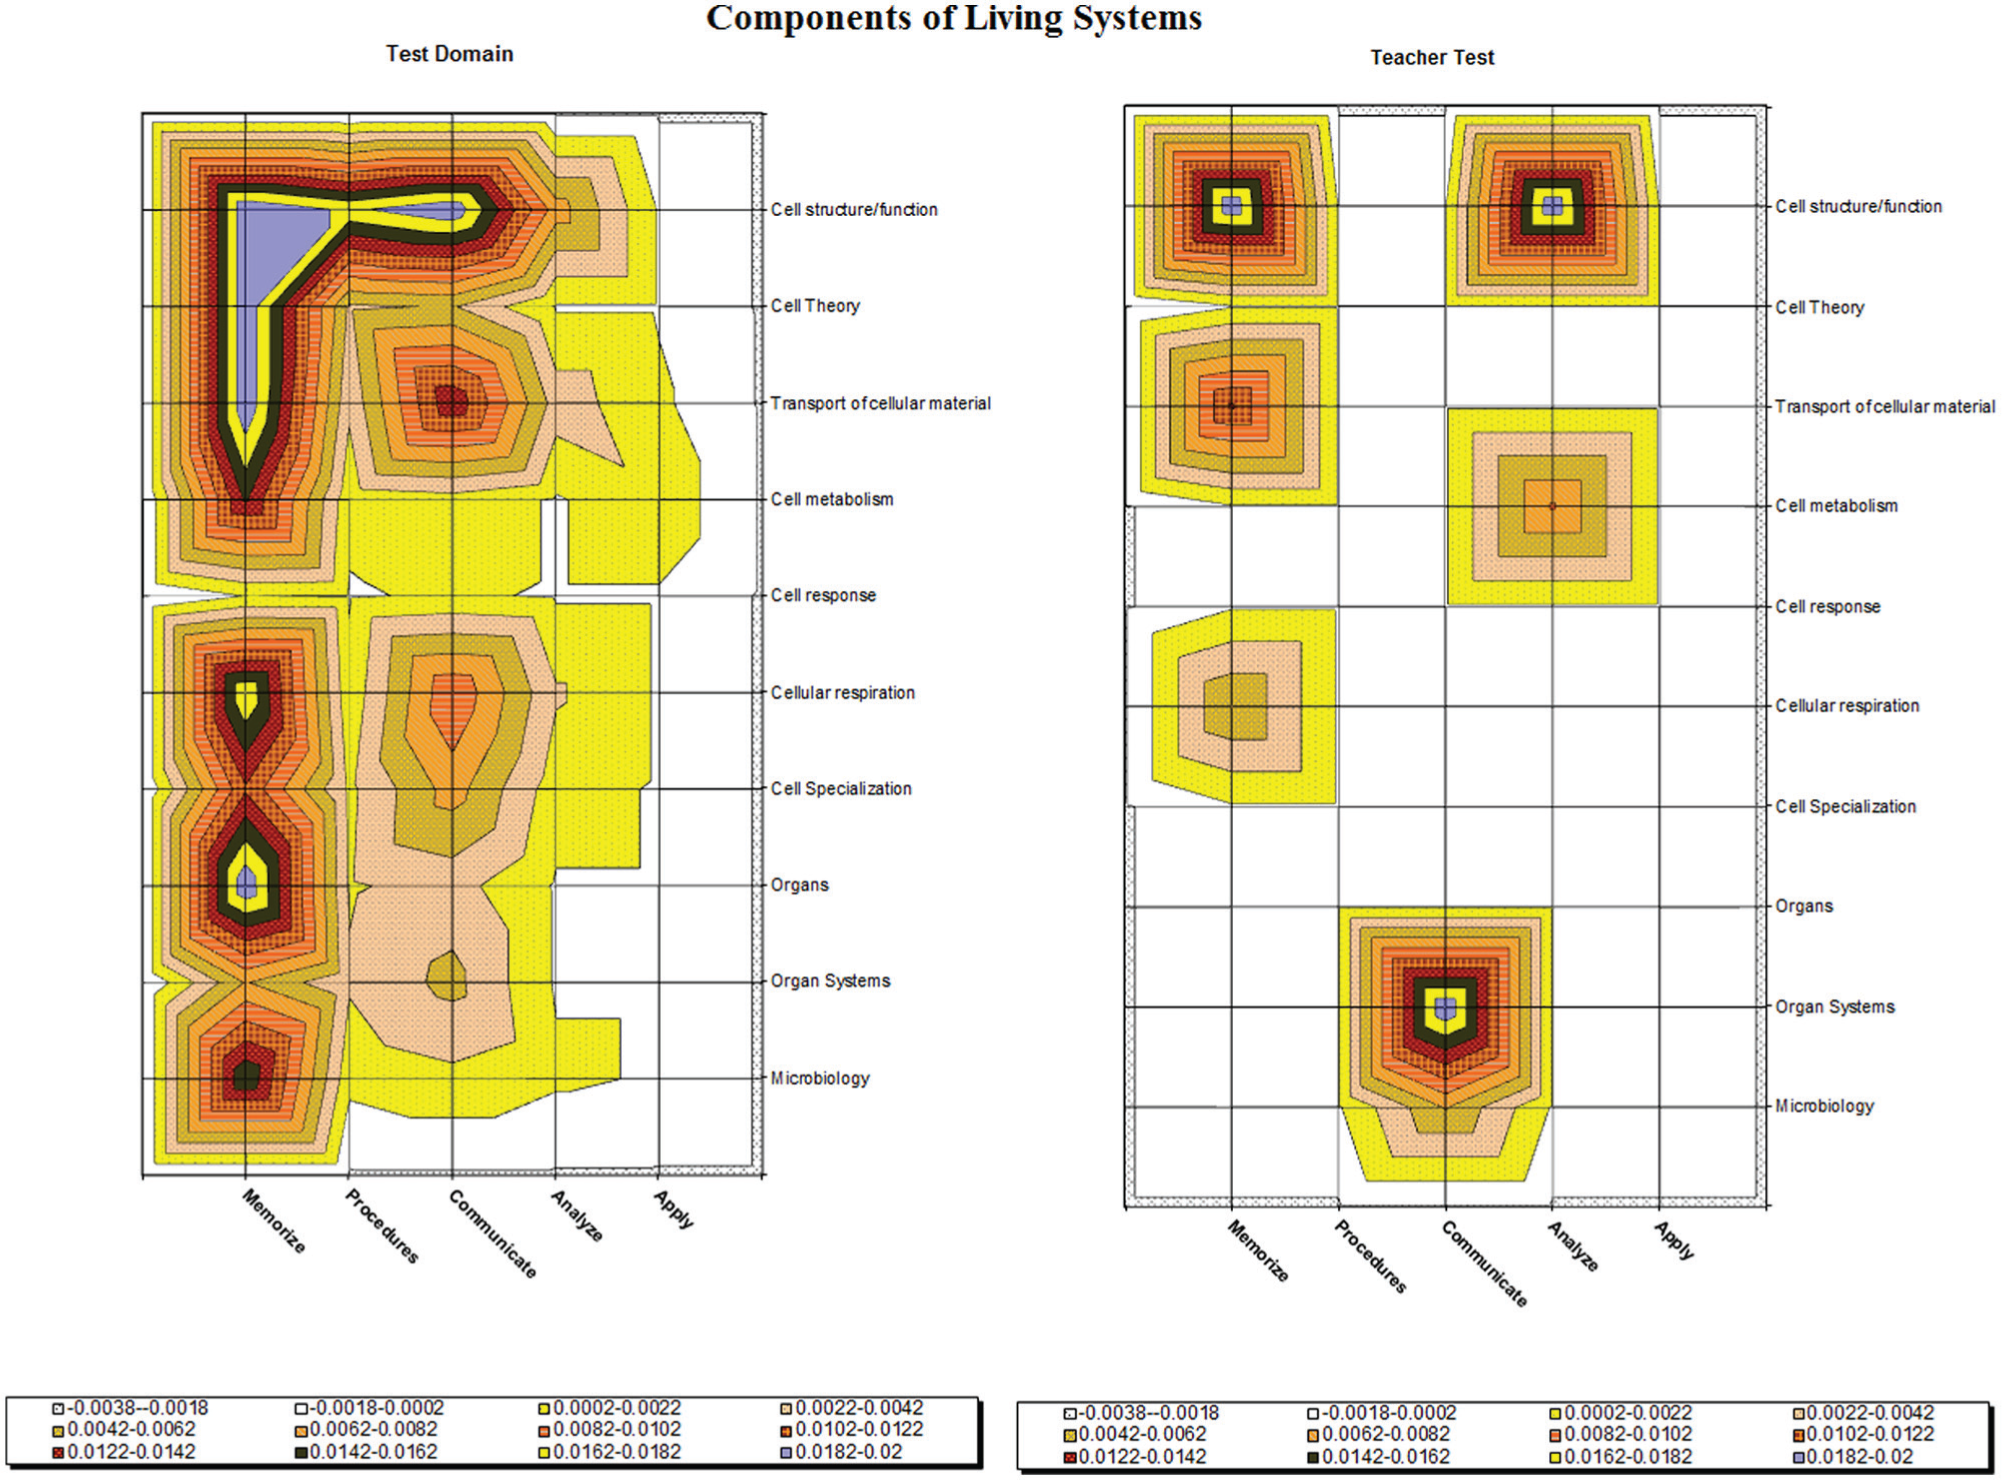
Topographical maps comparing the content of the target domain and the constructed teacher content knowledge test for the cells unit
To address the weak item pool available for the teacher test, we asked the four experts who designed and delivered the professional development to write items to fill identified content gaps. The new items were content-analyzed using SEC procedures to see whether the writers produced items in the correct cells. This proved to be a difficult task. Developers wrote 14 items for six targeted cells. Twelve of the 14 items were not placed in the target cell by any of the content analysts. The problem was matching cognitive demand levels, not topics. Our experience in guiding item writing provides yet another example of how important it is to build formal replicable consideration of alignment into the test construction process. Alignment does not happen easily.
Automated Test Construction
Our algorithm is computer programmed for automated test construction. Schmeiser and Welch (2006) attribute the first automated test construction to Theunissen (1985). According to Schmeiser and Welch (2006), automated test construction is “not intended to replace the role of test developers in the test-assembly process” (p. 335). They note that automated test assembly processes are limited by “(a) quality and size of the item bank, (b) reasonableness of the constraints and targets, and (c) degree to which the content and technical codes can be defined.” Although the first two limitations apply to our algorithm, the SEC procedures address the challenge of defining content and technical codes.
Most automated test construction work focuses on building tests of maximum reliability and/or multiple parallel forms (Armstrong, Jones, & Wang, 1994; Luecht, 1998). Our algorithm could be embedded in these techniques in a way that would combine alignment with other goals, such as reliability.
Discussion: Limitations and Possibilities
An algorithm is described for building much more content-valid-aligned student achievement tests than result from current test construction procedures. The algorithm is used in conjunction with test construction procedures that ensure reliability and lack of bias. The result is much better information on student achievement than is currently available. We illustrated the algorithm’s use for constructing student achievement tests and teacher content knowledge tests, for guiding item writing, and for creating aligned subtests from an existing test. This last use has considerable application in studies of education interventions, where one source of information on student achievement comes from state or district testing programs. For all of these applications, the degree of test alignment against a target domain is a function of breadth of content coverage in the target domain, quality of content coverage in the item pool, and test length.
Limitations of the Algorithm
One limitation is that the algorithm is based on the SEC conception of content defined at the intersection of topics and cognitive demand. The SEC content language has evolved over time and has been used successfully for a variety of purposes; nevertheless, the SEC topics may be insufficiently fine-grained, or perhaps too fine-grained, and the distinctions among cognitive demands may be insufficient to capture the distinctions needed. In particular, the SEC content conception does not capture learning progressions as described by Corcoran, Mosher, and Rogat (2009), or content structure as described by Webb (2006). Whether these are important content distinctions for purposes of content alignment remains to be seen.
A second limitation is that the utility of the algorithm depends on the quality of the target domain description and the quality of the content coverage of the items in the available pool; however, this limitation applies to any effort to build aligned assessments.
The alignment algorithm is also limited by its exclusive focus on content alignment. An achievement test needs to be more than content valid. The test must also be reliable, unbiased, and without floor and ceiling effects for the target testing population. This implies items that are clear and a test that is within the bounds of reasonable burden (AERA, APA, NCME, 1999). To the extent all items in the pool are of high quality based on field tests, the resulting aligned test built using the algorithm should not only have strong validity due to alignment but strong reliability as well.
Finally, the algorithm does not necessarily result in a maximally aligned test given the target domain, test length, and item pool. After an item is selected, the inclusion of the item in the test is not revisited as subsequent items are selected. The set of items that work maximally well together for the alignment criterion could be different and yield an even more aligned test (Guyon & Elisseeff, 2003; Temlyakov, 2011). Still, the tests resulting from application of the algorithm are more aligned to the target domain than almost all student achievement tests reported in the literature.
Possibilities of the Algorithm
Our algorithm could make several important contributions to test construction and to educational research. For one, with appropriate training, these procedures might guide item writing for achievement tests to make alignment a forethought of test construction. Currently, professional item writers construct achievement tests to meet test specifications. Only after the test is developed and, often, already in use does anyone use an alignment procedure to see whether the test is aligned to the target content standards. At that point, it’s usually too late; the test already exists. A better method would be to use the criteria of alignment to guide item writing.
Another contribution may be in constructing parallel forms of a test. Each test is a sample of items from a population of items, and parallel forms are to be representative samples from the same population of items. Where two parallel forms are desired, enough items for two forms might be selected from the population of items by the algorithm, and items might be randomly assigned to forms. Where forms are written over time, they need to be equated. Ideally, an infinite number of parallel forms would in aggregate be perfectly aligned to the target. The alignment algorithm could guide this process.
A third contribution is that the algorithm is easily programmed, making test construction automatic. The procedure is versatile, applicable in a variety of contexts for various target domains and various item populations and formats.
With the alignment algorithm for automated test construction, future work can focus on improving the quality of the definition of target domains. For example, CCSS writers can focus on making their content standards clearer, and the testing consortia can focus on making their tests more aligned to the CCSS. Similarly, with the algorithm, work can proceed on writing better pools of items from which to construct tests. With better-defined target domains and higher quality item pools, we can do a much better job constructing tests that are closely aligned to content. This should yield more content-valid and instructionally sensitive tests (Polikoff, 2010). Finally, future work may allow for a more complete automated test construction algorithm—one that formally incorporates the goals of reliability and fairness with content alignment.
Footnotes
Appendix
When the 211 fine-grained topics are crossed with the five categories of cognitive demand, 1,055 content distinctions are made in the language to describe K–12 science content.
In simulations that we used to calculate maximum alignment, we relaxed the highly constraining assumptions in the preceding proof. Each of our two simulations assumed that an infinite item pool was available that covered all the cells in the target in every possible combination, given four content analysts who each placed each item in three cells. One simulation assumed complete rater agreement and the other complete rater disagreement. The two assumptions bound the maximum possible alignment given a target domain and a test length; the assumption of complete rater agreement is a lower bound, while complete rater disagreement is an upper bound.
Item weights per cell were calculated to be 1 over the number of items on the test times the maximum number of cells an item could be placed into. For our six student achievement tests, there were 18 items, four raters, and three cells each rater could assign to an item. Assuming complete rater disagreement, the item weight per cell is 1/216 [18 items * 4 raters * 3 cells per rater]. For complete rater agreement, the minimum item weight per cell is 1/54 [18 items * 3 cells per rater]. Assuming complete agreement removes the dependency of the alignment on the number of raters.
Our simulations took the content matrix for a target domain and sorted the cells by the size of their proportions. The cell with the largest proportion was “selected” for the test, and the content matrix describing the target was re-centered by subtracting the minimum item weight (1/216 for no agreement, 1/54 for complete agreement) from the chosen target cell. If the largest cell proportion was smaller than the minimum item weight (e.g., a cell proportion of 0.01 in the case of complete agreement), the cell proportion was reduced to 0 and the procedure continued. The target domain cell proportions were re-sorted and the cell with the new largest proportion was selected. This process was repeated until 18 simulated items (20 for teacher tests) had been selected. The alignment index for the constructed tests is algebraically equivalent to the sum of the weights subtracted from the target (i.e., total coverage of the target provided by the items).