



Abstract
What is “teaching to the test,” and can one detect evidence of this practice in state test scores? This paper unpacks this concept and empirically investigates one variant of it by analyzing test item–level data from three states’ mathematics and reading tests. We show that NCLB-era state tests predictably emphasized some state standards while consistently excluding others; a small number of standards typically accounted for a substantial fraction of test points. We find that students performed better on items testing frequently assessed standards—those that composed a larger fraction of the state test in prior years—which suggests that teachers targeted their instruction towards these predictably tested skills. We conclude by describing general principles that should guide high-stakes test construction if a policy goal is to ensure that test score gains accurately represent gains in student learning.
Keywords
How policymakers measure and track student learning is one of the most important, and most difficult, issues in American education policy. Since the implementation of the No Child Left Behind Act (NCLB), states have administered annual standardized tests in Grades 3 through 8 measuring proficiency in state standards. State test scores used for accountability purposes have increased dramatically across the country in the past decade (Center on Education Policy [CEP], 2008a, 2009), which some actors take as evidence of increased student learning. However, other studies conclude that gains on state tests have significantly outpaced progress on the National Assessment of Educational Progress (CEP, 2008a; Fuller, Wright, Gesicki, & Kang, 2007; Ho, 2008; Lee, 2007) and have not been mirrored in other international assessments of American students’ progress (Fleishman, Hopstock, Pelczar, & Shelley, 2010). 1 As a result, many have charged that test-specific instruction—often referred to as “teaching to the test”—has led to score inflation on state tests, where score inflation is defined as gains in student test scores larger than gains in student learning in the domain to which the test intends to generalize.
Despite the ongoing public debate about the meaning of state test score gains under NCLB, no study has attempted to quantify the extent to which NCLB-era state tests had features that enabled teaching to the test. Nor have previous papers attempted to clarify the concept of teaching to the test, and this term currently is used to describe a wide range of instructional practices. This paper aims to refine the concept of teaching to the test and to investigate one variant of this practice by analyzing the content of and test item–level data from New York, Texas, and Massachusetts’ mathematics and English language arts (ELA) tests. Our study is one of the first to empirically test for a specific opportunity for teaching to the test in NCLB-era tests—predictability—and to estimate whether predictability is associated with improved performance on these items. 2
A Taxonomy of Teaching to the Test
Teaching to the test is best understood as a spectrum of instructional practices rather than as the dichotomy typically used to describe it (i.e., teachers are or are not teaching to the test). Building on Holcombe, Jennings, and Koretz (2013), we describe four different types of teaching to the test that have been discussed in the literature and discuss their costs and benefits.
Two kinds of consequences are of interest in evaluating the normative implications of practices falling under the rubric of teaching to the test. The first are consequences for the inferences we can make based on test scores (validity consequences). The second are consequences for the quality of students’ educational experience (experiential consequences). The experiential costs and benefits of teaching to the test must be assessed against the counterfactual of what would be happening in a given classroom in the absence of the pressures associated with the state test. As a result, teaching to the test has different costs and benefits across different classrooms and schools. It is in those classrooms where the counterfactual educational experience is rich and of high quality that teaching to the test potentially has the largest negative impacts. If we are concerned with the experiential consequences of teaching to the test, any of the four types described below could be evaluated positively or negatively, depending on the counterfactual context. Because the validity consequences of teaching to the test can be more universally described, our discussion below focuses on these issues.
Teaching Test-Taking Skills Specific to the Test Form
Many studies find increases in instructional time spent specifically on test preparation in high-stakes contexts (Jones et al., 1999; Pedulla et al., 2003). For example, Koretz et al. (Koretz, Barron, Mitchell, & Stecher, 1996; Koretz, Mitchell, Barron, & Keith, 1996) surveyed teachers in Kentucky and Maryland and found that teachers attributed test score gains in their schools to increased familiarity with the test and the use of practice tests and preparation materials rather than to general improvements in skills. The best example of test-taking skills specific to the test form may be “teaching to the rubric,” in which students are instructed to include specific phrases or structures in their responses to receive full credit (Stecher & Mitchell, 1995).
Teaching students test-taking skills that are specific to a test form (as opposed to general strategies for taking multiple choice tests, for example) may allow students to more accurately demonstrate their knowledge of the tested skills and content. This could increase the predictive validity of students’ scores by minimizing the impact of test-specific idiosyncrasies not associated with students’ mastery of the content. On the other hand, the case of teaching to the rubric raised above suggests that some forms of test-specific instruction may also inflate scores. For example, if students are given 1 of 4 points in a writing rubric for restating the question even if they write nothing else, test-specific coaching would overstate their mastery of this domain.
While the approach to teaching to the test described above can be used broadly, other types of teaching to the test rely on multiple stages of content-based narrowing from the domain of interest. This progression is represented in Figure 1 and discussed in more detail below.

Description of content-based forms of teaching to the test
I. Reallocating both between and within subjects to align instruction with state standards
The validity consequences of instructional time reallocation both within and between subjects depend on the domain to which one wants to make an inference. Consider the following example: Teachers may not have covered a given skill before new standards were adopted but incorporate it into the curriculum because of its presence in the state standards. The cost of doing so is the omission of another skill not included in the standards. If tests are aligned with standards, it is possible to make valid inferences about students’ knowledge of the state standards based on the test, but these inferences may not generalize to a broader body of knowledge not included in the standards. They also may not represent losses in other untested areas. The distinction here is whether one wants to make the statement “Students are learning more” as opposed to “Students have a greater mastery of the state standards.” The former makes an inference about students’ education as a whole, but this inference may be compromised if alignment-induced improvements came at the expense of other untested content.
The normative implications of alignment continue to be debated. One perspective on alignment holds that if standards represent skills that we want students to learn and tests are aligned with these standards, alignment-based increases in scores are a positive outcome, and declines in performance on tests less aligned with these standards are of little importance. A competing view, however, is that “alignment of instruction with the test is likely to produce incomplete alignment of instruction with the standards, even if the test is aligned with the standards. . . . Despite its benefits, alignment is not a guarantee of validity under high-stakes conditions” (Koretz, 2005, p. 112). In theory, the issues raised by Koretz (2005) could be addressed if states were willing to fully articulate the domain of skills that we care about and devote unlimited testing time and resources toward fully sampling the domain and a variety of representations of these skills. The experience of testing under No Child Left Behind, however, has been that tests have not been aligned with state standards (Hamilton & Stecher, 2006), often leading educators to align with the tests as opposed to with the standards. We discuss this issue in more detail in the next section.
II. Emphasizing the specific standards predictably represented on state tests
Whether teaching to the standards and teaching to the test describe the same action depends on the frequency in which different standards are represented on the test. Focusing on “highly assessed standards” may inflate test scores, and this depends on the relevance of each standard to the inference one wants to make from state test scores. For example, state policymakers may believe that some standards are more important than others and thus explicitly build such guidance into their instructions to test designers. Although testing contractors are sometimes given guidance about the weight to be given to content strands, we were able to locate no evidence that the education departments in these states provided guidance about weights assigned to specific standards. If state tests are not designed with specific inference weights in mind, state test results can become inflated when a small fraction of state standards is predictably tested over time and teachers may narrow their instruction to focus on these standards (Koretz, 2003). As a result of this kind of teaching to the test, it is difficult to make inferences about students’ proficiency in the larger domain—the state standards—that the tests are intended to capture, as students appear to have made more academic progress than they truly have.
Multiple studies suggest that teachers are aware of the mismatch between state standards and state tests and show that teachers focus on frequently tested content, excluding material that is tested less often. For example, in a RAND survey of teachers in California, Pennsylvania, and Georgia, teachers reported that there were many standards to be tested, so teachers had identified “highly assessed standards” on which to focus their attention (Hamilton & Stecher, 2006).
III. Teaching skills following the same formats in which items appear on state tests
In addition to predictably including certain standards, state tests may predictably represent these standards in test items themselves. In some cases, representations are so similar that test items are essentially clones of those used in earlier years. This offers opportunities for educators to teach skills in ways that may improve their performance on an item without improving their understanding of a skill or concept.
In some cases, such an approach is described as best practice. Books on “data-driven decision making” for educators recommend alignment not only with standards but with specific format features of the tests. This is distinct from the idea of teaching test-taking skills specific to the test form noted above, because it extends beyond test-taking skills to modify the ways in which specific content is introduced and taught. For example, as Bambrick-Santoyo (2010) wrote in a widely used book, Driven by Data, “standards are meaningless until you define how you will assess them…instead of standards defining the sort of assessments used, the assessments used define the standard that will be reached” (p. 7). He goes on to provide specific guidance to educators on this issue:
Once the specific sorts of questions that are employed by the end-goal test are noted, schools should work to create or select interim assessments that are aligned to the specific demands of the end-goal examination. This alignment should not be limited to content but should also follow the format, length and any other replicable characteristic of the end-goal test. (Bambrick-Santoyo, 2010, p. 16)
Such a practice is problematic from a validity perspective, as varying the format sometimes reveals that students do not fully understand a given concept. A useful example reported in Shepard’s (1988) study was a set of questions involving adding and subtracting decimals. When presented in a vertical format like the state test, 86% of students answered these questions correctly, but in a horizontal format, only 46% of students did.
To the extent that students learn how to correctly answer questions when they are presented in a specific format but struggle with the same skills when they are presented in a different format, teaching to the format invalidates inferences from test scores to the larger knowledge domain.
Data and Methods
We determine how representative state tests are of their state standards and to what extent students perform better on predictably sampled content by analyzing item-level data sets for math and ELA exams administered in three states over the period 2003 to 2009. We compiled data from New York’s Grades 3 through 8 exams in ELA and mathematics for 2006 through 2009, from the Texas Assessment of Knowledge and Skills Grades 3 through 8 ELA and math exams from 2003 through 2009, and from the Massachusetts Comprehensive Assessment System ELA and math exams for Grades 3 through 8 and 10 from 2003 through 2009. 3 We chose these states because they publicly reported item-level data in the years since NCLB was implemented.
By item level, we mean that our data sets contain an observation for each test question on the exams, including the percentage of students who answered the question correctly, the format of the question, and the specific standard that the item assesses (as reported by the state). 4 These data sets allow us to compare the full standards defined by the states with the standards actually assessed by the exams and to track students’ performance on different types of items. Our data sets include 680, 1,791, and 1,452 ELA item-year observations in New York, Texas, and Massachusetts, respectively, and 920, 1,890, and 1,406 item-year observations in math.
Our analysis proceeds in three stages. We first describe how comprehensively state tests sample from the state standards and illustrate the degree to which test content is predictable from year to year.
Second, we estimate models to determine whether students perform better on items testing predictably assessed standards. We estimate a three-level hierarchical model separately for each state and subject, where items are nested within school grades (Level 2) and years (Level 3). The dependent variable in these models is the percentage of students in the state answering each item correctly. We applied a logit transformation to this variable because the distribution was skewed to the left (i.e., for most items, a majority of students answered the item correctly). 5
The coefficient of interest is the frequency with which the standard was assessed on the prior year’s exam. In other words, if an item on the 2009 test is based on the standard assessing adding and subtracting 3-digit numbers, the frequency-of-standard variable is equal to the percentage of all question points on the 2008 test that assessed this skill. For example, if this skill were tested in, say, two questions on the prior year’s exam, and these questions were worth 5 points together, and a perfect score on the prior year’s exam was 35 points, the frequency variable would be equal to 5/35*100, or 14 percentage points. Our models also adjust for the question format, for example, multiple choice, in which students choose from a finite set of responses; short answer, in which students must write the answer; and extended response, in which students must describe the steps taken to arrive at an answer. We also control for the strand of ELA (i.e., reading comprehension, listening, or writing) or mathematics (i.e., algebra or geometry). We estimated models without these strand controls and found qualitatively similar results.
We estimate an additional set of models to determine how robust our results are to alternate specifications. We report effect sizes of prior-year frequency in standardized units, which lets us compare results from models that do and do not logistically transform the outcome (the percentage of students who correctly answer an item). First, we compute the proportion of students who would answer an item correctly were the standard that the item assesses not assessed in the prior year’s exam. Second, we compute the proportion of students who would answer an item correctly were the standard assessed in 10% of the prior year’s test, weighting items by the percentage of points each item was worth. Third, we subtract the former from the latter. Finally, we divide this by the standard deviation of the item scores across all years (each item’s score is the proportion of students who answered the item correctly). We repeat this procedure for each of the six tests. We then reestimate the models but without applying the logistic transformation to the item scores and repeat the above.
Finally, we perform a series of sensitivity tests to evaluate whether the effects we find come from the predictability of the items or from another source, such as item difficulty. It could be the case, for example, that we observe a positive relationship between prior-year frequency and the percentage of students answering an item correctly because highly assessed standards or items are inherently less difficult. If predictability is the driver of this effect, we should see that the frequency of standards in current or future years has no effect on performance in the first year the tests are administered. Although it is likely too strong an assumption that educators and test takers have no information in the first year—after all, tests existed previously in each state and were not thrown out wholesale—we nonetheless expect to see a weaker relationship between standard frequency and student performance in the base year.
Specifically, we estimate the same models in the base year in each state (removing the third level of the model for year). The variable of interest in this model is the percentage of points a standard accounts for at present or in the future. If students are not more likely to perform well in the base year on standards highly assessed in the future, we can infer that difficulty is not the primary driver of this effect.
Results
Table 1 provides an overview of standard coverage across states, averaging across grades. Students in New York are expected to learn a larger number of discretely defined skills, but these numbers mask the difference in scope between standards across states. In the appendix (available on the journal website), we discuss this point in more detail and provide comparisons across states by cross-mapping the standards. For our purposes here, we emphasize that our vantage point is from a teacher facing an accountability system in her or his state and deciding whether to focus on standards that consistently make up a large fraction of the tests, not on determining which state covered more content.
Description of Standard Coverage in New York (NY), Texas (TX), and Massachusetts (MA) by Subject and Grade, 2006 to 2009
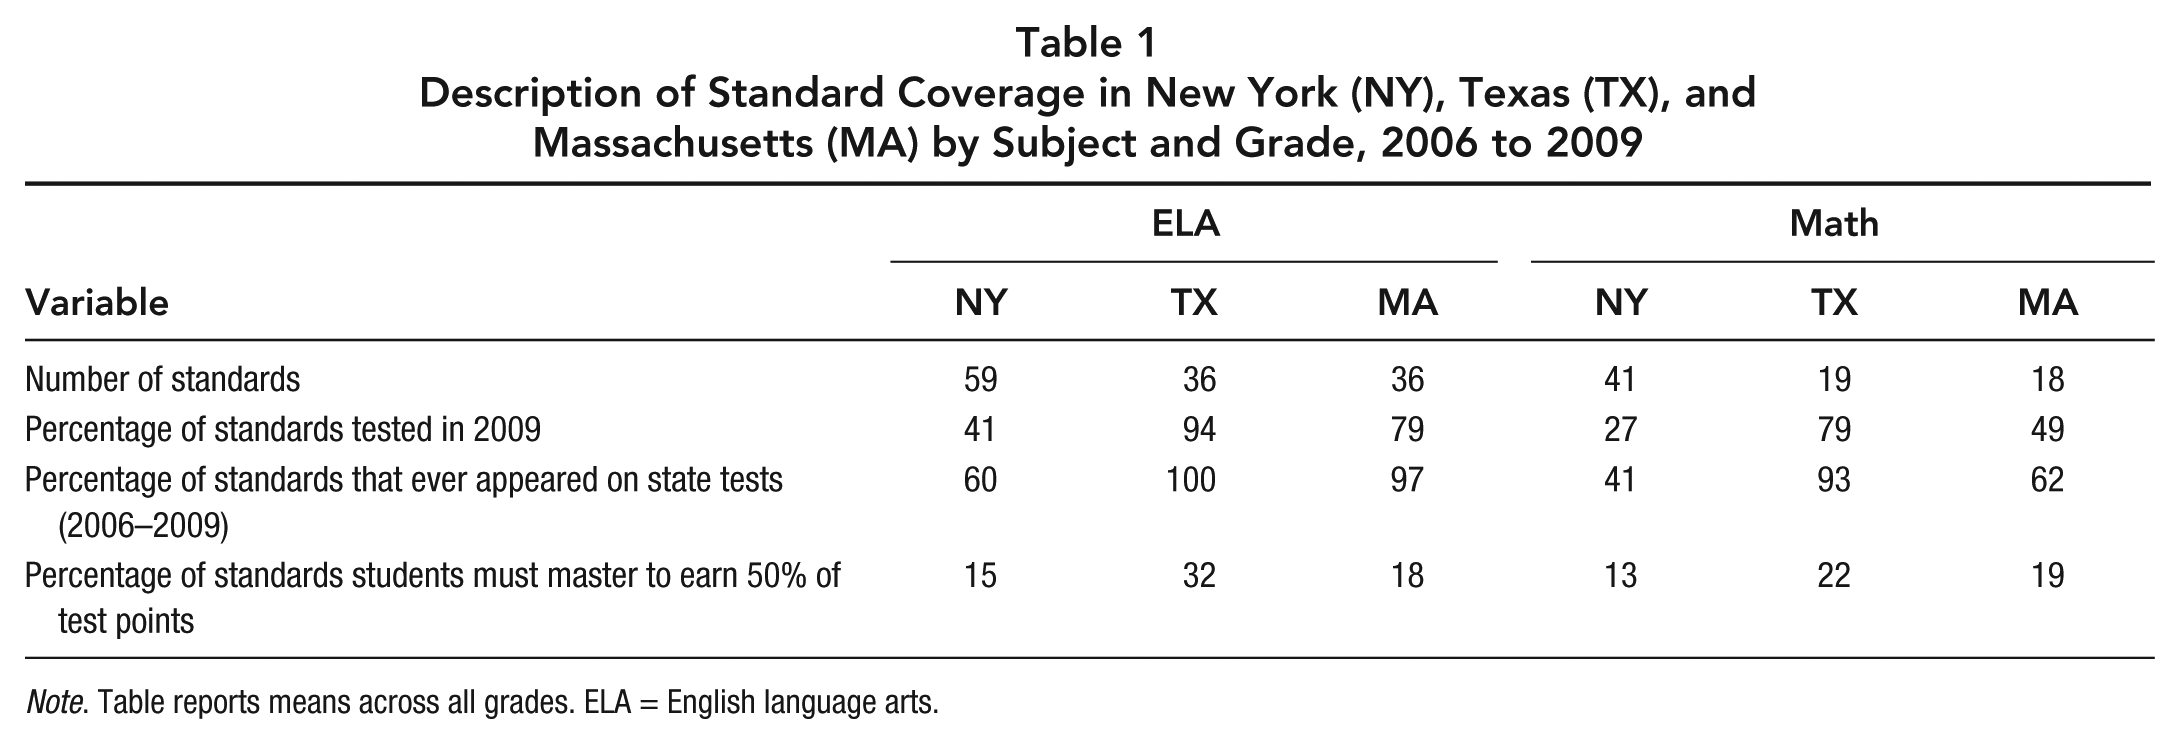
Note. Table reports means across all grades. ELA = English language arts.
Looking at the percentage of standards that were tested in 2009, New York, Texas, and Massachusetts test 41%, 94%, and 79% of their ELA standards, respectively. The parallel numbers for math are 27%, 79%, and 49%. That only a fraction of the state curriculum is tested in any given year does not itself facilitate score inflation. So long as different state standards are integrated each year and educators cannot predict which standards are likely to compose large fractions of the test, they will be more likely to cover the full standards. For example, if the tests were based on a random sample of the standards each year, there would be no incentive to focus on a limited fraction of the standards.
Observing the percentage of each state’s standards that were actually assessed on the exams over a 4-year period, Table 1 shows that around 60%, 100%, and 97% of the New York, Texas, and Massachusetts ELA standards, respectively, were ever examined. The parallel figures are 41%, 93%, and 62%, for math. In both Texas and Massachusetts, larger portions of the math and language arts exams were assessed in the same 4-year period than in New York. Texas assessed every single standard in its mathematics curriculum over 4 years. 6 Massachusetts did nearly the same with its math exams, as did Texas with its English exams. What these figures suggest is that across states, educators’ incentives to omit content entirely from students’ instruction differ. In New York and for ELA in Massachusetts, some state standards can be consistently ignored, whereas this is not the case in Texas and in Massachusetts for math.
Regardless of whether all standards were assessed over time, a relatively modest number of standards predictably compose a large portion of test points.
To provide a cross-state comparison, we mapped standards across states, as we describe in more detail in the appendix (available on the journal website), and then calculated how many standards students must master to earn 50% of test points. Figure 2 represents the extent to which a small number of standards make up a larger fraction of test points. We found that the four most highly assessed standards account for over half of all test points between 2006 and 2009 in New York, whereas 2 to 3 times as many standards fill a similar portion of the exams in Massachusetts (8 standards) and Texas (12 standards), respectively. In Texas, the distribution is closest to uniform, such that high-frequency standards are worth a smaller fraction of points. In contrast, New York favors a much narrower range of content relative to Massachusetts or Texas.

Distribution of standards across exams, math
That certain standards consistently compose a higher fraction of both tests in New York and Massachusetts and of the ELA test in Texas suggests that interested parties—whether educators, consultants, students, or so on—who can access item maps (i.e., documents that link test questions to standards) and prior years’ tests on the state websites can easily figure out which standards are more likely to be tested. The exception is the Texas math tests; most standards are tested each year and standards generally composed the same percentage of the test. This does not rule out other forms of curricular narrowing, such as eliminating other mathematics skills that are not in the standards (Holcombe et al., 2013); teaching specific representations of these skills, also known as “teaching to the format” (Darling-Hammond & Wise, 1985; Shepard, 2010; Shepard & Dougherty, 1991; Smith & Rottenberg, 1991; McNeil, 2000; Pedulla et al., 2003); or deemphasizing untested subjects, like science and social studies (CEP, 2008b). However, it does suggest that educators have strong incentives to cover the full set of mathematics standards in Texas, unlike in New York and Massachusetts.
To summarize, there are two ways educators can respond to predictable patterns in state tests to increase the number of students reaching the proficiency threshold. The first is to entirely omit content that is never tested on the state tests. The second is to focus on content that predictably composes a large fraction of the state test. Whether educators respond to these incentives by targeting their instruction is an empirical question. Based on our analyses thus far, we expect that students will perform better on standards testing predictable content: the math and ELA exams in New York and Massachusetts and the ELA exam in Texas.
Table 2 reports the results of hierarchical models predicting the logit (percentage of students answering each item correctly) on the New York, Texas, and Massachusetts high-stakes mathematics and ELA exams. Our variable of interest is the fraction of points the same standard was worth on the prior year’s exam. This variable equals zero if the standard was not assessed in the prior year. These models show that students perform better on standards that made up a higher fraction of state tests in previous years in all cases but Texas math. Given that Texas samples its math standards much more evenly, this is the result that we would expect if teachers were responding strategically to the structure of the state test. These findings suggest that when the content of a high-stakes exam is predictable, educators will target their classroom instruction to standards that compose a larger fraction of the exams.
Hierarchical Linear Models Predicting Logit (Percentage of Students Answering Item Correctly)

Note. Controls for item type and strand. Standard errors are in parentheses. ELA = English language arts.
Standardized effect size is the difference in the predicted proportion of students answering an item correctly, comparing an item whose standard was not assessed in the prior year’s test with an item whose standard accounted for 10% of the prior year’s points, divided by the standard deviation across all years, controlling for item type and strand.
p < .10. *p < .05. **p < .01. ***p < .001 (two-tailed tests).
To provide additional perspective on the practical significance of these results beyond coefficients alone, Table 2 also reports standardized effect sizes. These are the difference in the predicted proportion of students answering an item correctly, comparing an item whose standard was not assessed in the prior year’s test with an item whose standard accounted for 10% of the prior year’s points, divided by the standard deviation across all years, holding item type and strand at their means. These show that a question that assesses a standard not assessed in the prior year will result in lower scores than a question that assesses a standard that accounted for 10% of points on the prior year’s test by .164, .175, and .078 standard deviations in the New York, Texas, and Massachusetts language arts exams, respectively, and by .329 and .189 standard deviations in the New York and Massachusetts mathematics exams, respectively.
We further reestimated our models to test whether they were sensitive to alternative specifications. First, we replace prior-year frequency in our models with all prior-years frequency. In Texas and Massachusetts, we find a positive and statistically significant relationship for standard frequency in ELA and a marginally significant effect in New York for ELA and in Massachusetts for math (as shown in Table 2). Second, we estimated the models without controlling for content area. Third, we respecified frequency by the fraction of questions as opposed to the fraction of points (both with and without controlling for content area). Fourth, we reestimated our models without logistically transforming the percentage of students answering each question correctly. In all cases, our estimates produced similar results. Overall, these models confirm our expectation that students will perform better on items testing standards that compose a larger fraction of last year’s state test.
Finally, to determine whether frequently assessed items are easier to begin with, or whether improved performance on these items is a function of predictability, we perform a series of falsification tests. These results are reported in Table 3. In the base year of the new tests (2006 in New York and Massachusetts and 2003 in Texas), future standard frequency—or standard frequency in the same year—should be unassociated (or at least more weakly associated) with student outcomes. We view this as a strong test, however, as in all three states, previous exams existed and it is unlikely that those exams provided no insight into the content of the new exams. On the other hand, working against finding a relationship here is that these are not highly powered tests; that is, we are estimating these models on a relatively small number of observations.
Sensitivity Tests: Hierarchical Linear Models Predicting English Language Arts (ELA) and Math Logit (Percentage of Students Answering Item Correctly), Base Year of Test Administration
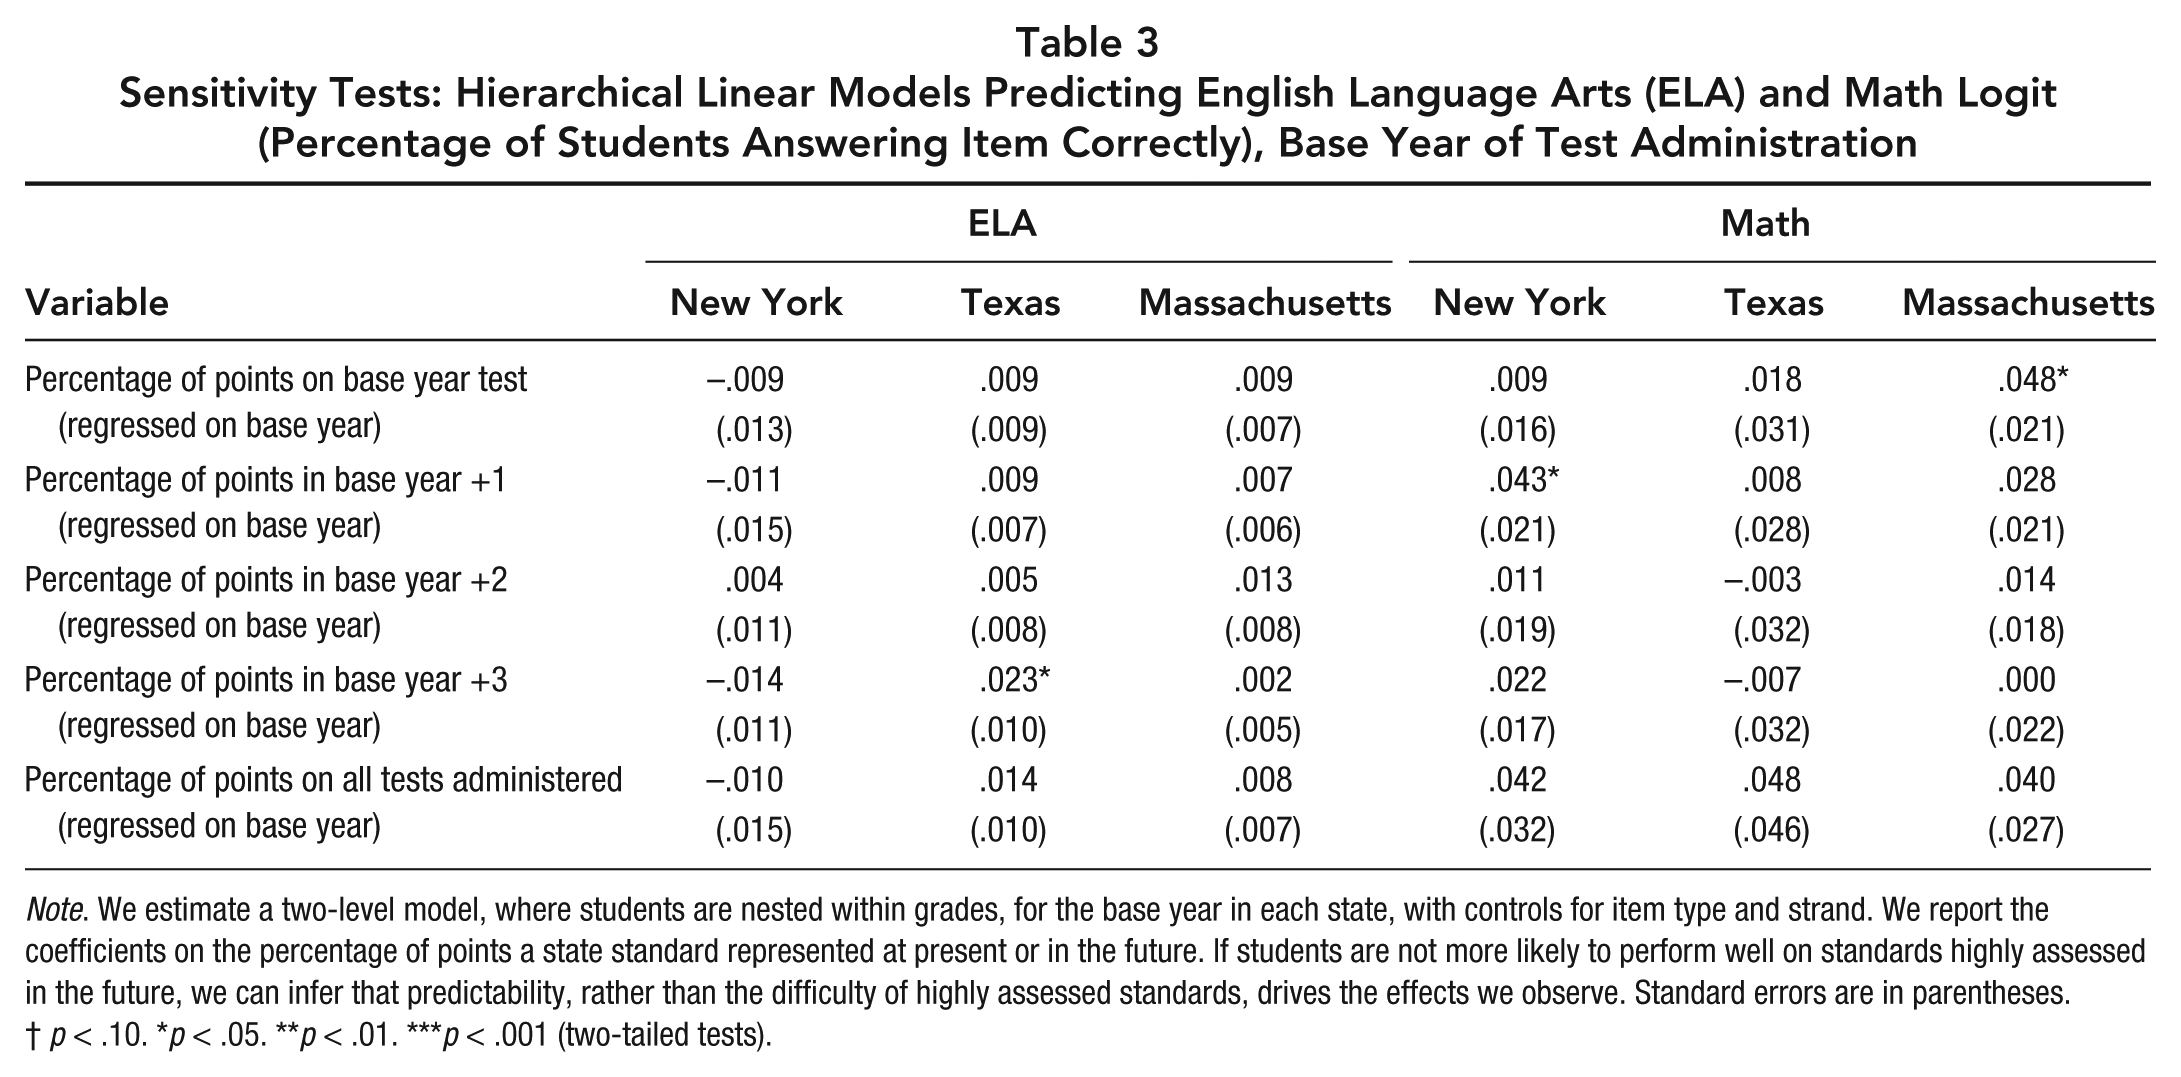
Note. We estimate a two-level model, where students are nested within grades, for the base year in each state, with controls for item type and strand. We report the coefficients on the percentage of points a state standard represented at present or in the future. If students are not more likely to perform well on standards highly assessed in the future, we can infer that predictability, rather than the difficulty of highly assessed standards, drives the effects we observe. Standard errors are in parentheses.
p < .10. *p < .05. **p < .01. ***p < .001 (two-tailed tests).
Table 3 presents five models for each subject. The first model regresses base year performance on the frequency of standards in the base year. If test designers intentionally make highly assessed standards less difficult, students should perform better on these items in the base year. We then estimate three models asking whether future standard frequency can predict performance in the base year. In three further falsification tests, we estimate models regressing base-year performance on frequency at base year plus 1, 2, and 3 years as well as the cumulative frequency. Twenty-seven of the 30 tests in Table 3 suggest no relationship between future frequency and earlier performance. In three cases—Texas ELA base year plus 3 years, New York math base year plus 2 years, and Massachusetts math base year—we find positive and statistically significant relationships with prior performance. Because all other tests in each of these states do not suggest a relationship between future frequency and base-year performance, we conclude that difficulty is unlikely to be driving the effect that we observe.
Finally, we address two additional issues of interpretation with respect to our finding that students perform better on high-frequency items. Perhaps it is the case that the highest-frequency standards are more important than those that are infrequently tested. We offer two pieces of evidence that suggest that this is not the driver of our finding. First, we note that in our sensitivity tests, students generally did not perform better on high-frequency standards in the base year, suggesting that if these standards were quite clearly the most important (or the most simple), students would also have performed better on these standards in that year. Second, none of the states provided guidance to the testing contractor about weights at the level of individual standards; these decisions were left to the testing contractors, suggesting that state departments of education did not have formally expressed inference weights for individual standards.
Discussion
In this study, we demonstrate that the design of state tests used to hold schools accountable under NCLB created incentives for teachers to perform one variant of teaching to the test: focusing on predictably tested content. By analyzing test item–level data over this time period, we establish that students performed better on items testing frequently assessed standards in both ELA and math—standards that composed a larger fraction of the state test in prior years—suggesting that state test results may have overstated students’ mastery of the state standards the tests are meant to assess. Our study is the only one of which we are aware that identifies and tests for a specific mechanism of teaching to the test in multiple states during the NCLB era. Although it is beyond the scope of this study to determine whether this practice has positive, negative, or no effects on students’ short- or long-term outcomes or their educational experiences, our findings suggest that test scores from these three states may not adequately capture students’ mastery of the state standards. This complicates test score users’ ability to make inferences from these scores to the overall domain in which policymakers are interested.
We emphasize, however, that we have identified just one of many mechanisms of teaching to the test. Many others must be attended to as well if the goal is to make inferences from students’ test performance to their overall achievement. For example, how broadly standards are framed can affect the knowledge domain about which one can make inferences. Students can improve substantially on a small set of skills encompassed in the standards without improving their mathematics knowledge more generally. By the same token, even if test items are randomly drawn from the standards, predictable representations of skills can still result in score inflation if students do not fully master the concept as a result. Just as educators are aware of the predictable recurrences of standards, they likely also attend to how questions are presented. We believe that future studies should explicitly investigate the variants of teaching to the test reviewed earlier in this paper, since our study isolates only one of many approaches.
The policy implications of our findings are complex. In general, they point to the fundamental tension in the current uses of test scores as both an incentive for improvement and a measurement of student progress. Recent papers have pointed out that these goals are at odds with each other because the actions that educators take to respond to the incentive to improve scores, such as focusing on predictably assessed content, invalidate the inferences that one can make from these scores (Koretz, 2013; Neal, 2013). These scholars have argued that psychometric test design practices need to be revised and adapted to a high-stakes context (Koretz, 2013) or that the incentive and measurement functions need to be split into two assessments that have different design features (Neal, 2013).
Although this larger problem looms in the background, assessments are now being developed for the Common Core standards. If the goal of standardized testing is to make inferences about students’ overall mastery of the standards, our results suggest a few design principles that may minimize test-specific instruction that does not generalize to other assessments. First, test designers need to think carefully not only about “inference weights,” the relative importance of each skill to the overall inference one wants to make based on test scores, but about teachers’ likely responses to predictably assessed content. One can expect teachers’ instruction to respond to “test weights”—the percentage of the test made up by each standard—so it is critical that this issue is thought through in test design. Although tests that randomly sample from the Common Core standards would create fewer incentives for educators to strategically narrow the curriculum, the Common Core standards explicitly create categories of higher- and lower-priority standards. It is important to ensure that high- and low-priority standards that are tested do not always remain the same, even if all stakeholders agree that there is one standard that is clearly “more important than the rest,” because teachers will then have strong incentives to substantially deemphasize other standards. This suggests that even if the inference weights are known, test designers may want to diverge from predictably covering this material on tests. Although the inference weights on all standards are not equal, test designers might consider the advantages of taking a random sample from the standards each year or including a set of matrix-sampled items on state tests that allow for more extensive coverage of the full set of standards.
Second, our results suggest test design in a high-stakes context must be dynamic and responsive. The time and attention that is currently devoted to test design also needs to be devoted to posttest examination of item-level performance. Analyses attempting to detect predictable patterns and educators’ responses to them should become a regular part of the test design process. Had such analyses been conducted in the three states we studied, these tests could have been revised in real time.
This study has a number of limitations. First, we lack data on teachers’ actual instructional practices. We use performance on different types of test items as a proxy for an instructional focus on frequently assessed standards and are able to detect improved performance on these items. Although the approach we use has other advantages, it does not provide a window into which instructional practices produced these results. Second, because the item-level data available are at the level of the entire state, it was not possible to answer a number of important questions about test-specific instruction. Other studies have demonstrated that strategic responses to accountability have an organizational component, and we expect that these processes may affect historically disadvantaged populations more as their schools face the most pressure to quickly increase students’ scores. An ideal study would analyze student-by-item data over time, with students linked to individual schools. However, given the level of aggregation at which this study is working, it is striking that it is still possible to detect evidence of an instructional focus on highly assessed standards, suggesting that drilling down to student-by-item-level data is a promising area for future research on educators’ responses to test-based accountability systems.
Finally, we believe that our results inform the work of educational scholars trying to understand what state standardized test scores reveal about student learning. State test scores have become the most common dependent variable in education policy research, but few studies pay attention to the content and the structure of these tests. With the growth of administrative data sets, education researchers are now evaluating virtually all policies and programs with state test scores. Recent studies of teacher effectiveness, school choice programs, and accountability policies have relied, in large measure, on these scores. By investigating the features of state tests, we show that there are many reasons to worry that schools’ responses to accountability pressure may complicate (and, in some cases, invalidate) the inferences one can make based on test scores. As the research and policy uses of these tests continue to grow, we hope that our findings lead education researchers to think more carefully about how test score gains are produced.
Footnotes
Notes
Authors
References
Supplementary Material
Please find the following supplemental material available below.
For Open Access articles published under a Creative Commons License, all supplemental material carries the same license as the article it is associated with.
For non-Open Access articles published, all supplemental material carries a non-exclusive license, and permission requests for re-use of supplemental material or any part of supplemental material shall be sent directly to the copyright owner as specified in the copyright notice associated with the article.
