
Abstract
As evidence becomes increasingly important in educational policy, it is essential to understand how research design might contribute to reported effect sizes in experiments evaluating educational programs. A total of 645 studies from 12 recent reviews of evaluations of preschool, reading, mathematics, and science programs were studied. Effect sizes were roughly twice as large for published articles, small-scale trials, and experimenter-made measures, compared to unpublished documents, large-scale studies, and independent measures, respectively. Effect sizes were significantly higher in quasi-experiments than in randomized experiments. Excluding tutoring studies, there were no significant differences in effect sizes between elementary and middle/high studies. Regression analyses found that effects of all factors maintained after controlling for all other factors. Explanations for the effects of methodological features on effect sizes are discussed, as are implications for evidence-based policy.
Throughout the federal government, evidence is playing an increasing role in policy (see Buck & McGee, 2015; Haskins, 2014; Nussle & Orszag, 2014; Slavin, 2013). In particular, the recently passed Every Student Succeeds Act (ESSA) specifies levels of evidence that must be achieved to qualify for certain grants. In the U.S. Department of Education, Investing in Innovation (i3) runs annual “tiered evidence” competitions, in which applicants with strong evidence of effectiveness can apply for substantial funding to go to scale, those with smaller amounts of evidence can apply for funding for a large-scale evaluation, and those with a promising idea can apply to further develop and formatively evaluate their program. A similar program, Education Innovation Research (EIR), will continue under ESSA. Further, programs with strong or moderate evidence of effectiveness are increasingly being favored in other federal educational programs. In School Improvement Grants (SIG) for very low-achieving schools, Congress added a category of services schools could choose, “evidence-based whole-school reform,” which required at least one rigorous evaluation of a whole-school reform model. The Department of Education invited applications from providers and selected four that met this standard. Under ESSA, similar schools will be able to use additional funding to implement a broader range of strategies, but these must meet defined standards for “strong,” “moderate,” or “promising” levels of evidence.
Investments by i3, the Institute for Education Sciences (IES), the National Science Foundation (NSF), the Education Endowment Fund (EEF) in the United Kingdom, and other agencies are producing a steadily growing set of proven programs, greatly facilitating the argument that such programs should be favored when appropriate in federal funding. These and other developments suggest that evidence-based reform will continue to grow in importance in policy and practice.
The increasing influence of evidence in education policy contributes urgency to the need to have clear, enforceable, and difficult-to-game standards of evidence indicating that educational programs have acceptable levels of evidence. ESSA contains definitions of “strong,” “moderate,” and “promising” research. These will draw on the U.S. Department of Education’s What Works Clearinghouse (WWC), which has detailed descriptions of standards for inclusion of individual studies as well as procedures for pooling study outcomes (Song & Herman, 2010; WWC, 2014). The WWC categorizes programs as being acceptable “without reservations” (generally, randomized experiments) or “with reservations,” (generally, quasi-experiments), and if studies meet the criteria for these categories, outcomes are considered positive if they are statistically significant at the proper level of analysis. That is, if assignment and treatment were at the school level, analysis must be at the school level, usually using hierarchical linear modeling (HLM; Raudenbush & Bryk, 2002) or comparable methods. Also, programs can be considered effective by the WWC if they do not analyze data at the proper level but produce an effect size of +0.25 or more (WWC, 2014).
Another effort to summarize the findings of educational program evaluations is the Best Evidence Encyclopedia, or BEE (www.bestevidence.org), created at Johns Hopkins University. BEE standards are similar to those of the WWC, but BEE researchers also carry out meta-analyses to determine average effect sizes in evaluating programs and categories of programs, and study authors publish these meta-analyses in peer-reviewed journals. BEE standards are described in detail later in this article.
The Problem: Methodology Correlates With Outcomes
The development of various standards and reviews are essential underpinnings for evidence-based reform in education because they provide policy makers with some assurance that if they encourage use of proven programs, there will in fact be programs that will meet rigorous standards of evaluation and will show positive impacts.
However, in the course of creation of these research syntheses, several nettlesome issues have come up, and these must be understood if evidence-based reform is to have its desired impact on policy and practice. The problem is that certain methodological features are correlated with study effect sizes. All of these correlations may indicate the presence of bias. For example, a recent review of studies of learning strategies interventions by de Boer, Donker, and van der Werf (2014) found that studies using nonstandardized tests obtained higher effect sizes than those using standardized tests, as did studies in which the intervention was delivered by the researcher or associates (rather than ordinary teachers). This review did not, however, find significant differences between studies using random (vs. matched) assignment to conditions or between longer and shorter interventions.
As another example of the correlation between methodology and outcomes, Slavin and Madden (2011) examined effect sizes of reading and math studies that met the standards of the WWC with or without reservations. Studies were identified that used measures inherent to the experimental treatments, as when experimental students were taught specific content or skills that the control group was not taught, and the measure focused on the content taught to the experimental but not the control group. These same studies also administered tests that were not inherent to the treatment, such as standardized measures, specialized measures made by someone other than the study authors, or measures held to cover the content taught equally in experimental and control groups. The differences in effect sizes between the inherent and noninherent measures were striking. Across seven WWC-accepted math studies, the mean effect size was +0.45 for measures with treatment-inherent measures and −0.03 for measures used in the same studies that were not inherent to the treatment. Across 10 WWC-accepted elementary reading studies, the effect sizes were +0.51 and +0.06, respectively.
Study sample size has also been found to strongly impact effect sizes. Slavin and Smith (2009) found substantial differences in effect sizes between reading and math studies with large and small sample sizes, with an average effect size of +0.44 for studies with fewer than 50 subjects, +0.29 for studies with 51 to 100 subjects, and +0.09 for studies with sample sizes of more than 2,000.
Numerous reviewers have noted substantial differences between published and unpublished articles (e.g., Glass, McGaw, & Smith, 1981; Lipsey & Wilson, 2001). These well-known differences have led most meta-analysts, as well as the WWC and BEE, to insist on exhaustive searches for all studies on a given topic, including dissertations, technical reports, and other “gray literature,” and inclusion of any studies that meet inclusion standards.
The impacts of these differences according to study methodology are no longer academic. If, for example, large, randomized experiments characteristically produce much lower effect sizes than small, matched ones, then it may be unfair to compare effect sizes from these two categories of studies as though they were indicators of substantive differences between the effect sizes of different programs or types of programs. Not only could this mislead educators and policy makers about which programs truly work, but it could encourage publishers or developers to “game the system” by using certain methods and avoiding others to make their programs appear more effective than they are (see Baron, 2003).
The question of methodological impacts on effect sizes is also crucial to the discussion of what constitutes large, moderate, and small effects. For example, Bloom, Hill, Black, and Lipsey (2008) suggested several ways to report the findings of educational experiments so that they make sense to educators. Their main suggestion was to benchmark effect sizes from experiments against the amount of growth (in effect sizes) typically seen on standardized tests over the course of a year at a given grade level. For example, they noted that in third grade, students typically gained an effect size of +0.56 across seven reading tests, while 10th graders gained an effect size of only +0.19. Their idea was to then express effect size gains as a proportion of normative gains, so that, for example, if an experiment produced an effect size of +0.20, that might be considered very large if the study involved 10th graders but modest if it involved 3rd graders. However, Bloom et al. (2008) cautioned that readers should not assume that because effect sizes are proportionally large relative to normal year-to-year gains, these effects are easier to obtain:
It does not follow, however, that because a given intervention effect is proportionally smaller for early grades than for later grades that it is necessarily easier to produce in those early grades. … What intervention effects are possible is an empirical question. (Bloom et al., 2008, p. 307)
For scientific as well as pragmatic reasons, it is important to know how research designs, grade levels, and sample sizes affect effect sizes in program evaluations. Yet research on the relationship between methodology and effect size is sparse, has been focused within reviews of particular subjects or interventions, and has involved relatively few studies. Within reviews, differences in effect sizes according to methodology are often reported, but there are usually too few high-quality studies included for adequate statistical power, or a very wide range in study quality makes it difficult to determine unique effects of factors that affect outcomes even in well-controlled studies. The present review examines 645 high-quality studies of educational programs, making it possible to determine more definitive estimates of the impact of methodological features on study effect sizes with adequate power.
Methods
In order to investigate the relationships between study methodological features and effect sizes, we analyzed all 645 studies that met the standards of inclusion for any of 12 reviews written for the Best Evidence Encyclopedia (BEE) and (in most cases) published in review journals. The reviews cover all programs meeting the quality standards of the BEE (see below) in elementary and secondary math, elementary and secondary science, and elementary and secondary reading, as well as a review of elementary reading programs for struggling readers and a review of early childhood education. Studies included in reviews focusing on technology applications in reading and math were also included.
In each of these BEE reviews, studies of every intervention falling into a given subject/age category were considered for inclusion. After initial screening, studies were reviewed in detail by at least two authors. If there were differences, a third author was consulted.
Table 1 shows the reviews and information about numbers of studies and breakdowns of studies in key methodological categories. Note that because of overlaps (e.g., studies in the technology reviews often overlapped those in the comprehensive reviews), the study Ns from each review add up to a larger number than the grand total.
Characteristics of Included Reviews From the Best Evidence Encyclopedia
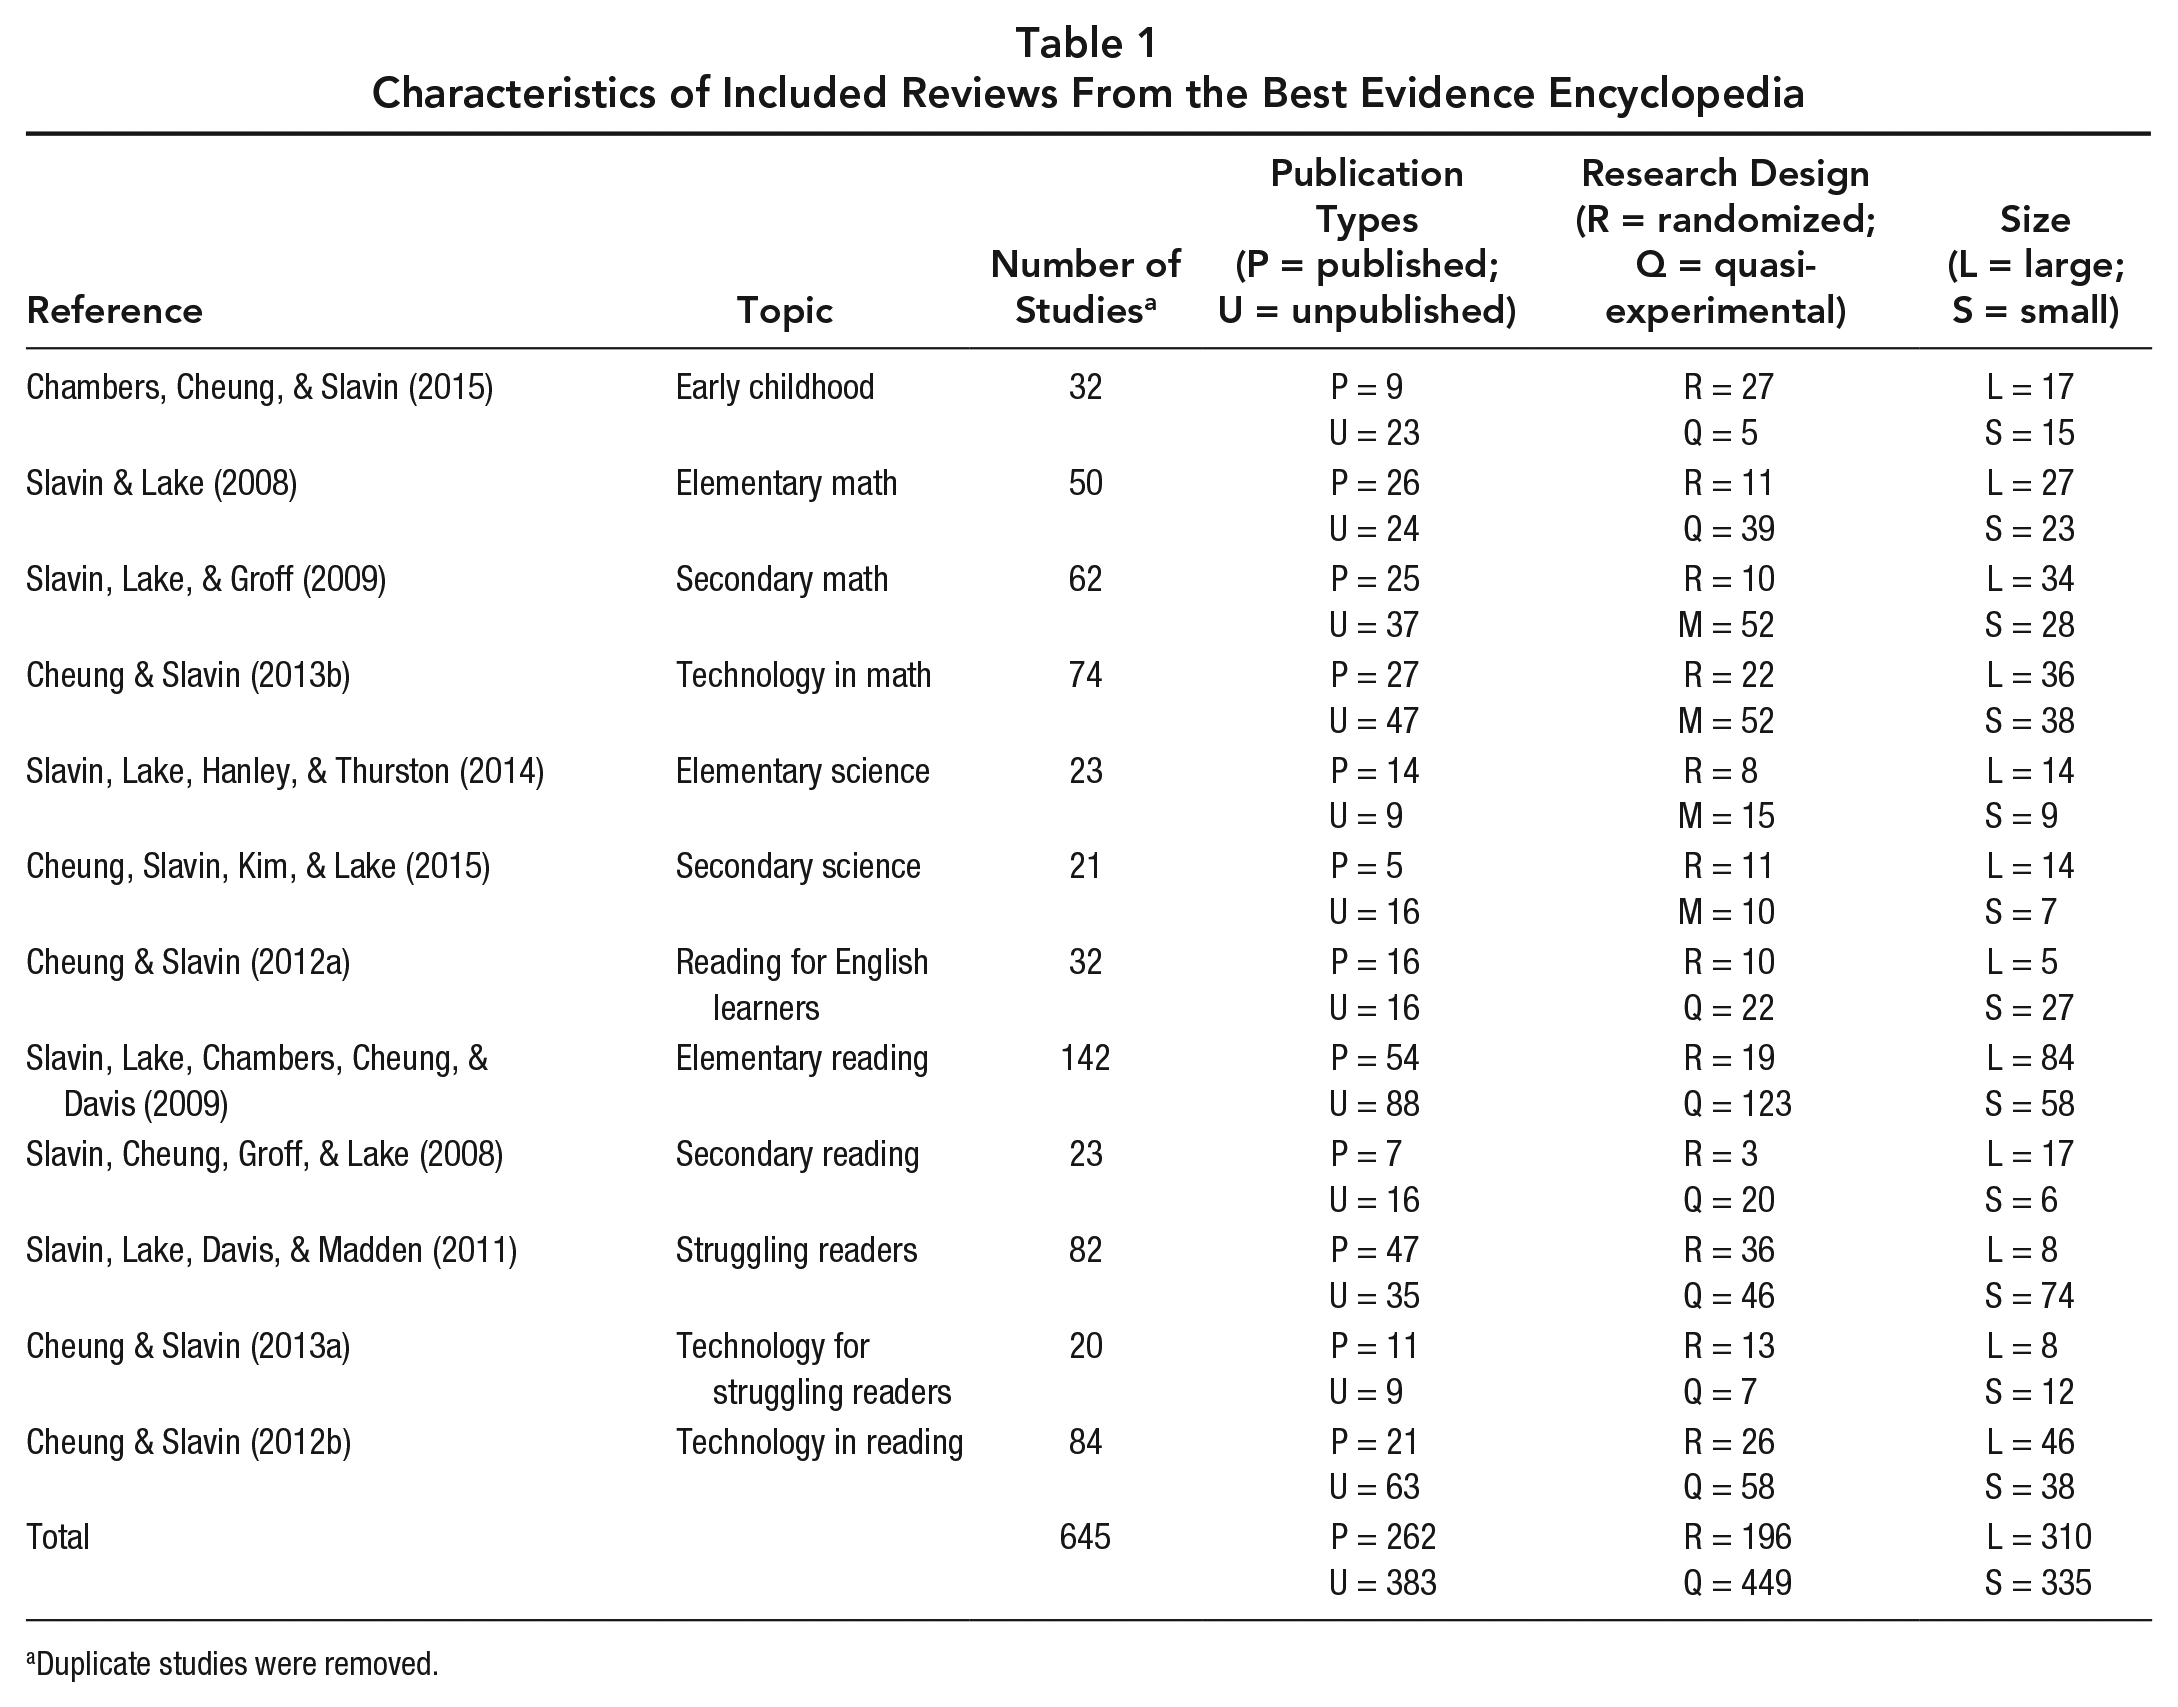
Duplicate studies were removed.
Study Inclusion Criteria
A consistent set of study inclusion criteria was used across all studies, with just a few variations. These criteria were as follows:
The studies evaluated reading, mathematics, or science programs designed to improve student achievement.
The studies involved students in grades prekinder-garten–12.
The studies compared students taught in classes using an innovative program to those in control classes using an alternative program or standard methods.
Studies could have taken place in any country, but the report had to be available in English.
Random assignment or matching with appropriate adjustments for any pretest differences (e.g., analyses of covariance) had to be used.
Pretest data had to be provided. Studies with pretest differences of more than 50% of a standard deviation before adjustment or matching were excluded.
The dependent measures included quantitative measures of student performance, such as standardized outcome measures. Experimenter-made measures were accepted if they were comprehensive measures of reading, mathematics, or science, which would be fair to the control groups, but measures of objectives inherent to the program (but unlikely to be emphasized in control groups) were excluded.
A minimum study duration of 12 weeks was required.
Studies had to have at least two teachers in each treatment group to avoid confounding of treatment effects with teacher effects.
Studied programs had to be replicable in realistic school settings, at least in principle. Studies providing experimental classes with extraordinary amounts of assistance (e.g., additional staff in each classroom to ensure proper implementation) that could not be provided in ordinary applications were excluded.
A total of 645 studies from these 12 reviews were included in our final analysis. In each of these reviews, effect sizes were computed as the difference between experimental and control individual student posttests after adjustment for pretests and other covariates, divided by the unadjusted posttest pooled standard deviation (SD). Procedures described by Lipsey and Wilson (2001) were used to estimate effect sizes when unadjusted standard deviations were not available. If pretest and posttest means and SDs were presented but adjusted means were not, effect sizes for pretests were subtracted from effect sizes for posttests. F ratios and t ratios were converted to effect sizes when means and standard deviations were not reported.
The following methodological features were extracted from each of the 12 reviews: use of researcher-made versus independent measures, size of the sample (small, N < 250, vs. large, N ≥ 250), research design (randomized vs. quasi-experimental), elementary vs. secondary grade levels, and type of publication (published vs. unpublished). Comprehensive Meta-Analysis software Version 2 (Borenstein, Hedges, Higgins, & Rothstein, 2005) was used to carry out all statistical analyses such as Q statistics and overall effect sizes. This software weights effect sizes by the inverse squares of their sample sizes when means are computed.
Results
Researcher-Made vs. Independent Measures
As noted earlier, Slavin and Madden (2011) found substantial differences in effect sizes within WWC-accepted studies between measures inherent to (or overaligned with) the treatment as opposed to those that were independent of the treatment. A related issue has often been posed in previous research as researcher-made versus standardized tests, and it has been frequently found that researcher-made tests are associated with much higher effect sizes than are standardized tests. For example, Scammacca et al. (2007) carried out a meta-analysis to examine effective reading interventions for adolescent struggling readers. A total of 33 studies were included in this meta-analysis, and the overall effect size was +0.95. However, in the 11 studies that used standardized, norm-referenced measures, the average effect size was only +0.42. Edmonds and her colleagues (2009) examined the effects of reading interventions for older struggling readers. The average effect size of studies that used researcher-developed measures (ES = +1.19) was two and a half times larger than that of studies that used independent outcome measures (ES = +0.47). In a review of research on the effects of computer technology on students’ mathematics learning, Li and Ma (2010) found that among the 46 included studies, the effect size of those that used non-standardized measures (ES = +0.86) was much greater than that of studies that used standardized instruments (ES = +0.57).
In the current review, far fewer included studies used researcher-made measures, because BEE standards reject “treatment-inherent” measures. The only researcher-made measures included in BEE reviews are ones that were deemed by reviewers to cover content taught equally in experimental and control conditions. Yet even after this exclusion, effect sizes for studies using experimenter-made measures were twice the size of effect sizes from assessments not made by the researchers. As indicated in Table 2, the effect sizes for experimenter-made measures and tests independent of the experimenters were +0.40 and +0.20, respectively (Q = 24.06, p < .001).
Mean Effect Sizes in Studies Using Researcher-Made vs. Independent Measures

Sample Size
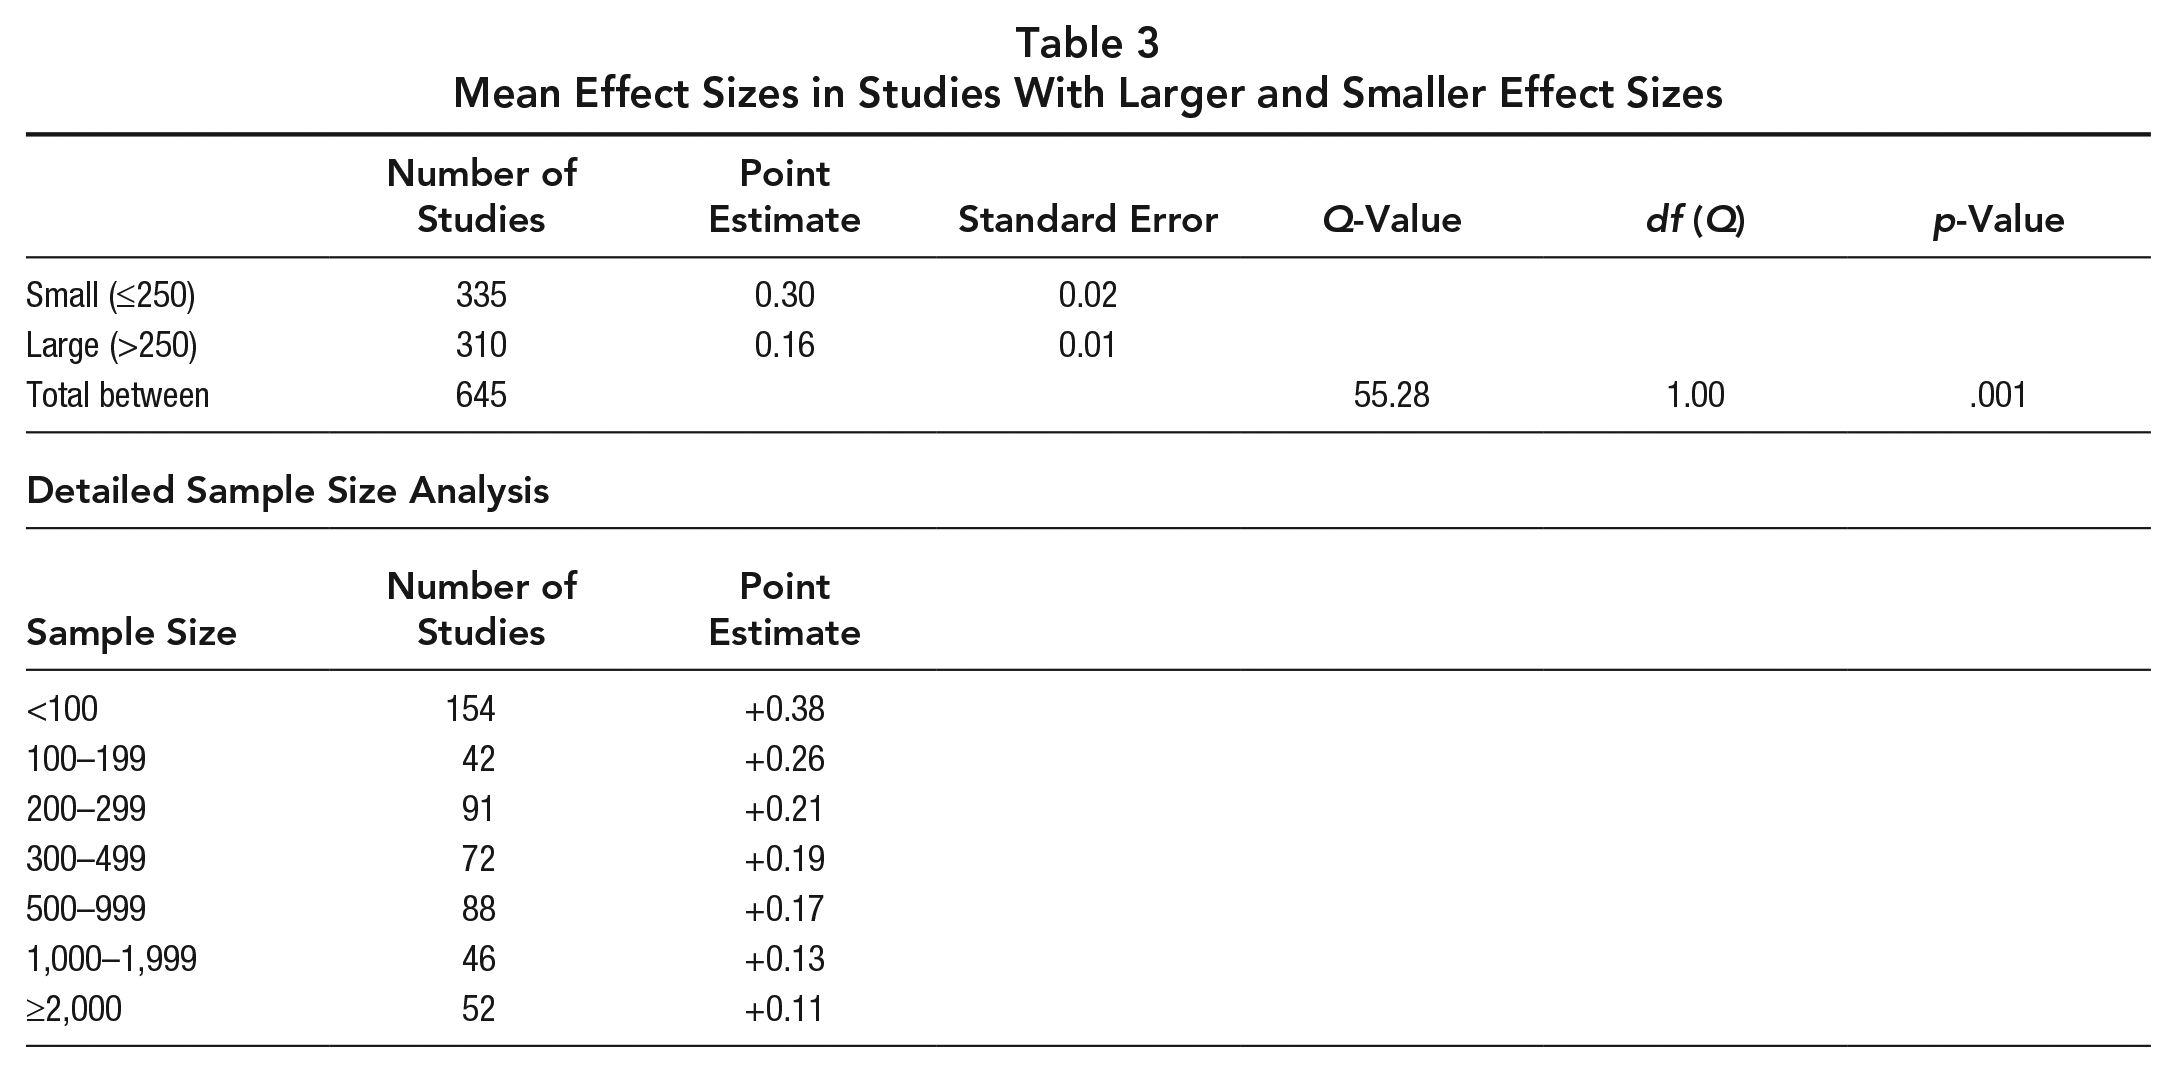
As noted earlier, Slavin and Smith (2009) examined the relationship between sample size (numbers of students) and effect sizes in studies of reading and math programs and found a substantial negative relationship. The current review did a similar comparison but with a much larger set of studies. We first divided studies into those with sample sizes less than 250 subjects (n = 335 studies) and those with sample sizes of 250 or more subjects (n = 310 studies).
As indicated in Table 3, a statistically significant difference was found between large studies and small studies (QB = 55.28, p < .01). Studies with small sample sizes produced almost twice the effect sizes of those with large sample sizes (ES = +0.30 vs. ES = +0.16, respectively). The lower section of Table 3 also breaks down the study-size effect into seven categories, from fewer than 100 to more than 2,000 students. This shows a ratio of 3.5 to 1 comparing the smallest to the largest categories. The results support the findings of other reviews that made similar comparisons (Liao, 1999; Pearson, Ferdig, Blomeyer, & Moran, 2005). For instance, when Pearson et al. (2005) carried out a meta-analysis on the use of digital tools and learning environments to enhance literacy acquisition, they found that studies with smaller sample sizes (N < 30) were much more likely to achieve higher treatment effects than those with larger sample sizes. Slavin and Smith (2009) found that “studies with sample sizes below the median of about 250 had a mean effect size of +0.27, whereas those with large sample sizes had a mean effect size of +0.13” (p. 503).
Mean Effect Sizes in Studies With Larger and Smaller Effect Sizes
There are several possible explanations for these findings. First, small-scale studies are often more tightly controlled than large-scale studies and, therefore, are more likely to produce positive results. The positive results of small-scale studies could be due to what Cronbach et al. (1980) called the “super-realization” effect. That is, in small-scale experiments, researchers or program developers are more likely able to maintain high implementation fidelity or provide additional support that could never be replicated on a large scale.
Second, researcher-developed measures are more likely to be used in small-scale studies, while standardized tests, which may be less sensitive to treatments, are often used in large-scale studies (de Boer et al., 2014; Edmonds et al., 2009; Li & Ma, 2010; Scammacca et al., 2007).
Further, small studies may appear to have high effect sizes because their limited statistical power requires high effect sizes to reach statistical significance. Studies with small samples that do not produce significant differences may be shelved by researchers as “pilots” or declined by journal editors. If a “pilot” just happens to produce a large effect size, it is more likely to be submitted and accepted somewhere and may, therefore, be easier for reviewers to find. This problem may be accentuated by the WWC (2014) practice of counting nonsignificant positive effect sizes as “substantively important.” This usually applied to underpowered cluster designs. The problem is that this policy might encourage submission to WWC of unpublished underpowered studies with large effect sizes.
Randomized vs. Quasi-Experiments
Research designs may affect effect sizes in systematic reviews in education. Previous reviews generally reported nonsignificant differences in effect sizes between randomized and quasi-experimental studies, although means for quasi-experiments were usually directionally higher (de Boer et al., 2014; Heinsman & Shadish, 1996; Li & Ma, 2010; Melby-Lervag & Hulme, 2003; Rake, Valentine, McGatha, & Ronan, 2010; Slavin, Lake, & Groff, 2009; Torgerson, 2007). The current review has a sufficient sample of high-quality studies to permit a test of the effect of randomized vs. quasi-experimental designs on effect sizes to be made with adequate power.
As indicated in Table 4, we categorized 196 studies as randomized and 449 as quasi-experiments. Randomized quasi-experiments, in which too few clusters are randomly assigned to allow for analysis at the cluster level (Slavin, 2008), were counted as quasi-experiments.
Mean Effect Sizes in Quasi-Experiments vs. Randomized Experiments
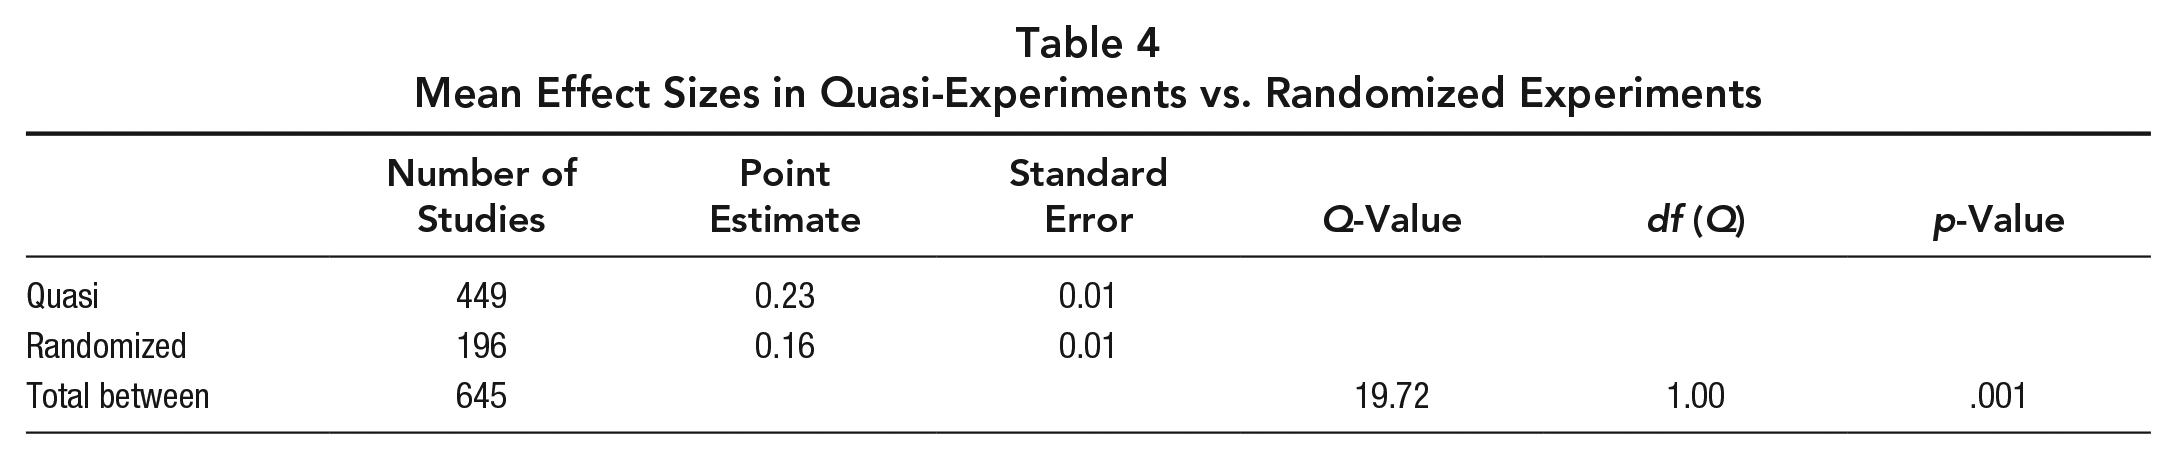
With its large samples of randomized and quasi-experimental studies, our analysis detected a significantly higher mean effect size in quasi-experimental studies than in randomized experiments (p < .001). The average effect sizes for randomized experimental studies and quasi-experimental studies were +0.16 and +0.23, respectively. Though statistically significant, this difference in effect sizes is, in proportional terms, less than that found for large versus small samples, researcher-made versus independent measures, and published versus unpublished studies. The differences in effect sizes are particularly important, however, because almost two-thirds of the qualifying studies (66%) included in these 12 reviews were quasi-experiments. Out of the 645 qualifying studies, only 196 (34%) were randomized experiments. If quasi-experiments tend to overstate effect sizes, this implies that mean effect sizes from reviews that average randomized and quasi-experimental effect sizes are likely to be reporting inflated mean effect sizes.
Quasi-experiments may produce higher effect sizes than randomized experiments because in such studies, selective factors may work in favor of the treatment groups. For example, if 20 schools using a particular program are compared to 20 that are using other methods, it is likely that the 20 schools using the program may have chosen to do so because they are more oriented toward innovation, feel more confident in their skills, or are otherwise a stronger staff or have stronger leadership. Even if all quantitative factors are matched in the two sets of schools (e.g., pretests, ethnicities, percent free lunch, teacher experience), there is no way to control for the teachers’ motivation or capacity to use the program. When a given program is difficult to use, and especially if some schools have dropped the program, the surviving schools are particularly likely to have an advantage.
Combining sample size and experimental design, we found that small quasi-experiments (n = 229, ES = +0.33) have substantially higher effect sizes than do large, randomized studies (n = 90, ES = +0.12), as shown in the lower section of Table 4. This should provide a sobering perspective to researchers, developers, and policy makers who wonder why many large, randomized experiments currently being funded by i3, IES, and other funders so often fail to find significant and substantial impacts of educational treatments, even though smaller quasi-experimental studies did find positive effect sizes.
Elementary vs. Secondary Studies
In an article on practical interpretations of the magnitude of effect sizes, cited earlier, Bloom et al. (2008) noted that students in the elementary grades ordinarily gain much more (in terms of achievement effect sizes) from the beginning of each year to the end, in comparison to secondary students. Based on this, they proposed that effect sizes might be adjusted or interpreted in light of grade levels, so that a smaller effect size in secondary school might be considered more important than the same effect size in elementary school.
In order to test this proposition, we compared elementary studies to secondary ones (excluding 64 elementary studies of one-to-one and small-group tutoring [ES = +0.41]). As shown in Table 5, effect sizes were slightly higher in elementary schools (ES = +0.20) than in secondary schools (ES = +0.17), and this difference was not significant at conventional levels (p < .06). Separate analyses within randomized and quasi-experimental studies also found no significant differences between elementary and secondary studies.
Mean Effect Sizes for Elementary vs. Secondary Studies
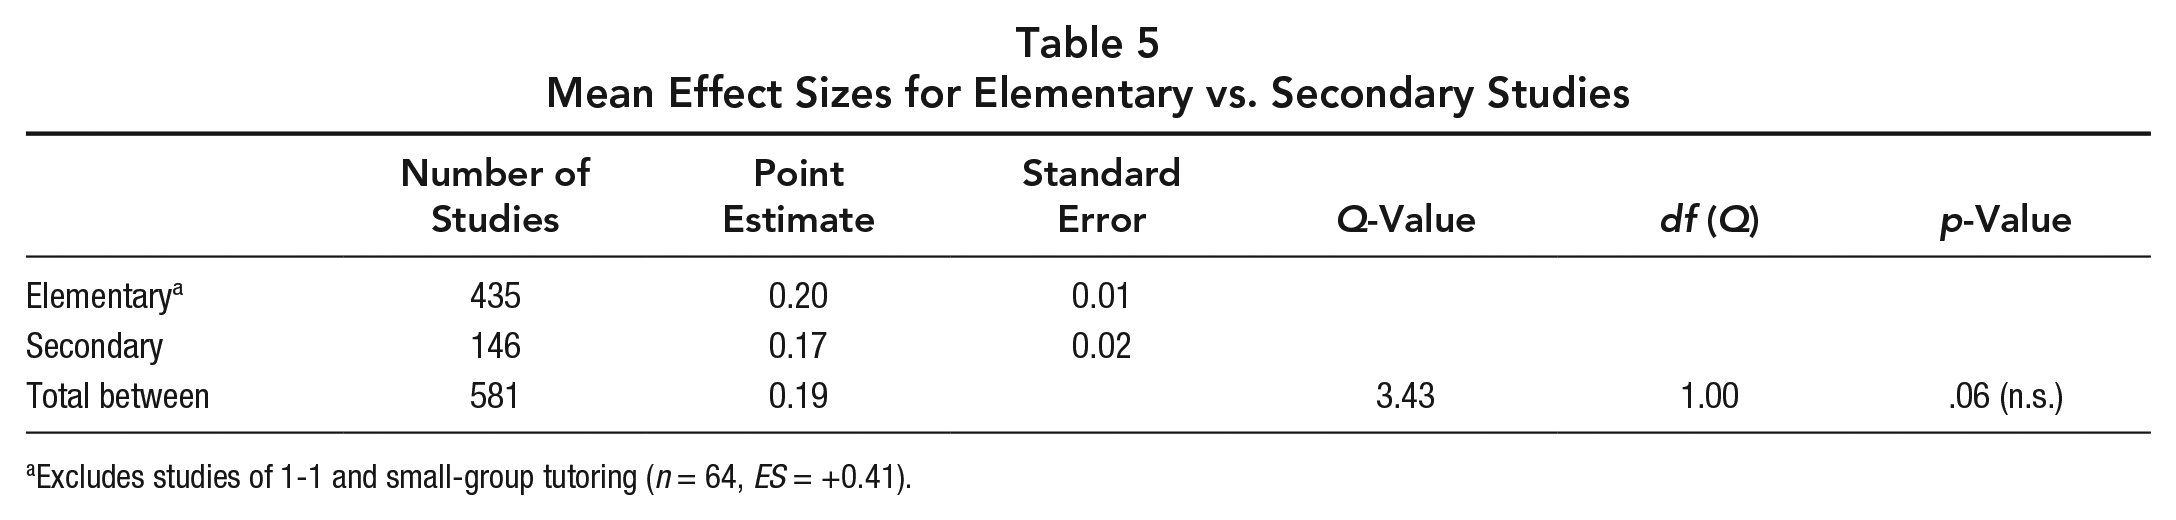
Excludes studies of 1-1 and small-group tutoring (n = 64, ES = +0.41).
Publication Bias
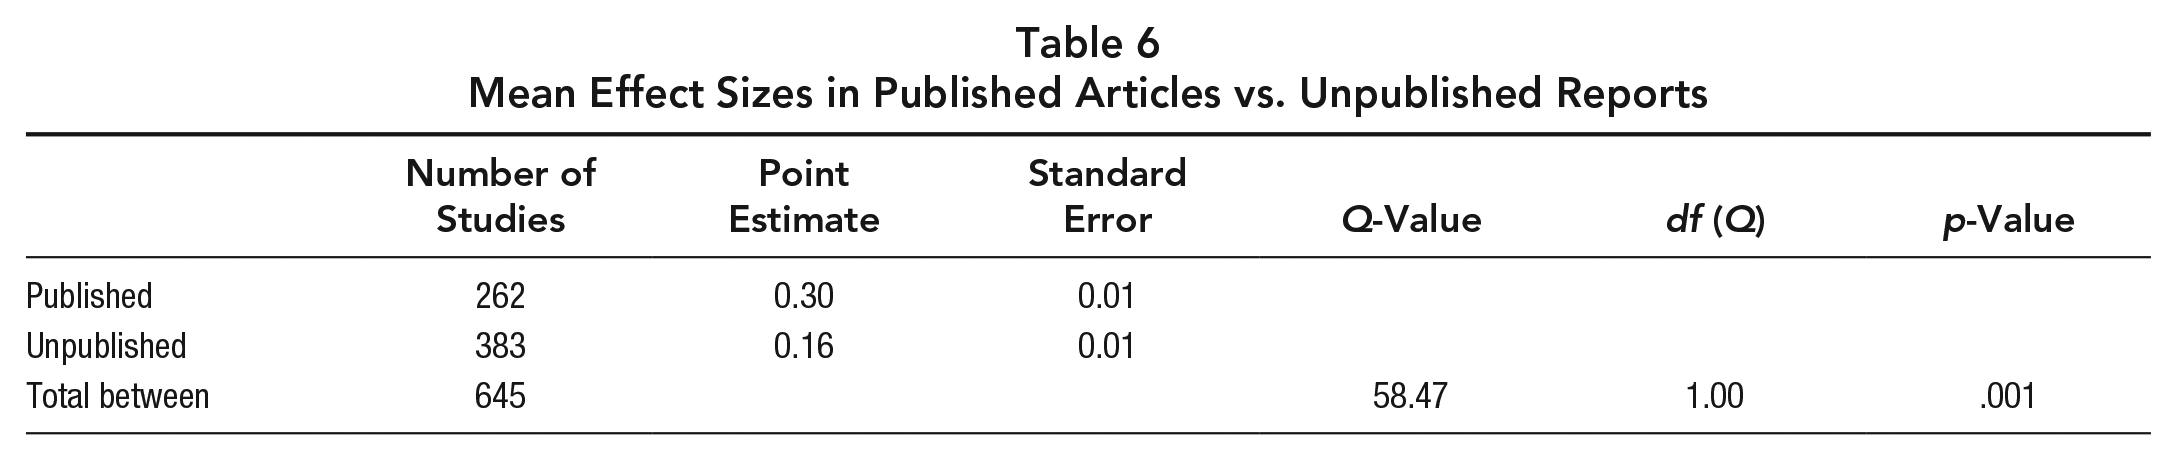
Many previous reviews have noted that published studies report much higher effect sizes than unpublished ones. This review found the same differences. Across the 12 reviews, there were a total of 262 published articles and 383 unpublished dissertations and technical reports (often collectively referred to as “gray literature”). As indicated in Table 6, the overall effect sizes for published articles and unpublished reports were +0.30 and +0.16, respectively. The Q-value (QB = 58.47, p < .001) clearly indicates publication bias in this set of studies. The findings are consistent with previous studies in social science, psychological science, and medicine (Cook et al., 1993; Ferguson & Heene, 2012; Glass et al., 1981; Hopewell, McDonald, Clarke, & Egger, 2007; Lipsey & Wilson, 1993). For example, Lipsey and Wilson (1993) found that across 92 meta-analyses of psychological, educational, and behavioral treatment research, the mean effect sizes for published studies and unpublished studies were +0.53 and +0.39, respectively.
Mean Effect Sizes in Published Articles vs. Unpublished Reports
The findings that published studies yield larger effect sizes than unpublished studies should come as no surprise. First, positive and significant results are perceived more favorably by reviewers and editors alike, making studies that present them more likely to be published (Cook et al., 1993)
Further, studies with small or negative insignificant results are often shelved by researchers or program developers themselves before submitting them for publication. This is called the “file drawer effect” (Glass et al., 1981).
There is some debate as to whether gray literature should be included in research reviews and meta-analyses. Some meta-analysts only include published articles, arguing that since published materials have to go through a rigorous peer review, their quality is generally higher than that of unpublished works. However, Lipsey and Wilson (2001) disagreed, stating,
This rationale is generally not very convincing. In many research areas, unpublished material may be as good as the published and in any event, the decision is better made on the basis of explicit methodological criteria than by using publication status as a proxy. (p.19)
Agreeing with Lipsey and Wilson, our current findings show that excluding studies in the gray literature could greatly bias results of a meta-analysis. Clearly, it is critical to screen and assess both published and unpublished works using rigorous inclusion criteria to guarantee the quality of included studies.
Could Effects of Factors Be Due to Correlations With Other Factors?
Throughout this article, the possibility is raised that effects of particular factors may be due in part to correlations with other factors. For example, perhaps the substantial negative impact of sample size on effect size could be explained in part by publication bias: Perhaps studies with small sample sizes are likely to be published if they have positive impacts but not published (and perhaps not findable) if they have negative or nonsignificant impacts; or small, quasi-experimental studies may be more likely to use researcher-made measures, partially explaining their positive impacts on effect sizes.
We tested the possibility that factors impacted effect sizes independently of their correlations with other factors. To do this, we carried out a regression analysis in which each of the factors was entered in an equation simultaneously, with effect size as the dependent variable. The result, shown in Table 7, indicated that all factors that were initially significant remained significant in an equation containing all other factors. The one factor that was not initially significant, grade level, was also not significant in the regression analysis. This analysis suggests that each factor had an independent effect on effect size, even after all other factors were controlled for.
Regression Analysis of Effects of Main Factors on Study Effect Sizes (n = 645)
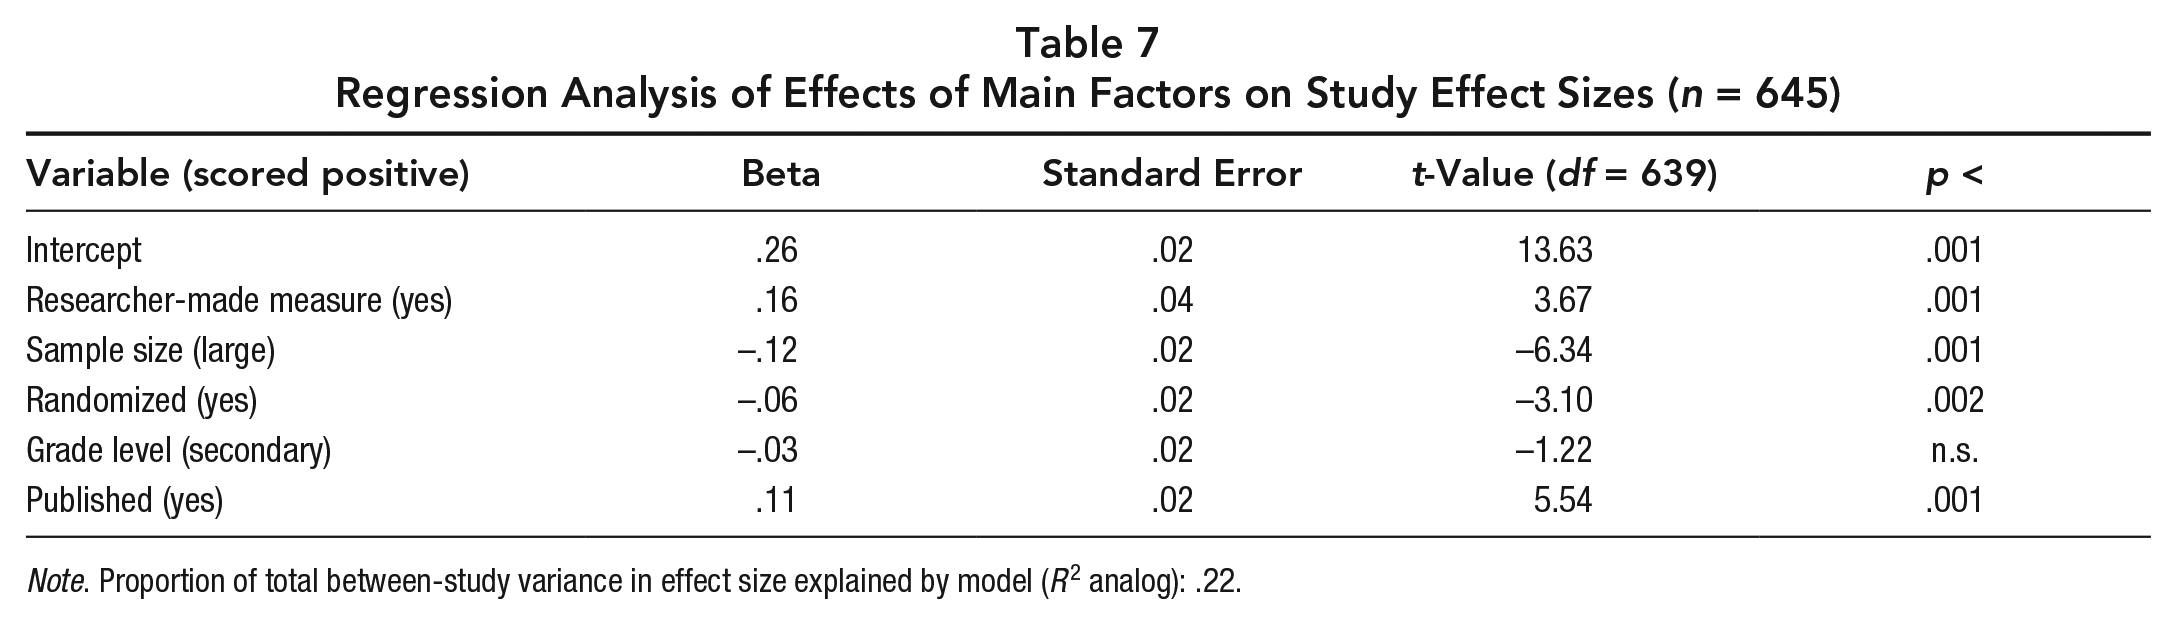
Note. Proportion of total between-study variance in effect size explained by model (R2 analog): .22.
Discussion
While numerous reviews and meta-analyses have examined the impacts of methodological factors on effect sizes, these earlier studies have been limited to particular topic areas, small numbers of studies, or a wide diversity in study quality. The present review advances understanding of methodological impacts by synthesizing research across grades prekindergarten to 12, involving reading, math, and science. It identified 645 studies that all met consistent, high standards of methodological quality. Based on analyses of these studies, we found four methodological features that have strong and significant impacts on effect sizes: researcher-made measures, sample size, randomized versus quasi-experimental designs, and published/unpublished reports. In each of these cases, the differences were quite large. Smaller studies (n < 250) had twice the effect sizes of larger ones (n ≥ 250), and differences were even greater for studies with Ns less than 100 (mean ES = +0.38) compared to those with Ns greater than 2,000 (mean ES = +0.11), a ratio of 3.5 to 1. Even after excluding measures that were deemed to be inherent to (or overaligned with) treatments, the effect size ratio was 2 to 1 between researcher-made and independent measures. In the case of published versus unpublished papers, the difference was a ratio of almost 2 to 1. Quasi-experimental studies were associated with significantly higher effect sizes than were randomized experiments (p < .001), but the ratio was 1.44 to 1, relatively moderate in comparison to the other categories but still reason for substantial concern. Putting together two categories, small quasi-experiments were associated with average effect sizes that exceeded those characteristic of large randomized studies by a ratio of 2.75 to 1. The only factor on which there were no significant effect size differences was the comparison between elementary and secondary grade levels, contrary to the expectations stated by Bloom et al. (2008).
There is a legitimate question in each of these categories about which is the more valid effect size. For example, unpublished studies are often dissertations done, by definition, by students with less experience and fewer resources than experienced researchers, perhaps with major grants, who are more likely to publish their work. In the case of researcher-made measures, there is good reason to believe that such measures are more sensitive to treatment than are independent tests, which are usually standardized. In the case of sample sizes, large studies may show smaller effect sizes because quality of implementation diminishes in large experiments, and large studies are more likely to use (relatively insensitive) standardized tests as outcome measures. So it might be argued, at a minimum, that the valid effect sizes may lie somewhere between the higher and lower estimates associated with different experimental designs.
The problem with this line of reasoning is that in an applied field like education, the ultimate goal of any program evaluation is to estimate what would happen if the program were implemented at a large scale under ordinary circumstances. Effect sizes derived from studies using diverse methods and measures may be valid for theory-building, but when program outcome data are used for policy purposes, in particular, it may be of little importance what effect sizes were obtained in small experiments with researchers closely involved in ensuring quality implementation. In pragmatic implementations outside of research, it is reasonable to assume that samples will be large, quality of implementation will be variable, and outcome measures will be standardized. So the lower effect size estimates, for large-scale studies with independent measures, are probably a closer approximation to attainable reality.
The importance of the differences found in this review and others is that in comparing the impact of various interventions on student outcomes, it may matter a great deal which methods tended to be used in their evaluations. For example, imagine that Program A and Program B each have mean effect sizes of +0.20. However, the studies evaluating Program A all used independent, standardized tests, while those evaluating Program B all used researcher-made measures. Are their outcomes truly equal? Program A’s effect size is right at the average of the BEE studies for independent tests (ES = +0.20), while Program B’s effect size is half of the average for studies using researcher-made measures (ES = +0.40). Or imagine that Program X has an average effect size of +0.20, all from large, randomized experiments, while Program Y has a mean effect size of +0.30, all from small quasi-experiments. Program Y appears much more effective, but its effect size is below the mean for all BEE studies using small quasi-experiments, while the effect size for Program X is almost twice that typical of BEE studies using large randomized designs (ES = +0.12).
Recommendations for Research and Policy
Based on the findings of our analyses, it is clear that researchers as well as policy makers need to take into account research design, sample size, measures, and type of publication before comparing effect sizes from program evaluations. Some specific recommendations are as follows:
In meta-analyses and other quantitative syntheses, reviewers should search for all studies that meet well-justified standards, regardless of whether or not the studies are published.
Researchers should use randomized trials whenever possible. Random assignment largely eliminates bias, of course, and the evidence from this article suggests that quasi-experiments tend to overstate effect sizes.
In reviews of program evaluations intended to inform policy and practice, reviewers should exclude researcher-developed measures. These greatly overstate effect sizes.
Policy makers and educators should insist on large, randomized evaluations to validate promising programs. It is apparent that small, quasi-experimental studies can greatly overstate program impacts, or at a minimum allow great variations in outcomes. If important decisions are to be made based on evidence, that evidence should be as convincing as possible.
When effect sizes are potentially meaningful but the sample size (usually, number of clusters) is too small to reach statistical significance, researchers might be encouraged to pool similar studies to build up sample size over time. For example, if an evaluation of Program X only has 20 schools (10 experimental, 10 control), and achieves an effect size of +0.20, this is unlikely to be statistically significant. However, if two such studies find effect sizes of +0.20, this could be seen as strong evidence of positive effects across the two underpowered experiments. Building up small randomized experiments in this way would allow less well-funded researchers to do larger, high-quality evaluations over time and to learn from them as they go.
Evidence-based reform has great potential to improve the quality of programs students receive and to fuel much interest and investment in development, research, and dissemination of effective approaches. However, evidence-based policies will prevail only if the evidence itself is rigorous and meaningful. The findings of the analyses in this article and those of many previous analyses tell us the consequences of compromising on the quality of the evidence. These findings should be taken into account in crafting evidence-based policies at all levels of government.