
Abstract
Federal legislation and policy increasingly seek to address minority overrepresentation in special education due to concerns that U.S. schools are misidentifying children as disabled based on their race or ethnicity. Yet whether and to what extent this is occurring is currently in dispute. We estimated racial disparities in disability identification using very large (e.g., Ns = 183,570, 165,540, and 48,560) student-level, nationally representative data sets and multivariate logistic regression including school fixed effects models along with tabulations of percentage with a disability among racial or ethnic groups across academic achievement deciles. Among children who were otherwise similar in their academic achievement, poverty exposure, gender, and English language learner status, racial or ethnic minority children were consistently less likely than White children to be identified as having disabilities. Minority children’s disability underidentification was evident (a) in elementary, middle, and high school; (b) across racially diverse groups and specific disability conditions; and (c) throughout the achievement distribution. Contrary to federal regulatory and policy efforts, minority children have been less likely than otherwise similarly achieving White children to receive special education services in the United States since at least 2003.
Keywords
Anecdotal and empirical work has frequently reported that U.S. minority children are disproportionately overrepresented in special education (e.g., Dunn, 1968; Zhang, Katsiyannis, Ju, & Roberts, 2014). Some of this work has relied on descriptive and so unadjusted estimates (e.g., Office of Special Education & Rehabilitative Services, U.S. Department of Education [OSERS], 2016) that do not account for known confounds (for methodological critiques, see Donovan & Cross, 2002; MacMillan & Reschly, 1998). For example, Congress justified amending federal legislation (i.e., the Individuals with Disabilities Education Act, or IDEA) to address overrepresentation by observing that Black children constituted 21% and 16% of the special education and general school-aged populations, respectively. Minority children have also been reported to be overidentified for specific disability conditions, including for the possibly stigmatizing conditions of intellectual disability and emotional disturbance (Oswald, Coutinho, Best, & Singh, 1999; OSERS, 2016). Although covariate-adjusted estimates indicating overrepresentation based on race or ethnicity have also been reported (Skiba, Poloni-Staudinger, Simmons, Feggins-Azziz, & Chung, 2005), including in analyses that control for family-level economic disadvantage (Sullivan & Bal, 2013), this work continues to have methodological limitations (Morgan et al., 2015, 2017). These include the frequent use of only aggregate-level controls, which can result in spurious estimates due to the ecological fallacy, and a lack of control for the strong confound of individual-level academic achievement (for reviews, see Donovan & Cross, 2002; Morgan et al., 2017). Reports of overrepresentation have led to special education being characterized as a type of institutionalized racism resulting in the legalized segregation of minority children (Blanchett, 2006; Codrington & Fairchild, 2012).
Federal legislation, regulation, and policies increasingly seek to address minority overrepresentation due to concerns that children attending U.S. schools are overidentified as disabled based on their race and ethnicity (e.g., Lysy, Mello, & Corey, 2014; U.S. Department of Education, 2016). In 1997, IDEA was amended to require local education agencies (LEA) to report the extent to which significant disproportionality was occurring in special education generally and for specific disability conditions. Evidence of disproportionality required LEA to review, potentially revise, and if revised, publicly report on eligibility policies and procedures. In 2004, IDEA was further amended to require funding to be reallocated in LEA reporting overrepresentation. Following a U.S. Government Accountability Office (GAO, 2013) recommendation, the U.S. Department of Education (2016) recently enacted additional regulations, including “reasonable thresholds” of significant disproportionality. The department justified these regulations based on “clear evidence that overrepresentation on the basis of race and ethnicity continues to exist at both the national and local levels” (p. 10977).
Recent Reports of Minority Children’s Disability Underidentification
Yet recent work now reports that race and ethnic minority children may instead be underidentified as having disabilities and so be less likely to receive special education services as they attend U.S. schools, particularly when contrasted to White children displaying similar clinical needs. This new work has attempted to account for longstanding (Donovan & Cross, 2002; MacMillan & Reschly, 1998) and continuing (Morgan et al., 2017) methodological limitations in prior empirical work by controlling for strong confounds (e.g., individual-level academic achievement, family-level economic disadvantage) that may explain minority children’s initially observed overrepresentation in special education (e.g., Donovan & Cross, 2002; Hosp & Reschly, 2004; MacMillan & Reschly, 1998; Morgan, Farkas, Hillemeier, & Maczuga, 2012). Contrasts between “otherwise similar” or “similarly situated” children better satisfy the methodological and legal conditions necessary for inferring racial discrimination (National Research Council [NRC], 2004), thereby allowing for a more rigorous evaluation of whether overrepresentation is occurring because of misidentification based on race or ethnicity (U.S. Department of Education Office of Civil Rights [OCR], 2016).
Accounting for individual-level academic achievement is especially necessary when investigating whether schools are over- or underidentifying children as disabled based on race or ethnicity (Donovan & Cross, 2002). This is because schools may reasonably identify children who are struggling academically as possibly having disabilities and so in need of special education services (Donovan & Cross, 2002; Hosp & Reschly, 2004). Academic achievement has been identified as “the key variable in special education eligibility for most students” (Hosp & Reschly, 2004, p. 196), and minority children are known to be more likely than White children to struggle academically (National Center for Education Statistics [NCES], 2015). This occurs by school entry (Fryer & Levitt, 2013; García, 2015), thereby disproportionately increasing minority children’s odds of special education referral (Donovan & Cross, 2002; Hosp & Reschly, 2004). These academic struggles often result from minority children’s unjust but well-established greater exposure to gestational, economic, and environmental factors—including low birthweight, environmental lead exposure, and poverty—that disproportionately increase their risk for disabilities (e.g., Donovan & Cross, 2002; García, 2015; Morsy & Rothstein, 2015). 1 Controlling for individual-level academic achievement also helps avoid the possibility of spurious coefficients resulting from the ecological fallacy of using aggregate-level factors to estimate individual-level risk (Robinson, 1950).
Recent work controlling for children’s academic achievement and other confounds repeatedly fails to find evidence of overidentification based on race or ethnicity. Instead, when these confounds are accounted for, minority children have typically been found to be less likely to be identified as disabled and so receive special education services than otherwise similar White children. Underidentification has been observed both prior to and following school entry (Hibel, Farkas, & Morgan, 2010; Morgan et al., 2012; Morgan, Hammer, et al., 2016); during the elementary, middle, and high school grades (Morgan et al., 2015; Shifrer, Muller, & Callahan, 2011); for special education generally (Hibel et al., 2010); and for specific disability conditions, including specific learning disabilities (SLD), attention-deficit/hyperactivity disorder (ADHD), emotional disturbance (ED), intellectual disabilities (ID), and speech or language impairments (SLI) (Hibel et al., 2010; Morgan et al., 2015; Morgan, Hammer, et al., 2016; Morgan, Hillemeier, Farkas, & Maczuga, 2014; Morgan, Staff, Hillemeier, Farkas, & Maczuga, 2013).
Findings of minority underidentification are consistent with reports that schools are more likely to (a) medicalize the struggles of White children while criminalizing those of minority children (Ramey, 2015) and (b) identify White children as gifted among those who are similarly high achieving (Grissom & Redding, 2016). These findings also are consistent with public health research that often indicates that minorities are less likely than Whites to be identified and receive treatment for disabilities or other health conditions even when displaying similar or greater clinical needs (Coker et al., 2016; Mandell et al., 2009; Miller, Nigg, & Miller, 2009; Morgan et al., 2012; Morgan, Hammer, et al., 2016; Payne & Puumala, 2013). For reviews of this extensive literature, see Flores and the Committee for Pediatric Research (2010) and Zuckerman, Mattox, Sinche, Blaschke, and Bethell (2014). For qualitative research that comes to similar conclusions for both Black and Hispanic families, see Gillborn, Rollack, Vincent, and Ball (2016) and Zuckerman, Sinche, et al. (2014). Mechanisms resulting in minority children’s disability underidentification are likely complex and may include implicit provider bias (Hall et al., 2015), cultural or language factors limiting access to special education services (Coll, Crnic, Lamberty, & Wasik, 1996; Danesco, 1997; Delphit, 1995; Flores & Tomany-Korman, 2008), concerns about potential prejudice and stigma (Yeh, Forness, Ho, McCabe, & Hough, 2004; Yeh, Hough, McCabe, Lau, & Garland, 2004; Zuckerman, Sinche, et al., 2014), societal inequities including lack of access to health insurance and health care (Inkelas, Raghavan, Larson, Kuo, & Ortega, 2007), and greater odds of attending racially segregated and underresourced schools (Hibel et al., 2010).
The Need to Replicate Recent Reports of Minority Children’s Disability Underidentification
However, whether and to what extent underidentification based on race or ethnicity is occurring in the United States is currently in dispute (Morgan & Farkas, 2016a; Skiba, Aritles, Kozleski, Losen, & Harry, 2016). Recent findings indicating that minority children are less likely than otherwise similar White children to be identified as having disabilities have been characterized as “controversial” (Council of Exceptional Children, 2015) and “provocative” (Samuels, 2015) and dismissed as flawed (Cohen, Burns, Riley-Tillman, & Hosp, 2015; Ford & Toldson, 2015; Skiba et al., 2016; Welner & Skiba, 2015; although see Morgan & Farkas, 2016a, 2016b). Some policymakers and researchers have questioned evidence of underidentification based on race or ethnicity in part because the findings have been based on nationally representative but smaller data sets than those collected by OSERS or OCR (U.S. Department of Education, 2016; Welner & Skiba, 2015).
Thus, replicating evidence of racial and ethnic disparities in disability identification is unusually pressing due to federal legislation, regulations, and policies that are justified based on increasingly contested empirical evidence (for a review, see Morgan et al., 2017). Analyses designed to estimate the extent to which over- or underidentification is occurring among otherwise similar children, particularly if based on larger nationally representative samples than those used to date, should help clarify the educational inequities that federal legislation, regulation, and policy should be addressing, including the extent to which U.S. schools may be racially discriminatory in their identification of children with disabilities (U.S. Department of Education OCR, 2016). For example, replicated evidence indicating that U.S. schools are failing to appropriately identify and provide services to minority children with disabilities would suggest the need to enhance Child Find regulations (i.e., the legal requirement that LEA locate, evaluate, and identify all children with disabilities) and referral practices. Although the U.S. Department of Education OCR (2016) expressly states that underidentification based on race or ethnicity is discriminatory and a civil rights violation, to what extent such underidentification currently occurs in the United States is unclear, particularly given the limited number of well-controlled studies that have analyzed individual-level data from nationally representative samples (Morgan et al., 2017). Conceptual-type replications should help address the recently identified lack of replication of novel findings by educational researchers (Makel & Plucker, 2014). 2 As recently put by Welner and Skiba (2015) when criticizing prior work reporting underidentification, “if these findings were to hold up, it would have serious practical consequences—it would mean that almost 20 years of federal policy, based on the evidence of overrepresentation of students of color, was just plain wrong.”
Analyses of very large nationally representative samples would extend the knowledge base in other important ways. For example, doing so should help clarify whether and to what extent underidentification for higher incidence but more subjective disabilities (e.g., LD, S/LI) is also occurring for lower incidence but less subjective conditions (e.g., autism, ID), including those that are of especially low prevalence (e.g., vision or orthopedic impairments, traumatic brain injury), as well as for a wider range of racial and ethnic groups (e.g., American Indians, students of multiple race or ethnicity). Historical analyses should help establish whether and to what extent racial and ethnic disparities in disability identification in the United States have been longstanding, including prior to and following legislative amendments to IDEA mandating additional federal- and state-level efforts to reduce minority children’s overrepresentation in special education.
Study’s Purpose
We evaluated whether and to what extent, among otherwise similar children, disability over- or underidentification based on race or ethnicity currently occurs in the United States. We analyzed nationally representative data from very large samples of schoolchildren characterized as otherwise similar in their clinical need for services as indicated by their academic achievement, as well as additional background characteristics (e.g., economic disadvantage, gender) and access to school-level resources. We also calculated racial/ethnic-specific (and, in addition, for Black and White males separately) disability identification rates at different levels across the academic achievement distribution. As a further replication, we examined the extent to which over- or underidentification based on race or ethnicity has occurred over time in the United States as evident in separate nationally representative samples.
Method
Data Set
We analyzed public school data from the National Assessment of Educational Progress (NAEP), the largest available nationally representative data set containing uniform test score information about the academic achievement of individual elementary and secondary students. These data have been collected periodically by the NCES since 1969 and include children in each state, the District of Columbia, and from schools associated with the Department of Defense (NCES, 2009). NCES uses a complex multistage sampling design to sample public schools from the comprehensive Common Core of Data (https://nces.ed.gov/ccd), which also includes newly formed public schools from select jurisdictions. Schools are grouped into strata based on characteristics related to achievement (e.g., median area income, minority enrollment) to improve reliability of the assessment results. On average, 30 to 60 students from each of 100 grade-eligible schools are sampled from each jurisdiction during each survey year (NCES, 2016). For each U.S. state, about 2,500 students attending about 100 schools in each grade are assessed (for detailed sampling information, see NAEP, 2011). The analyses incorporated weighting to account for the complex sample design and nonresponse in producing nationally representative estimates. Children’s background information was available in NAEP’s restricted-access data files.
Samples
We analyzed data from the most recently released NAEP surveys that included a reading achievement assessment. Sample sizes for the main analyses were 183,570, 165,540, and 48,560 for the most recent 4th-, 8th-, and 12th-grade cross-sectional NAEP reading achievement surveys, respectively. (Reported sample sizes were rounded to the nearest 10 following NCES procedures protecting participant confidentiality.) (As an additional robustness check, we replicated our analyses using mathematics rather than reading as an achievement control.) The most recently available surveys were from 2013 for 4th and 8th graders and from 2009 for 12th graders. We included only cases with complete data on all analysis variables (which constituted more than 90% of each sample). Sample sizes varied depending on the survey waves and grades. Children identified as having disabilities and/or English language learners (ELL) were provided with testing accommodations, including extra testing time and individual instead of group test administration. As a result of these accommodations, the percentages of children included in the NAEP surveys from 1998 through 2009 who had disabilities or who were ELL were very high and ranged from 96% to 98% and 98% to 99%, respectively. Table 1 displays descriptive statistics of the study’s NAEP samples. Consistent with U.S. demographic trends, the relative percentages of children who are Black, Hispanic, or ELL decreased and that of White children increased from 4th to 12th grade.
Descriptive Statistics of the National Assessment of Educational Progress 4th-, 8th-, and 12th-Grade (Reading) Samples

Note. Unless otherwise noted, percentages are given. Percentages of rates and races may not add to 100% because of rounding.
Measures
Disability status
The study’s criterion variables were (a) whether or not participating children were receiving special education services due to an identified IDEA-eligible disability and (b) the specific IDEA-eligible disability conditions for which they had been identified. Disability status was indicated by an Individualized Education Program (IEP) in school records. Children’s primary disability condition was also reported, and conditions examined included ED, autism, other health impairment (OHI), SLD, SLI, ID, or ADHD. 3 The OHI condition included many children with ADHD but also children with other types of disabilities, including anxiety, seizure disorders, diabetes, asthma, and epilepsy. We combined additional low-prevalence impairments in an “other” category, including impairments in vision, hearing, brain function, developmental delay, or orthopedic function.
Race or ethnicity
Children self-reported which race or ethnicity categories best described them. Possible answers included: (a) White, (b) Black or African American, (c) Asian, (d) American Indian or Alaska Native, and/or (e) Native Hawaiian or other Pacific Islander. Children were also asked whether they are Hispanic or Latino. We combined children who reported any type of Hispanic ethnicity into one category. Therefore, our analyses included the following categories: (a) White, (b) Black, (c) Hispanic, (d) Asian, (e) American Indian/Alaska Native, (f) Native Hawaiian/Pacific Islander, or (g) multiple races.
Academic achievement
We statistically controlled for individual-level academic achievement. We primarily present findings controlling reading achievement. Children completing the NAEP reading assessment read selected grade-appropriate literary and informational text passages and answered multiple-choice and constructed-response questions. Specific reading skills targeted in the assessments included locating and recalling information, integrating and interpreting written material, and critiquing and evaluating text content. The assessments also measured knowledge of specific word meaning as used in text passages and overall passage comprehension (NCES, 2009, 2013).
NAEP’s achievement measures display very strong psychometric properties, including very high reliability. For example, item-by-item interrater agreement on NAEP’s 2009 reading and mathematics assessments (i.e., the most recent survey wave during which the 4th-, 8th-, and 12th-grade assessments were concurrently administered) was 86% and 97%, respectively (NAEP, 2017b). Cohen’s kappa and intraclass correlation values were in the range of .7 to .9. Good reliability is also evident across the survey waves, suggesting consistency in scoring over time. For example, kappa and interclass correlations between the 2009 and 2011 4th-grade reading and mathematics achievement surveys were .81, .77, .92, and .95, respectively (NAEP, 2017a). A comprehensive review of the technical quality of the NAEP achievement assessments (U.S. Department of Education, Office of Planning, Evaluation and Policy Development, 2009) concluded that their psychometric characteristics were consistent with professional standards for testing and provided “strong and supportive evidence of technical quality, especially with regard to estimates of score reliability and standard errors of measurement” (p. 1-7). NCES analyzed for differential item functioning and conducted additional item-level reviews to ensure the NAEP assessments were unbiased.
NAEP provided a series of plausible scores with which to more precisely estimate children’s true score on the various achievement measures. The number of plausible scores per child varied throughout NAEP’s administration and ranged from 5 to 20 scores in the years analyzed in this study. In the present analyses, we separated each plausible score and all relevant variables into separate data files. We analyzed each file separately and then combined the coefficients using multiple imputation methods (Little & Rubin 2002).
Additional covariates
We statistically controlled for additional individual- and family-level confounds. Because poverty has been identified as a potential confound of minority overrepresentation (e.g., MacMillan & Reschly, 1998), we included whether the children were eligible for the National School Lunch Program. We considered children as from low-income families if they had qualified to receive either free- (i.e., below 130% of the federal poverty level) or reduced-price (i.e., 130%–185% of the poverty level) lunches. We also statistically controlled for whether the children were ELL.
Analyses
We conducted a series of logistic regression analyses that were subsequently combined using SAS 9.4 and Proc MIANALYZE to implement multiple imputation. This combined the covariate-adjusted odds ratios from the separate data sets into a single set of estimates (Rubin, 1987; for further technical discussion, see Wu, 2005). Tables 2 through 4 display the results of logistic regressions predicting whether children were receiving special education services for any identified disability. We also report odds ratios for specific disability conditions. For Tables 2, 3, and 4, Model 1 included only children’s race or ethnicity. Model 2 added children’s composite reading achievement. Model 3 included only children’s gender, free or reduced-price lunch eligibility, and ELL status, thereby showing the result of failing to control academic achievement. Model 4 simultaneously includes Models 2 and 3’s confounds as well as school fixed effects. Consequently, the Model 4 regression models estimate the risk of disability identification among children attending the same schools as well as those displaying the same levels of academic achievement, gender, family economic background, and ELL status.
Logistic Regression Odds Ratio Coefficients, National Assessment of Educational Progress, 2013, Fourth-Grade Reading, N = 183,570 Students, 7,530 Schools
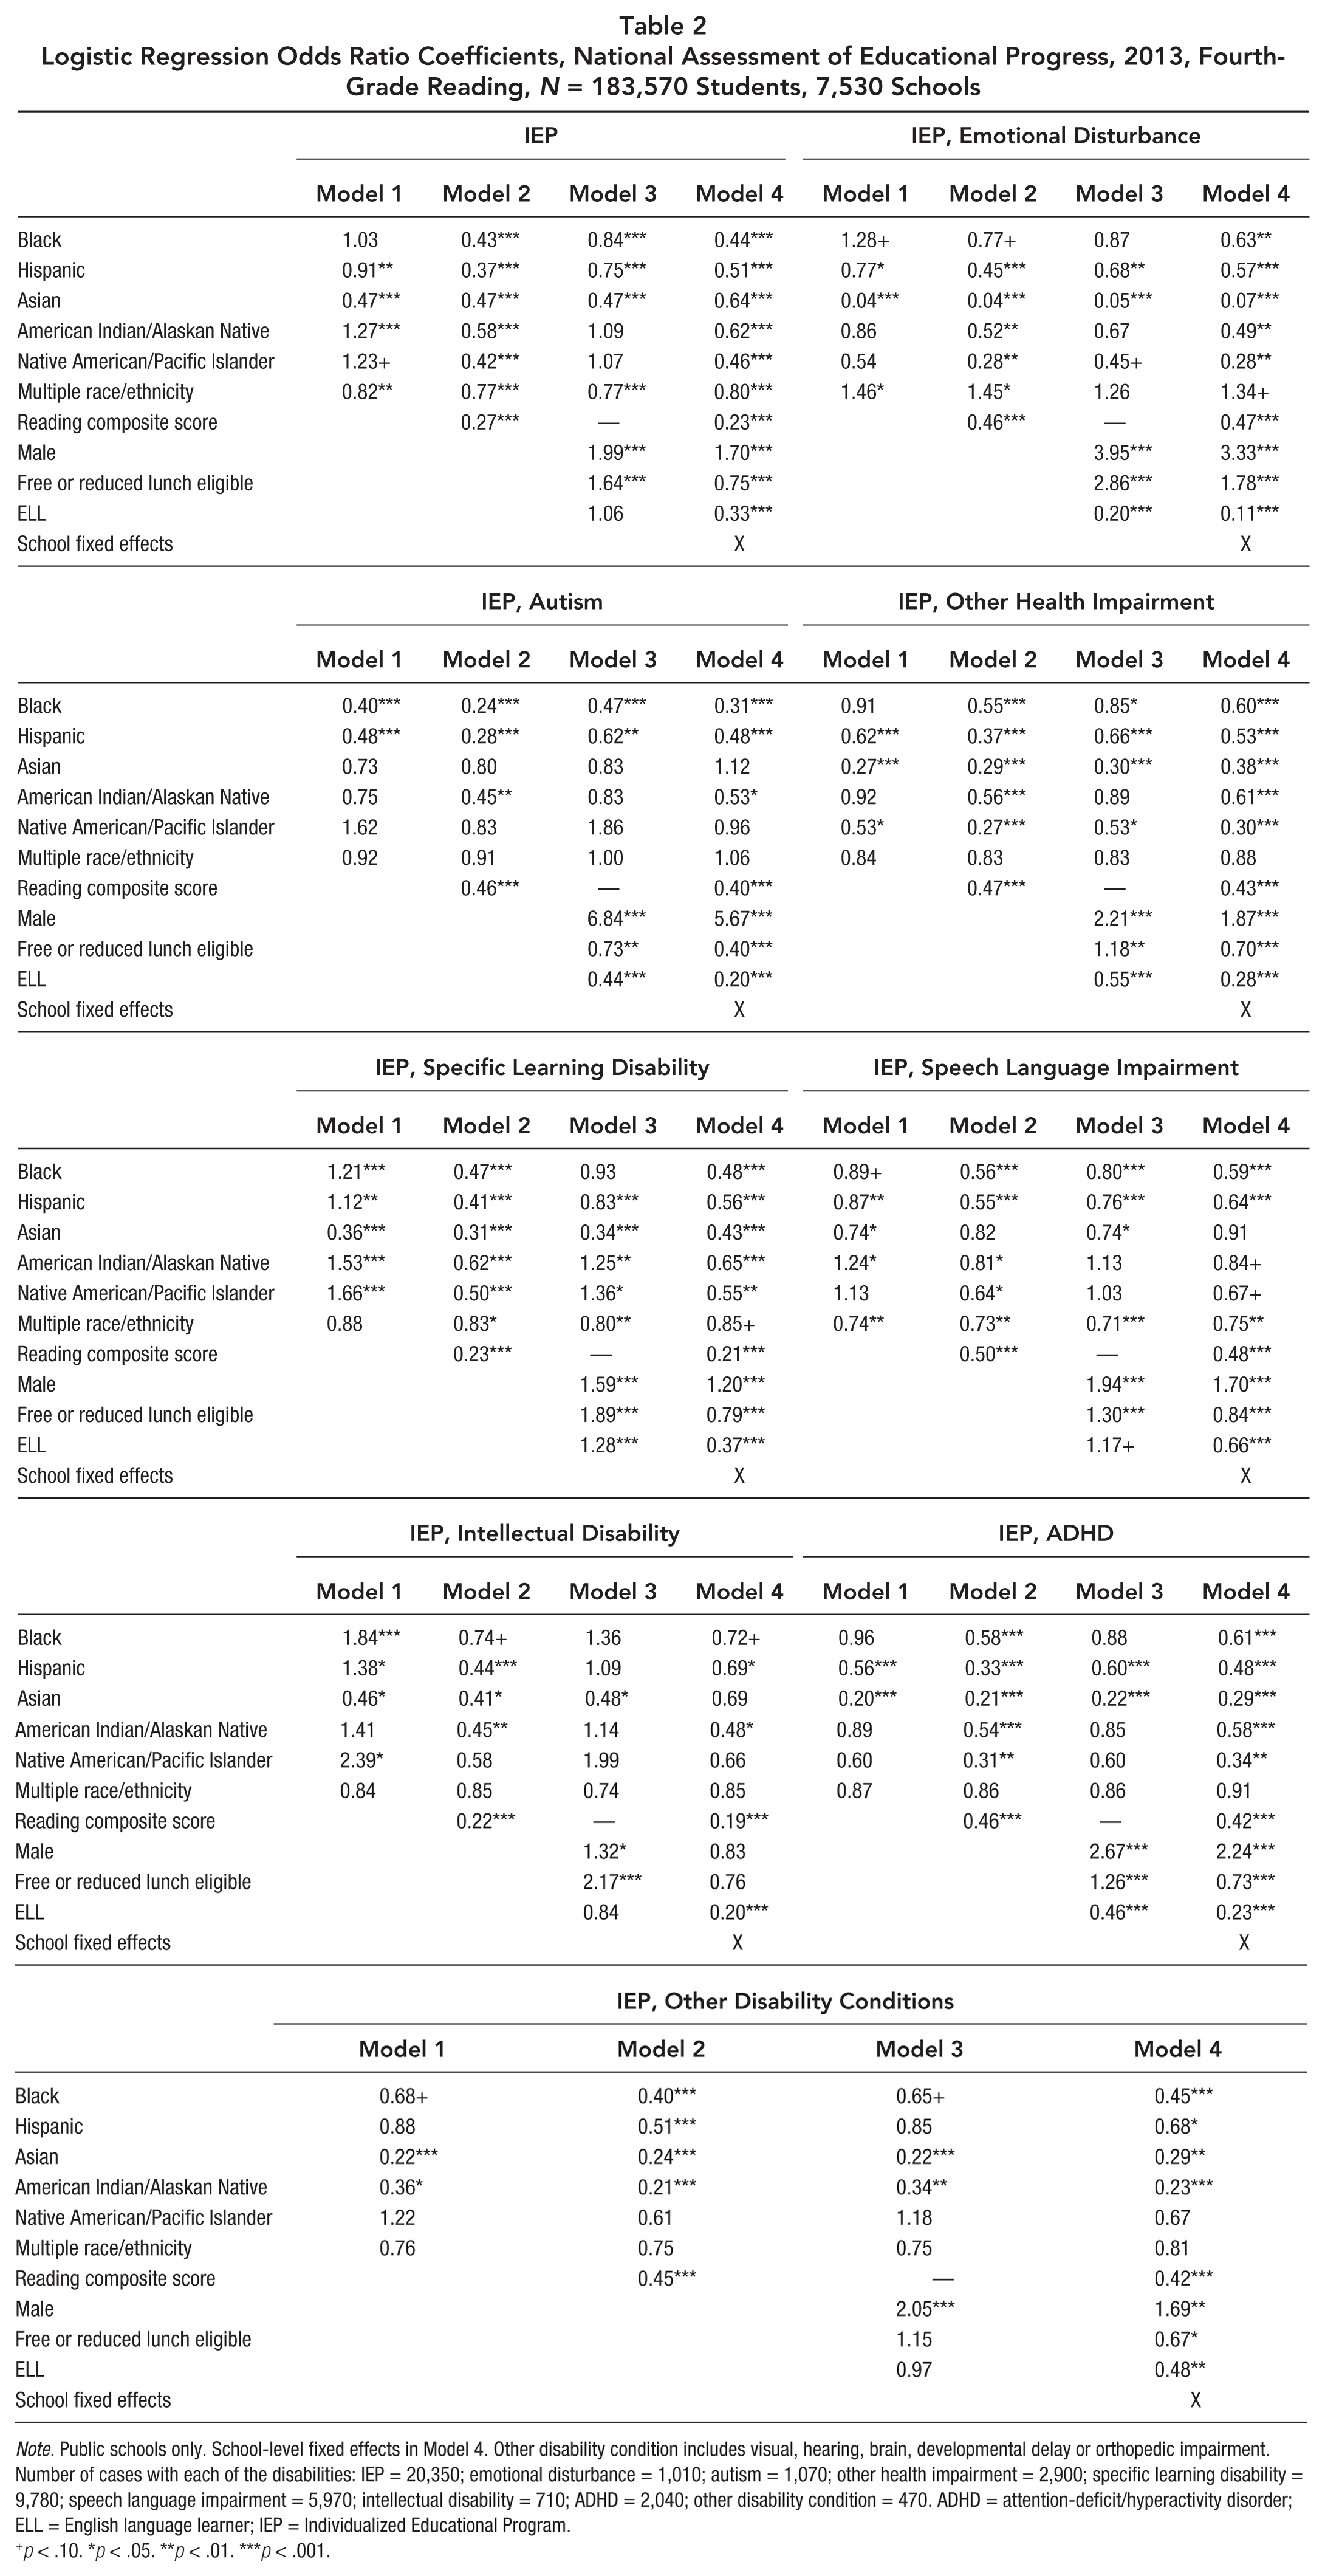
Note. Public schools only. School-level fixed effects in Model 4. Other disability condition includes visual, hearing, brain, developmental delay or orthopedic impairment. Number of cases with each of the disabilities: IEP = 20,350; emotional disturbance = 1,010; autism = 1,070; other health impairment = 2,900; specific learning disability = 9,780; speech language impairment = 5,970; intellectual disability = 710; ADHD = 2,040; other disability condition = 470. ADHD = attention-deficit/hyperactivity disorder; ELL = English language learner; IEP = Individualized Educational Program.
p < .10. *p < .05. **p < .01. ***p < .001.
School fixed effects are equivalent to adding a dummy variable for each school to the regression equation. Doing so results in the relations among the variables being estimated using only the variation of the variables within each school. The school dummy variables remove the variation occurring between schools. That is, the analysis is based on variables that have had their school mean values subtracted out (for a discussion, see Murnane & Willett, 2011, Chapter 7). This removes from the analysis any school-level factors that, on average, raise or lower the schoolwide average of the dependent variable (in this case, the probability of disability identification). Thus, for example, if the average academic achievement of children in a school affects the school’s disability identification rate and if Black and Hispanic children tend to be concentrated in schools with lower academic achievement, this school-level effect has been removed from these fixed effects estimates of racial differences in disability identification.
We also took advantage of the very large NAEP sample sizes to conduct a tabular analysis of race or ethnic disproportionality separately within each decile of the reading achievement distribution. These results, which do not require regression analysis, allow for nonlinear effects, and are completely data driven, are presented for fourth graders in Table 5. (We observed similar patterns for reading achievement in other grades and survey years as well as mathematics achievement across these grades and years.) To examine for disparities between similarly achieving Black and White males, Table 6 shows the decile-specific disability identification rates for each of these groups separately in 4th, 8th, and 12th grade. Table 7 replicates the analyses of Tables 2 through 4 for special education service receipt for 8th-grade reading data sets back to 2003 when the NAEP sample was sufficiently large (i.e., larger than 40,000) and also included the IEP variable. Figure 1 plots these results. The patterns were similar for other grades and mathematics achievement. (As a robustness check, Supplementary Table A1 repeats these analyses for 8th grade using mathematics achievement. Supplementary Figure 1 plots these results. Supplementary Tables A2–A7 display regression models using mathematics instead of reading as the achievement control. All supplementary materials are available on the journal website.).

Odds ratios from logistic regressions of having an Individualized Education Program, 2003–2013 National Assessment of Educational Progress eighth graders, reading achievement test scores controlled (Model 2), Separately by race/ethnicity (full regressions reported in Table 7)
Results
Racial and Ethnic Disparities in Disability Identification in Fourth Grade
Table 2 presents logistic regression odds ratio (OR) coefficients predicting special education placement as well as identification with specific disabilities for fourth graders in 2013. Model 1 indicated that without statistical controls, Black children had slightly but not statistically significantly higher odds (OR = 1.03) of receiving special education services for identified disabilities than White children. Hispanic and Asian children had significantly lower odds of disability identification than White children. Children who are American Indian/Alaskan Native had significantly higher odds of disability identification (OR = 1.27).
Model 2 controlled for children’s reading achievement. This was a very strong predictor of disability identification. The odds of disability identification declined by 73% (1 – 0.27) with each standard deviation increase in reading achievement. Schools were more likely to identify those children who were academically struggling as disabled. (Because individual student-level NAEP test scores were not available to teachers, this represented an independent check that disability identification was strongly based on children’s actual academic struggles.) With reading achievement statistically controlled, minority children were consistently less likely to be identified as disabled than White children in fourth grade. Particularly noteworthy were the adjusted odds ratios of 0.43 and 0.37 for children who are Black or Hispanic, respectively, indicating that they had odds of disability identification that were 57% (1 – 0.43) and 63% (1 – 0.37) lower than those of similarly achieving children who are White.
Model 3 controlled a set of sociodemographic variables—gender, eligibility for free or reduced-price lunch, and ELL status—but not achievement. Doing so allowed us to contrast a “sociodemographics only” covariate model with an “achievement only” covariate model. Males and low-income children were significantly more likely to be identified as having disabilities. As in Model 2, children who are Black, Hispanic, or Asian were significantly less likely than children who are White to be so identified. However, Model 3’s minority underidentification estimates were not nearly as large as those in Model 2. This may explain why, particularly when analyzing state- or district-level samples and without controls for individual-level achievement, minority children’s underidentification has typically not been observed (e.g., Skiba et al., 2005; Sullivan & Bal, 2013).
Table 2’s Model 4 simultaneously controlled for individual-level sociodemographic factors and achievement as well as school fixed effects. Consequently, Model 4’s estimates were not confounded by compositional differences between the schools (e.g., relative school-level resources, enrollment, and quality that may be correlated with children’s race, ethnicity, or other characteristics). Thus, Model 4 was the most rigorous one because it provided the best estimate of the disability identification processes occurring within each school, unbiased by any correlations between children’s characteristics and those of the school they attend. It showed sizeable underidentification, with significant odds ratios of .44 and .51 for Black and Hispanic children, respectively. These results were similar to those of Model 2 and once again indicated underidentification for children who are Black, Hispanic, Asian, American Indian, or of multiple race and ethnicity. Model 4 also indicated that female, low-income, or ELL students are also less likely to be identified as having disabilities.
Table 2’s remaining panels replicate these regression models for specific disability conditions. For ED, Model 1 indicated that children who are Black had elevated odds of identification (OR = 1.28), which was marginally significant at the .10 level. However, and following covariate adjustment, statistically and practically significant (OR = .63 in Model 4) underidentification was evident. The other coefficients indicated the usual pattern of underidentification of Hispanic children, partially explained by ELL status, and also indicated underidentification of females. Children who are Asian were particularly unlikely to be identified as being ED. Low-income children were more likely identified, possibly due to less effective behavioral management and harsher parenting more often occurring in these households (e.g., Bøe et al., 2014; Morgan, Li, et al., 2016).
Table 2’s third panel shows regression results predicting autism identification. Children who are Black or Hispanic had particularly low odds of identification even without controls for reading achievement. Higher achievement was associated with significantly decreased odds of identification. Females had much lower odds of autism identification, as did those who are low-income or ELL.
Table 2’s fourth panel shows results predicting OHI. Reading achievement was again strongly and significantly related to reduced odds of identification. With this statistical control, racial and ethnic minority children had lower odds of OHI identification than otherwise similar White children. Among Model 4’s otherwise similar children, those who are female, low-income, or ELL were less likely to be identified.
The fifth panel of Table 2 indicates the odds ratios associated with identification with SLD. In Model 1, without statistical controls, children who are Black, Hispanic, and from both groups of American Indians had significantly higher odds than Whites of being identified with SLD. However, Model 2 shows that children’s reading achievement was very strongly associated with this risk. A one standard deviation increase in reading achievement was associated with a 77% (1 – 0.23) decrease in the odds of being identified as having SLD. Statistically controlling for children’s reading achievement resulted in the odds for minority children becoming significantly lower than for White children. In Model 3, less rigorous control for individual-level sociodemographics but not achievement indicated that children who are Black and Hispanic were still underidentified, but to a lesser degree than in Models 2 and 4, and Model 3’s odds ratio for children who are Black was not significant. Model 4 again indicated that racial and ethnic minority children were significantly less likely to be identified as having SLD than otherwise similar White children. Model 4 also indicated that children who are female, low-income, or ELL were less likely to be identified as having SLD.
Table 2’s sixth panel shows the odds ratios from models predicting SLI. Reading achievement was again significantly and negatively associated with being identified as having SLI. Among similarly achieving children in Model 2, those who are racial and ethnic minorities were less likely to be so identified. This was also the case, but with a much smaller and statistically nonsignificant estimate of underrepresentation in Model 3, where individual-level achievement was not controlled. (This once again indicated that failure to control for individual academic achievement may produce seriously biased estimates of disparities in disability identification.) In Model 4, the most rigorous model, sizeable underidentification attributable to race or ethnicity was again evident, as was underidentification of children who are female, from low-income families, or ELL.
Table 2’s remaining three panels (i.e., for ID, ADHD, and other disability conditions) replicated the aforementioned findings. Once reading achievement was statistically controlled, children who are racial or ethnic minorities were less likely to be identified as having these disabilities than otherwise similar children who are White. Across Table 2’s regression models, academic achievement was always strongly and negatively associated with the odds of disability identification. The strongest associations occurred for SLD and ID. For ID, underidentification attributable to race or ethnicity was not evident until individual-level achievement was statistically controlled.
Racial and Ethnic Disparities in Disability Identification in Eighth Grade
Table 3 replicates Table 2’s fourth-grade findings with data from the most recently (i.e., 2013) available eighth-grade NAEP reading assessment. The results were similar to those in Table 2. Models 2 and 4 indicate reading achievement was negatively associated with the odds of disability identification in general as well as for specific conditions, with the strongest associations again being for SLD and ID. With reading achievement statistically controlled, racial or ethnic minority children had consistently lower odds of disability identification than similarly achieving White children. Only Model 3, where individual-level achievement was not controlled, sometimes indicated minority overrepresentation.
Logistic Regression Odds Ratio Coefficients, National Assessment of Educational Progress, 2013, Eighth-Grade Reading, N = 165,540 Students, 6,180 Schools
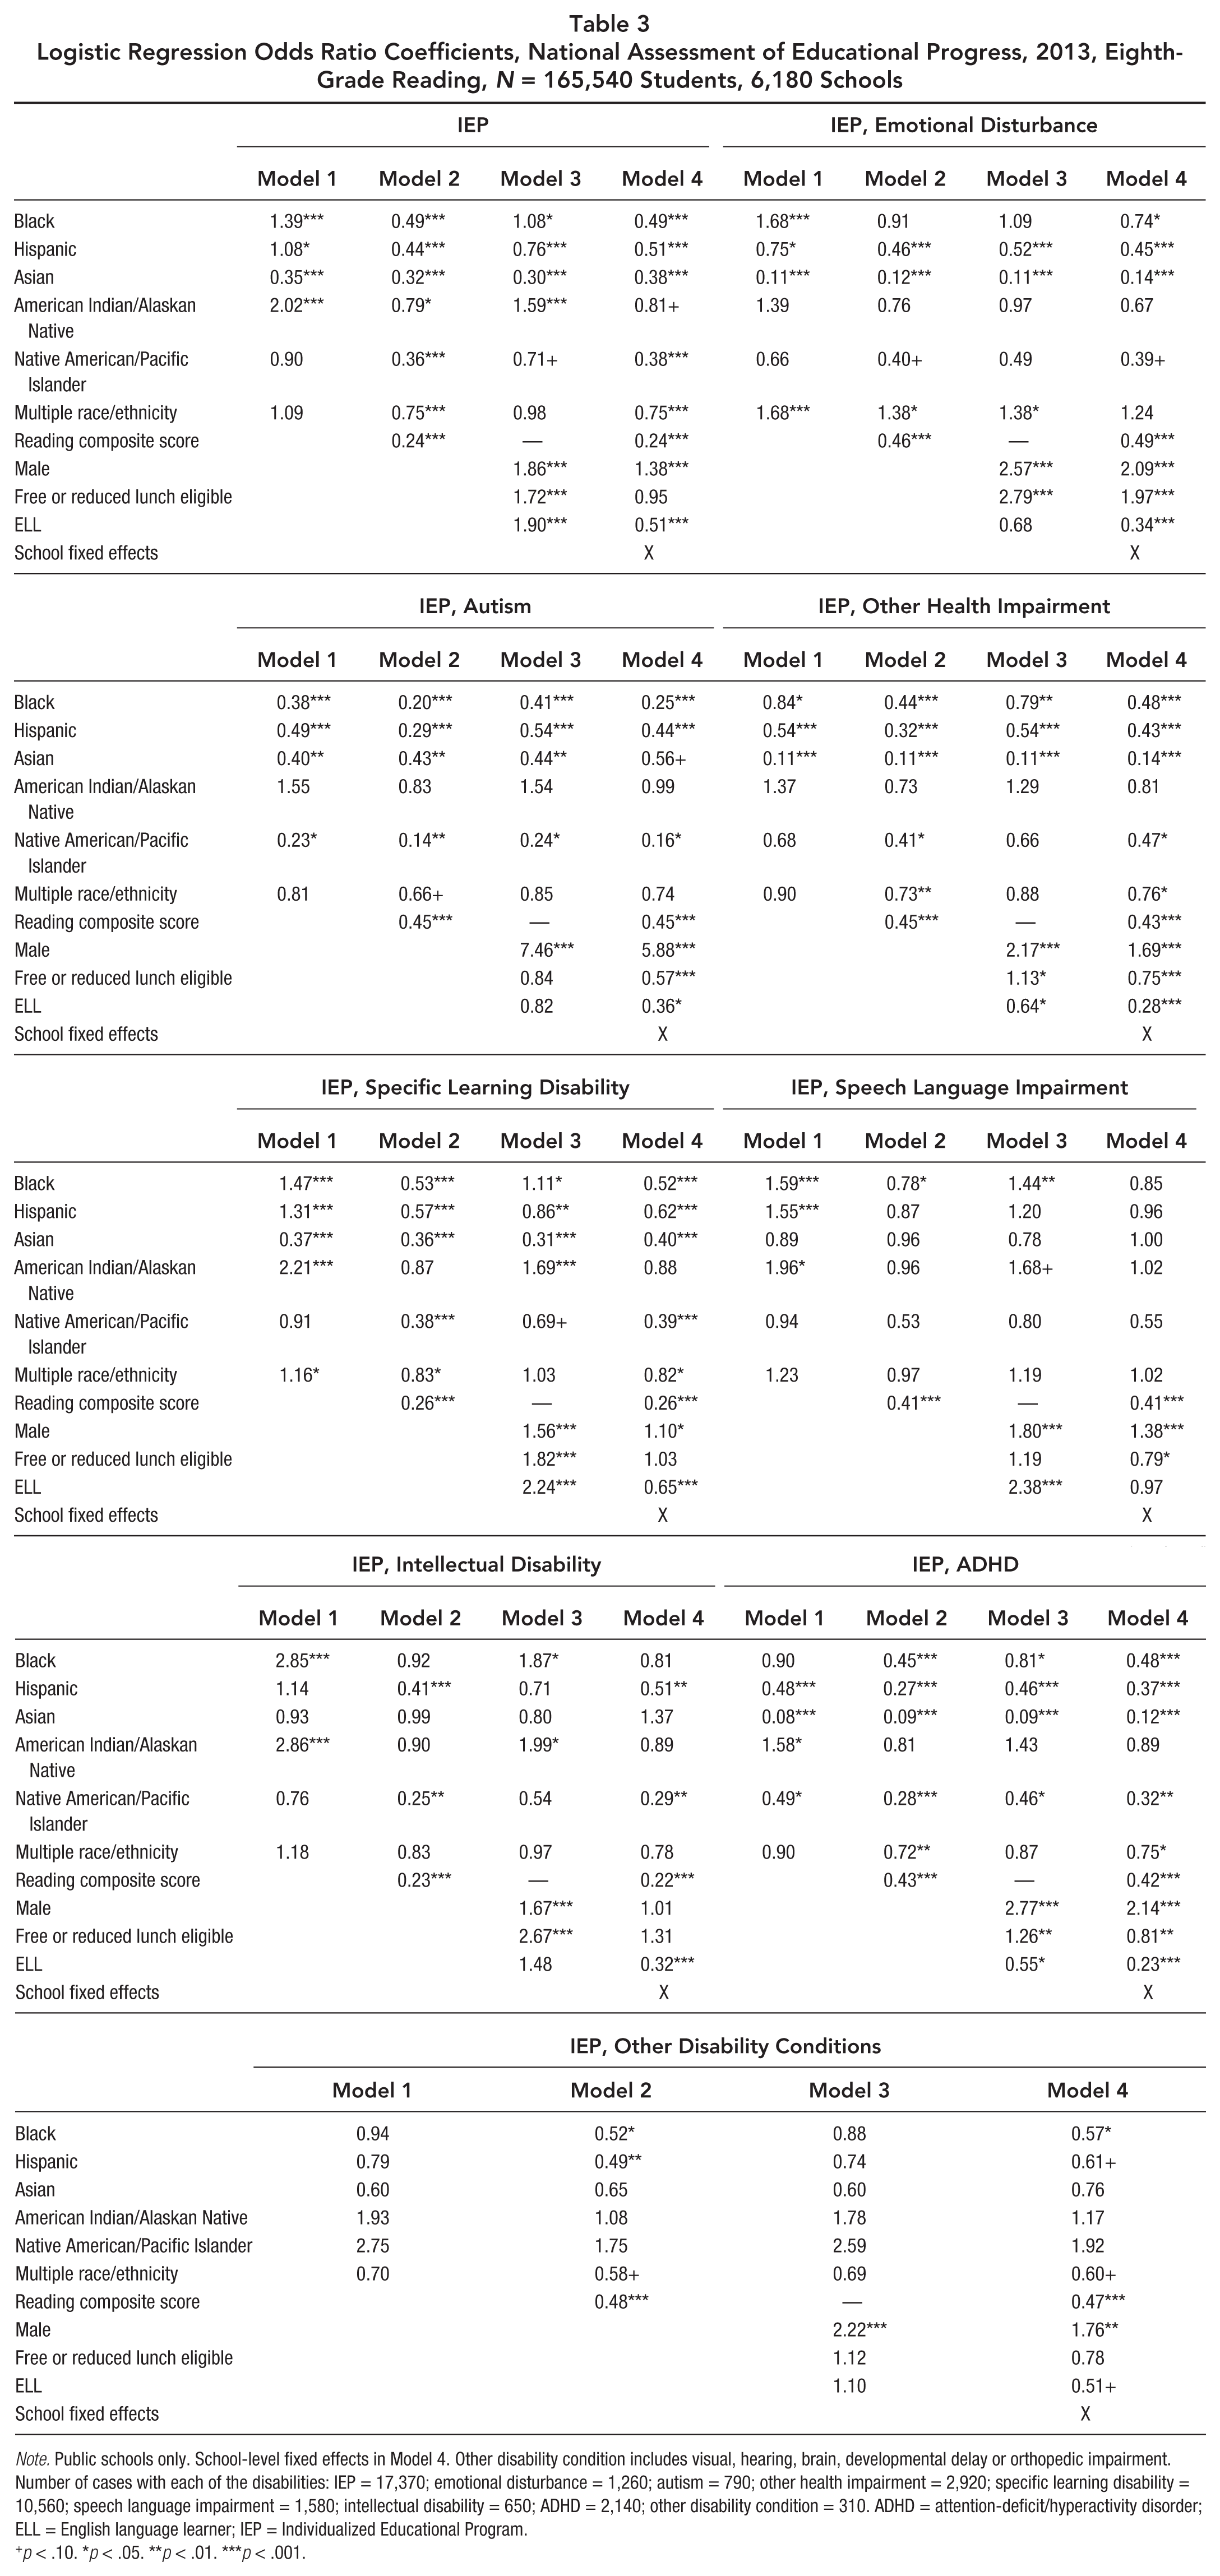
Note. Public schools only. School-level fixed effects in Model 4. Other disability condition includes visual, hearing, brain, developmental delay or orthopedic impairment. Number of cases with each of the disabilities: IEP = 17,370; emotional disturbance = 1,260; autism = 790; other health impairment = 2,920; specific learning disability = 10,560; speech language impairment = 1,580; intellectual disability = 650; ADHD = 2,140; other disability condition = 310. ADHD = attention-deficit/hyperactivity disorder; ELL = English language learner; IEP = Individualized Educational Program.
p < .10. *p < .05. **p < .01. ***p < .001.
Racial and Ethnic Disparities in Disability Identification in 12th Grade
Table 4 replicates Tables 2 and 3’s 4th- and 8th-grade findings using the 12th-grade NAEP reading achievement data from 2009. The sample size, N = 48,560, was smaller than for Tables 2 and 3 but still much larger than samples including individual-level data in prior studies. These data were also useful because they, when analyzed in conjunction with the 4th- and 8th-grade surveys, allowed for an examination of racial disparities in disability identification across elementary, middle, and high school. However, the smaller sample size, combined with changing identification trends as children became older, which greatly reduced the number identified with some disabilities (e.g., SLI), meant we were able to complete analyses only for disability identification generally and three specific conditions.
Logistic Regression Odds Ratio Coefficients, National Assessment of Educational Progress, 2009, 12th-Grade Reading, N = 48,560 Students, 1,490 Schools
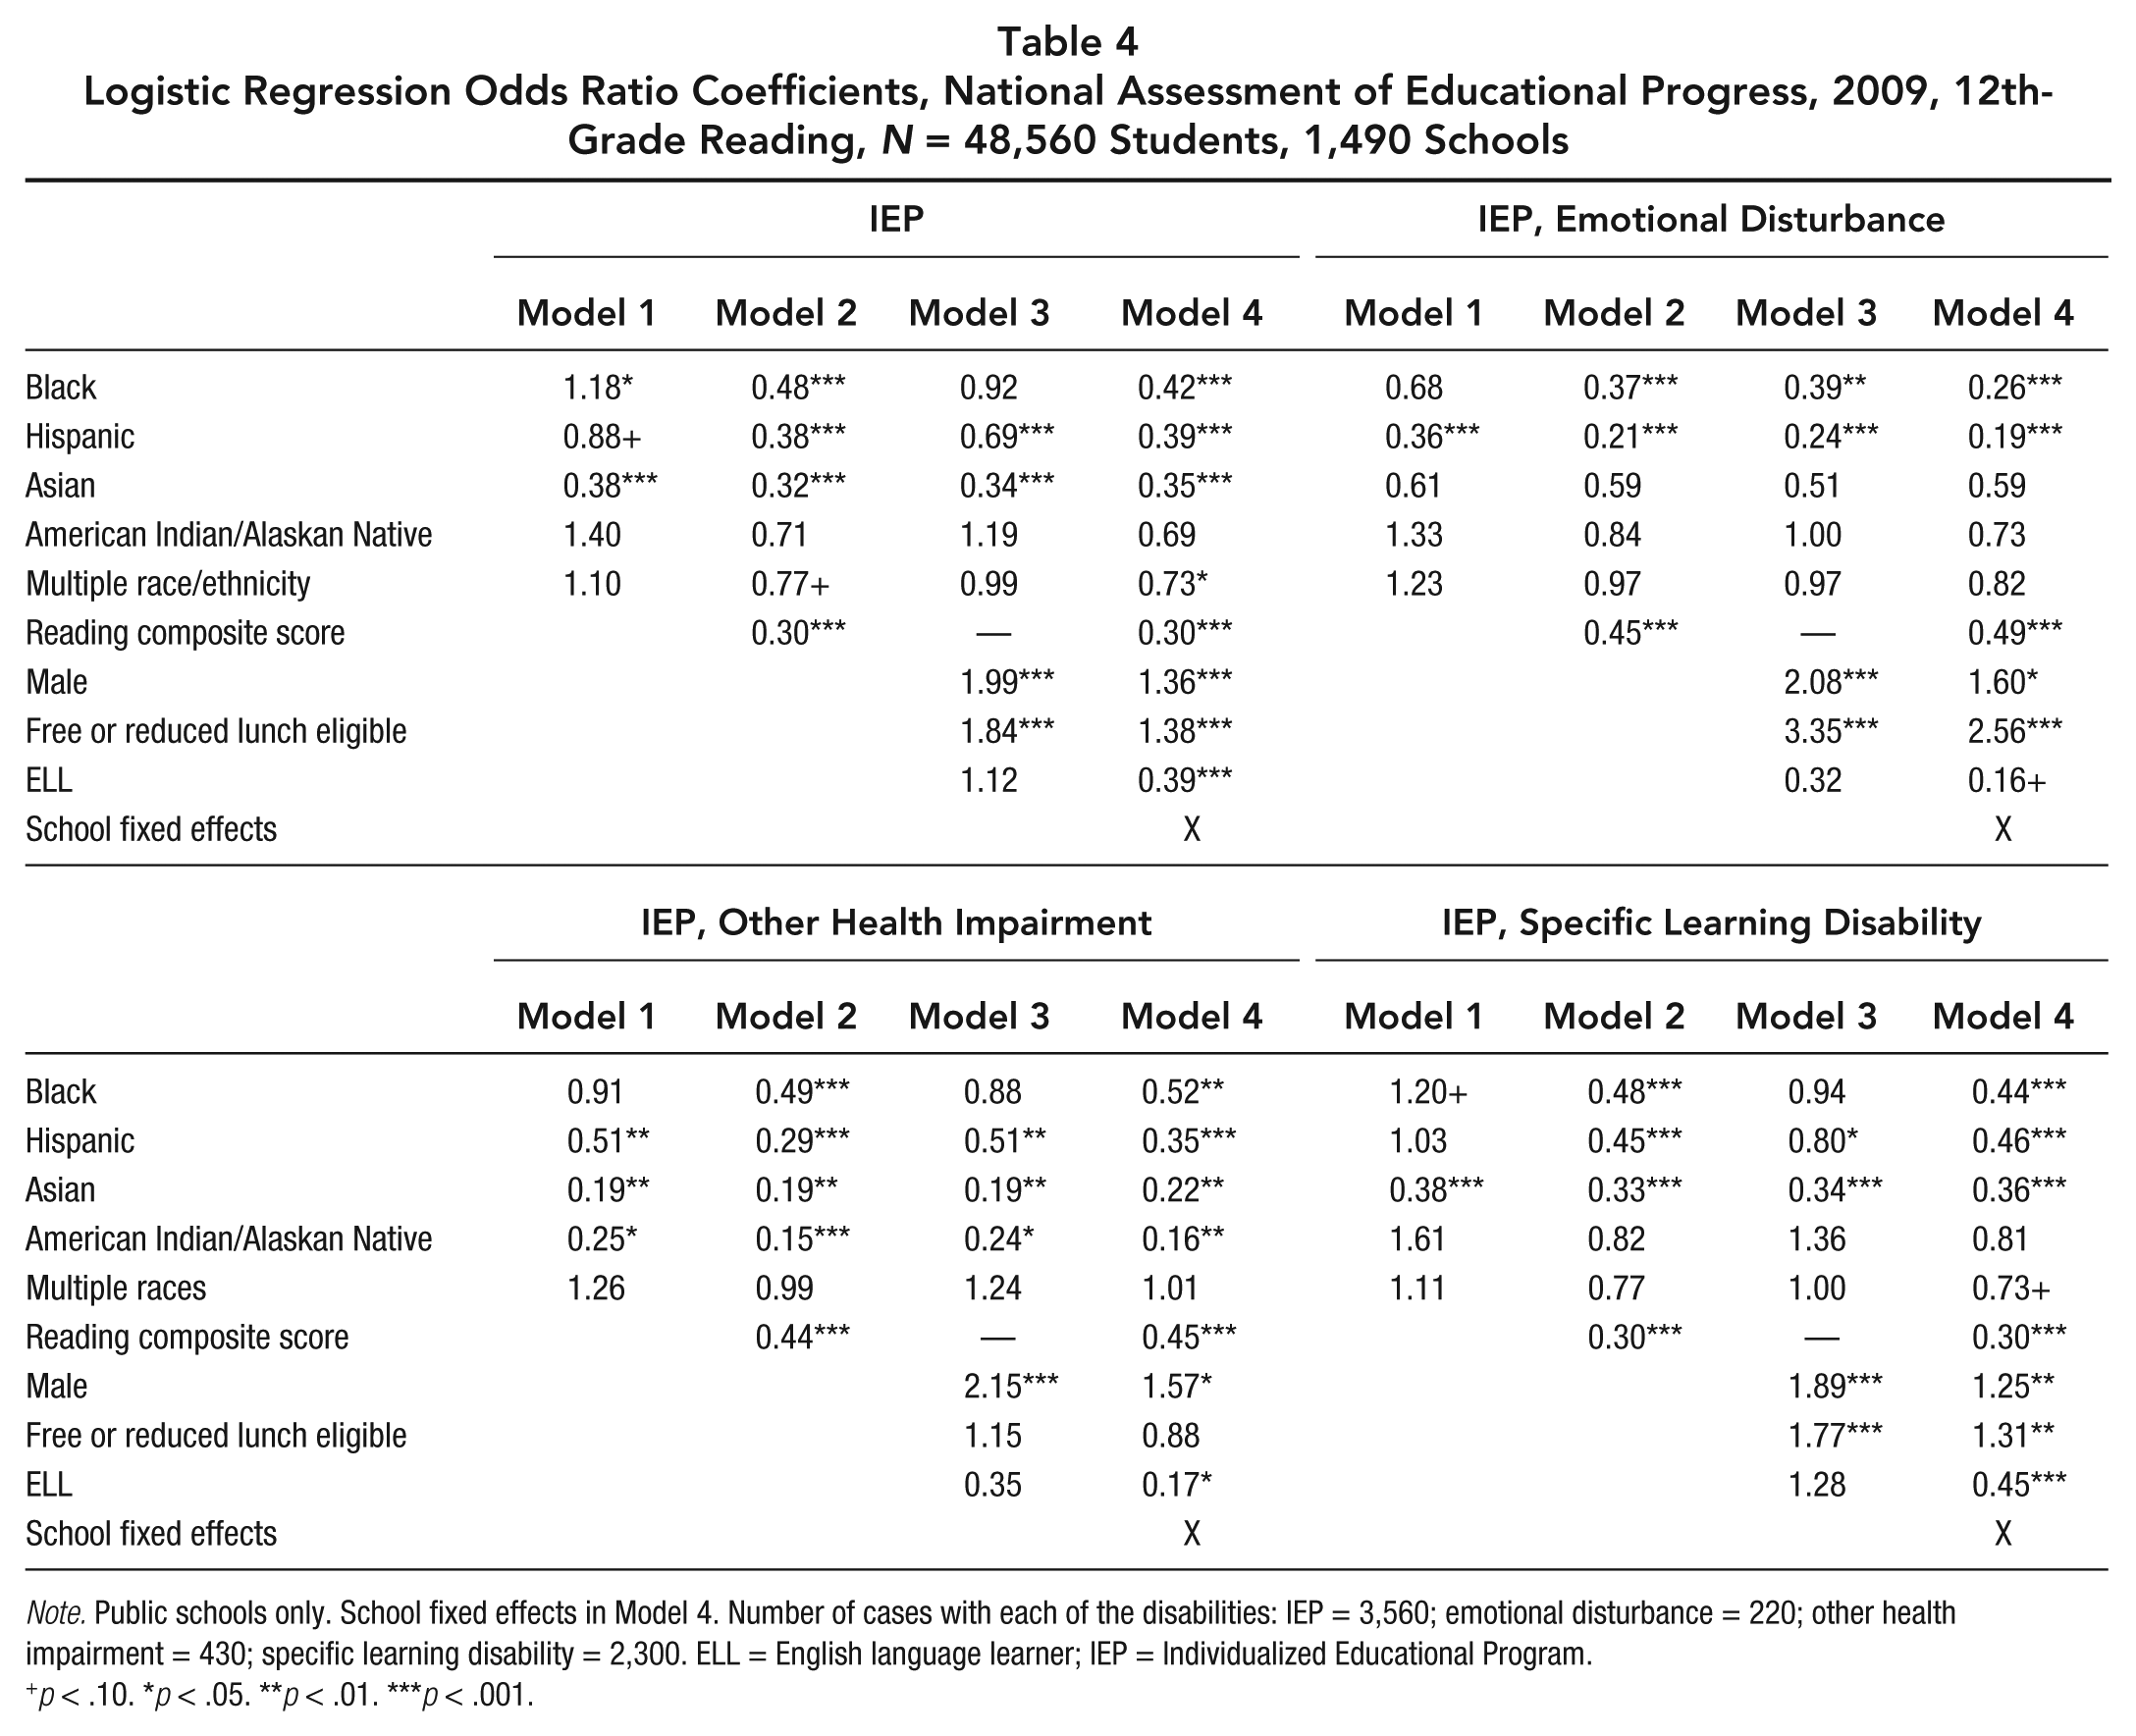
Note. Public schools only. School fixed effects in Model 4. Number of cases with each of the disabilities: IEP = 3,560; emotional disturbance = 220; other health impairment = 430; specific learning disability = 2,300. ELL = English language learner; IEP = Individualized Educational Program.
p < .10. *p < .05. **p < .01. ***p < .001.
As in Tables 2 and 3, Table 4’s 12th-grade estimates show racial and ethnic minority children were less likely to be identified as having disabilities than similarly achieving White children. The 12th-grade results, as with the 4th- and 8th-grade results, failed to provide any support for overidentification attributable to children’s race or ethnicity. The supplementary tables (Tables A2-A4, available on the journal website) replicate these calculations using mathematics rather than reading as the achievement covariate. Underidentification attributable to race or ethnicity was evident regardless of whether the achievement control was for reading or mathematics.
Racial and Ethnic Disparities in Disability Identification Across the Fourth-Grade Achievement Distribution
Table 5 uses simple tabulations to test for minority over- or underidentification at each specific decile of the fourth-grade reading achievement distribution. That is, separately for the group of children scoring within each decile of this distribution, we computed the percentage of each racial or ethnic group with an IEP. Among children whose reading achievement placed them in the lowest 10% of all scores—and so were displaying levels of achievement often considered indicative of potentially having a disability—fully 74% of White but only 44% of Black, 43% of Hispanic, 34% of Asian, 48% of American Indian, 43% of Pacific Islander, and 66% of multiracial children were receiving special education services due to identified disabilities. Each of these identification rates was statistically significantly different from that for White children. This pattern of higher disability identification rates for White children was evident throughout the reading achievement distribution.
Proportion of Racial, Ethnic Group with IEP, by Test Score Decile, 2013 National Assessment of Educational Progress, Fourth Grade, Test Score = Reading (N = 184,800 Students)
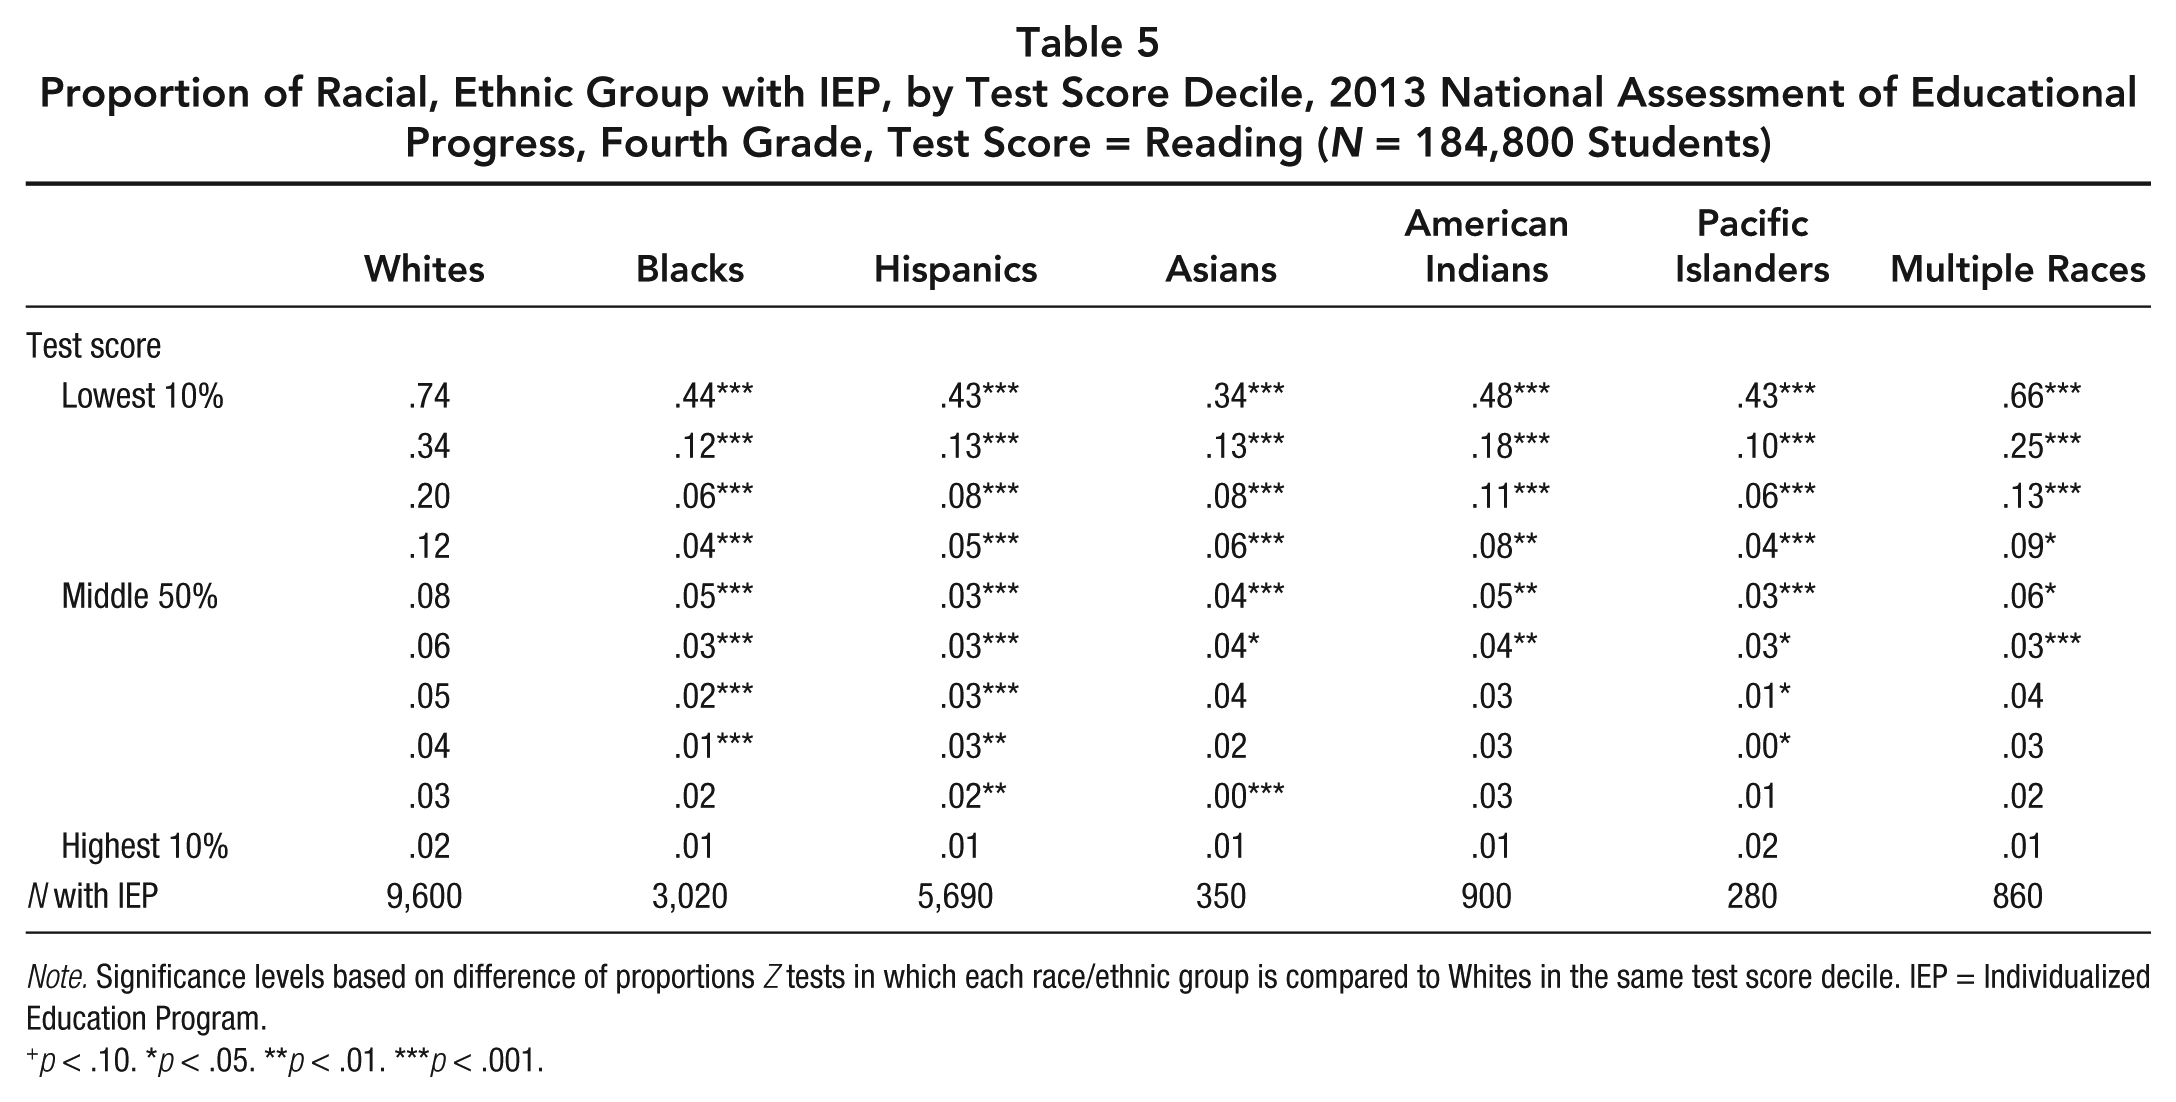
Note. Significance levels based on difference of proportions Z tests in which each race/ethnic group is compared to Whites in the same test score decile. IEP = Individualized Education Program.
p < .10. *p < .05. **p < .01. ***p < .001.
Disparities in Disability Identification Among Similarly Achieving Black and White Males
We next added interactions of race or ethnicity and gender to the Model 3 regressions in Tables 2 through 4. These interactions were consistently nonsignificant. To examine this in more detail, we focused on Black males, a group that has been hypothesized to be at especially high risk for overidentification (Ford & Toldson, 2015; Grant, 1992; Harry & Anderson, 1997). Table 6 shows the disability identification rates for White and Black males at each of the reading achievement deciles from the most recent 4th-, 8th-, and 12th-grade NAEP surveys.
Proportion of White and Black Males With IEP, by Test Score Decile, 4th-, 8th-, and 12th-Grade National Assessment of Educational Progress, Test Score = Reading
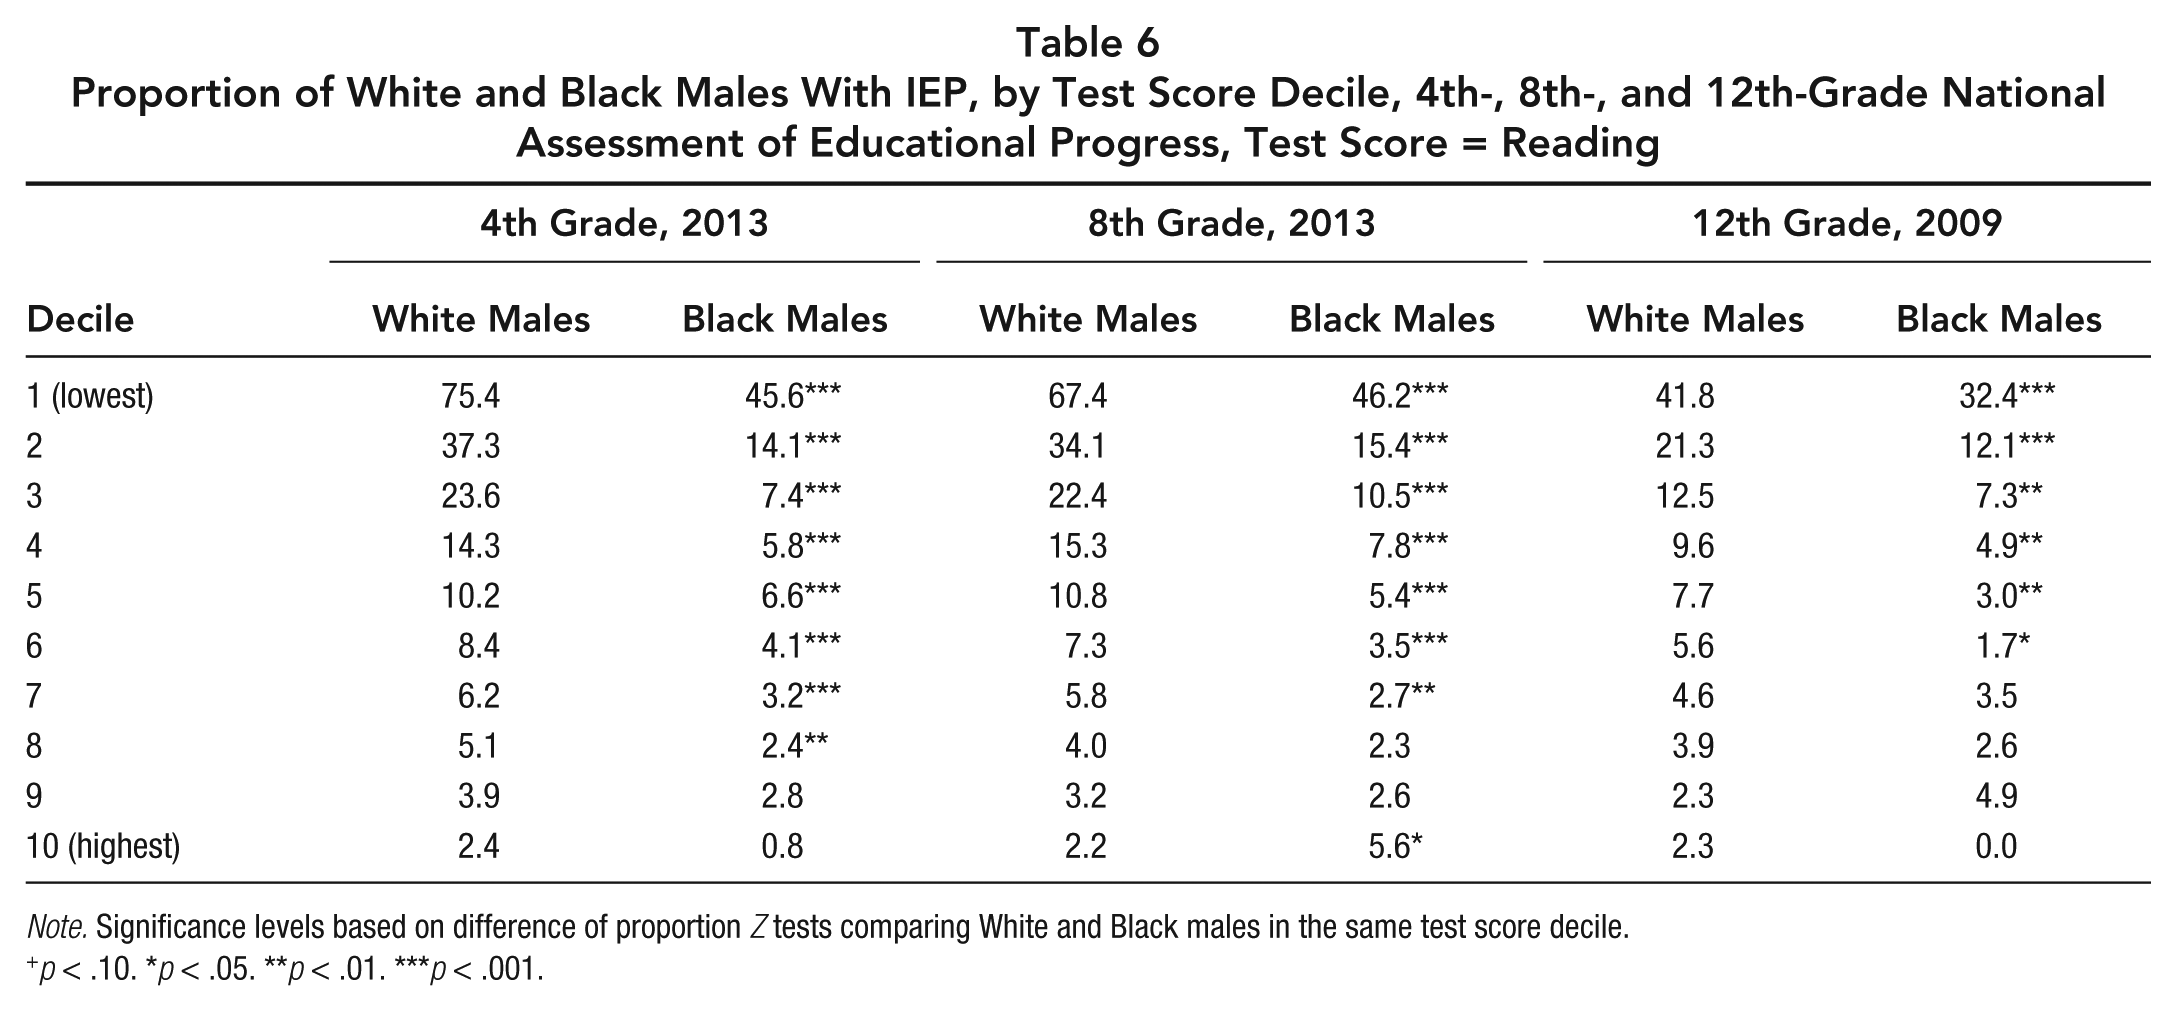
Note. Significance levels based on difference of proportion Z tests comparing White and Black males in the same test score decile.
p < .10. *p < .05. **p < .01. ***p < .001.
Among fourth graders in the lowest reading achievement decile, 75.4% of males who are White but only 45.6% of males who are Black were receiving special education services due to identified disabilities. This underidentification of Black males was very similar to that reported in Table 5 for all Black and White children in the lowest decile. Continuing up the deciles for fourth graders, we repeatedly observed that the White male identification rates were often two or sometimes even three times as high as rates for similarly achieving Black males.
Similar disparities were evident in eighth grade. At every achievement decile except the highest, White males were identified as disabled at substantially higher (often at least double) rates than similarly achieving Black males. The exception was at the highest performance decile, where the Black male placement rate was 5.6 percent and that for White males was 2.2 percent. This finding was based on relatively small sample sizes but was statistically significant and so warrants further investigation.
The 12th-grade data also indicated that Black males were less likely to be identified than similarly achieving White males. In general, the 12th-grade decile-specific disability identification rates were lower than for 4th and 8th grades. However, the White male rate was consistently higher than the Black male rate at almost every decile (the ninth decile being the only exception, and this was not statistically significant). Overall, White males were much more likely to be identified as having disabilities than otherwise similarly achieving Black males.
Over-Time Evidence of Racial and Ethnic Disparities in Disability Identification
We also examined whether the disparities evident in Tables 2, 3, and 4 also held across earlier time periods. We estimated Model 2 of these tables (i.e., with reading achievement as the only control variable) for eighth-grade NAEP data as far back in time as possible and still have a very large sample that includes a variable for whether children had an IEP. The results, for NAEP data from 2003, 2005, 2007, 2009, 2011, and 2013, are shown in Table 7 and plotted in Figure 1. As a robustness check, we also estimated the same models but using children’s mathematics achievement as the only statistical control (see Supplementary Table A1 and Supplementary Figure 1 on the journal website). We further replicated the analyses by estimating these models for every 4th and 12th grade NAEP Reading, Mathematics, and Science survey administered since 2003.
Logistic Regression Odds Ratio Coefficients of an IEP (Model 2), 8th-Grade National Assessment of Educational Progress Reading Achievement Test Score Data, 2003–2013
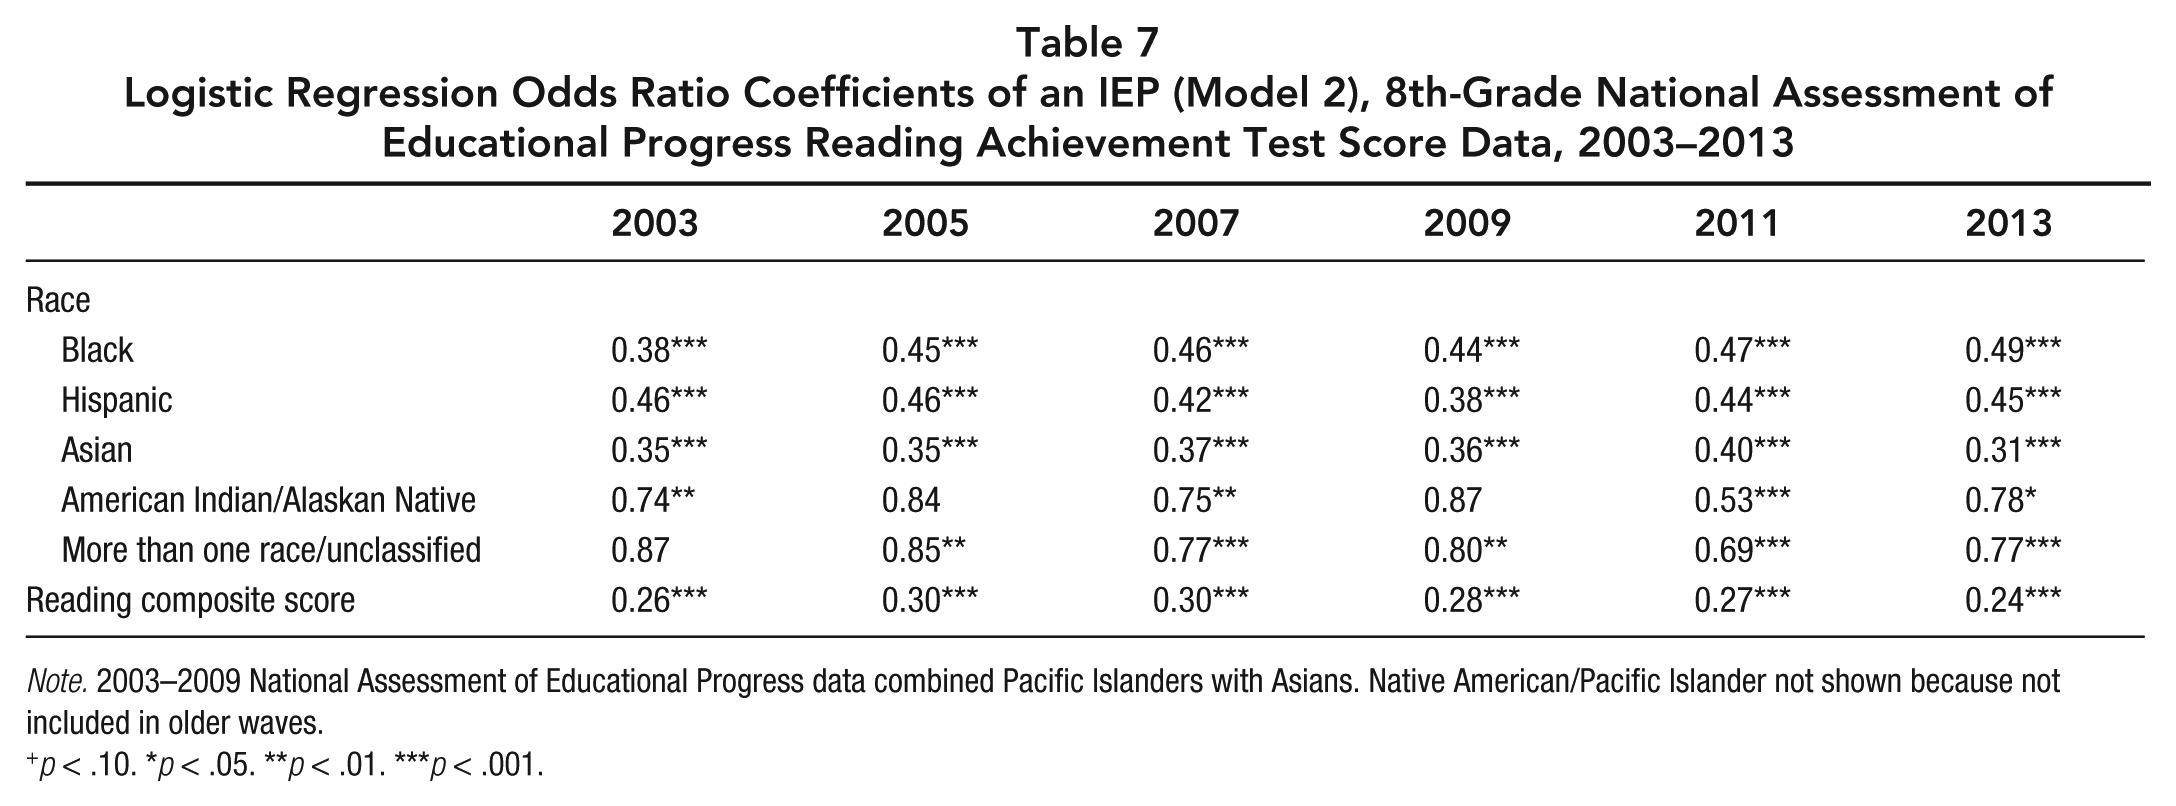
Note. 2003–2009 National Assessment of Educational Progress data combined Pacific Islanders with Asians. Native American/Pacific Islander not shown because not included in older waves.
p < .10. *p < .05. **p < .01. ***p < .001.
The results were consistently replicated. For every year examined, eighth-grade children’s reading achievement was significantly and negatively associated with odds of disability identification. The 2003–2013 coefficients for the reading achievement score averaged .28, indicating that a one standard deviation increase in reading achievement reduced the odds of disability identification by 72% (1 – 0.28). Simply controlling for academic achievement, racial and ethnic minority children had much lower odds of disability identification than White children. This was the case for every NAEP Reading, Mathematics, or Science survey year since 2003. Minority children have been less likely than similarly achieving White children to receive special education services in the United States since at least 2003.
Discussion
We sought to replicate recent (Morgan et al., 2015) but controversial (Cohen et al., 2015; Ford & Toldson, 2015; Skiba et al., 2016; Welner & Skiba, 2015) empirical work reporting that racial and ethnic minority children are less likely than otherwise similar White children to be identified as having disabilities in U.S. schools. Across separate nationally representative data sets for 4th, 8th, and 12th grades, for reading and mathematics, and across six separate years from 2003 to 2013, we repeatedly found that minority children are less likely to be identified as having disabilities and so receive special education services than otherwise similar White children. These disparities were evident throughout both the reading and mathematics achievement distributions, among similarly achieving males, and between children attending similarly resourced schools. Moreover, underidentification attributable to race or ethnicity has been occurring in the United States since at least 2003. These disparities were evident for special education generally as well as a wide range of specific disability conditions. Despite 20 years of federal legislation and policymaking designed to address overidentification, underidentification was repeatedly evident. Females, low-income children, and ELLs often experienced similar underidentification.
Limitations
Our study has several limitations. The NAEP only surveys children in 4th, 8th, and 12th grades. We were therefore unable to examine for disparities in other grades. Unlike other studies (e.g., Hibel et al., 2010; Mann, McCartney, & Park, 2007; Morgan et al., 2012, 2015; Shifrer et al., 2011), the NAEP data do not allow for a longitudinal examination within a cohort of the over-time dynamics of disability identification. We could not independently confirm whether children met diagnostic criteria for the specific disability conditions for which they were receiving special education services. We could not analyze NAEP data prior to 2003 because they do not include sufficiently large samples sizes along with a measure of IDEA-eligible disability status. We were unable to report on whether racial or ethnic minority children, who are more likely to attend highly segregated and underresourced schools, were receiving lower quality special education services than White, English-speaking children. If this were the case, then the receipt of special education services may be of less benefit to minority children with disabilities—although the children would still receive IDEA’s extensive civil rights protections. Our study was not designed to examine all possible factors that may be affecting children’s academic achievement. These factors are likely multifaceted. Our use of school fixed effects precluded an analysis of how specific school-level factors may be associated with the likelihood of disability identification (for such an analysis that also controls for the strong confound of individual-level academic achievement, see Hibel et al., 2010). The NAEP data do not allow for unambiguous causal inferences. They do support covariate-adjusted estimates of the extent to which racial, ethnic, or language minority status is associated with the odds of being identified as disabled while attending elementary, middle, or high schools in the United States.
Study’s Contributions and Implications
Whether and to what extent children attending U.S. schools are overidentified as disabled based on race and ethnicity is currently in dispute. Many prior studies report overidentification (e.g., Dunn, 1968; Zhang et al. 2014), including based on multivariate analyses (Oswald et al., 1999; Skiba et al., 2005; Sullivan & Bal, 2013), although none to date have analyzed individual-level data that control for the strong confound of academic achievement (Morgan et al., 2015, 2017). Federal legislation and policy are increasingly attempting to address overrepresentation based on race or ethnicity (e.g., U.S. Department of Education, 2016). Additional policy efforts have been advocated (Albrecht, Skiba, Losen, Chung, & Middleberg, 2012; Skiba, Albrecht, & Losen, 2013). However, longstanding (Donovan & Cross, 2002; MacMillan & Reschly, 1998) and continuing methodological limitations (Morgan et al., 2015, 2017) in the extant empirical knowledge base have also been identified. Thus, establishing to what extent over- or underidentification is occurring among similarly situated schoolchildren should help clarify the extent to which U.S. schools may be engaging in disability identification practices that discriminate based on race, ethnicity, and national origin (U.S. Department of Education OCR, 2016). Individual-level academic achievement has been identified as a particularly strong confound (Donovan & Cross, 2002) that most empirical work continues to fail to control for (Morgan et al., 2017).
Yet recent work designed to address these methodological limitations and reporting underidentification (e.g., Hibel et al., 2010; Morgan et al., 2015) has been dismissed as flawed (Cohen et al., 2015; Ford & Toldson, 2015; Skiba et al., 2016; Welner & Skiba, 2015) despite better meeting the “otherwise similar” or “similarly situated” methodological and legal condition for inferring racial discrimination (NRC, 2004; U.S. Department of Education OCR, 2016) as well as being consistent with many reports of disability underidentification in public health (Flores & the Committee for Pediatric Research, 2010; Mandell et al., 2009; Miller et al., 2009; Morgan et al., 2013, 2014; Zuckerman, Mattox, et al., 2014). Federal policymakers have dismissed evidence of underidentification as simply the result of selective sampling, as have some educational researchers (Cohen et al., 2015; Ford & Toldson, 2015; Samuels, 2015; Skiba et al., 2016; Welner & Skiba, 2015). The resulting policy debate risks becoming confusing to researchers, practitioners, and policymakers working to ensure educational equity and social justice.
Results from this replication study support the conclusion that among children displaying similar clinical needs who are attending U.S. elementary, middle, or high schools, being a racial or ethnic minority is associated with lower odds of being identified as having a disability and so of receiving special education services. Minority children’s underidentification was evident across the achievement distribution, controlling for either reading or mathematic achievement, using school fixed effects, and for every year the NAEP tests have been administered since 2003. Underidentification attributable to race or ethnicity was also evident for special education generally and a wide range of specific disability conditions as well as across diverse races and ethnicities and national origin. This repeatedly replicated evidence suggests that findings of disability underidentification based on race or ethnicity in U.S. schools are robust.
Our analyses extend the knowledge base. To date, underidentification has only been reported to occur during high school for a specific grade level (i.e., 10th grade) and then only for one specific disability condition (i.e., SLD) (Shifrer et al., 2011). Our results indicate that underidentification occurs in 12th grade as well as in 4th and 8th grades and that these disparities are evident for special education generally and multiple disability conditions. Our results also extend the knowledge base by suggesting that underidentification reported to occur prior to or soon after kindergarten also continues to occur until the end of high school (Mandell et al., 2009; Morgan et al., 2012, 2014, 2015; Morgan, Hammer, et al., 2016; Shifrer et al., 2011). These disparities may also be occurring among otherwise similar children across a wider range of disability conditions then previously reported (e.g., Hibel et al., 2010; Morgan et al., 2015), including for very low prevalence conditions (e.g., vision or orthopedic impairments) whose identification might be expected to be more objective and less reliant on potentially racially biased normative judgments. Our results also indicate that underidentification extends to American Indian children. We also found that the underidentification of Hispanic children is partially explained by ELL status. Concurrently, we found that ELL children were consistently less likely to be identified than otherwise similar non-ELL children, including across a wider range of specific disabilities than previously reported (Morgan et al., 2015). Our analyses of NAEP data back to 2003 indicate that the underidentification of minority children has been longstanding. Some researchers have hypothesized that U.S. schools use special education to segregate minority children (Ferri & Connor, 2005) and/or that school contexts confound findings of underidentification (Sullivan & Proctor, 2016). However, these hypotheses were not supported by the results from our school fixed effects models. Instead, these results repeatedly indicated that after controlling for the differing characteristics of schools attended by White and minority children, White children still had substantially higher disability identification rates than otherwise similar minority children. Racial and ethnic disparities in disability identification among similarly achieving children have been occurring in the United States since at least 2003.
What should be done to address longstanding and widespread underidentification? Our results suggest that national efforts initiated in 1997 to address minority overrepresentation in special education resulting from misidentification based on race or ethnicity (e.g., GAO, 2013; Lysy et al., 2014; Posny, 2007; U.S. Department of Education, 2016) should be redirected. These well-intentioned efforts appear to be targeting the wrong problem typically being experienced by racial and ethnic minority children attending U.S. schools and may exacerbate a misunderstanding of disproportionality by practitioners, parents, and the public. For example, current reports to Congress by OSERS make no mention of the possibility that other factors may instead explain minority children’s overrepresentation in special education (e.g., OSERS, 2014, 2015, 2016).
This has not always been the case. Initial reports by OSERS occasionally presented evidence of underrepresentation of Black and Hispanic children once other factors were accounted for (see U.S. Department of Education, 1996, Figure 4.1). These reports also occasionally discussed underlying societal inequities (e.g., greater exposure to poverty as well as living in lower-resourced inner cities) that possibly explained minority children’s observed greater need for special education services following school entry (see U.S. Department of Education, 1997, 1998). 4 The change in reporting by OSERS to emphasize estimates of racial disproportionality uncorrected for confounds appears to have led to the widespread mistaken conclusion that minority children were unambiguously being overidentified as disabled based on their race or ethnicity, which was quickly but inaccurately taken as evidence for the widespread use by U.S. schools of racially discriminatory eligibility procedures. To better monitor for minority disproportionate representation resulting from misidentification based on race or ethnicity, federal policymakers should modify their current reporting standards so as not to rely on simple, uncorrected estimates contrasting rates of minority children in the general school-aged and special education populations (e.g., OSERS, 2014, 2016). Instead, such reporting should focus on the extent to which minority children are over- or underidentified nationally as well as locally when contrasted to otherwise similar White children, including those attending the same schools and especially among those displaying similar levels of academic achievement (U.S. Department of Education OCR, 2016). Such analyses would provide far more rigorous estimates of the extent to which any observed disproportionality is attributable to race or ethnicity (e.g., Donovan & Cross, 2002; MacMillan & Reschly, 1998; Morgan et al., 2017) and so to racial discrimination (NRC, 2004) because they would allow for contrasts between similarly situated children (U.S. Department of Education OCR, 2016). Continued analyses of NAEP data would provide one potential method for monitoring minority disproportionate representation nationally. This data collection might also be supplemented in LEA to include adjustments for strong confounds, particularly academic achievement, to allow for monitoring of over- or underidentification among similarly situated children in specific local contexts.
For researchers, our results suggest that future studies of minority disproportionality in special education are likely to provide spurious estimates if strong confounds are not accounted for (Morgan et al., 2015, 2017). Such estimates should minimally adjust for individual-level academic achievement (Donovan & Cross, 2002; Morgan et al., 2017). To date, studies accounting for individual-level academic achievement and other indicators of clinical need consistently find that minority children are less likely than otherwise similar White children to be identified as disabled, with these disparities evident in clinical settings as well as prior to and following school entry (e.g., Flores and the Committee on Pediatric Research, 2010; Hibel et al., 2010; Miller et al., 2009; Morgan et al., 2012, 2015, 2017).
For practitioners, our results suggest the need for efforts that address the cultural, language, and societal “barriers to entry” to Child Find and referral procedures that may be making it less likely that children with disabilities who are racial or ethnic minorities, as well as from other traditionally marginalized groups (e.g., females, ELL, from low-income families), are properly identified and provided with services to which they have a civil right. Minority children’s disability underidentification is not explained by differences in individual-level academic achievement, family-level economic disadvantage, or differential access to school-level resources. Examples of potential barriers include the failure to employ assessments that may help distinguish learning disabilities from lack of English proficiency (Peña, Gutierrez-Clellen, Iglesias, Goldstein, & Bedore, 2014), a lack of access to interpreters as well as accessible information about the special education system’s eligibility procedures (Brotanek, Rocha, & Flores, 2008; Fitzgerald & Watkins, 2006; Mandic, Rudd, Hehir, & Acevedo-Garcia, 2012), local political and administrative pressures not to identify minority children as having disabilities to avoid reporting overrepresentation, as well as the view within minority communities that school-based disability evaluation is largely motivated by racial prejudice (Yeh, Forness, et al., 2004). School-to-community partnerships may also be helpful. Here, members of the minority community would work closely with school personnel to better disseminate evidence-based information about disability risk indicators, symptomatology, and potential treatment options as well as work collaboratively with parents to ensure that any concerns about prejudice or potential stigma are properly addressed. Similar partnerships have helped address racial disparities in children’s access to health care (Flores, 2009; Madsen, Thompson, Adkins, & Crawford, 2013). Universal screening, which has recently been reported to help reduce minority children’s underidentification for both gifted education services (Card & Giuliano, 2015) and pediatric care (Payne & Puumala, 2013), may help counteract underidentification resulting from the system’s current reliance on parent- and teacher-based referral as well as help counter an observed reluctance by schools to appropriately identify and provide services to minority children, including those with independently identified disabilities (Gillborn et al., 2016). Providing minority parents with accessible scientific information about specific disability conditions may also be helpful (Lajonchere et al., 2016). These and additional efforts by researchers, policymakers, and practitioners may be necessary to successfully address racial and ethnic disparities in disability identification in U.S. schools, which are longstanding as well as widespread.
Footnotes
Notes
Authors
References
Supplementary Material
Please find the following supplemental material available below.
For Open Access articles published under a Creative Commons License, all supplemental material carries the same license as the article it is associated with.
For non-Open Access articles published, all supplemental material carries a non-exclusive license, and permission requests for re-use of supplemental material or any part of supplemental material shall be sent directly to the copyright owner as specified in the copyright notice associated with the article.