
Abstract
While there is a robust literature examining the patterns and causes of teacher turnover, few articles to date have critically examined the measures of turnover used in these studies. Yet, an assessment of the way turnover is measured is important, as the measures become the means by which the “problem” of turnover becomes defined and its varying dimensions understood. In this conceptual essay, we outline a typology of teacher turnover measures, discussing both measures used in existing teacher turnover literature as well as new measures that we have developed. We illustrate each of the measures using 10 years of administrative data from Texas. We discuss how the measures can help illuminate different ways in which staff instability can affect schools and identify schools that suffer from particularly severe staffing issues. We conclude with implications for policymakers and researchers who may seek to apply these measures to future empirical studies.
Keywords
Research indicates that teacher quality is one of the most important school-level measures predicting students’ educational and professional outcomes (Chetty, Friedman, & Rockoff, 2011). Yet in many schools, teacher retention is a persistent problem, requiring school and district staff members to constantly search for, hire, and train teachers, often only to lose them after a short period of time. Teacher retention has been particularly difficult in high-poverty urban schools (Béteille, Kalogrides, & Loeb, 2012; Boyd, Lankford, Loeb, & Wyckoff, 2005; Ingersoll, 2001; Ingersoll & May, 2012; Johnson, Kraft, & Papay, 2012; Simon & Johnson, 2013), with some losing between one-third and one-half their staff in a single year (Allensworth, Ponisciak, & Mazzeo, 2009), often multiple years in a row. We use the term instability to characterize this type of chronic teacher turnover. 1
While some turnover is considered necessary and healthy for schools, too much instability can be harmful and create serious organizational challenges (Allensworth et al., 2009; Béteille et al., 2012; Ronfeldt, Loeb, & Wyckoff, 2013). Instability can result in the loss of human capital, particularly if schools lose large numbers of teachers who are highly experienced and effective. In addition, staff instability can have negative effects on the organizational functioning of schools (Holme & Rangel, 2012; Smylie & Evans, 2006; Spillane, Kim, & Frank, 2012) by breaking up existing social ties and networks of support, resulting in the loss of essential institutional knowledge. In this way, instability can impede efforts to build a coherent and collective vision and mission—key factors for school functioning and improvement—which in turn can negatively impact student achievement (Bryk, Gomez, Grunow, & Lemahieu, 2015; Bryk & Schneider, 2002; Bryk, Sebring, Allensworth, Luppescu, & Easton, 2009; Coburn & Russell, 2008; Elmore, 2003; Finnigan & Daly, 2012; Holme & Rangel, 2012; Smylie & Evans, 2006; Spillane et al., 2012). Furthermore, staff instability can become a vicious cycle, as turnover can have negative effects on organizational culture, further driving additional teacher exits.
While there is a robust literature examining the patterns and causes of teacher turnover, few articles to date have critically examined the measures of turnover used in these studies. Yet, an assessment of the way we measure teacher turnover is important, as the measures become the means by which the “problem” of turnover becomes defined and its varying dimensions understood.
In this essay, we present a typology of teacher turnover measures, including both measures used in existing teacher turnover literature as well as new measures that we have developed. Throughout our essay, we illustrate the measures using administrative data from Texas. We discuss how the varying measures can help illuminate different ways in which staff instability can affect schools and identify schools that suffer from particularly severe staff shortages. We conclude with implications for policymakers and researchers who may seek to apply these measures to future empirical studies.
Rethinking Measures of Teacher Turnover
In presenting our typology of turnover measures, we group them into two categories: short-term and long-term turnover measures. We illustrate each of the turnover measures using the Texas state administrative data set, which allows us to track teacher movements across all public schools for all grade levels from 2004 to 2014. 2 Our illustrations of the turnover measures show important disparities in turnover patterns between schools serving different student populations, with particularly severe disparities in the long-term measures.
Short-Term Measures of Teacher Turnover
The majority of the research literature conceptualizes turnover as annual turnover, or the loss of teachers from one year to the next (e.g., Hanushek & Rivkin, 2010; Ingersoll & May, 2012). In this conceptualization, turnover is measured as the number of teachers that did not return to a school in year t as a percentage of the total number of teachers at the school the prior year (t – 1).
Many of the studies relying on annual rates of turnover have revealed concerning disparities between schools. For example, a number of studies have found significantly higher annual turnover rates for high-poverty and predominantly non-White schools (Clotfelter, Ladd, Vigdor, & Wheeler, 2007; Johnson et al., 2012). Teachers, particularly those with more experience, tend to leave such schools for schools with lower rates of poverty and more White students (Clotfelter et al., 2007; Johnson et al., 2012). Researchers have also found that turnover is worse in schools with lower accountability ratings (Clotfelter, Ladd, Vigdor, & Diaz, 2004; Feng, Figlio, & Sass, 2010). These migration patterns, furthermore, are primarily due to voluntary departures rather than involuntary dismissal or termination (Béteille et al., 2012; Goldring, Taie, & Riddles, 2014; Ingersoll, 2001).
We illustrate annual turnover rates using Texas state data. Similar to prior literature, we operationalize turnover as the number of teachers who depart a campus from one year to the next. While some studies report teacher departures in separate categories of movers (teachers moving to a different campus) and leavers (teachers leaving the profession), 3 we do not differentiate between the two in our illustration because our interest is in the effects of turnover on schools as organizations. Thus, we operationalize turnover as the total number of departures regardless of a teacher’s destination because as Ingersoll and Perda (2010) note, “from an organizational level of analysis, teacher migration and attrition have the same effect” (p. 587) on schools by decreasing staff in that particular school.
Our illustration of annual turnover rates shows that turnover rates in Texas averaged just over 20% over the 10 years of our data; thus, on average, schools in Texas lost one-fifth of their teachers in any given year. 4 There was a brief decline in annual turnover rates between 2010 and 2012, likely due to the recession, as the unemployment rate in Texas peaked between summer of 2009 and December of 2011 (Bureau of Labor Statistics, 2017). In 2012–2013, annual turnover rates began to increase again.
Consistent with other studies, we find that annual turnover rates are higher for high-poverty schools and those serving large proportions of underserved minorities (see Figure 1). 5 Further, the differences in the turnover rates we found are consistent with other studies (see e.g., Clotfelter et al., 2007; Hanushek, Kain, & Rivkin, 2004; Ingersoll, 2001). Also consistent with prior research, we find that annual turnover rates are different based on school accountability ratings. The starkest difference in annual turnover rates was between schools with “exemplary” accountability ratings (the highest accountability rating for schools in Texas) and schools with “unacceptable” ratings (the lowest rating).
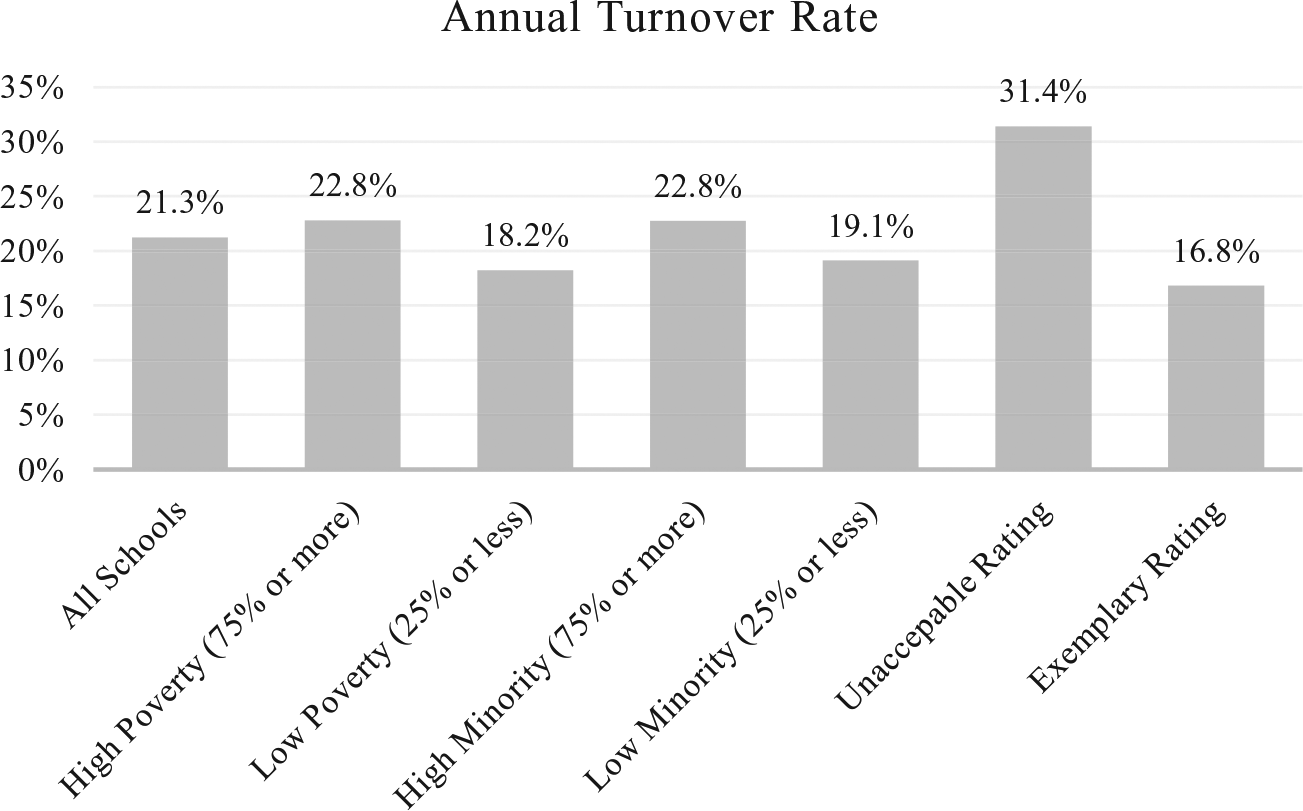
Annual turnover rate by school composition and accountability status
While these annual turnover rates, as with prior studies, illustrate concerning disparities between different types of schools, these short-term measures provide a relatively limited picture of turnover in that they can mask the severity of attrition problems faced by schools over multiple years. As one example, a school might report a 20% annual turnover rate for three years, yet few studies would distinguish whether these losses were in the same positions (i.e., 20% of the same staff positions replaced each year over three years, with 80% of staff positions remaining stable) or different positions (i.e., the 20% is comprised of different staff positions replaced each year, accumulating to a 60% loss over three years, with just 40% of staff positions remaining stable). Thus, single-year measures of turnover can conceal deeper, underlying chronic staffing problems.
Long-Term Turnover Rates
Relatively fewer researchers have employed what we call long-term turnover rates, which measure teacher turnover patterns in schools over time (e.g., Allensworth et al., 2009). Long-term turnover rates can provide important additional insight into the effects of turnover on schools and help policymakers target high-needs schools more effectively. In this section, we describe existing longitudinal measures of teacher turnover in the literature, and we present newly conceptualized measures. Our measures were inspired by those developed by the U.S. census to capture the different dimensions of poverty (e.g., Edwards, 2014) to distinguish between people experiencing chronic and transient poverty, and we believe such measures are helpful in capturing the variation in types of turnover across schools over time.
In the following discussion, we illustrate these long-term measures using Texas administrative data. To describe trends, for several of our measures, we needed to assign schools into “high,” “medium,” and “low” turnover categories. To define each category, we used two different types of cut-points or thresholds (which are also used in measuring poverty): absolute and relative, each of which have strengths and limitations.
Absolute thresholds provide a fixed cut-point that is used to sort schools into different turnover rate categories (high or low turnover). In our analysis, we decided on a cut-point of 30% for high turnover and 10% for low turnover: Thus, if a school falls at or above a 30% turnover rate, it would be considered a high turnover school, and if a school is below a 10% turnover rate, it would be considered a low turnover school. (These cutoffs were also used by Allensworth et al., 2009, due to their practical implications for schools.) 6 The advantage of the absolute threshold or cut-point is that it has concrete, real-world intuitive meaning and makes high and low turnover categories easy to understand and conceptualize (Iceland, 2013). The disadvantage, however, is that the cut-point can be somewhat arbitrary, and cut-points can become outdated if the overall distribution of turnover rates change significantly over time (Iceland, 2013).
Relative thresholds, by contrast, define high and low turnover groups based on the overall distribution of turnover in schools and thus provide a way to assess whether a school’s turnover rate is higher or lower relative to other schools in a given comparison group. In our analysis, we sorted schools into bands (quartiles) and designated schools in the top band as high turnover and the schools in the bottom as low turnover. The advantage of this type of relative measure is that it provides some measure of comparative disadvantage or advantage; namely, if all schools in a region or state have turnover rates of just 5%, then a 15% turnover school is struggling in that context. Relative cutoffs also provide an external, unbiased system for generating high and low categories. The disadvantage of relative thresholds is that they may lose meaning in the “real world.” For example, a school that has a 26% turnover rate may fall into a high quartile one year but may fall into a lower quartile the next and thus cease to be considered a high turnover school even though the loss of staff that the school experiences is no less disruptive. 7
The measures of turnover we use are described in Table 1. We also describe each measure in reporting the prevalence and demographics of these different types of turnover in the next section.
Summary: Short and Long-Term Measures of Teacher Turnover

Although this is the aim of annual turnover measures, most administrative data sets only capture a snapshot of teachers’ positions each year. Therefore, there may be within-year turnover (a teacher starts and leaves midyear) that is not captured by such measures. Indeed, these types of occurrences (teachers hired late or quitting after a couple of weeks) are more likely to impact the most underserved schools.
Chronic instability rates
Chronic instability is a measure that identifies schools that are constantly experiencing churn, or schools with high rates of turnover each year for a certain band of years. This measure has been used in just one study that we have identified, Allensworth et al. (2009), which looked at turnover in Chicago. In our analysis, we define chronically unstable schools (using an absolute threshold) as schools that have lost 30% or more of their teachers each year for 7 or more years within our 10 years of data. 8 While over 60% of schools (4,243 schools) experienced at least one year of high absolute turnover, we found that a much smaller share, 4.4% of schools in Texas, or 302 schools, have experienced this extreme kind of turnover. Defining high turnover relatively, we find that more, over 70% of schools, experience at least one year of high relative turnover and that 7.4%, or 503 schools, have fallen in the highest quartile of turnover every year for at least 7 of 10 years. Therefore, while most schools experience at least a temporary bout of instability, this can mask the deep instability experienced by a smaller subset of schools.
We find much sharper differences between high- and low-poverty schools for this measure as compared with annual turnover rates (see Figure 2), with high-poverty schools experiencing two to four times the rates of chronic instability (using both absolute and relative thresholds) as low-poverty schools. Similarly, high-minority schools experience higher rates of chronic instability than low-minority schools using both absolute and relative rates, though the differences are not as stark. We also examined differences by geography (urban, suburban, and rural) and found that rural schools experienced the highest rates of chronic instability (see Figure 3). We find the sharpest differences in chronic instability rates between schools with the highest and lowest accountability ratings: While only 1.6% of schools with exemplary ratings experienced chronic turnover (using absolute rates), over 16.7% of schools with unacceptable ratings experienced chronic instability. The same results were found using relative rates, with over one-quarter of schools (28.3%) with unacceptable ratings experiencing chronic instability compared to only 1.9% of schools with exemplary ratings. Our data suggest, therefore, that schools that are in greatest need of improvement are more often those experiencing chronic instability. It is possible that with constant staffing churn, teachers in these schools are likely to have difficulty forming the types of relationships, trust, and shared vision needed for sustained improvement.

Chronic instability rate by school composition and accountability status

Chronic instability rate by urbanicity
Cumulative instability rates
Cumulative instability rates represent the extent to which schools lose a significant proportion of staff over time. Cumulative instability is measured as the percentage of teachers in a school in a baseline year that remains in their school for a determined band of years. We identified several studies that have employed cumulative rates to examine teacher turnover, such as Allensworth et al. (2009), or new teacher attrition, such as the National Science Foundation’s (2014) Science and Engineering Indicators Report. In contrast to the chronic instability rates reported previously (which are unable to distinguish between losses among the same or different teaching positions over time), cumulative instability is able to capture the “depth” of turnover over time by illustrating how many of the original teachers in a given year have departed over a certain number of years. This measure can therefore identify schools that may not appear to be a high turnover school in any given year but that suffer significant staffing losses over time.
To illustrate this measure, we define cumulative instability as the percentage of original teachers in Year 1 of our data who left their schools over time (e.g., after two years, three years, etc.). One of the most surprising findings when applying this measure to Texas data (which is the first analysis that we are aware of to apply this measure to data across an entire state) is that rates of cumulative instability, the total proportion of staff lost in schools over time, are high for many Texas schools. Remember that, as shown in Figure 1, average annual turnover rates for a single year are approximately 21% on average. Yet in tracking cumulative turnover rates longitudinally, we found that on average, schools lose 35% of their teachers over two years, more than half (59%) of their teachers over five years, and 72% of their teachers over eight years (see Figure 4). Furthermore, we found remarkably similar rates of cumulative turnover across urban, suburban, and rural schools (see Figure 5). 9 Therefore, major losses of human capital are accumulating across all schools in Texas over time, which is a concerning policy issue.
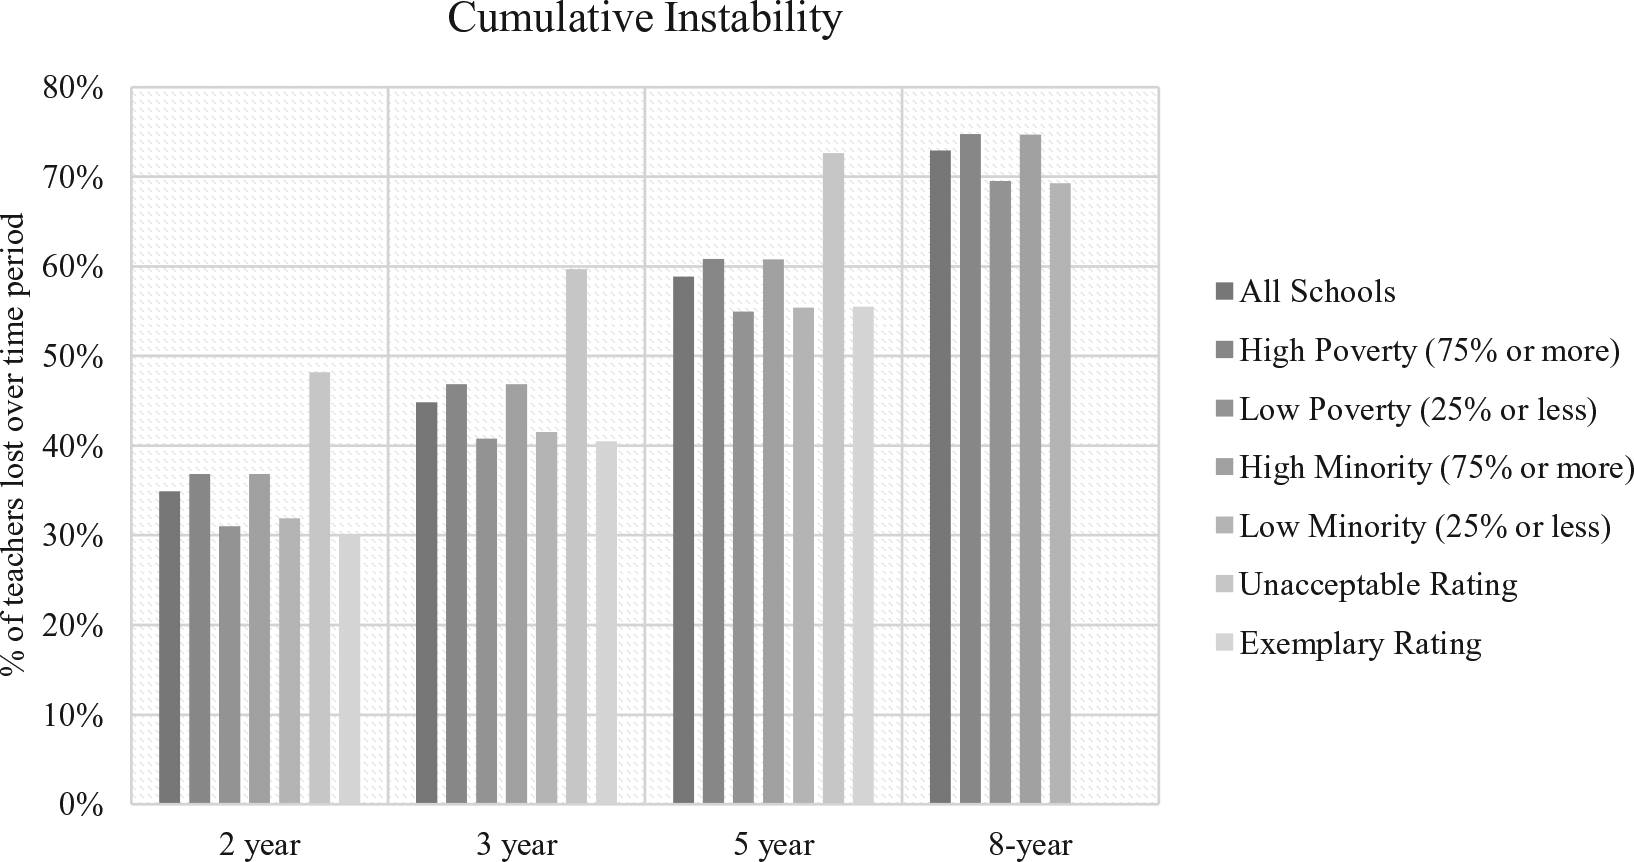
Cumulative instability rate by school composition and accountability status
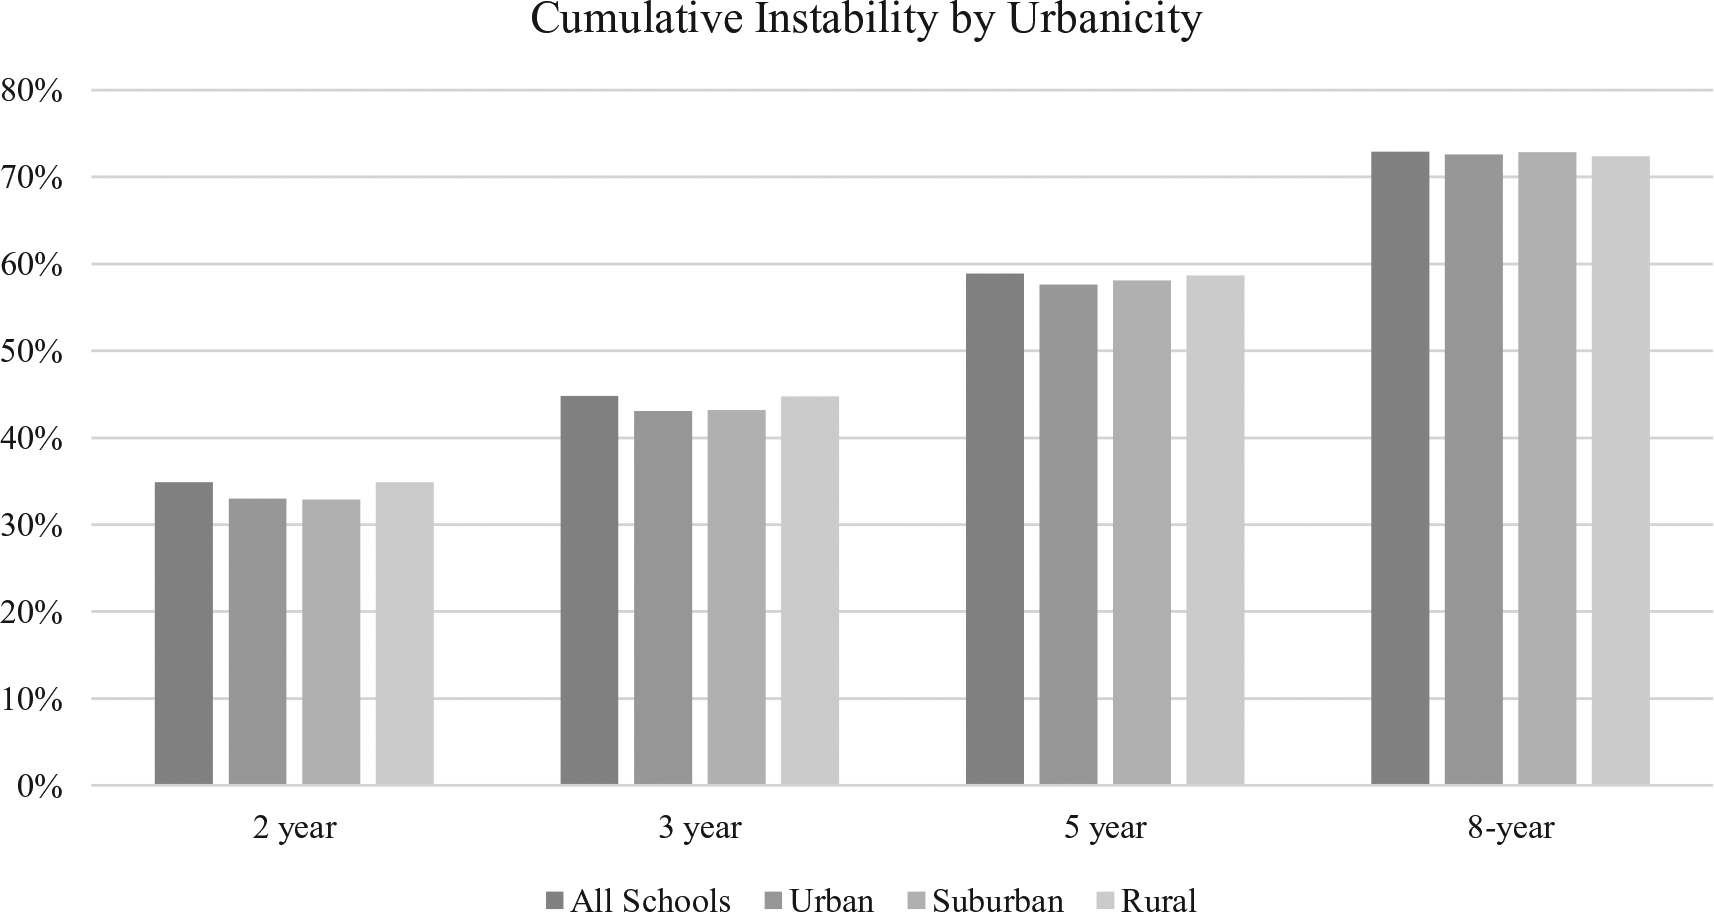
Cumulative instability rate by urbanicity
We also find sizeable differences in cumulative instability between high- and low-poverty and high- and low-minority schools, with the starkest differences remaining between schools with the highest and lowest accountability ratings. This raises an important question about the extent to which low accountability ratings are a cause or a result of severe turnover problems. While low accountability ratings may drive teachers out of a school, constant churn can potentially make it more difficult for schools to engage in sustained improvement. At the very least, these cumulative rates suggest that these schools need intensive teacher retention supports.
Instability entry
The instability entry measure identifies those schools that were not in high turnover status the prior year but then entered into high turnover status the following year. (This measure is modeled after the U.S. census measure of poverty entry, which identifies which subgroups are more likely to become poor in any given year; Edwards, 2014.) Our analysis focused on what types of schools (by demographics, race, etc.) entered into high turnover status in a given band of years. This measure could therefore help identify which types of schools more often become unstable.
We find that 12.6% of schools became high turnover (unstable) schools in any given two-year period when using the 30% absolute threshold (see Figure 6). There are differences, again, in instability entry between high- and low-minority schools and between high- and low-poverty schools. Furthermore, we find that very high–poverty schools (90% or more poverty) twice as often become unstable if they were not unstable the year before, as compared with low-poverty schools (10% or lower poverty). Schools with unacceptable ratings entered high turnover status almost eight times more often than schools with exemplary ratings. This suggests that there are subsets of schools (which are more likely to be high poverty, high minority, and low performing) that may not necessarily be in high turnover status in any given year but are at greater risk of becoming high turnover schools and that new policies should be developed and directed at these campuses to help them avoid this outcome.
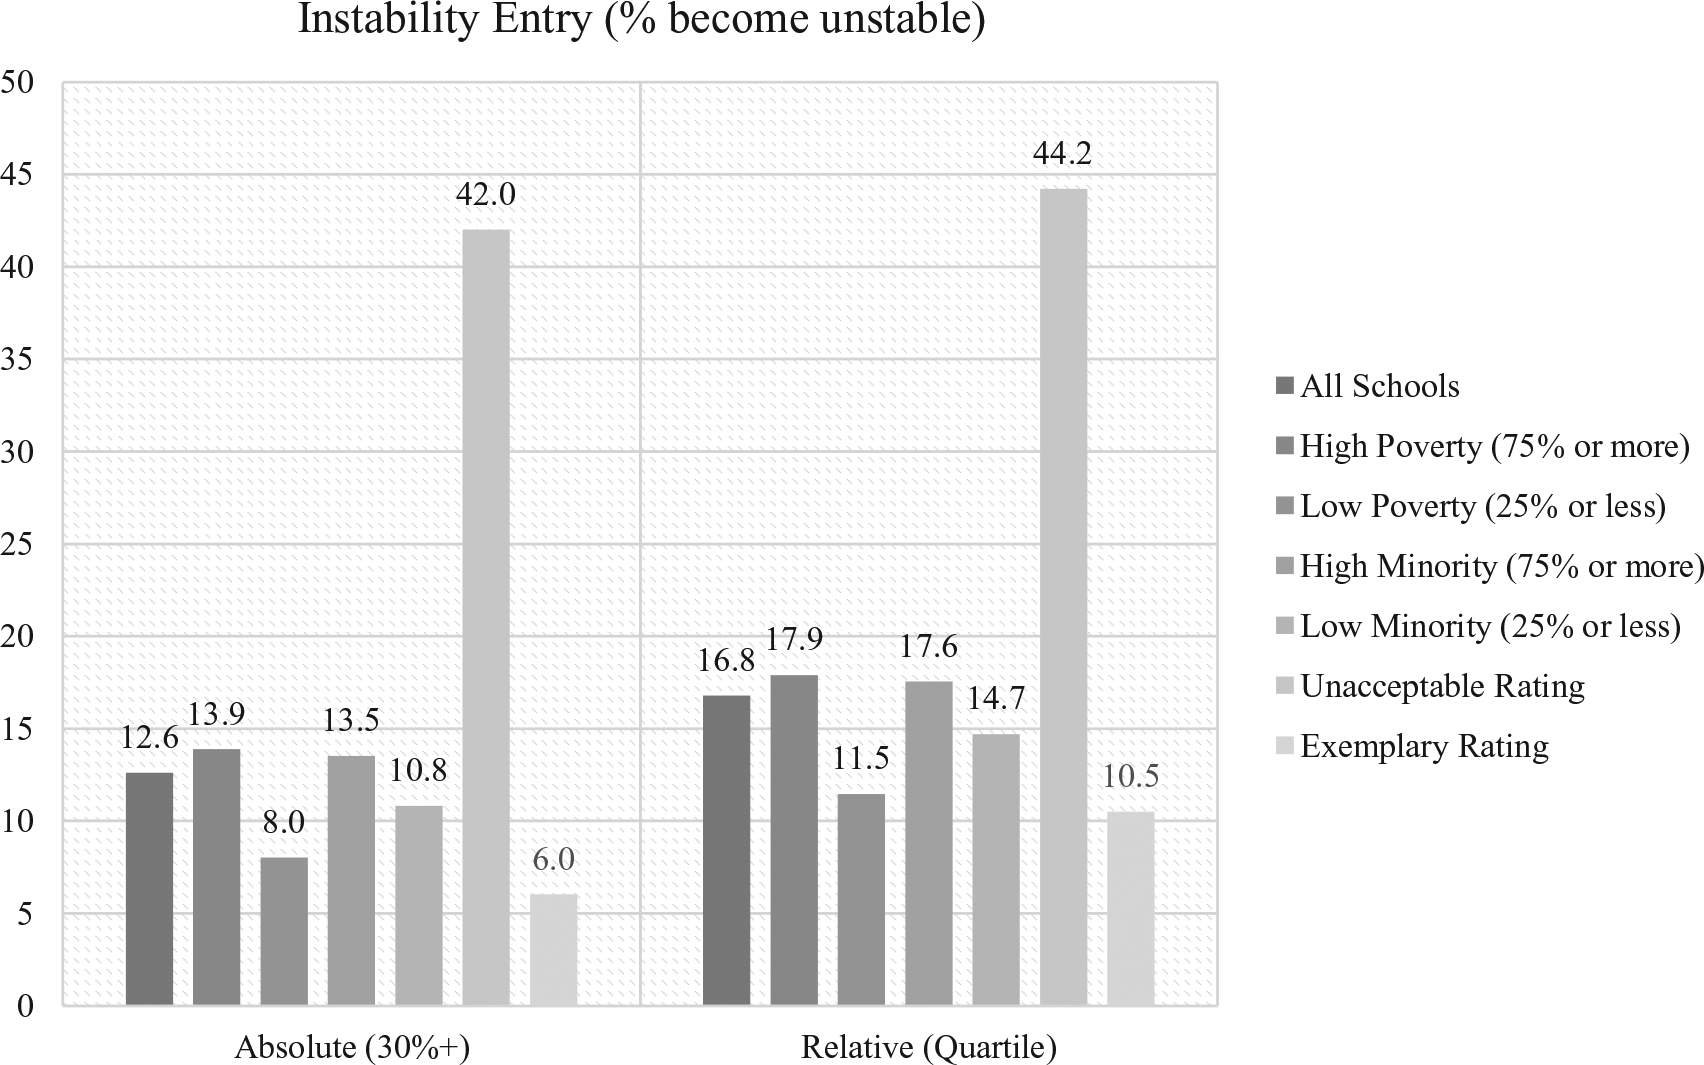
Instability entry rates by school composition and accountability status
Instability exit
The instability exit measure identifies which high turnover schools are able to leave high turnover status. This measure therefore captures the extent to which different types of schools with high rates of turnover in any given year are able to become more stable the following year. We find that of schools that are unstable, just over half (54.8%) become relatively more stable (below the 30% high turnover threshold) the next year (see Figure 7). However, there are lower rates of instability exit for high-minority and high-poverty schools, which means that these schools have much more difficulty restabilizing their staff. We find that schools with unacceptable ratings have the lowest rates of instability exit, which suggests they have the hardest time exiting high turnover status.
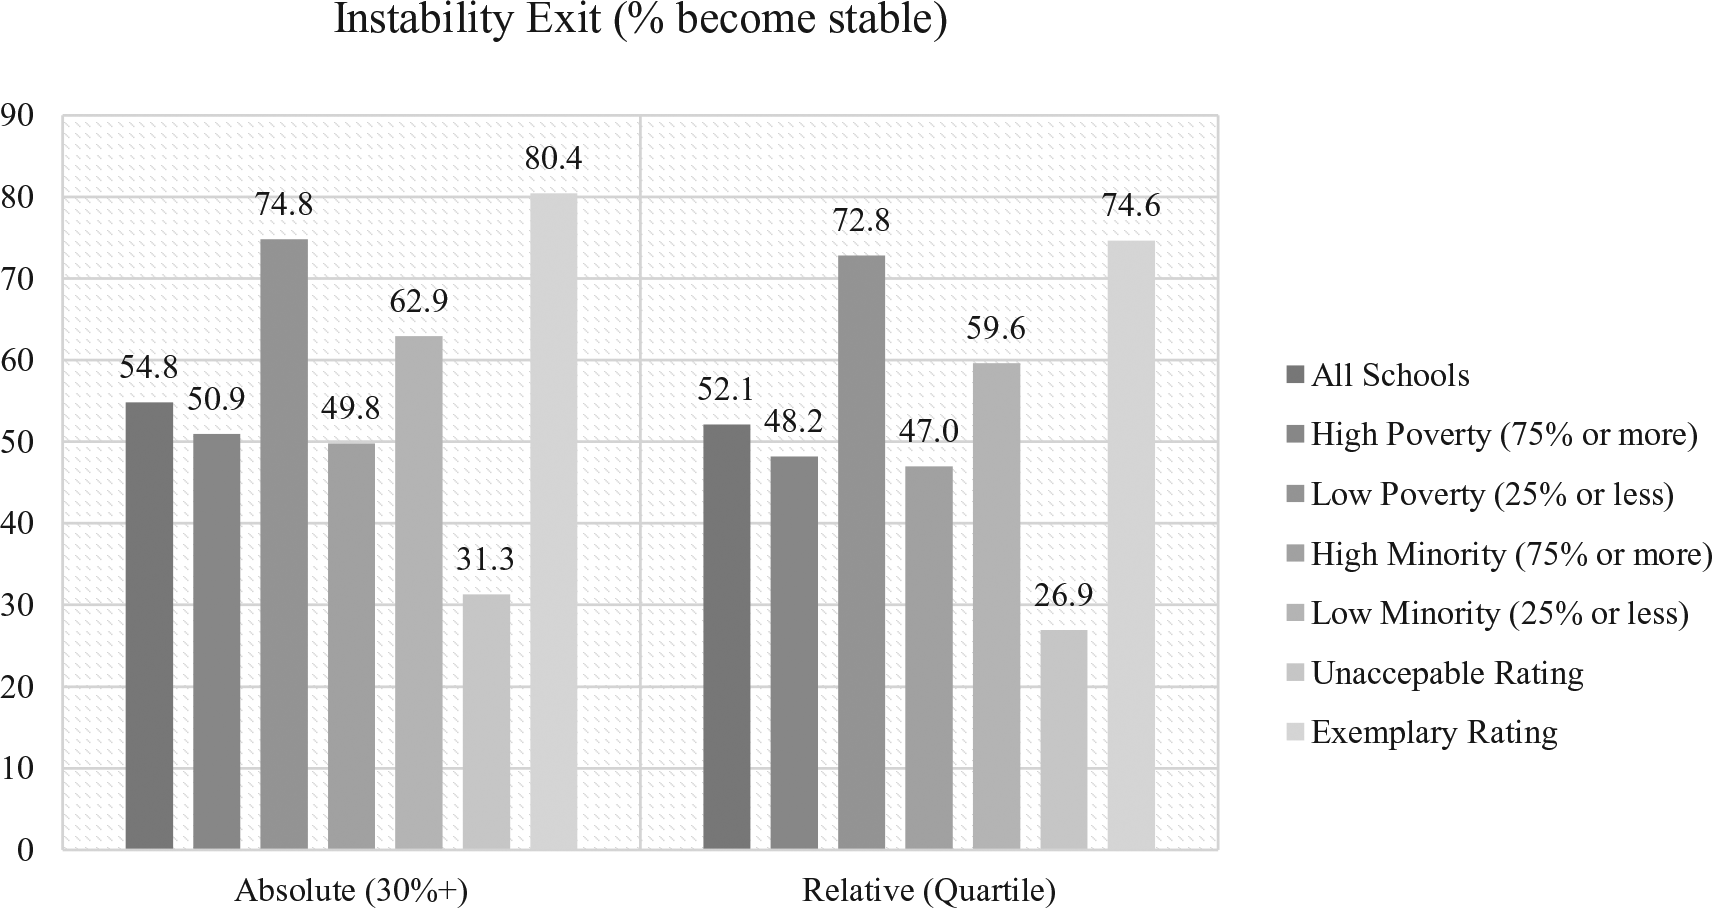
Instability exit rates by school composition and accountability status
Turnover spell
Turnover spells capture the length of time a school is a high turnover school. We define a turnover spell as the number of consecutive years a school remains in high turnover status. While instability entry and exit capture the likelihood of schools falling into high turnover status or leaving high turnover status in any given year, the instability spell measure captures the length of time high turnover schools experience high turnover before they are able to stabilize.
Here we focus just on those schools that experienced at least one year of high turnover, excluding the 37.8% of schools that never experienced high turnover. For over half of Texas schools that experienced at least one year of high turnover, high turnover experienced in one year did not persist into a second year regardless of whether an absolute or relative measure was used (see Figure 8). 10 On average, schools that experience high turnover tend to be in that status just over two years using relative rates and just under two years using absolute rates. Between 20% and 25% of schools that experienced high turnover had spells of three or more years, depending on the measure. Although we do not display the results, high-poverty and high-minority schools experienced somewhat longer spells of instability, whereas low-poverty and low-minority schools experienced shorter spells. Schools with unacceptable ratings experienced longer spells of instability than schools with exemplary ratings.
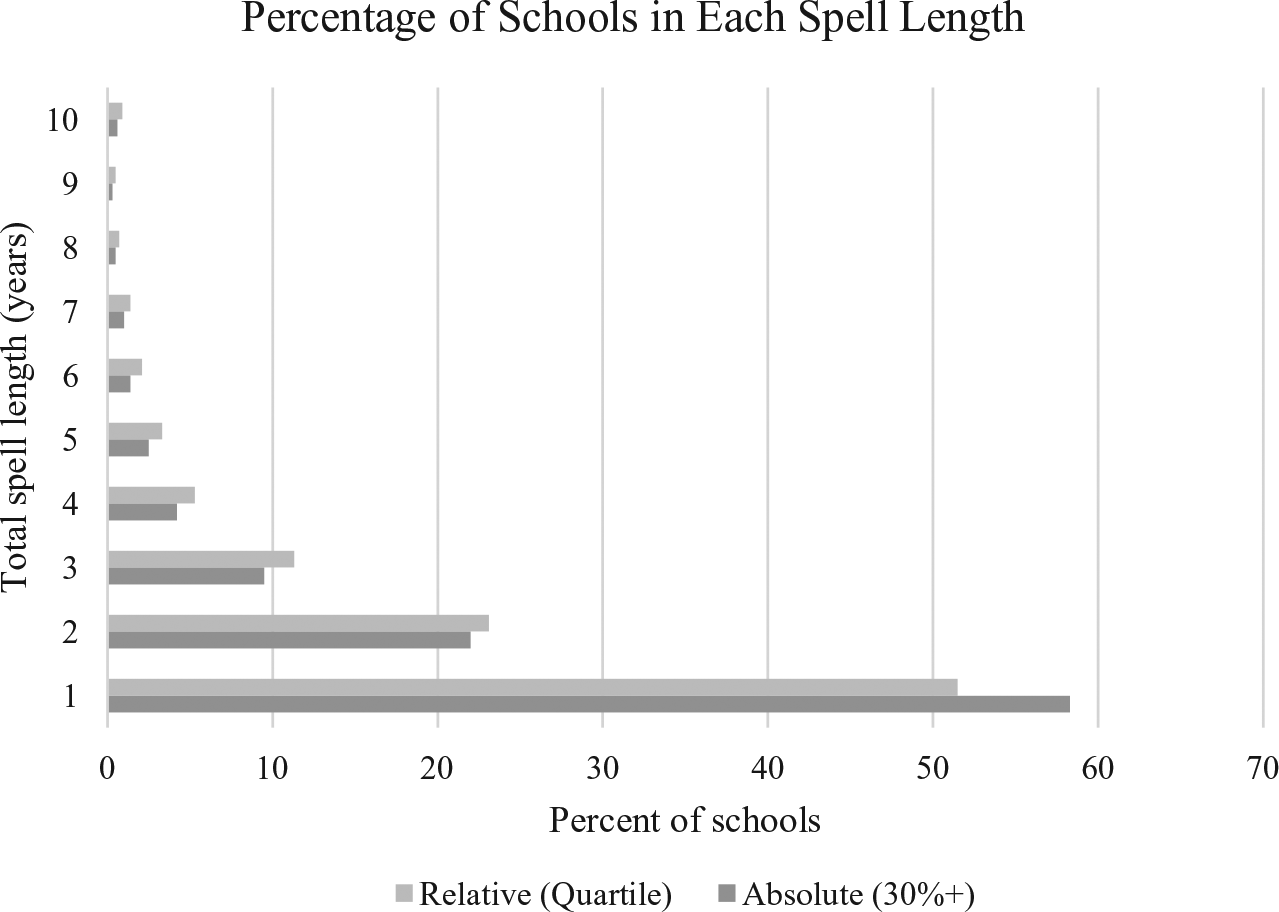
Length of instability spells
We also found that some schools never exited high turnover status: Using relative rates of turnover, a very small percentage of our schools (0.65%, or 44 out of the 6,819 schools for which we had 10 years of data) had spell lengths of 10 years. These schools experienced high turnover for the full duration of the observation period, never exiting the spell. Using absolute rates, an even smaller percentage, 0.38% of schools, or 26 out of the 6,819 schools, never exited high turnover status. These patterns suggest that this small population of schools experienced unique staffing challenges and was unable to decrease its high turnover rates over the 10-year period.
Episodes of instability
Our last measure of turnover looks at episodes of instability, which are defined as two consecutive years in high turnover status. This measure captures schools that not only fall into unstable status but remain stuck there for at least two consecutive years and how frequently this happens over a long period of time (in this case, over a 10-year period). This measure therefore identifies schools that are constantly struggling with bouts of instability, with some periods of recovery, as opposed to simply capturing the spell length, which our previous measure does.
We found that the majority of schools (65% to 74%, depending on the measure) experienced no episodes of instability, namely, did not have two consecutive years of high turnover (see Figure 9). Schools in this group may therefore have more “healthy” turnover, where teachers that are ineffective or who disagree with the school mission leave the school in a one-time staffing change.
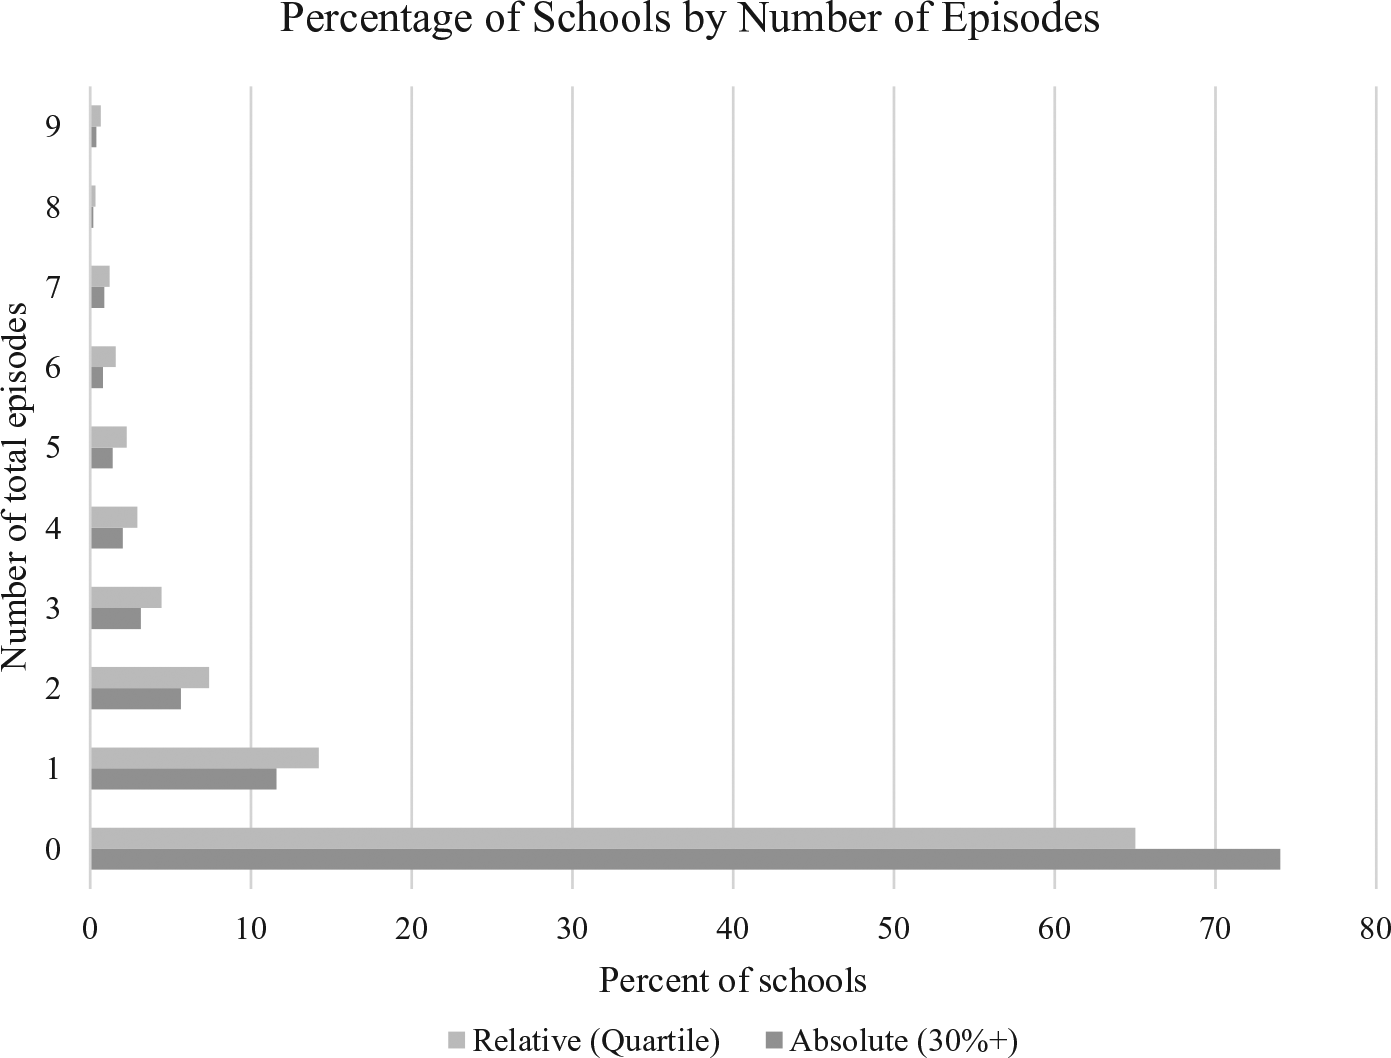
Number of instability episodes
Multiple episodes of turnover, by contrast, may indicate more serious staffing problems. Schools with high episode counts are able to exit high turnover status briefly but continue to reenter it, thus destabilizing frequently, a phenomenon that can potentially erode the social resources within the school. While the percentage of schools experiencing multiple episodes of instability is relatively small (about 14% to 20% depending on the measure), as with the other measures, we found that high-poverty and high-minority schools experienced more episodes than low-poverty or low-minority schools on average. 11 Similarly, the differences were starkest based on accountability ratings; schools with unacceptable ratings experienced more than two episodes, on average, based on relative rates, while schools with exemplary ratings experienced less than one. We also found that while 36.2% of schools with unacceptable ratings experienced three or more episodes of turnover in the 10-year period, only 5.72% of schools with exemplary ratings did so.
Schools With Severe Instability
We also examined the proportion of schools that experienced the most significant problems based on our measures. For simplicity, we focus on the prevalence of three types of what we call severe instability problems: turbulence, or schools that have more than two episodes (or more than two consecutive two-year periods of high relative turnover); high cumulative turnover, schools that lost the most teachers (top quartile) over a five-year period; and chronic instability, or schools with seven or more years of high relative turnover. We find that the most common severe turnover problem experienced by schools in Texas was severe cumulative turnover, affecting 42.9% of all schools; the second most common severe turnover problem was turbulence, affecting one-fifth of Texas schools (20.8%). Relatively few schools (7.4%) experienced arguably the most acute turnover problem, chronic instability.
We then explored the extent to which some schools may experience multiple types of severe instability. We find that nearly one-quarter (24.6%) of all schools in Texas experienced one of these types of instability, an additional one-eighth of the state’s schools (12.3%) experienced two types of instability, and a small subset of schools (7.3%) experienced all three types of instability over the study period (turbulence, high cumulative turnover, and chronic instability). While 7% may seem small, this represents about 500 schools in the state that are in need of the most directed resources and support. In analyzing the composition of these schools, we find that the schools in each of these categories have larger concentrations of minority and low-income students than the state average and are more likely to be designated as unacceptable (see Figures 10–13).
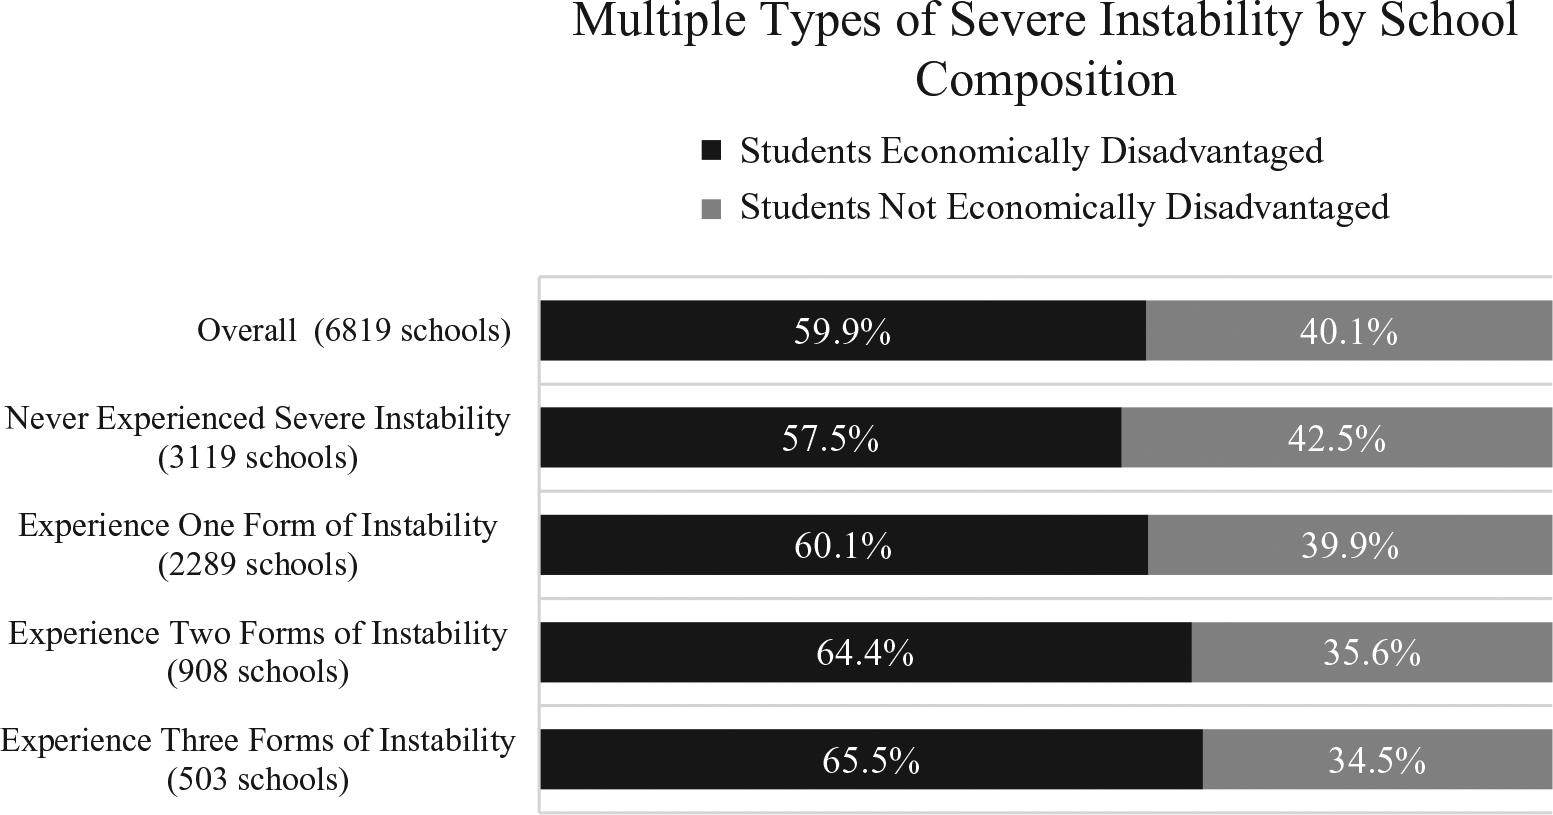
Schools with multiple types of severe instability by percentage of economically disadvantaged students
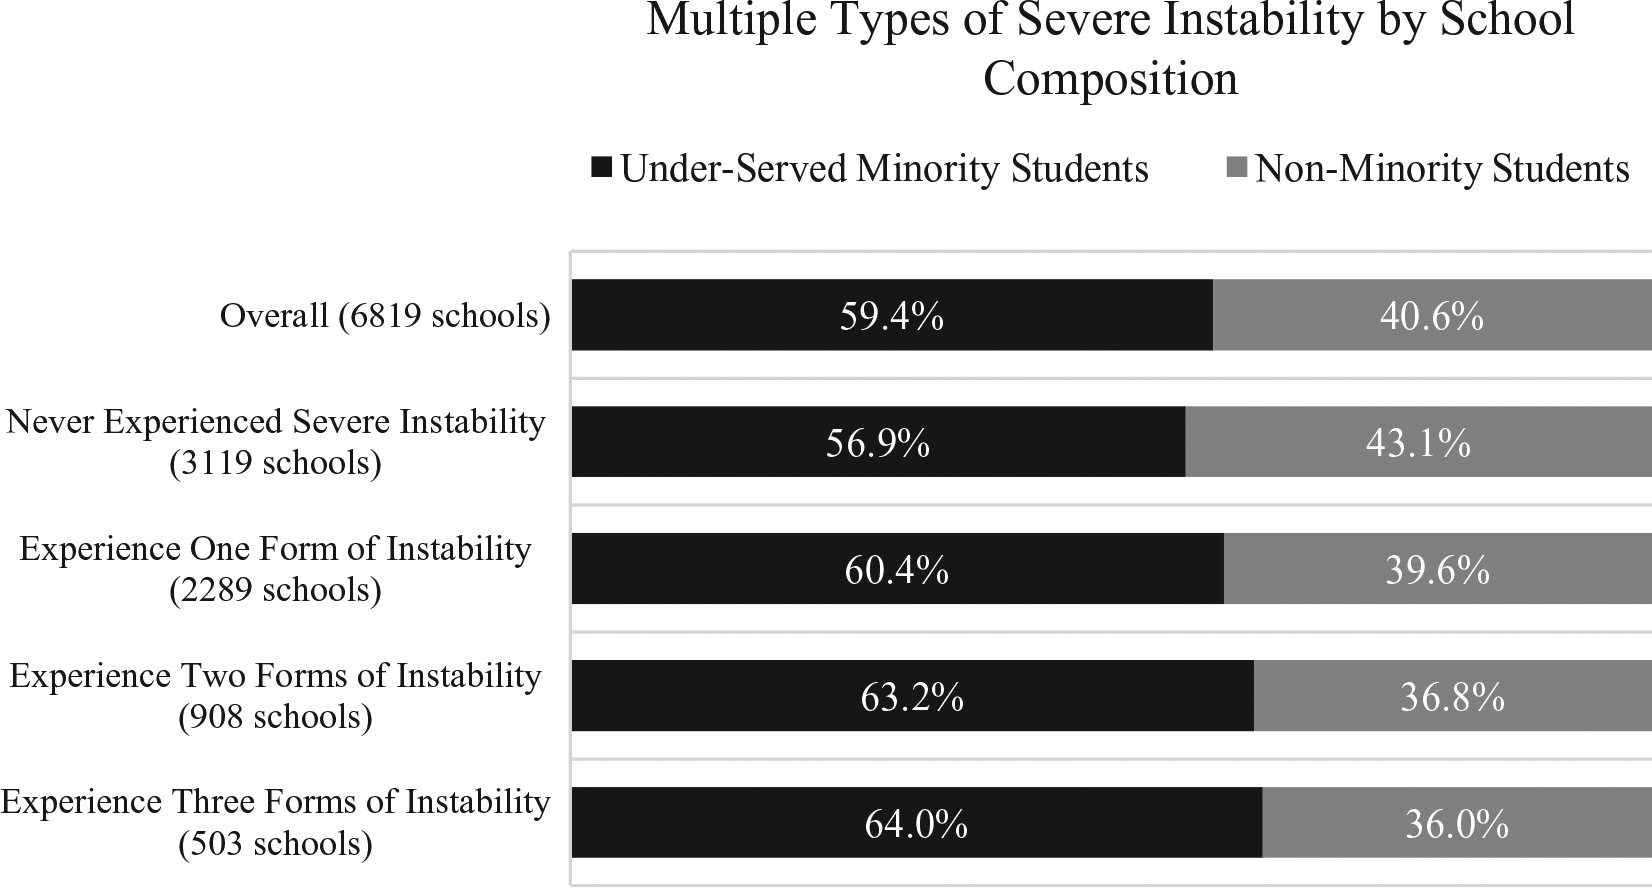
Schools with multiple types of severe instability by percentage of underserved minority students
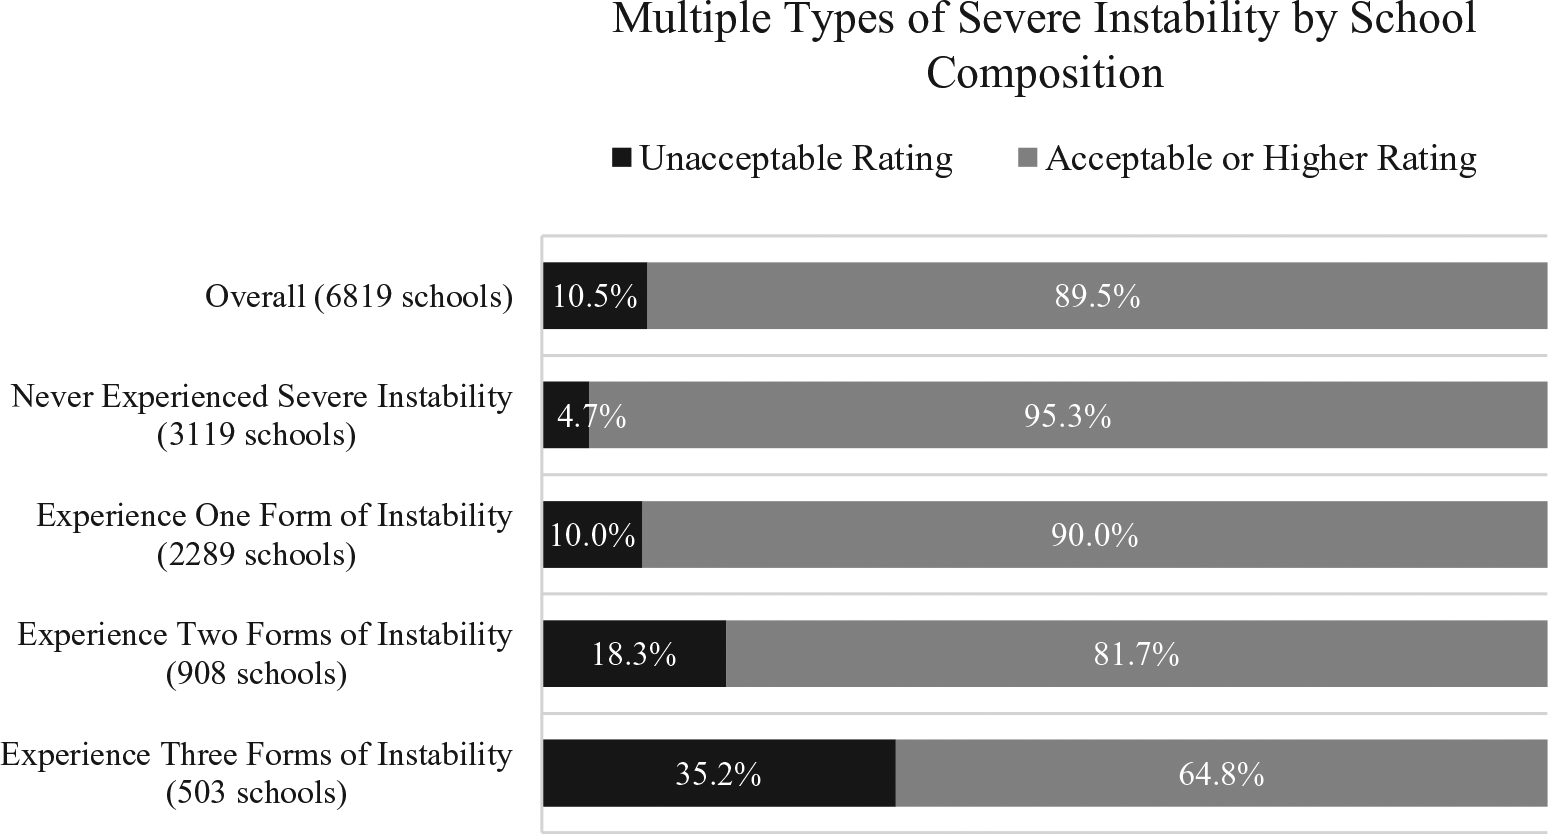
Schools with multiple types of severe instability by school accountability status
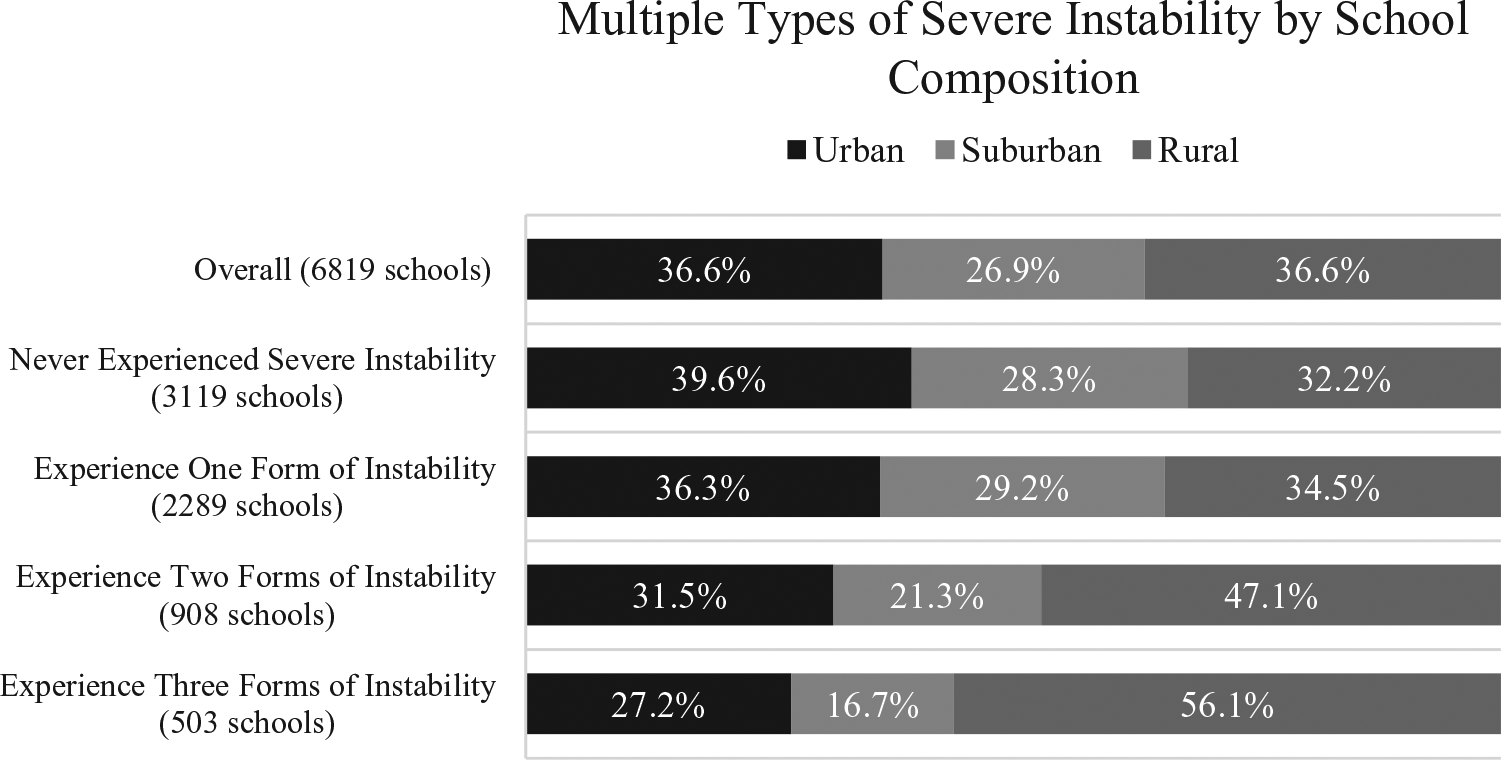
Schools with multiple types of severe instability by urbanicity
Discussion and Conclusion
The six measures of teacher turnover presented in this essay each shed light on a different part of the problem of staffing instability in schools. We have argued that while annual turnover rates, the measure most commonly used by researchers and policymakers, can be helpful in flagging schools that have experienced significant staffing churn, they do not provide information as to whether schools may be suffering from temporary (or even healthy) turnover, or whether they have struggled with deeper turnover problems for years. Long-term measures, by contrast, help to illuminate nuances—and severity—of the turnover problems that may be facing schools over time. For example, schools may experience perpetually high rates of turnover (chronic), deep losses over time (cumulative), or repeated bouts of turnover (episodic); remain stuck in high turnover status for a number of years (turnover spell); or a combination of these. While schools suffering from each of these types of problems could expect difficulties in building the social ties necessary for long-term relationships and school-wide improvement (Holme & Rangel, 2012; Spillane et al., 2012), the policy interventions for a school experiencing chronic turnover year after year may be different than a school experiencing high cumulative turnover, where losses are relatively small each year but amount to turnover of virtually the entire school’s staff over a period of five years. Research is needed to identify what factors cause these different types of instability and what interventions are most appropriate for each type of problem.
When our measures are illustrated with Texas state data, the longitudinal measures of turnover conceptualized and illustrated within this essay indicate both concerning losses of human capital across all schools over time and particularly troubling disparities in turnover patterns for schools serving low-income students and students of color. Our data show that high-poverty, high-minority, and low-performing schools struggle with much deeper turnover problems than the annual turnover rates suggest. Such schools, our data indicate, are not only more likely to struggle with repeated high turnover rates (chronic) but struggle for longer periods of time with deep turnover, losing more staff (cumulative) more often (episodic) than schools serving few students of color or in poverty. Our measures also show that those same types of schools are more vulnerable to becoming a high turnover school (turnover entry) and have difficulty recovering from high turnover status (turnover exit). We find that such schools are also likely to suffer from multiple types of instability problems at the same time.
These findings have significant implications for policy and practice. Identifying which schools experience different types of instability may generate more targeted policy solutions. Indeed, using our measures, policymakers could more easily target scarce funds to the relatively small number of schools experiencing the greatest instability over time. It is particularly important to distinguish between those schools experiencing temporary spells of instability and those that experience chronic instability as these situations require distinct policy remedies. In light of nationwide teacher shortages (Rich, 2015), policymakers may increasingly focus on teacher retention alongside teacher preparation and recruitment efforts, and our measures may suggest new insights to inform or focus those policy efforts.
The turnover patterns we have illustrated in this essay may also be useful in explaining how and why the implementation of school reform may stall in some contexts. Our analysis illustrates that some schools are far more likely to lose significant amounts of social and human capital over time, thereby potentially creating a barrier to school improvement. Indeed, some studies have pointed out that turnover can place significant managerial burden on principals, who must constantly focus on hiring and training new teachers, rather than systemic and sustained instructional improvement across a campus (see e.g., Camburn, Spillane, & Sebastian, 2010; Horng, Klasik, & Loeb, 2010). Because a common reason for teacher turnover is a lack of instructional support from the leadership team, this may encourage even more turnover, creating a cyclical effect (Allensworth et al., 2009; Boyd et al., 2011; Kraft, Marinell, & Yee, 2016; Ladd, 2011). Further, the severe staffing challenges that face schools with “unacceptable” accountability ratings may also create a downward spiral, where the schools in most need of improvement continue to lose key staff and human capital resources, preventing them from being able to engage in sustained school improvement efforts. Given the association between deep turnover and racial and economic concentration in schools, our findings also indicate that long-term struggles with turnover may be one of the underlying mechanisms through which racial segregation and poverty concentration negatively affect student performance in schools (see Reardon & Owens, 2014).
The longitudinal measures of turnover we describe in this essay can be used by researchers to augment existing short-term turnover measures and explore critical questions in the research literature. For example, several prior studies have demonstrated that turnover negatively affects student performance (e.g., Hanushek, Rivkin, & Schiman, 2016; Ronfeldt et al., 2013). The measures presented in this essay may be used by researchers to better understand the nuances of these turnover/student performance relationships, such as whether student outcomes are worse in schools experiencing chronic versus temporary turnover or in schools with multiple episodes of turnover compared with few turnover episodes. Indeed, the poverty research that inspired some of our turnover measures has found that outcomes for people experiencing transient versus chronic poverty are very different, with chronic poverty yielding the worst outcomes (Kimberlin & Duerr Berrick, 2015). Further, researchers can study schools that may defy these relationships, those that perform academically well in spite of the most severe types of turnover, to learn whether there are particular organizational structures or leadership practices in those schools that may serve as stabilizing forces, helping to buffer schools against turnover effects.
There are also important questions around leadership, school culture, and policy that can be explored through these longitudinal measures. Researchers could, for example, examine whether principal turnover or characteristics of school principals (i.e., experience or effectiveness) are related to the likelihood of a school’s instability entry or exit, or the number of instability episodes a school experiences. Researchers could also explore whether there are different predictors of the different types of turnover, namely, whether leadership might be predictive of certain types of instability (e.g., cumulative), while school culture is more highly related to other types (e.g., chronic). Researchers could also examine whether different policies (i.e., teacher retention programs, mentoring programs, collective bargaining arrangements, etc.) may be more effective in ameliorating some types of instability than others. Schools that are exceptions in the long-term turnover patterns—those schools that have lower chronic or cumulative turnover rates than would be predicted based on demographics—could also be studied to learn what practices might explain these rates.
Researchers can also explore how the turnover measures illustrated in this essay align with other types of mobility measures to provide a holistic understanding of the staffing problems facing schools and districts. For example, while this essay focuses primarily on the supply of teachers (i.e., the teachers who are departing from year to year), future research could also consider changes in school demand (i.e., the change in number of teaching positions from year to year) as well as midyear mobility (month-to-month staffing changes) for a holistic, system-level understanding of staff turnover. Researchers could complement these measures with other data on teacher mobility, such as the destinations of leavers (i.e., distinguishing between teachers who switch schools, switch districts, or leave the field altogether), as this may have different implications for appropriate policy levers.
Taken together, the multiple types of staffing and mobility measures can provide additional insights into the problem of turnover and enhance our understanding of the causes and consequences of instability in schools. These measures can also potentially point to new directions in state and district policy to address instability, particularly for the most affected schools.
Footnotes
Notes
Authors
References
Supplementary Material
Please find the following supplemental material available below.
For Open Access articles published under a Creative Commons License, all supplemental material carries the same license as the article it is associated with.
For non-Open Access articles published, all supplemental material carries a non-exclusive license, and permission requests for re-use of supplemental material or any part of supplemental material shall be sent directly to the copyright owner as specified in the copyright notice associated with the article.