



Abstract
Sexual minorities’ risk for exclusionary discipline is a commonly cited indicator of the challenges that these students face. The current study addresses this issue by introducing a new data source for research on sexual minority students: the Fragile Families and Childhood Wellbeing Study. In this geographically diverse, population-based sample, I find that sexual minorities continue to face higher rates of discipline than their peers. However, this risk is highly stratified by sex: Same-sex attraction is associated with 95% higher odds of discipline among girls but no apparent discipline risk among boys. Sexual minority girls’ risk for discipline is only partially mediated by behavior, a result that is plausibly consistent with the interpretation that these students continue to face discriminatory treatment in schools.
The American Education Research Association (AERA) recently completed a multiyear effort to assess the state of “LGBTQ issues in education” and promote a new generation of LGBTQ-focused education research (Wimberly, 2015). The changing social and legal status of America’s LGBTQ population has enabled sexual minority students to come out at younger ages (Dunlap, 2016) and become more visible in schools (Cianciotto & Cahill, 2012), creating a need for greater research on their educational experiences and outcomes. 1 Although a variety of factors have impeded LGBTQ education research, a particularly critical issue is the absence of large-scale, population-based data sources that include information on both sexual orientation and school-related outcomes (Snapp, Russell, Arredondo, & Skiba, 2016; Wimberly & Battle, 2015).
One area that exemplifies this situation is the lack of data on sexual minority students’ experiences with school discipline (Arredondo, Gray, Russell, Skiba, & Snapp, 2016). Exclusionary discipline—the practice of removing students from school through suspensions and expulsions—has attracted increasing scrutiny in recent years, both because it is associated with a range of negative outcomes (e.g., Fabelo et al., 2011) and because it disproportionately impacts already disadvantaged groups of students (e.g., Skiba et al., 2014). Although much of the discussion on exclusionary discipline has focused on students of color, sexual minority students are also commonly listed among the groups of students that face an increased risk for disciplinary sanction (e.g., Committee on the Judiciary of the United States Senate, 2012; Council of State Governments, 2014).
Despite the regularity of this claim, the only nationally representative data on school discipline and sexual orientation reflects high school experiences that culminated about 20 years ago (Himmelstein & Brückner, 2011). Recent research using focus groups (e.g., Snapp, Hoenig, Fields & Russell, 2015), recruited samples (Kosciw, Greytak, Giga, Villenas, & Danischewski, 2016), and county-representative data (Poteat, Scheer & Chong, 2016) attest to the continued salience of disciplinary sanctions in shaping sexual minority students’ school experiences. However, without geographically diverse, population-based data, it is difficult to determine whether the experiences reported in these studies reflect generalizable patterns or localized problems.
The current study begins to address this need. I introduce a new data source for research on sexual minority students: the Fragile Families and Childhood Wellbeing Study (FFCWS). A population-based study of children born in American cities between 1998 and 2000, the FFCWS has collected years of rich survey data on children’s educational experiences and outcomes. Because its recently completed Year 15 follow-up also collected information on teens’ sexual orientation, the FFCWS is now a unique resource for research on sexual minority students.
I illustrate the potential of these data by providing new evidence on the question of whether sexual minority students continue to face higher rates of exclusionary discipline than their peers. Compared to teens who report attraction only for the other sex, I find that same-sex attracted teens have 29% higher odds of experiencing exclusionary discipline. However, consistent with prior research (Himmelstein & Brückner, 2011), sexual minority students’ risk for exclusionary discipline is highly stratified by sex: Same-sex attraction is associated with 95% higher odds of discipline among girls but no apparent discipline risk among boys. I estimate that only about 38% of sex-same attracted girls’ discipline rates can be explained by parent-reported behavioral problems. This unexplained gap in discipline rates is plausibly consistent with the interpretation that sexual minority students continue to face discriminatory treatment in the administration of school discipline. However, the apparent sex-specificity of risks challenges the idea that sexual minority students’ experiences can be explained by a common, gender-neutral experience of homophobic treatment. Instead, future research should explore the potentially asymmetric consequences of sexual minority status for girls versus boys.
Background
The Significance of Data Limitations in LGBTQ Education Research
Research on the LGBTQ population has long been hampered by data limitations. The stigma surrounding LGBTQ lives and the presumed sensitivity of asking about sexual orientation and gender identity in surveys have caused funders and Institutional Review Boards to resist the inclusion of these measures in large-scale survey research programs (National Research Council, 2011). Opposition to LGBTQ data collection has been particularly fierce in terms of research on minors (Wimberly & Battle, 2015).
This opposition, together with legitimate concerns about protecting the privacy of LGBTQ youth (Snapp et al., 2016), has resulted in a critical shortage of data on the educational experiences and outcomes of sexual minority students. None of the available national longitudinal studies of education have included information on sexual orientation or gender identity. Instead, this information has only been collected in health surveys, such as the Youth Risk Behavior Survey series. These studies may collect information about incidents that happen on school grounds, such as bullying, but they rarely provide more substantive information about educational experiences and outcomes. The one prominent exception to this was the National Longitudinal Study of Adolescent to Adult Health (AddHealth), itself a health study, but one that included an unusually rich amount of education-related information.
These longstanding limitations have meant that almost all education research on sexual minority youth has been based on smaller, nonprobability samples (Wimberly & Battle, 2015). Such research has been essential for documenting the issues facing sexual minorities in schools. In terms of motivating the need for policies that protect LGBTQ students’ right to learn in safe and supportive schools, even a single documented experience of discrimination is one too many. However, research using nonprobability samples cannot address questions about the population-level prevalence, distribution, and correlates of these experiences. Moreover, as Savin-Williams (2005) argues, by using nonprobability samples—samples that historically were often identified through organizations serving at-risk LGBTQ teens—researchers risk promoting an unrepresentative and overly pathologized view of contemporary LGBTQ experience.
Sexual Minority Students’ Experiences of School Discipline
One commonly cited indicator of sexual minority students’ continued difficulties in schools is the elevated risk of disciplinary sanction that these students face. For example, in its School Discipline Consensus Report, the Council of State Governments (2014) declared that “Research and data on school discipline practices are clear. . . . A disproportionately large percentage of disciplined students are youth of color, students with disabilities, and youth who identify as lesbian, gay, bisexual, or transgender” (p. ix). Senator Durban, in his introduction to the Senate’s hearing on Ending the School-to-Prison Pipeline, echoed this argument, noting that “disparities extend beyond race. Nationally . . . gay, lesbian, bisexual, and transgender youth are more likely to be disciplined and arrested than their peers” (Committee on the Judiciary of the United States Senate, 2012, p. 2).
These arguments can be traced to Himmelstein and Brückner’s (2011) influential study of criminal and school sanctions among sexual minority youth. Using data from AddHealth, Himmelstein and Brückner found that sexual minority teens reported experiencing higher rates of a range of sanctions, including expulsions. This elevated risk for sanction largely persisted after controlling for self-reported behavior, particularly among women. For expulsion in particular, women who reported same-sex attraction had 70% higher odds of reporting an expulsion (p = .01) and an estimated 59% higher odds after adjusting for their demographics and behavior (p = .04). Among men, there were no significant differences in expulsion rates after controlling for behavior and background and conflicting patterns in observed rates.
Himmelstein and Brückner’s (2011) study remains the only nationally representative evidence on exclusionary discipline and sexual orientation. However, despite its recent publication, its underlying data reflect a context that could be very different than the one that sexual minority students experience today. On average, AddHealth respondents completed their K–12 education in 1997–1998. Since that time, the social and legal context surrounding LGBTQ rights has changed considerably. Even so, studies using more recent data suggest that sexual minority students remain vulnerable to behavioral sanctions in schools.
Poteat et al. (2016) extend Himmelstein and Brückner’s (2011) work into a contemporary context, utilizing county-representative data from the 2012 Dane County Youth Assessment. Analyzing suspensions and juvenile detentions among high school students, Poteat et al. find that teens who reported a lesbian, gay, bisexual, or questioning identity also reported significantly higher levels of both suspensions and juvenile detentions; they do not report results separately by sex. Although sexual minority teens reported higher levels of self-protective and coping behaviors that would increase their risk for sanction, behavior alone could not explain the sanction rates that they faced. Instead, Poteat et al. demonstrate that sexual minority teens appear to be sanctioned more harshly than heterosexual teens for reports of the same behavior.
What mechanisms underlie these patterns? Poteat et al. (2016) frame their results within the larger body of research on racial differences in school and juvenile justice sanctions, which typically finds that differential behavior between groups is unable to explain differences in sanctions. Instead, this research identifies differential treatment by institutional agents as the more consequential source of racial disparities (e.g., Gregory, Skiba, & Noguera, 2010; Piquero, 2008). And yet, many of the mechanisms advanced to explain racial disparities in school discipline—such as the concentration of exclusionary discipline in racially isolated schools (e.g., Ramey, 2015) or racial biases among teachers (e.g., Okonofua & Eberhardt, 2015)—would seem less applicable to sexual minority students.
Insight into the differential treatment experienced by sexual minority students can be found in recent research using interviews with students and teachers (Bellinger, Darcangelo, Horn, Meiners, & Schriber, 2016; Chmielewski, Belmonte, Stoudt, & Fine, 2016; Snapp et al., 2015) as well as the online School Climate Surveys administered by GLSEN, an LGBTQ advocacy organization that solicits information from sexual minority teens across the country through social media and local partners (Kosciw et al., 2016). At least three consistent themes emerge from this research. First, sexual minority students report that they are often disciplined as a result of their own victimization, either because they fought back, skipped school out of fear, or were simply party to an altercation in which they were being attacked. Second, public displays of affection (PDA) appear to be an especially contentious flashpoint between students and school officials, with same-sex PDA being punished in a way that other-sex PDA is not. Finally, even for students who are not “out” in their school, nonconforming gender expression marks students as targets of special scrutiny. Girls who do not present themselves in sufficiently “feminine” ways report being treated as particularly threatening, a finding that is also reflected in the literature on the behavioral sanctions imposed on “loud” or “defiant” Black girls (E. W. Morris & Perry, 2017; M. M. Morris, 2016).
Research Questions and Study Contributions
Taken together, existing evidence provides strong cause for concern about the differential impact of school discipline on sexual minority students. Sexual minority girls especially appear to face a high risk for sanctions. Nevertheless, apart from AddHealth, the only population-based data that have been available to test these patterns are from a single county. This study brings a new data source to the topic and the field of LGBTQ education research more broadly. I use it to address three questions:
Research Question 1: Do sexual minority students experience higher rates of exclusionary discipline?
Research Question 2: Does any risk of school exclusion faced by sexual minority students vary by sex at birth?
Research Question 3: Can any risk of school exclusion faced by sexual minority students be explained by reported patterns of behavior?
Data and Methods
The Fragile Families and Childhood Wellbeing Study
The Fragile Families and Child Wellbeing Study is a birth cohort study of 4,898 children born in 20 American cities between 1998 and 2000. The study employed a three-stage, probability sampling design (sampling cities, then hospitals, then births), with a two-to-one oversample of nonmarital births. At baseline, the weighted sample was representative of all births from 1998 to 2000 in American cities with populations of 200,000 or more. Full details on the study’s sampling strategy, participating cities and hospitals, and characteristics of the baseline sample can be found in Reichman, Teitler, Garfinkel, and McLanahan (2001). Since baseline, there have been five additional waves of data collection, collecting information from a variety of sources approximately 1, 3, 5, 9, and 15 years after the child’s birth.
Although a complete description of the available FFCWS data is beyond the scope of this study, there are four important aspects of the FFCWS that make it a unique resource for education research on sexual minorities. First, though the FFCWS is not nationally representative, it is population-based and geographically diverse. At Year 15, FFCWS respondents lived in over 1,400 zip codes, spread over 350 municipalities in 49 states. Second, to my knowledge, the FFCWS is the only American, population-based study with information on sexual orientation that is longitudinal from birth. This offers a unique opportunity to identify the origins and trajectories of phenomena that have previously been documented later in the life course. For example, in other research, I document the early onset and lasting correlates of the childhood bullying experiences endured by sexual minority youth. Third, the FFCWS collected information from multiple responders, allowing researchers to mitigate against the “mischievous responder” problem that may have compromised previous population-based studies of sexual minority teens (e.g., Savin-Williams & Joyner, 2014; but also see Fish & Russell, in press). Finally, the FFCWS has simply collected a wider range of education-related information than is available in other population-based sources.
Analytic Sample
The current study utilizes data from the FFCWS’s recently completed Year 15 follow-up. The Year 15 study included interviews with teens and teens’ primary caregivers (88% of whom were the teen’s biological mother) as well as home visits for a randomly selected subsample of families. Two distinct data collection efforts occurred. The primary data collection effort was conducted by Westat between February 2014 and October 2016. A separate collection effort, focused exclusively on locating respondents who did not participate in the Year 9 assessment, was conducted by the Population Research Center at Columbia University between August 2015 and March 2017. Interviews were conducted primarily by phone, with about 5% of caregivers and 6% of teens being interviewed in person; five caregivers and one teen completed the Year 15 assessment as an online survey.
Of the 4,898 families in the baseline sample, there were 3,429 cases in which both the teen and the primary caregiver participated in the Year 15 interview. Complete data on all variables were available for 3,396 cases. 2 After identifying the main analytic sample, I screened for “mischievous responders”: teens who falsely report low-frequency responses to be “funny.” Even small numbers of mischievous responders have been shown to distort comparisons involving low-incidence groups, such as adoptees (Fan et al., 2002) and those with physical disabilities (Fan et al., 2006). To identify teens who may not have taken the survey seriously, I used four sets of potential “screeners” (Robinson-Cimpian, 2014). I found no teens who reported participating in every one of 13 possible delinquency behaviors, nor were there any teens who reported having used every one of seven illegal drugs. I removed one teen who “somewhat agreed” with every statement in a set of 36 successive statements and one other teen who reported having sexual intercourse with an implausibly high number of partners; neither of these teens had also reported sexual minority status. Removing the two teens with questionable responses produced a final analytic sample of 3,394 teens.
Measures
Same-sex attraction
Conceptually, there is a consensus that sexual orientation is constituted by three dimensions: sexual attraction, sexual behavior, and self-identification (National Research Council, 2011). In practice, however, surveys of adolescents have rarely assessed all three dimensions of sexual orientation at once (Coker, Austin, & Schuster, 2010). The FFCWS is no different. The Year 15 youth survey allows researchers to identify sexual orientation primarily in terms of attraction, with additional questions that capture some—but not necessarily all—instances of past same-sex dating and intercourse.
To maximize sample sizes, I focus on attraction. Assessing sexual orientation using attraction is a valid approach that is consistent with best practice standards in the field. Indeed, because adolescents are less likely to be sexually active and their self-identification is more likely to still be in flux, attraction measures of sexual orientation are arguably the most developmentally appropriate for adolescents (Coker et al., 2010; Williams Institute, 2009).
The specific questions that I use to construct a measure of same-sex attraction were asked in a section of the Year 15 interview about dating and sexual experience, which begins with teens being told “now we would like to talk about your experience with romantic relationships.” After two questions that asked teens about whether their parents would approve of them dating or having sex (regardless of the teen’s own experiences), the third and fourth questions of this section ask all teens “Have you ever liked a girl as more than just a friend?” and “Have you ever liked a boy as more than just a friend?” Although the somewhat euphemistic wording of “liked . . . more than just a friend” could be interpreted as implying something other than sexual attraction, the placement of these questions after statements about romance, dating, and sexual intercourse should largely mitigate against this possibility. 3 Because the survey does not include a measure of gender identity, I use the teen’s sex at birth to determine whether they have reported same-sex attraction.
Exclusionary discipline
To assess whether the teen has experienced exclusionary discipline by the time of the Year 15 interview, I use their primary caregiver’s response to the question: “Has [youth’s name] ever been suspended or expelled?” Using primary caregivers’ responses provides further protection against potentially misleading responses from teens. In alternate models, presented in Online Appendix A (available on the journal website), I use teen reports of exclusionary discipline and find that all results are substantively unchanged.
Control variables
Teens’ willingness to report same-sex attraction may be structured in part by aspects of their identity that could also affect their risk for having experienced exclusionary discipline. For example, older teens may be more willing to report same-sex attraction and would have also been exposed to the risk of discipline longer. With these kinds of differences in mind, I include six control variables: whether they are Black, whether they are Hispanic, whether either of their parents is an immigrant, their age at the time of their Year 15 interview, and whether their primary caregiver reports that a doctor has ever diagnosed them with a learning disability.
Aggressive behavior
Research using administrative records on school discipline (e.g., E. W. Morris & Perry, 2017; Skiba et al., 2014) consistently demonstrates that most suspensions are for subjectively defined behaviors like “disturbing school” and “willful defiance.” Therefore, to consider a broad range of behaviors that would put teens at risk for exclusionary discipline, I use caregivers’ reports on the aggressive behavior scale of Achenbach and Rescorla’s (2001) Child Behavior Checklist (CBCL-6/18). The CBCL is a widely used diagnostic tool that has demonstrated strong psychometric properties in research and clinical settings (e.g., Nakamura, Ebesutani, Bernstein, & Chorpita, 2009). The aggressive behavior scale includes 10 items (α = 0.83) that capture the kinds of behavior that have been shown to result in disciplinary sanctions, such as “youth gets in many fights”; “youth is stubborn, sullen, or irritable”; “youth argues a lot”; and “youth is unusually loud.” As recommended, I score responses from 1 (not true) to 3 (often true), average scores across the 10 items, and standardize these averages to a mean of zero and standard deviation of one.
Method
This study is purely descriptive: The data do not support causal claims about sexual minority students facing disciplinary sanctions because of their sexual orientation. With this in mind, I analyze the data in three ways. First, I compare observed differences across groups, conducting t tests for significant differences in group means. Second, I estimate logistic regressions, modeling the log-odds of exclusionary discipline as a linear function of attraction type and the control variables. In both analyses, I compare individuals both overall and separately by sex at birth. I distinguish teens who do not report attraction for either sex, comparing those who report same-sex attraction to those who report attraction exclusively for the other-sex (Williams Institute, 2009).
Finally, after estimating the risk associated with same-sex attraction, I test whether this risk is mediated by aggressive behavior using Imai, Keele, and Tingley’s (2010) mediation analysis framework. This framework, described more fully in Online Appendix B (available on the journal website), decomposes the total “effect” of same-sex attraction into two parts: an indirect effect explained by aggressive behavior and a direct effect that includes all other factors associated with same-sex attraction.
Results
Sample Description
Descriptive statistics on the analytic sample are presented in Table 1. About 10% of the sample reports same-sex attraction, with 8% reporting attraction to both sexes and 2% reporting exclusively same-sex attraction. As I illustrate in Online Appendix Table 1C (available on the journal website), these reporting patterns—as well as their further breakdown by sex and race/ethnicity—are similar to those in the 2015 national Youth Risk Behavior Survey (Kann et al., 2016), the first nationally representative data on adolescent sexual orientation since AddHealth. The majority of this study’s analytic sample is students of color, with 49% of students identifying as Black and 25% as Hispanic. The overrepresentation of students of color underscores the fact that the FFCWS sample cannot be taken as representative of the student population nationwide. However, it also provides a counterpoint to other sexual minority samples in which students of color are substantially underrepresented (e.g., Kosciw et al., 2016) and extends the literature from samples in which exclusionary discipline was relatively rare (Poteat et al., 2016) to one in which it is more common.
Sample Summary

Note. N = 3,394. Sex at birth and parent immigrant status reported at baseline; all other variables reported at Year 15. PCG = primary caregiver.
Observed Differences by Attraction Type
Table 2 presents the observed differences in discipline rates, background characteristics, and aggressive behavior by attraction type. The first set of results shows that overall, 34% of same-sex attracted (SSA) teens had experienced exclusionary discipline, compared to 28% of teens who report exclusively other-sex attraction (OSA), a 6 percentage point difference (p = .037). Separating the sample by sex at birth, however, reveals a more stark pattern. Compared to OSA females, SSA females had 13 percentage points higher rates of discipline (p = .000). Indeed, SSA females experienced discipline rates that were indistinguishable from those experienced by OSA males, with 34% of both SSA females and OSA males being disciplined.
Observed Differences by Attraction Type

Note. Teens who report no romantic attractions (192 females, 134 males) are excluded from table; full sample is 3,394. Calculated differences may not reflected observed differences due to rounding. The p values are in parentheses. SSA = same-sex attraction; OSA = exclusively other-sex attraction.
p < .10. *p < .05. **p < .01. ***p < .001 (two-tailed tests).
Among males, there was no observable difference in discipline rates by attraction type. Notably, however, far fewer males reported SSA than females (65 males vs. 270 females). This difference in reporting is largely the result of females’ higher rates of attraction to both sexes, a pattern that has been replicated in both adolescent (Kann et al., 2016) and adult samples (England, Mishel, & Caudillo, 2016). The smaller sample size for SSA males means that their results should be interpreted with caution.
Table 2 also reveals diverging SSA reporting patterns by background characteristics, which motivate the multivariate models that follow. Overall, compared to OSA teens, SSA teens are significantly older and less likely to have an immigrant parent. Among females, SSA teens are also more likely to have been diagnosed with a learning disability, such as ADHD. These diagnoses may themselves reflect prior academic and disciplinary problems, and so controlling for them is likely to be a conservative approach.
Multivariate Models
The multiple differences between teens who report SSA and those who report OSA illustrate the need for models that statistically adjust for student background. Table 3 presents these results. The first column of each set of results expresses the observed differences in discipline rates in terms of odds ratios, indicating that SSA is associated with 29% higher odds of discipline overall, 95% higher odds among females, and no observable difference among males. Controlling for other characteristics reduces but does not eliminate the risk associated with SSA among females: Compared to those who report only OSA, females who report SSA are estimated to have 79% higher odds of experiencing exclusionary discipline (p = .000).
Observed and Regression Adjusted Odds of Exclusionary Discipline

Note. Reported coefficients are odds ratios. The p values are in parentheses.
p < .10. *p < .05. **p < .01. ***p < .001 (two-tailed tests).
Table 3 also shows that teens who report never having felt attraction to either sex had consistently lower rates of discipline than those who report OSA. This fact underscores the importance of recognizing this group separately in adolescent samples since including them in the comparison group for SSA teens would inflate the apparent disadvantages that SSA teens face (Williams Institute, 2009). Compared to all other teens, SSA teens have 38% higher odds of discipline overall (p = .008), 109% higher odds among females (p = .000), and 4% higher odds among males (p = .881).
To facilitate a more intuitive interpretation of the logistic regression coefficients, I convert the results of the fully specified models in Table 3 into average adjusted predictions for the students in each attraction type. Figure 1 presents these results. For completeness, in Online Appendix C (available on the journal website), I also present analyses demonstrating that these core patterns of results are replicated when I estimate models separately for Black students and all other students (Table 2C, available on the journal website) and when I distinguish teens who report attraction for both sexes from those who report only same-sex attraction (Table 3C, available on the journal website). Finally, I also demonstrate that at Year 9, there were no observable differences in discipline rates between children who would later report same-sex attraction and those who would not (Table 4C, available on the journal website).
Mediation Analysis for Females

Note. Reported coefficients for mediator model are standard deviations; coefficients for outcome model are odds ratios. The p values are in parentheses.
p < .05. **p < .01. ***p < .001 (two-tailed tests).
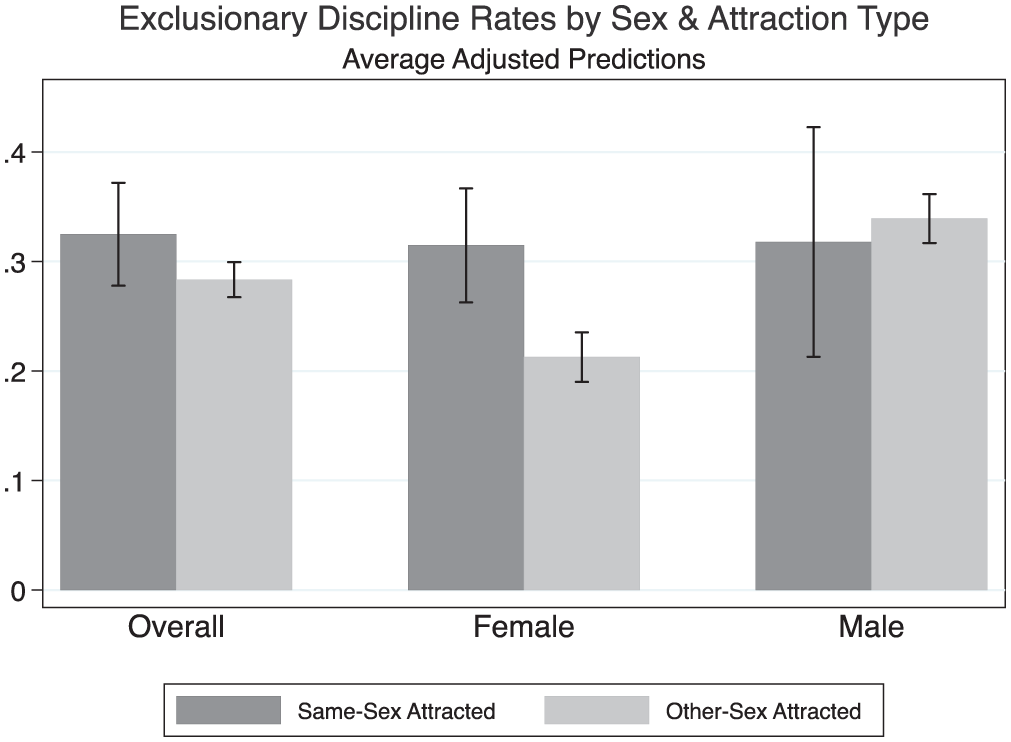
Predicted probability of exclusionary discipline
Mediation Analysis
Can sexual minority students’ higher rates of discipline be explained by their reported behavior? Table 4 presents the results of a mediation analysis addressing this question. Because the discipline risk associated with SSA was concentrated among females, this analysis was conducted only using the female sample. The first model indicates that compared to OSA females, SSA females are estimated to have received about 0.28 standard deviations higher scores on the aggressive behavior scale (p = .000). In turn, aggressive behavior is a highly consequential predictor of having faced exclusionary discipline: The second model indicates that a one standard deviation increase in reports of aggressive behavior is associated with 150% higher odds of disciplinary sanction (p = .000).
The mediation analysis algorithm combines the predictions from these two models to estimate how much of sexual minority females’ discipline rates can be explained by their higher rates of aggressive behavior. The results indicate that only about 38% of SSA’s association with exclusionary discipline is mediated through behavior. That is, the majority of the elevated discipline rates that SSA females faced is left unexplained by caregiver reports of aggressive behavior. Although the data cannot directly demonstrate any discriminatory treatment faced by sexual minority students, this unexplained gap in discipline rates is consistent with the interpretation that sexual minorities are disciplined in ways that other students are not.
Discussion
Using newly collected data from a geographically diverse, population-based sample of youth, the current study has provided new evidence that sexual minority students continue to face higher rates of exclusionary discipline than their peers. Notably, however, this study follows previous population-based research in finding that the risk for disciplinary sanction is concentrated among sexual minority girls. Although the limited numbers of sexual minority boys in the FFCWS data necessitate a cautious interpretation of their outcomes, the consistency of these results with other research suggests that in terms of school sanctions, sexual orientation may have a different meaning for boys versus girls. If this is true, then attributing sexual minorities’ discipline rates to a common experience of gender-neutral homophobic treatment may be imprecise. Instead, internally felt sexual orientation may primarily shape students’ treatment in schools insofar as it manifests in publicly observed gender nonconformity, the consequences of which may be asymmetric for boys and girls.
Gender nonconformity—in terms of speech, interests, dress, peer groups, and other gendered aspects of identity—is significantly (though imperfectly) associated with sexual orientation (American Academy of Child and Adolescent Psychiatry, 2012). For boys, more “feminine” gender expression has been shown to yield social sanctions from peers. Pascoe (2007) demonstrates, for example, how the specter of being a “fag” is used to police the boundaries of masculinity among teenage boys. Similarly, in their recent meta-analysis of bullying studies, Toomey and Russell (2016) find that sexual minority boys appear to face higher rates of victimization than sexual minority girls. However, even if gender nonconformity may provoke severe peer sanctions, for those growing up in contexts where boys are treated as potentially criminal from young ages (e.g., Ferguson, 2000), less masculine gender expression could potentially be protective against the more formal behavioral sanctions imposed by schools or the police. 4
By contrast, for sexual minority girls, more masculine, “unladylike” gender expression may be interpreted by adults as threatening in a way that requires more formal control. Several of Snapp et al.’s (2015) respondents, for example, argued that gender-nonconforming girls are treated with suspicion and assumed to be aggressors in conflict situations. As one girl reported, “The teachers . . . thought we were selling weed . . . ’cause we were the only girls at that middle school that dressed like boys. So it was like ‘now we’re bad’” (Snapp et al., 2015, p. 67). The imputation of criminality to sexual minority girls can also be seen in their marked overrepresentation among juvenile detainees, with 39% of all female detainees identifying as lesbian or bisexual in a recent nationally representative sample (Wilson et al., 2017).
Sexual minority girls may be disproportionately affected by the policing of femininity, but they are not uniquely affected. Another literature, focused on Black girls, also identifies deviations from White norms of femininity as a key source of the school and legal sanctions that Black girls face (E. W. Morris & Perry, 2017; M. M. Morris, 2016). In this way, incorporating gender into the study of sexual minority students reorients attention away from individual acts of homophobic treatment and toward broader ideologies that affect all students.
The speculative nature of this explanation highlights the important limitations that this study faced. Most crucially, although the rates of sexual minority reporting in the FFCWS data are similar to those found in other population-based sources, the actual sample sizes are smaller. This is particularly true for men, preventing any strong inferences about this group. Another important limitation is the lack of information about gender identity (i.e., transgender, genderqueer) and markers of gender nonconformity (i.e., “masculine” or “feminine” speech, dress, etc.). Such measures, along with a self-identification measure of sexual orientation, would help confirm and refine the pattern of results identified previously.
The evidence presented here provides new reason for policymakers to monitor the experiences and outcomes of sexual minority students. LGBTQ students have been invisible in education research for long enough. With today’s LGBTQ youth coming out at younger ages, they should be allowed to “come out” to researchers as well. And so, promoting the inclusion of sexual orientation and gender identity measures into research programs should be a priority for the education research community. For now, education researchers must make the most of existing sources while recognizing their limitations. In this regard, the FFCWS data—scheduled for public release in early 2018 5 —represent a rich new resource for the education research community.
Footnotes
Notes
Author
JOEL MITTLEMAN is a doctoral candidate in sociology and social policy at Princeton University, 104 Wallace Hall, Princeton, NJ 08544;
References
Supplementary Material
Please find the following supplemental material available below.
For Open Access articles published under a Creative Commons License, all supplemental material carries the same license as the article it is associated with.
For non-Open Access articles published, all supplemental material carries a non-exclusive license, and permission requests for re-use of supplemental material or any part of supplemental material shall be sent directly to the copyright owner as specified in the copyright notice associated with the article.
