
Abstract
Raters must score accurately and consistently for classroom observation scores to be valid. This requires (a) a standard defining when scoring is accurate and consistent enough and (b) measuring and remediating rater performance against that standard. Current practice has focused on this second problem to the exclusion of the first. My goal here is to start a discussion about identifying a clear, explicit standard that ensures observation scores reflect a consistent view of teaching quality, rather than raters’ idiosyncratic perspectives. In doing so, I connect current certification test cut-scores, the current practice most analogous to a standard, to explicit rater standards, highlighting both the inadequacy of cut-scores and the low standards implicit to current practice.
Keywords
Classroom observation instruments have taken on a greater role in research and practice in recent years due to their potential to provide a valid, reliable, and evidence-based measure of teaching quality that can help rationalize the supervision and evaluation of teachers. This potential, however, is dependent on observers (raters) who are carefully trained and supervised to provide accurate and consistent scores. This paper focuses on the validity challenges stemming from rater error, which often remains high despite extensive efforts to train, certify, and monitor raters (e.g., Bell et al., 2012, 2014; Cohen & Goldhaber, 2016; Gitomer et al., 2014). High rater error is a potential validity threat because validity requires the inference: “The scoring rule is applied accurately and consistently” (see scoring inference 1.2, Bell et al., 2012). When this inference is not supported for a given use of observation scores, those scores reflect only idiosyncratic views of teaching quality, failing to justify the high cost and time burden new systems of formal observation require.
This paper is based on the premise that implicit to the inference that the scoring rule is applied accurately and consistently is the concept of a rater performance standard (henceforth, “standard”). This standard sets forth raters’ performance level where scores are considered to be accurately and consistently applied. Note that any conclusion about a standard or whether scoring is accurate and consistent enough depends on the use of scores. For example, more accuracy and consistency is arguably required when scores are used for high-stakes teacher evaluation than for low-stakes teacher feedback. For narrative clarity, I generally assume that scores are being used for high-stakes teacher accountability systems, which may be their most common and controversial use. However, I occasionally explicitly discuss other uses of observation scores to highlight specific points.
Theoretical Framework
Current Practice
Figure 1 provides an overall logic model for the arguments set forth in this paper. It is based largely on Kane (1994, 2006) and Bell et al. (2012). The scoring inference is broken into two pieces, the policy assumption, or the politically charged claim that specific level of rater skill is adequate, and the descriptive assumption, or the measurement problem of ensuring raters meet this skill level. The boxes with thin borders characterize typical practice, which centers on the rater certification process. The thicker boxes represent the more explicit argument that this paper sets forth as necessary to support the scoring inference. Note that this model deals with raters’ initial capacity to score accurately (the focus of this paper) and further systems must be in place to provide continuous monitoring.

Logic model for scoring validity inference surrounding rater error for classroom observation instruments.
I focus first on current practices as characterized by boxes with thin borders. Figure 1 shows that raters possessing some skill in applying the observation instrument enter the certification process and receive a score on their certification test, which depends also on test characteristics and any test-taking strategies they employ. The rater passes certification if this score exceeds the certification test cut-score (henceforth, cut-score). Note that, without the thicker boxes that I propose here, there is nothing to ground the specific cut-score. It exists almost in isolation, created through unknown decisions.
While the Standards for Psychological and Educational Testing (American Educational Research Association [AERA], American Psychological Association [APA], & National Council on Measurement in Education [NCME], 2014) do not explicitly deal with certification of raters for high-stakes scoring, their recommendations regarding the setting of cut-points more broadly suggest that an explicit, evidence-based, and transparent process must be used to set cut-scores (Standards 5.21–5.23), which does not occur in current practice. Despite this gap, cut-scores are routinely taken as indications of high-quality scoring. For example, Bell et al. (2012) center their argument for scoring accuracy on initial rater certification and raters’ continuing performance at an equivalent level throughout scoring, taking for granted that certification equates to accurate and consistent scoring. Similarly, Hill et al. (2012) use meeting the cut-score to define a group of raters as highly trained, while Cash, Hamre, Pianta, and Myers (2012) argue that rater training can work at scale because most raters passed the certification test. In all of these cases, passing the certification test is equated to raters being able to accurately and consistently score observation instruments; the reified cut-score replaces the important discussion of what skill level is necessary for raters. An explicit rater standard both forces and anchors a thoughtful discussion about how skillful raters should be.
Proposed Expansion to Current Practice
Figure 1 proposes a more expansive view of the scoring inference. The policy assumption focuses on the rater standard and the interpretive argument linking the standard to the conclusion that raters meeting this standard will produce scores that are accurate and consistent enough for some intended use. This is a set of political arguments that requires consensus from stakeholders affected by observation scores and appropriately occurs before the implementation of an observation system. It is logically separate from the actual performance of raters.
As Figure 1 shows, this policy assumption connects to the descriptive assumption through a standard setting study to determine the appropriate cut-score, which is the recommended best practice (AERA, APA, & NCME, 2014). The benefit of this practice is that the cut-score used to certify raters is now explicitly and transparently linked to a standard, which in turn, through the policy assumption, reflects a performance level sufficient to interpret scores for the given purpose. That is, there is now reason to believe the cut-score supports the goal of excluding raters who score inconsistently and inaccurately (given certification tests are reliable and tests relevant rater skills—both relevant to the interpretive argument of the descriptive assumption). Further, this appropriately separates the question of expectations for raters (policy assumption) from the measurement problem of determining whether raters meet expectations (descriptive assumption), allowing each to appropriately take the focus of validity arguments.
A rater performance standard, then, is the most appropriate way of organizing and evaluating the inference that raters are able to score accurately and consistently (Scoring Inference 1.2). In the rest of this paper, I provide two examples of clearly stated rater performance standards and an example of how to link each standard to cut-scores. This both highlights ways to help experts in a standard setting study evaluate the implications of specific cut-scores and helps to retrospectively evaluate the standard to which raters were held in recent research. I hope this starts a conversation about appropriate standards for raters to serve as the starting point for stronger validity arguments for observation instruments.
Current Practice for Rater Certification
In this section, I review certification processes, highlighting the ways that using “meeting certification” is inadequate to conclude raters are scoring accurately and consistently. I focus here on three frequently studied classroom observation instruments: Classroom Assessment Scoring System (CLASS; Pianta, Hamre, & Mintz, 2010), Protocol for Language Arts Teaching Observation (PLATO; Grossman, Loeb, Cohen, & Wyckoff, 2013), and Framework for Teaching (FFT; Danielson, 2007). 1
Certification testing requires raters to demonstrate proficiency by accurately scoring videos with known true-scores and occurs directly after training as a gateway to live scoring. The true-scores represent the true value of teaching quality as determined by instrument developers. Table 1 shows the certification test format and cut-scores used in the Measures of Effective Teaching (MET) and Understanding Teaching Quality (UTQ) study (Kane et al., 2012). Table 1 shows that each instrument requires raters to score multiple videos, but the cut-scores vary across instruments. For example, the FFT cut-score is more lenient than the PLATO cut-score, making FFT easier to become certified on and suggesting FFT raters are held to a lower standard. Comparisons to CLASS are difficult due to the different scoring scale. All three instruments score only overall rater error rather than dimension-specific error (CLASS and PLATO sometimes imposes dimension-specific requirements; e.g. Reyes, Brackett, Rivers, White, & Salovey, 2012). Thus, a rater with weak understanding of some items can become certified (see Bell et al., 2014).
MET Study Certification Test Structure on Three Common Instruments
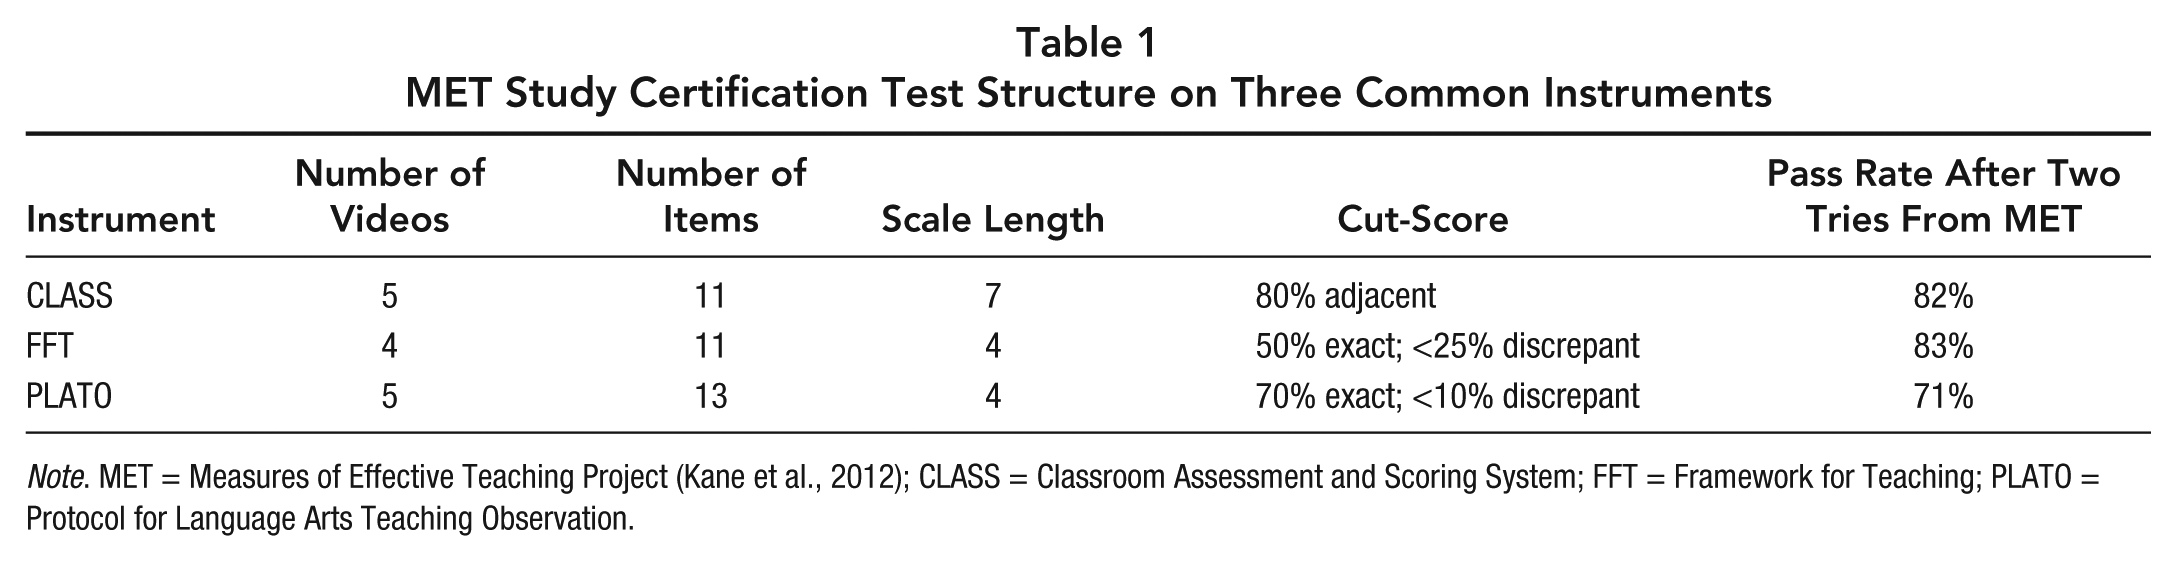
Note. MET = Measures of Effective Teaching Project (Kane et al., 2012); CLASS = Classroom Assessment and Scoring System; FFT = Framework for Teaching; PLATO = Protocol for Language Arts Teaching Observation.
One problem with certification test scores is their unknown reliability. When a test score has low reliability, it reflects chance just as much as it does their ability. Thus, a certification test score with low reliability may be passed by luck, especially if raters can test multiple times. The reliability of certification test scores is unknown, though concerns over possible low reliabilities exist (e.g., Joe, Tocci, Holtzman, & Williams, 2013; McClellan, Atkinson, & Danielson, 2012). Some systems evaluate raters’ ability to reason about scores and/or provide feedback to teachers in order to increase reliability (Bell et al., 2014), though it is not clear how common this practice is. This should be a vital part of certification when raters provide feedback to teachers.
A second problem is that test difficulty may vary based on the videos included in the test. Certification test videos should broadly represent the types of classrooms and lessons that raters will score (Joe et al., 2013; McClellan, Atkinson, & Danielson, 2012). This ensures that certification test scores reflect raters’ likely performance during scoring. There are, though, tradeoffs in choosing videos to include, especially given the restricted range of teaching quality often observed (e.g., Kane et al., 2012). Testing only typical lessons leads certification tests to capture a rater’s skill on a limited range of the full spectrum of teaching quality, though on the range raters will likely encounter. As I discuss below, this makes it significantly easier to meet the cut-score with some test-taking strategies. Alternatively, testing the full range of teaching quality provides a broader test of rater skill but spends valuable test time on videos unlikely to be encountered during scoring. A second tradeoff revolves around how clear cut true-scores are for the video. Some lessons, due either to scores falling near the boundary of performance levels or to conflicting evidence within the video, are more difficult to score than other videos. Certification tests often avoid these borderline or nuanced videos (Joe et al., 2013), which possibly leads tests to overestimate rater ability on typical videos.
Whether a rater passes a certification test, then, depends on his or her ability but also factors independent of skill such as luck, test reliability, and the specific videos included on the test. Of course, establishing a clear and explicit standard does not remove these testing challenges, but it does logically separate the political question of what standard will allow an appropriate interpretation of test scores for some purpose and the measurement problem of determining whether raters meet this standard, rather than conflating the two problems.
Crafting a Rater Performance Standard
I present two ways of stating rater performance standards: one focused directly on rater ability and one focused on the reliability of the resultant scores. First, a standard can be stated in terms of how often a rater, through his or her skill in applying an observation instrument, correctly scores a dimension on a given lesson (rater-ability standard). For example, raters should accurately score a dimension on a lesson 75% of the time. Note that while this language sounds like a cut-score, this standard does not necessarily correspond to a cut-score of 75% of scores being accurate because raters failing this standard may still meet this cut-score as the simulations below show.
Second, a standard can be stated in terms of the reliability with which raters can distinguish between lessons of varying qualities (reliability standard). For example, raters should score such that less than 20% of the variance in scores is due to rater error, implying a rater intraclass correlation (ICC) of 0.8 or higher. The rater-ability standard highlights raters’ accuracy, while the reliability standard focuses on the size of the rater error in resulting scores. While both may serve as adequate standards, the interpretive arguments that link each standard to an appropriate score use and different constituencies’ willingness to accept those arguments may vary greatly.
Below, I will link the standards to current cut-scores for three reasons. First, I highlight the difference between a cut-score and a standard, which emphasizes the necessity of having an explicit standard to support validity arguments. Second, I show that certification tests from recent studies rely on cut-scores that are arguably too lenient to justify many uses of observation scores. Third, I demonstrate a way of linking a standard to cut-scores that can be helpful when conducting standard-setting studies. In the analyses below, I use data from UTQ, a large study of 461 teachers across three districts, which has been documented extensively elsewhere (Casabianca, Lockwood, & McCaffrey, 2015; Lockwood, Savitsky, & McCaffrey, 2014; McCaffrey, Yuan, Savitsky, Lockwood, & Edelen, 2014).
Rater-Ability Standard
A rater-ability standard can be mapped to a cut-score through simulations that model a rater’s likelihood of meeting the cut-score when the rater performs at a given standard (e.g., skillfully scores 70% of items correctly). Importantly, a rater who skillfully scores 70% of items correctly will not necessarily get 70% of items correct on a certification test, due in part to test reliability, but also because certification tests are multiple choice (since dimensions of observation rubrics are scored on a scale). Further, research shows that most scores fall within the middle portions of a scale in research studies (e.g., Kane et al., 2012) and at the top of the scale in practice settings (Rowan et al., 2013). This creates the opportunity for raters to engage in test-taking strategies that significantly increase their likelihood of receiving a correct answer on certification tests.
The simulations assume that raters either can skillfully score a dimension on a video or use an indicated test-taking strategy. 2 It simulates, for a range of ability standards, the probability that a rater will pass the certification test given a test-taking strategy, cut-score, and certification test format. The simulation also relies on the distribution of true-scores for the certification test (i.e., the videos selected for the test), as this determines the effectiveness of some test-taking strategies. Note the complexity here: There is no clear link between the cut-score and the standard. The simulation leads to conclusions such as the following: A rater who skillfully scores half of the time and selects randomly the other half of the time has a 96% chance of passing the certification test on FFT when using the cut-scores from the MET/UTQ study. While complex, the links are explicit so interpretive arguments for the descriptive assumption can transparently argue the appropriateness of a chosen test-taking strategy and likelihood of meeting certification that are used to connect the standard to the cut-score.
The simulations assume the certification test format and cut-score used in the MET/UTQ project, which were designed to serve as an exemplar for the development of teacher evaluation systems (Kane et al., 2012). However, the simulation is easily rerun using a range of cut-scores or certification test formats being considered to tailor results to a specific context. Appendix A describes the simulation in greater detail, and code for the simulation is available upon request.
I simulate four test-taking strategies. First, the uniform strategy (Unif) occurs when raters pick randomly from the possible scores, reflecting a desire to provide some answer, but no coherent strategy in selecting an answer. The central tendency strategy (Central) has raters select from the center of the scale, never selecting the lowest or highest possible scale score. This both strategically increases adjacent agreement and selects only from the most commonly correct scale values. Third, the mode strategy (Mode) assumes raters always select the dimension-specific, modally observed score from UTQ/MET. This corresponds to selecting the most likely answer when unsure. For example, the negative climate dimension in CLASS is scored a 1 for over half of UTQ/MET videos, so the mode strategy always selects 1 for negative climate. This strategy requires basic knowledge of typical distributions of scores but assumes no knowledge of the given video. 3 Last, the elimination strategy (Elim) reflects raters who are knowledgeable about teaching quality but not about specific observation instruments. Raters using the elimination strategy are able to eliminate as incorrect answer choices far from the correct score but cannot use the instrument with skill. Specifically, raters guess uniformly from the scores within 1 of the true-score for FFT and PLATO and within 2 of the true-score for CLASS (due to CLASS’s wider score scale). For example, consider Managing Classroom Behavior from FFT. When the true-score is proficient (3), the rater is able to determine that unsatisfactory (1) is not correct but otherwise is unsure of the correct answer. When the true-score is distinguished (4), the rater can eliminate unsatisfactory (1) and basic (2) but is otherwise unsure. This is a commonly taught strategy for multiple choice tests but reflects a poor ability to use an observation instrument because research suggests the majority of scores fall within a 2-point range on a given dimension (e.g., Kane et al., 2012), while the rater using the Elim strategy is usually left guessing between three answer choices. Thus, the rater’s uncertainty in scoring is still wider than the differences in teaching quality typically encountered in the field. This test-taking strategy seems the most realistic, given that most raters, being experienced educators, have knowledge of good instruction (i.e., can eliminate “bad” as a response choice when seeing “good” instruction) but use idiosyncratic, internal models of good instruction. In considering these strategies, remember that raters are highly motivated to become certified and will use the best strategy at their disposal, which is the mode or elimination strategy.
Tables 2 and 3 show the results of the simulations when the distribution of true-scores matches the observed distribution or is uniform, respectively. Table 2 assumes, in effect, that certification test videos were selected randomly from all UTQ videos so that true-scores reflect those raters encountered when scoring, while Table 3 assumes that videos are selected to represent the full theoretical range of teaching quality. Each table shows the results for each of the three instruments (in sets of columns) and each test-taking strategy (columns within sets). The rows show the standard at which the rater is performing. Assume we have agreed upon the standard that raters should skillfully score 70% of items (i.e., the row standard = 70%). This standard arguably reflects skilled raters, but is still a feasible expectation for raters. Raters at this standard will almost certainly become certified on FFT, regardless of true-score distribution or test-taking strategy. On CLASS and PLATO, as shown in Table 3, raters adopting the elimination strategy will almost certainly pass certification (p > 97%), while those adopting less efficient test-taking strategies will pass, at worst, an estimated 56.4% of the time on CLASS and 31.1% of the time on PLATO. Note that a 31.1% pass rate corresponds to about half of raters passing when two attempts are given. 4 Assuming an effective test-taking strategy, this, arguably, represents an appropriately high rate of certification commensurate with a high standard for raters, suggesting the cut-score is appropriate. Examining the tables further, even at lower standards (e.g., Standard = 20%), raters are likely to meet certification, especially for FFT. For example, Table 2 shows that 94.2% of raters on CLASS, 100% on FFT, and 85.8% on PLATO were able to meet certification when using the mode strategy when skillfully scoring only 20% of items. This reflects too high a pass rate for a low-performance standard, suggesting overly lenient current cut-scores. Overall, the tables show that, given effective test-taking strategies, raters performing at low standards are likely to meet certification, providing a sense that the cut-scores are too lenient.
Percentage of Raters Passing Certification Using MET/UTQ Study Cut-Scores Assuming True-Scores Follow Observed Distribution of Scores

Note. MET = Measures of Effective Teaching; UTQ = Understanding Teaching Quality; Standard = Rater-Ability Standard, the percentage of items raters skillfully score; CLASS = Classroom Assessment and Scoring System; FFT = the Framework for Teaching; PLATO = Protocol for Language Arts Teaching Observation; Unif = the uniform strategy; Cent = the central tendency strategy; Mode = the mode strategy; Elim = the elimination strategy.
Percentage of Raters Passing Certification Using MET/UTQ Study Cut-Scores Assuming Uniform Distribution of True-Scores

Note. MET = Measures of Effective Teaching; UTQ = Understanding Teaching Quality; Standard = Rater-Ability Standard, the percentage of items raters skillfully score; CLASS = Classroom Assessment and Scoring System; FFT = Framework for Teaching; PLATO = Protocol for Language Arts Teaching Observation; Unif = the uniform strategy; Cent = the central tendency strategy; Mode = the mode strategy; Elim = the elimination strategy.
A few other points are worth noticing. The difference between the two tables was quite large, especially for the mode strategy and for PLATO. This demonstrates the tradeoff discussed previously between testing the types of videos raters are likely to encounter (i.e., Table 2), which makes the mode test-taking strategy highly effective, and testing the full theoretical range of teaching quality (i.e., Table 3). Note also the relative robustness of the Elim strategy to the underlying score distribution.
What standard is implied by the current cut-score? Assuming a rater performing at the standard should meet certification 80% of the time (this was approximately the observed rate in MET), the MET/UTQ certification test structure, and the elimination strategy, Table 2 provides a clue to the implied current standard. The cell of Table 2 that comes closest to 80% in the Elim column matches the implied standard, given the assumptions. 5 This gives an implied standard of 50% to 60% on CLASS and PLATO and 30% to 40% on FFT. Thus, raters able to skillfully score about half the items they encounter (while always having a vague sense of whether lessons are of low or high quality) are performing at the current implied standard. This is arguably quite a lax standard, especially when observation scores inform high-stakes teacher evaluations. The reader may disagree with the assumptions or this conclusion, which is an important outcome of this paper. By highlighting the complexity here and arguing for an explicit standard, we can have a clear conversation about how skillfully raters must be able to score for observation scores to be used for a given purpose.
Reliability Standard
While a rater-ability standard represents a natural way to state a standard, a more meaningful approach may be to base the standard on raters’ ability to accurately distinguish between lessons of different quality, which is necessary to provide accurate feedback to teachers. Further, the reliability standard directly connects to the precision with which teacher quality is measured, which determines uncertainty in score estimates. A standard could state that raters must score with a reliability (e.g., ICC) of 0.8 or higher, thereby connecting acceptable levels of rater error to the teaching quality signal being detected. When combined with an estimate of the distribution of true teaching quality, such a standard implies a cut-score because all cut-scores implicitly define a distribution of rater error corresponding to a rater who barely meets the standard. In making this connection, I assume that constant rater error (i.e., leniency) will be controlled for (e.g., through statistical adjustments) and focus on the remaining error, which I simply call rater inaccuracy. This assumption makes the calculations somewhat conservative because it addresses only some rater error.
The first step of this approach is converting a cut-score to an error distribution, which gives the error of the rater just barely passing the cut-score (i.e., performing at the standard). I demonstrate this for CLASS, which has the cut-score: 80% of scores are within 1 point of the true-score. Raters can thus score 1 point above/below the true-score 80% of the time and 2 points above/below 20% of the time.
6
This gives an error distribution of 1 point below the true-score 40% of the time, 1 point above 40% of the time, 2 points below 10% of the time, and 2 points above 10% of the time. The rater error distribution then has mean = 0 and variance =
Table 4 shows both the variance of true lesson quality, the variance of rater error corresponding to current cut-scores, and the ICC reliability standard corresponding to current cut-scores. The top set of rows shows the range of results across individual items on a protocol, and the bottom set of rows shows the result for the lesson average, which is often of more interest than item scores. ICCs of 0.8 to 0.9 are recommended as a rule-of-thumb for high-stakes purposes, but 0.7 may be acceptable for research studies (Graham, Milanowski, & Miller, 2012). However, the reported ICC reflects both internal and external rater error, as they compare rater scores to the true-score, whereas standard practice compares rater scores to the scores of other raters (which would focus on internal error only). Thus, the appropriateness of typical rules of thumb is questionable (see Myford & Wolfe, 2009, for a discussion of internal versus external rater error). While ICCs should be examined at the lowest level (i.e., item score on specific occasion; Graham et al., 2012), I show the more common lesson estimates, which invariably are higher than occasion ICCs (except for FFT where they are equivalent).
Rater Inaccuracy Allowed by MET/UTQ Study Certification Test Cut-Scores With Implied Rater Performance Reliability Standard
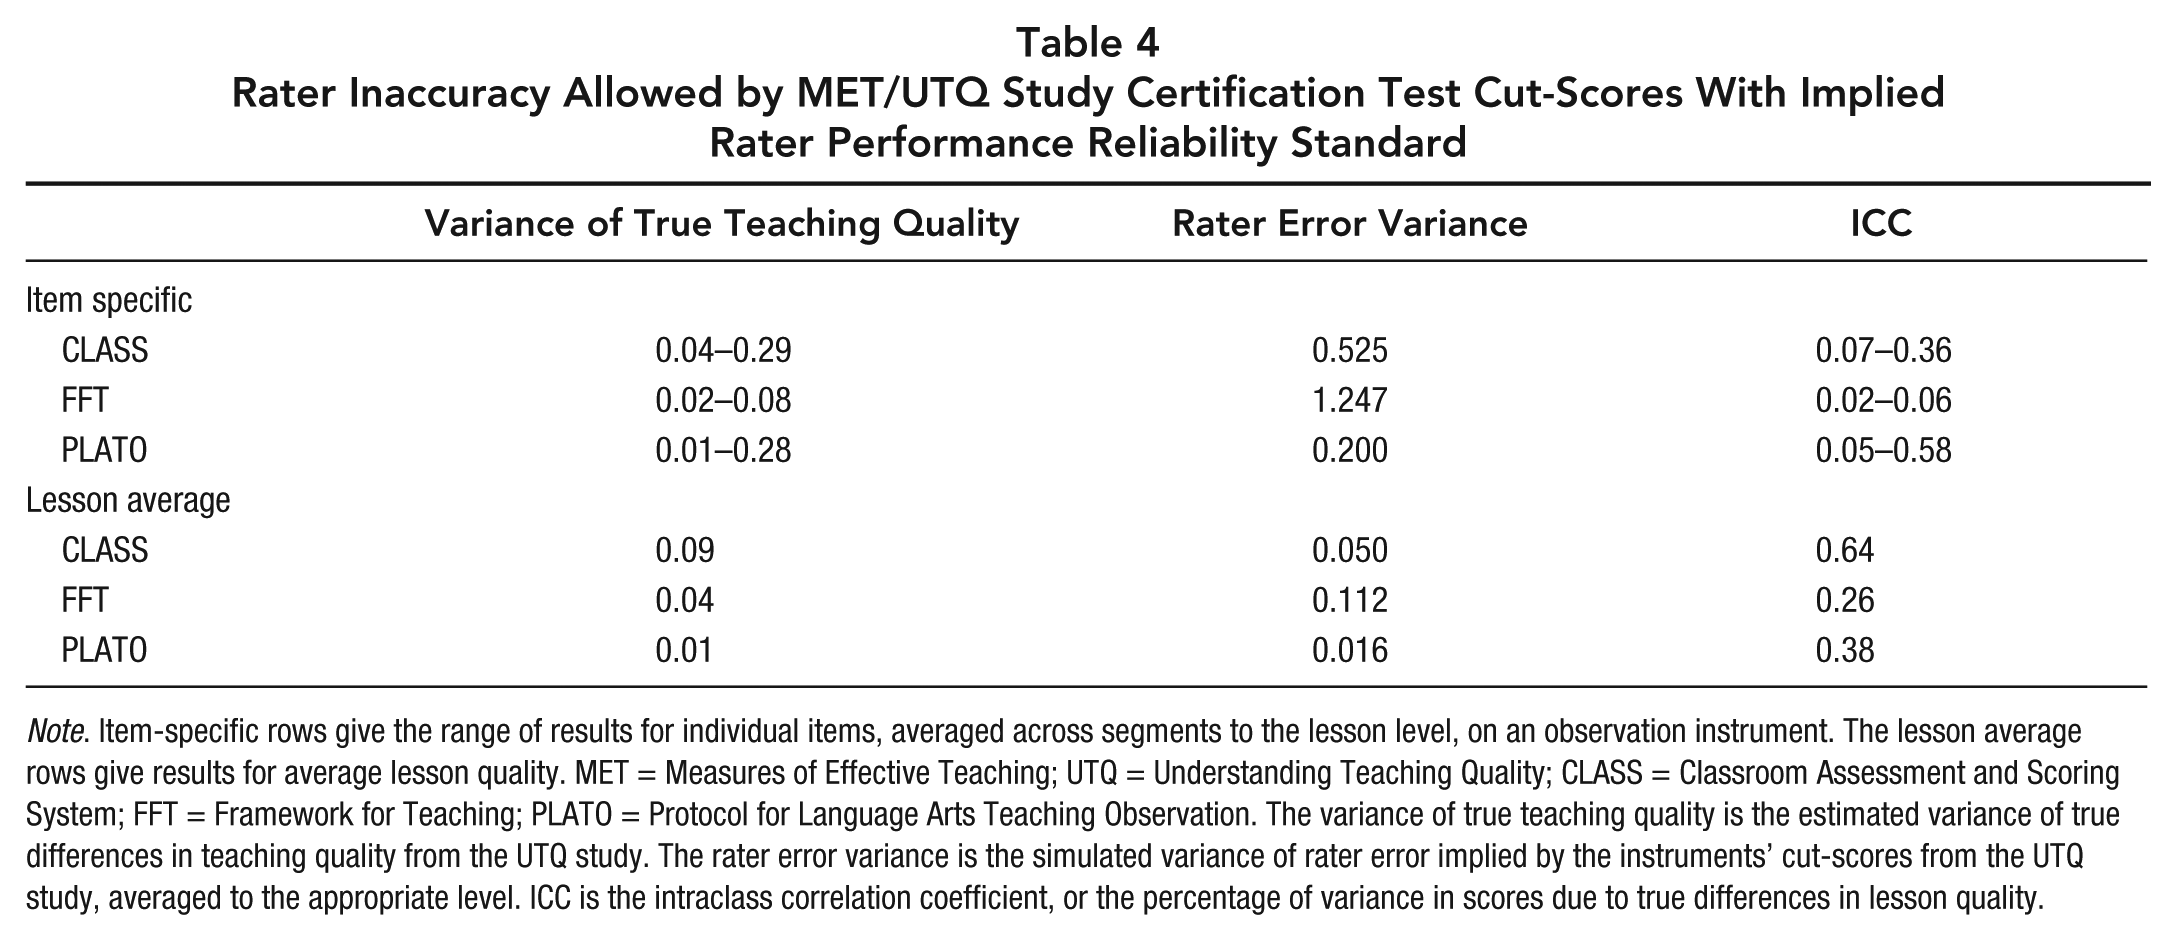
Note. Item-specific rows give the range of results for individual items, averaged across segments to the lesson level, on an observation instrument. The lesson average rows give results for average lesson quality. MET = Measures of Effective Teaching; UTQ = Understanding Teaching Quality; CLASS = Classroom Assessment and Scoring System; FFT = Framework for Teaching; PLATO = Protocol for Language Arts Teaching Observation. The variance of true teaching quality is the estimated variance of true differences in teaching quality from the UTQ study. The rater error variance is the simulated variance of rater error implied by the instruments’ cut-scores from the UTQ study, averaged to the appropriate level. ICC is the intraclass correlation coefficient, or the percentage of variance in scores due to true differences in lesson quality.
Table 4 shows that, across items, the reliability standard (i.e., ICC) corresponding to the current cut-scores is 0.07–0.36 for CLASS, 0.02–0.06 for FFT, and 0.05–0.58 for PLATO. Thus, in terms of raters’ ability to reliably score individual items, the current cut-scores correspond to a reliability standard that is far below typical rules-of-thumb. The implied lesson-average ICCs are higher because rater error is averaged across 11–13 items. However, Table 4 shows lesson average ICCs still fall below the 0.7 rule-of-thumb (Graham et al., 2012). Thus, holding raters to the performance standard implied by current cut-scores will result in raters with unacceptably low reliability in terms of rater ICCs meeting certification. Note the inconsistency across instruments. The implied reliability standard is twice as high for CLASS (0.64) as for FFT (0.26), showing that CLASS currently has much higher requirements for rater reliability than FFT.
The results in this section are determined by two numbers, the distribution of observed teaching quality, which is a factor of actual teaching quality and the observation instrument, and the rater error distribution, which is a direct consequence of the cut-score and certification test format. In most studies, observed teaching quality falls within a very narrow band. For example, in UTQ (authors calculations), the middle 80% of lesson scores for an item had an average range of 2 in CLASS and ~1 in FFT and PLATO. This narrow range of observed scores deflates ICCs, making what might otherwise seem an appropriate cut-score correspond to a much lower reliability standard than expected; a fact not revealed by the ability standard. If observed scores were spread across the full 4-point range on FFT and PLATO and 7-point range on CLASS, the corresponding ICCs for a given cut-score would be much higher.
Discussion
Classroom observation instruments have sought to replace idiosyncratic judgments of teaching quality with a research-based, accurate, and valid measure of teaching quality, which requires highly skilled raters. I have argued in this paper that the current approach to certifying raters uses an implicit, unknown standard for rater performance. This both violates best practices of the testing standards (AERA, APA, & NCME, 2014) and makes it difficult to know if raters are being held to a sufficiently high standard to conclude that the resulting scores are accurate and consistent enough for some purpose. I provided two possible ways to consider rater standards, linking each to the cut-scores from MET/UTQ certification tests, which served as a representation of current practices. This led to the conclusion that the MET/UTQ study required raters be able to skillfully score between 40% and 60% of items correctly or score with reliabilities between 0.25 and 0.64, which I argued represented surprisingly low expectations for raters if scores are to be used for high-stakes purposes.
I further proposed using a rater performance standard to organize the scoring validity inference. The standard serves as the basis for the policy assumption that defines how skillful raters must be and is used to set a certification test cut-score through a standard setting study. This approach requires two additional steps, not yet taken in systems using classroom observation instruments: setting an explicit standard and conducting a standard setting study. I discuss these in turn.
Setting an Explicit Rater Performance Standard
Setting a standard is by its very nature a political exercise (Kane, 2006). Teachers, administrators, parents, politicians, and others all have a stake in observation systems used for teacher evaluation efforts, and reaching consensus among these stakeholders may be difficult. For example, the MET study had to reduce the cut-scores for CLASS because not enough raters were able to pass the certification test (Kane et al., 2012). Even after reducing the requirements, only 82% of raters passed the certification test on CLASS (after two tries). This reduction in the rater standard may be seen as unacceptable by teacher advocates, who worry it will lead to teachers being inaccurately measured and unfairly judged. Maintaining the higher standard, however, invariably will lead to higher training costs and may substantially restrict who can score.
Further, the way a standard is defined can be important. There is no “best” way to define a standard, as different stakeholders may prefer the rater ability versus the rater reliability standard and may do so for different score uses. For example, I have, to this point, assumed that the standard should focus on raters’ ability to score. However, when the purpose of the observation system is to provide feedback to teachers, the accuracy with which raters score may be unimportant compared to their ability to provide useful and actionable feedback to teachers. In that case, the standard should focus on the raters’ ability to provide feedback, which, of course, could be combined with a focus on accurate scoring.
While setting a standard is a political endeavor, standards can and should be set using evidence of their appropriateness, which requires collecting evidence to inform the process (McClarty, Way, Porter, Beimers, & Miles, 2013). Since the advantage of a formal observation instrument is its research-based approach to defining teaching quality, one way to gather evidence for setting a standard would be to have both untrained and master (i.e., very highly trained) raters score teachers on each dimension of the observation rubric. Untrained raters’ scores represent idiosyncratic views of teaching quality, and master raters’ scores represent the research-based definition of teaching quality. If there is no difference in validity between the two sets of scores, a standard is not useful and untrained raters could be used to save the time and money associated with training. If there is a difference in validity, the natural tendency for some untrained raters to score more similarly to the master raters can be used to explore various rater standards. For example, there may be a threshold such that scoring more dissimilarly to the master raters has a large effect on some validity coefficient of the scores. This would provide evidence about the level of similarity to the master score that is necessary to maintain score validity, which would inform the appropriateness of various potential standards.
Other forms of evidence may also help set an appropriate standard. We might use master raters as an upper limit of what is possible, given that a standard that exceeds what master raters are capable of is unrealistic. For example, the percentage of items on which master raters agree on a score seems a reasonable upper limit for the rater ability standard and the reliability of master rater scores an upper limit for the reliability standard. These sources of evidence can then be provided as data when setting a standard, thereby anchoring the debate among stakeholders.
Conducting a Standard Setting Study
Beyond setting a standard, the standard needs to be connected to a cut-score on a certification test. This is done through a standard-setting study (Cizek, 2011). An ideal approach here might be a variation of the briefing book method (Haertel, 2002; McClarty et al., 2013) that combines the process of setting a standard with stakeholder buy-in and setting a cut-score on a certification test. This approach allows all stakeholders to participate while providing evidence on the implications for a set of potential standards and associated cut-scores. This evidence, such as that just discussed, then forms the basis for discussion and eventual agreement on a standard and cut-score.
The methods discussed in this paper can serve as a useful data point in the standard-setting study because they explicitly connect the standard and the cut-score. The ability standard simulation will show how likely raters are to meet certification across a range of possible standards, highlighting pass rates not just for the given standard but for raters performing below or above a given standard. This allows for consideration of how likely raters not meeting the standard will be to meet certification (and hence false-positive and false-negative rates). The simulation should be updated with the certification test format and true-scores to be used in practice and run for a variety of cut-scores under consideration. The rater reliability standard approach is also useful for a standard-setting study as it shows the reliability to which raters are being held for a set of cut-scores being considered. Of course, the data shown here are dependent on the use of data from UTQ. Data from the context being considered should be collected to use instead.
Beyond Initial Certification
Up to this point, I have focused on the initial process of determining whether raters are scoring accurately and consistently enough for some score use. Even skillful raters, however, may not continue to score skillfully across time. It is therefore necessary to have a full system of monitoring and retraining raters (Hill et al., 2012; Park, Holtzman, & Chen, 2014). This usually involves periodic calibration testing. For example, the MET project tested rater’s ability to score accurately before each day of scoring (Kane et al., 2012), while most studies only do so weekly (e.g., Casabianca et al., 2015). The cut-score from the certification test seems appropriate for scoring calibration videos, as seems to be current practice (Kane et al., 2012), though the shorter calibration tests (i.e., less reliable) might suggest higher cut-scores to limit false-positives. This continuous monitoring is vital to the descriptive assumption of whether scores are valid for some purpose. In fact, the stronger the system of continuous monitoring of raters, the less important initial rater certification because unskilled raters who get certified will quickly be identified and retrained to meet the performance standard. Thus, while the chosen standard and interpretive argument for the policy assumption should be independent of this broader system, the broader system of monitoring and retraining raters will be an important piece of information when setting the cut-score for certification.
Conclusion
In order to ensure that scores from observation instruments reflect a common vision of teacher quality, both an appropriately high standard for rater performance must exist and raters must be held to this standard. The first problem is a matter of expert judgment and consensus, while the second is a measurement challenge. I have argued for a system of setting a performance standard for raters of observation instruments that attends explicitly to these two problems.
While I have focused on this problem in classroom observation instruments, the scoring of classroom observation instruments is structured quite similarly to the scoring of constructed response items on high-stakes tests, especially when scoring is done holistically across a set of dimensions. The same critique of current practice and arguments for change that I have made in this paper applies to this constructed scoring context, since, as is the case of observation instruments, there can be a lack of explicit attention as to the standard to which raters are held and whether this standard is appropriate. Taking up the approaches described in this paper is sure to help focus on this important question.