
Abstract
In this brief, we examine an important but obscure form of state spending on K–12 education—state subsidies of school district pension costs. In 2018, this exceeded $19 billion across 23 states. To put that amount into perspective, 2018 federal spending on Title I programs was $15.8 billion. This revenue stream is often ignored in analyses of state aid for K–12 and its distribution across districts. Until recently, accounting standards did not require pension plans to report these implicit subsidies to the school districts, so they did not typically know the size of their subsidy. In some important cases, it was missing from state totals for education aid. In the first comprehensive tabulation of these data, we show that this subsidy can be as much as $2,400 per pupil, as it is in Connecticut. In Illinois, it comprises an additional 56% of state spending on K–12 on top of all formula and categorical aid.
There is a $19 billion form of state spending on K–12 education that previous analyses have all but overlooked—state funding of teacher pensions. Typically, teachers and their employers—the school districts—each contribute to the pension fund. In a number of states, however, the state provides some or all of the payment that would otherwise be paid by the districts. This seemingly minor distinction in how teacher pensions are funded can have a major impact on how state education dollars are distributed. In this brief, we explore this little known facet of teacher pension finance. First, for each state, we quantitatively answer the important question of who pays the costs of teacher pensions—the state or districts. Second, we explain the significance of new accounting rules (Government Accounting Standards Board, 2012b) that require public reporting, for the first time, of each district’s pension subsidy from the state.
In teacher pension plans, teachers contribute a set percentage of their salary to the pension fund. This is called the “employee contribution,” and it is matched, in theory, by an “employer contribution.” In most states, local school districts cover the “employer contribution” because they are, after all, the employer. We identified 23 states, however, where the state—not the school districts—cover some or all of these costs, as “non-employer contributions.” This can be a significant subsidy to school districts.
Using publicly available data from pension funds’ Comprehensive Annual Financial Reports (CAFRs) and other reports newly required by the Government Accounting Standards Board (GASB), we calculated the total state subsidy for teacher pensions. 1 In 2018, 23 states made “non-employer” contributions to teacher pension funds for a total of $19.2 billion (see Table 1). 2 To put that amount into perspective, 2018 federal spending on Title I programs was $15.8 billion. For each of the 23 states, we present the state pension subsidy in three useful ways: on a per pupil basis, as a percentage of state and district pension contributions, and as a percentage of all state K–12 funds.
State Contributions to Teacher Pensions a
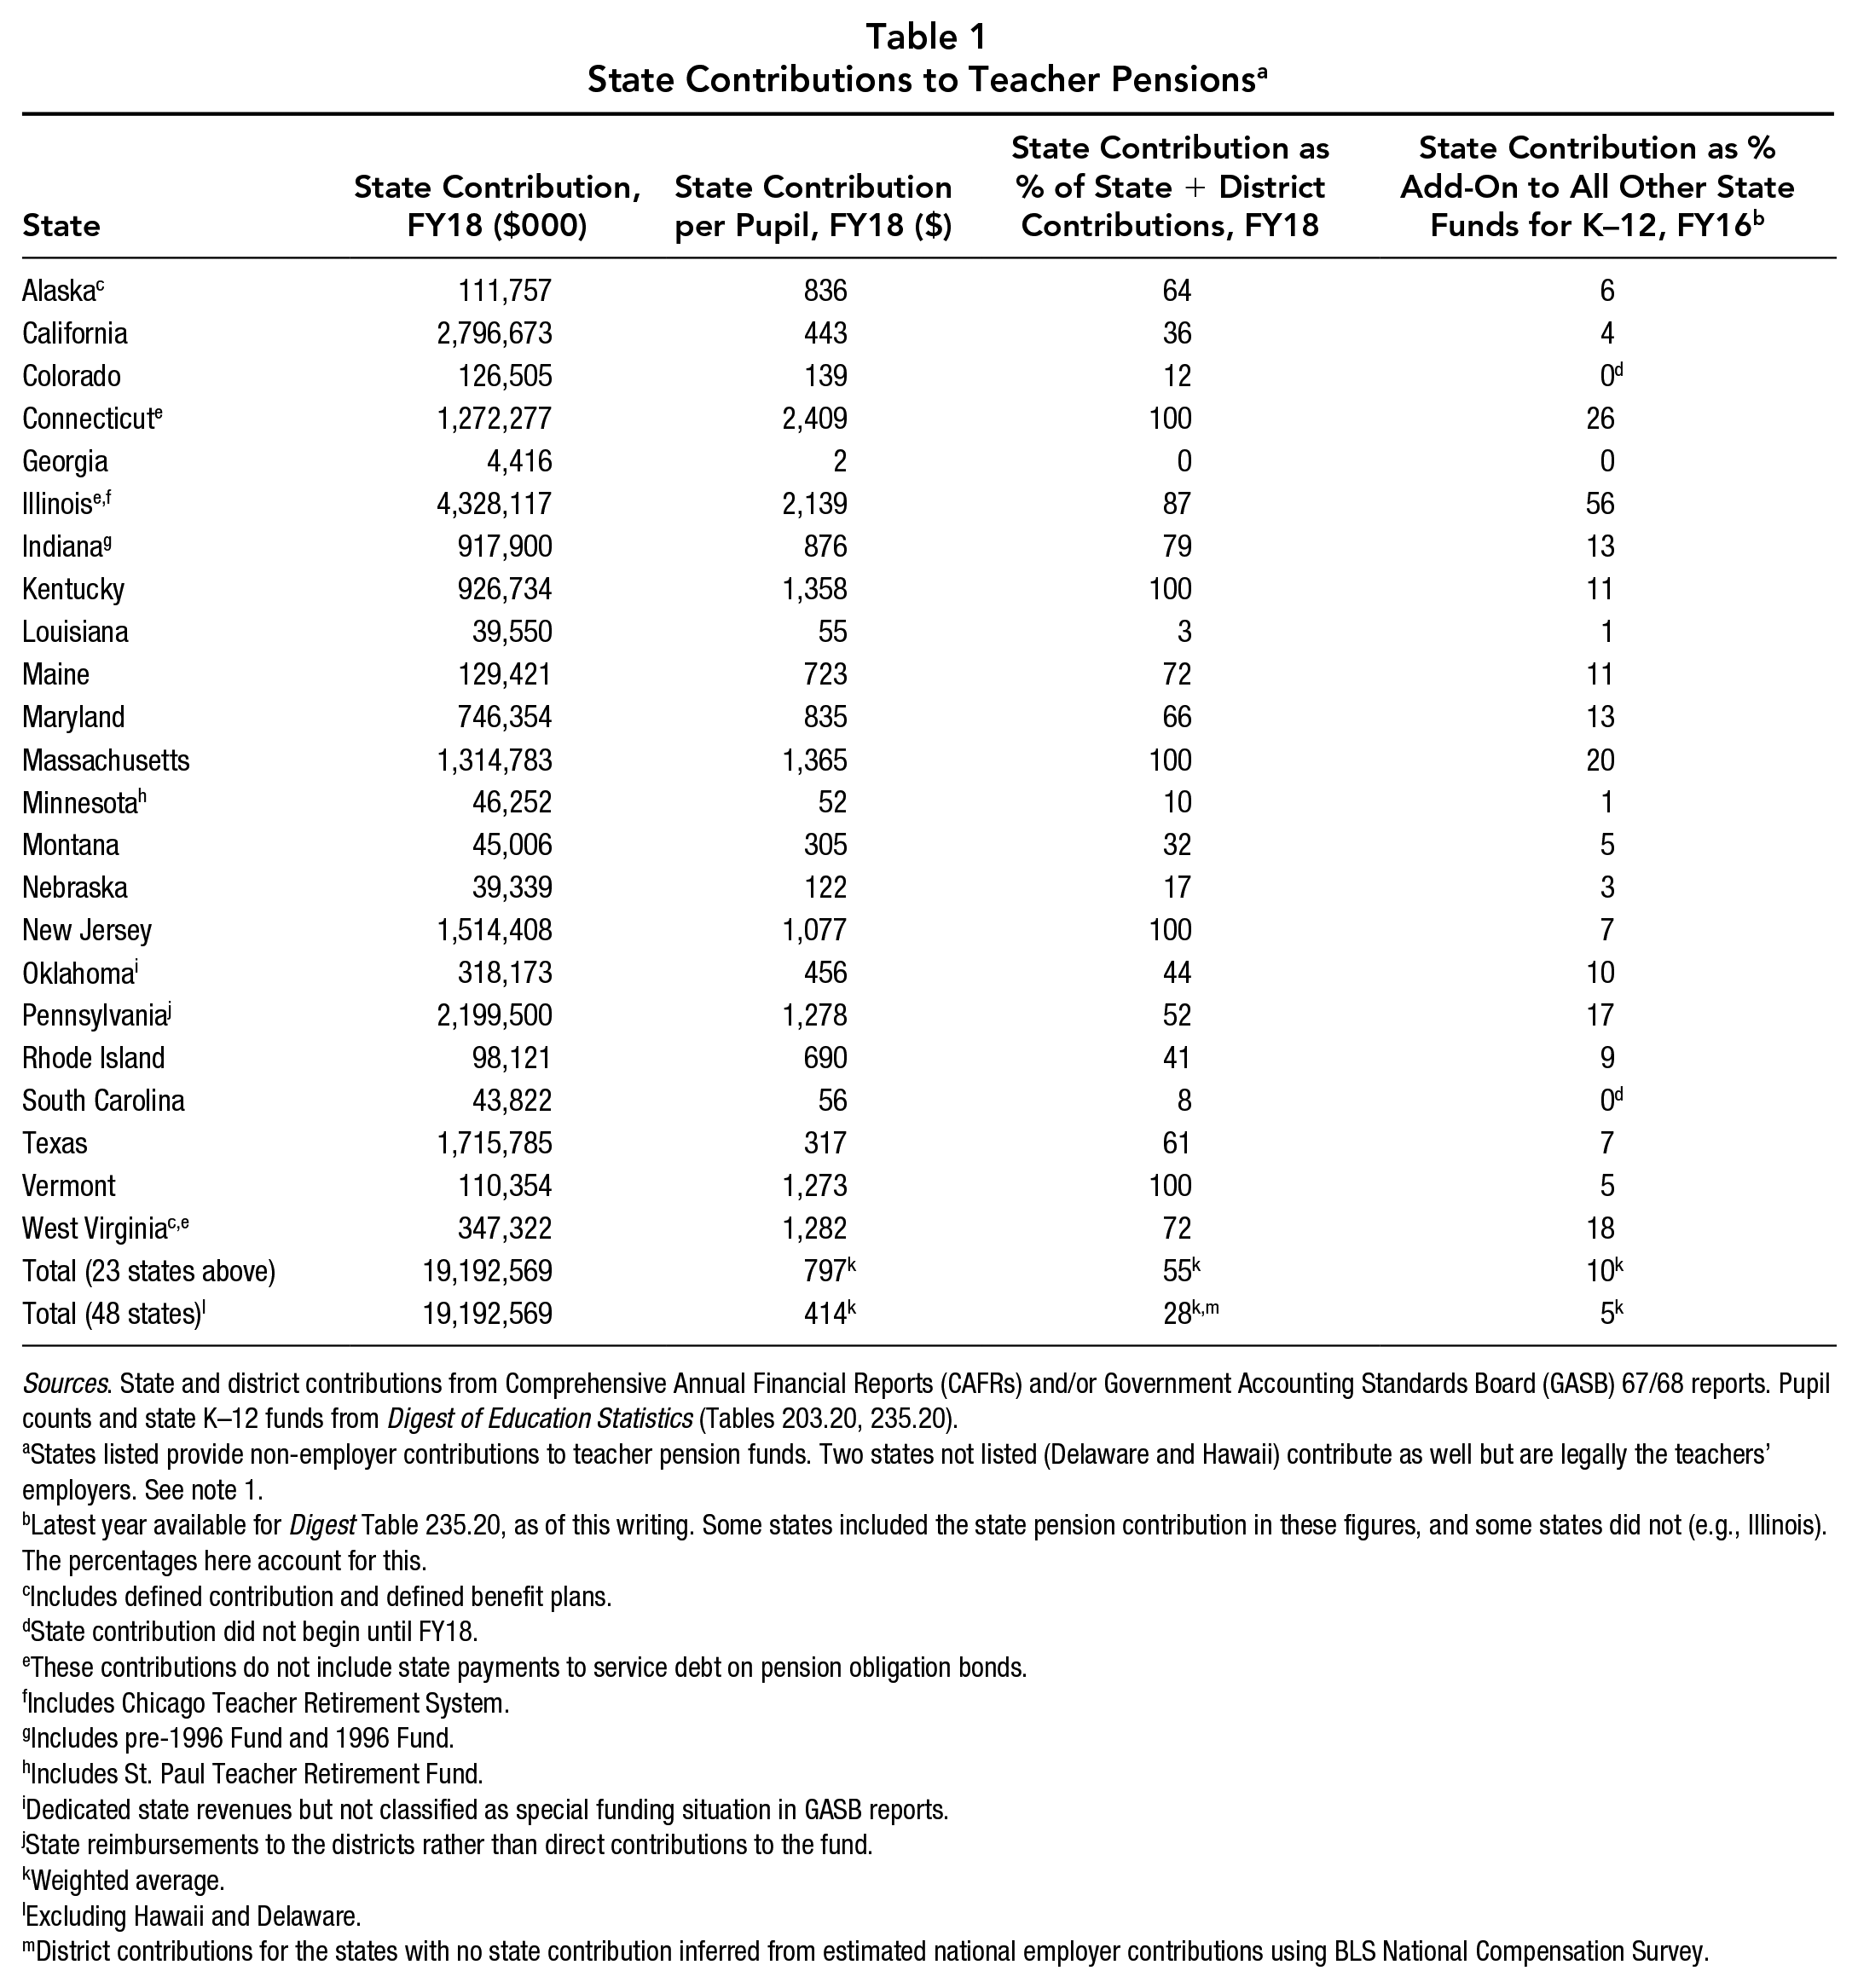
Sources. State and district contributions from Comprehensive Annual Financial Reports (CAFRs) and/or Government Accounting Standards Board (GASB) 67/68 reports. Pupil counts and state K–12 funds from Digest of Education Statistics (Tables 203.20, 235.20).
States listed provide non-employer contributions to teacher pension funds. Two states not listed (Delaware and Hawaii) contribute as well but are legally the teachers’ employers. See note 1.
Latest year available for Digest Table 235.20, as of this writing. Some states included the state pension contribution in these figures, and some states did not (e.g., Illinois). The percentages here account for this.
Includes defined contribution and defined benefit plans.
State contribution did not begin until FY18.
These contributions do not include state payments to service debt on pension obligation bonds.
Includes Chicago Teacher Retirement System.
Includes pre-1996 Fund and 1996 Fund.
Includes St. Paul Teacher Retirement Fund.
Dedicated state revenues but not classified as special funding situation in GASB reports.
State reimbursements to the districts rather than direct contributions to the fund.
Weighted average.
Excluding Hawaii and Delaware.
District contributions for the states with no state contribution inferred from estimated national employer contributions using BLS National Compensation Survey.
The size of state pension subsidies varies greatly by state. Half the states provide no subsidy, and other states cover only a partial share of the employer cost, leaving the rest to the districts. In a few cases, such as Georgia, the value of the subsidy is trivial on a per pupil basis. But in other cases, the subsidy is massive. In Illinois and Connecticut, the state spends more than $2,000 per pupil on pension subsidies. 3 Connecticut covers the full employer share, and Illinois does the same for every district outside of Chicago. Six other states spend more than $1,000 per pupil subsidizing local pension costs. The weighted average, over the 23 contributing states, is almost $800; factoring in the noncontributing states, the national average is over $400.
The amount that states spend on pension subsidies is increasing rapidly, up from $13.0 billion in FY2014 to $19.2 billion in FY2018—a 47% rise in the 4 years since required reporting for state totals began. Colorado and South Carolina have only recently begun subsidizing local pension costs. In Illinois, state pension spending has increased by $3 billion over the past decade, consuming virtually all new state K–12 spending. Indeed, by 2016, Illinois state spending on pension subsidies added an astonishing 56% to all other state spending on K–12 education; that is, these subsidies were over half as large as all of Illinois’s formula and categorical aid taken together. The subsidies in these 23 states added an average of 10% to the rest of their state funds for K–12, likely diverting, at least in part, from other areas of K–12 budgets. For the nation as a whole (including the 25 noncontributing states), the subsidies in the contributing states add 5% to total state K–12 spending.
Our tabulation of state pension subsidies is based on careful examination of each plan’s standardized financial reports (CAFRs and/or GASB reports). To date, such tabulation has not been possible from National Center for Education Statistics (NCES) data for two reasons. First, the NCES surveys collect benefit expenditures as a whole, including health, Social Security, unemployment compensation, and so on, so pension contributions cannot be separated out (let alone whether they are funded by state or district). Second, the survey of state education agencies underlying NCES data on state revenues for K–12 education (Digest Table 235.20) has not always captured state pension subsidies. 4 This was most notably the case for Illinois and Indiana in the most recent published data (FY16) as well as several smaller contributing states. We estimate about one third of the nation’s state pension subsidies were not included in that year’s Digest tabulation of state aid. NCES and the Census Bureau have worked with state fiscal coordinators to secure full reporting in these voluntary surveys, so these omissions should be rectified in forthcoming revenue tables.
Although state pension subsidies can be quite large, they have, until recently, been missing from district financial reports, unlike other forms of state aid. These funds are typically appropriated by the state directly to pension funds, and districts were rarely provided any documentation of the effective value of this subsidy prior to GASB 68’s requirement that pension plans calculate these nonemployer subsidies.5,6 Therefore, data sets built by aggregating district-level expenditures have completely missed this expense. Hundreds of studies in the past have examined how state aid formulas, categorical grants, and other major appropriations are distributed between school districts. This forms the core of the literature on equity in education spending. We know of no scholarly work that has incorporated the use of the new GASB 68 data, which break out state pension contributions by district. 7
It is important to note that state pension subsidies are almost always distributed in a manner inconsistent with other state aid programs. Generally, state funding formulas for public education are designed to focus on district and student needs, on the one hand, and ability to pay out of local sources, on the other. Indeed, general state aid formulas are often weighted to send more money per pupil to districts with high concentrations of poverty and low property values. Similarly, categorical funds, for purposes such as English language learners and severe disabilities, are targeted based on specific student needs. State pension subsidies are not designed in the same way. Rather, state pension subsidies may be allocated in a manner that actually undermines state efforts to increase equity in school finance (Shuls et al., 2019).
Specifically, school districts typically rely on local property taxes as a primary source of K–12 funding. This often means the property-rich districts are able to pay higher salaries than less affluent areas even after state aid is distributed. Pension contributions are almost invariably calculated as a fixed percentage of payroll, so the implicit state subsidies vary across districts by salary, thereby favoring, on average, higher-paying districts. Consider a hypothetical example: If the employer contribution toward the annual cost of newly earned teacher pension benefits is 10% of salary, then the subsidy to a school district that pays a $70,000 average salary is $2,000 higher per teacher than the subsidy to a district that pays only $50,000. Moreover, as in most states, where the costs have become much higher because the state failed to pre-fund benefits as they were earned, the subsidy becomes even larger—and so do the inequities. Finally, if class sizes are smaller in higher-paying districts, then the per-pupil value of the state pension subsidy is higher yet for the more affluent districts.
A serious unintended consequence might result from state spending on teacher pensions: Some states might be offsetting progressive state aid with state pension subsidies that favor wealthy school districts. Given the rapid increase in state pension spending over the past 4 years, this is creating a rapid and substantial shift in funding patterns. We predict that in some states, state pension spending now runs completely counter to the progressive purpose of general state aid. Yet this phenomenon has received almost no attention in the scholarly literature. New GASB rules have made new data available to researchers. There are few topics—even in the large fields of funding equity and pension finance—that are more deserving of our attention.