
Abstract
In the current article, we examine the long-run school selection patterns of children randomly assigned to the Chicago School Readiness Project, an early childhood educational (ECE) intervention that aimed to improve the quality of Head Start classrooms serving low-income communities. Analyses suggest that adolescents who participated in the program were more likely to opt out of their assigned neighborhood school and attend schools with better indicators of academic performance. Further analyses suggested that these selection patterns began in elementary school, although elementary school quality explained only a small portion of the effect on high school selection. Results suggest that intensive ECE interventions could have lasting effects on children’s patterns of selection into later educational environments.
Keywords
As interest from researchers and policymakers in early childhood education (ECE) interventions has grown, recent reviews of the literature have noted the crucial need for more research reporting the long-run effects of ECE interventions (Phillips et al., 2017; Watts et al., 2019). In the current article, we explored whether assignment to an ECE program, the Chicago School Readiness Project (CSRP), affected environmental selection measured over 10 years after the intervention ended. Our pursuit of this question arose because we discovered that students assigned to the intervention were less likely (~12 percentage points) to attend high school in the Chicago Public School (CPS) district when compared with students in the control group. As we detail here, this finding led us to question whether the early program might have affected children’s selection into higher performing schools.
Across our analyses, we found compelling evidence suggesting that the CSRP program positively affected later school selection given that students in the intervention group enrolled in high schools with better indicators of academic performance. This effect was observed for both students who left CPS and for those who remained. Furthermore, we found that for students who remained in the district, intervention participants were more likely to opt out of their assigned neighborhood school and enter Chicago’s school choice system. These results were robust to a host of sensitivity tests, including models that took into account key neighborhood characteristics that affect admissions decisions in Chicago. In the sections that follow, we consider the theoretical mechanisms that could explain links between the CSRP program and later school selection and discuss how these results might inform other ECE evaluations.
Background
ECE researchers have placed increasing attention on children’s environmental experiences following participation in ECE interventions. Some have argued that environmental factors following early intervention could explain the persistence or fadeout of long-term treatment impacts on child outcomes (Bogard & Takanishi, 2005; Stipek et al., 2017). The “sustaining environments hypothesis” (Bailey et al., 2017) argues that ECE intervention effects may only persist when subsequent environments are of sufficient quality to build on gains made during the early program. Indeed, a number of recent studies have examined this hypothesis to mixed results (Ansari & Pianta, 2018; Bassok et al., 2018; Claessens et al., 2014; Jenkins et al., 2018; Johnson & Jackson, 2019; Zhai et al., 2012).
Alternatively, ECE interventions may also positively affect long-run child outcomes by boosting the likelihood that a child selects into a higher quality environment. The “foot-in-the-door hypothesis” (Bailey et al., 2017) speculates that early interventions might produce long-term impacts by affecting environmental selection during important transition points. From this perspective, an intervention would have a foot-in-the-door effect if it helped a child select into a higher quality school or avoid negative academic behaviors, like dropping out.
Throughout the ECE evaluation literature, foot-in-the-door effects have been observed, although very few studies have focused on environmental selection as an outcome. In the Abecedarian study, follow-up analyses showed that children exposed to the intensive ECE intervention were substantially less likely to be retained or placed in special education (Bailey et al., 2017). More recently, quasi-experimental evidence from the Tulsa public preschool program has found that access to preschool boosted the probability that students would attend a magnet middle school (Kitchens et al., 2020), and an experimental evaluation of Boston’s preschool program found that students randomly assigned to attend public preschool were more likely to enroll in a Boston public school for elementary school (Weiland et al., 2019).
The current study builds on these findings by providing new evidence regarding the long-term effects of a high-quality ECE intervention on later selection into higher performing high schools. As described in the following, CSRP was an ECE intervention that targeted the quality of Head Start centers operating in low-income communities in Chicago. Initial evaluations suggested that the intervention substantially boosted measures of child cognitive (ds = 0.20–0.63; Raver et al., 2011) and behavioral (ds = 0.53–0.89; Raver et al., 2009) functioning, and other evaluation work found that the program had considerable effects on measures of preschool classroom quality (ds = 0.52–0.89; Raver et al., 2008). Follow-up work has been mixed, with an initial follow-up study reporting evidence of fadeout on achievement skills during early elementary school (Zhai et al., 2012) and another study finding reduced growth in some measures of behavioral problems through middle childhood (McCoy et al., 2017). A recent follow-up report found modest positive effects on measures of executive function and academic achievement during adolescence, with mostly null results reported for measures of emotional regulation and behavioral problems (McCoy et al., 2018).
The current study further explores the long-term effects of the CSRP program by examining adolescents’ high school enrollment patterns approximately 12 years postintervention. As such, we hypothesized that the CSRP program could have affected subsequent school enrollment patterns for two primary reasons. First, effects on child cognitive functioning (e.g., Raver et al., 2011; Watts et al., 2018) could have given students in the intervention group an advantage in navigating Chicago’s school choice system (described in more detail in the following). Indeed, previous examinations of foot-in-the-door effects have suggested that changes in child skills could lead to placement in higher quality environments by giving students a leg up in competitive selection processes (Bailey et al., 2017). In our context, intervention-induced gains in academic achievement and self-regulatory abilities could have led to advantages in the school admissions process or equipped students to navigate Chicago’s school choice process.
A second possibility could stem from the substantial changes in preschool quality caused by the intervention. Families exposed to higher quality educational experiences could seek out better educational opportunities in later periods (Chetty et al., 2016). Such preferences could manifest through residential mobility to areas with access to higher quality schools or through seeking enrollment in higher performing schools given school choice flexibility within their district (Denice & Gross, 2016). The CSRP program was an intensive, multifaceted intervention that provided services to children, parents, and teachers. If these early experiences affected preferences for educational quality, then early differences in enrollment decisions may have led to better educational opportunities in later periods (i.e., selection begets further selection).
The current study explored these possibilities by leveraging publicly available data on school quality. We first tested whether assignment to the CSRP intervention affected the type of school in which adolescents enrolled before examining the quality of these schools across a variety of school performance and culture measures. Given the exploratory nature of this analysis, we then subjected these results to a broad set of robustness checks, including models that controlled for high school neighborhood factors that could have affected a child’s chances of enrolling in a high-performing school. Finally, we turned to data from earlier periods to examine our hypothesized mechanisms as we tested whether results were driven by impacts on student test scores or selection into higher quality elementary schools.
Method
Details regarding study procedures, measures, and analytic approaches are provided in the Supplemental Material available on the journal website. Here, we provide a brief overview.
Study Design
Intervention
The CSRP intervention included four key program components. First, teachers were encouraged to attend five professional development (PD) sessions that focused on reducing behavioral problems and supporting self-regulated behavior in their students. Second, licensed mental health clinicians (called mental health consultants, or MHCs) regularly visited classrooms in the intervention group to coach teachers on the behavioral management strategies learned during the PD sessions. Third, MHCs provided stress-reduction workshops to teachers; and fourth, they provided direct services (including counseling, family advocacy, and positive behavioral support) to families for children who were identified as having substantial behavioral and emotional dysregulation difficulties.
The current study draws on longitudinal data from the CSRP evaluation, which was designed as a cluster-randomized control trial implemented in Head Start centers serving high-poverty neighborhoods. The 18 participating centers were matched into pairs (referred to as blocking groups) based on similar site-level characteristics, such that one site in each blocking group was randomly assigned to either treatment or control. From these centers, 35 classrooms and 602 (66% Black, 27% Hispanic, average income-to-needs ratio of 0.68) children were successfully recruited for data collection. Treatment classrooms implemented the CSRP intervention with the MHCs, and control classrooms conducted “business as usual” with the addition of part-time teaching aides in order to match the student-teacher ratio of the treatment sites. The intervention was first implemented across two cohorts of teachers and students; Cohort 1 (57% of the sample) participated in 2004–2005, and Cohort 2 participated during 2005–2006. Extensive data on students, families, and teachers was collected during preschool, and the students have been followed longitudinally through adolescence.
Sample
In the current analysis, we relied on school enrollment information collected from 461 students who remained in the study during the 2016–2017 academic year (77% of the original recruited sample; no difference between treatment and control, p = .918). Because student ages varied at the time of recruitment (i.e., students were enrolled in Head Start at ages 3, 4, and 5), students were spread across grade levels during follow-up. We focused our analyses on high school enrollment and excluded 19 children who were still enrolled in middle school during the 2016–2017 school year (eight from the intervention group and 11 from control). The remaining students were distributed across high school grade levels (26% in ninth grade; 43% in 10th grade; 30% in 11th grade; 1% in 12th grade), and we found no statistically significant differences in grade level between treatment and control groups.
Our analyses focus on results for two samples. First, we examined whether the intervention influenced the type of school within which a student enrolled, and these models included all high school students who reported school enrollment at the follow-up wave (n = 442; 73% of the original sample). We found no difference in reporting rate between treatment and control for this sample (p = .592). Our next set of analyses focused on publicly available measures of school quality from the State of Illinois (IL), and this sample included 381 students (63% of the original randomized sample) who had at least one valid measure of school performance or culture. This excluded 61 students who either enrolled in a private school (n = 20), left the state (n = 33), enrolled in Job Corp (n = 2), or enrolled in an IL public school for which no school quality data could be found (n = 6). Although we found little evidence of differential attrition from the group of students with school quality data (65% of the control group remained vs. 62% of the treatment group, p = .227), we discuss examinations of attrition patterns in further detail in the following.
Setting
During the 12-year span from initial intervention implementation to longitudinal follow-up, the CPS system underwent major changes as it adopted a school choice system that allowed students to opt out of their assigned neighborhood school. This process began in 2002, when CPS sought to increase the number of small schools accessible to youth in underserved neighborhoods (Sporte & De la Torre, 2010). Since then, the number of high schools has almost doubled, with much of this growth accounted for by the expansion of the charter school sector (Barrow & Sartain, 2017; Gwynne & Moore, 2017).
Under the new open enrollment system, students are given automatic admission to a neighborhood school based on geographic attendance boundaries. By 2016, 75% of students in CPS opted out of their assigned neighborhood school and instead sought enrollment in alternative school types, including other neighborhood schools (i.e., a public school in a neighborhood outside the student’s attendance boundary), charter schools, selective enrollment schools, International Baccalaureate (IB) schools, military academies, magnet schools, or college and career academies (Barrow & Sartain, 2017; Gwynne & Moore, 2017). The curricula and pedagogical approaches adopted in these schools can vary widely given that career academies lean heavily toward career and technical education courses, whereas magnet and selective enrollment schools offer accelerated curricula and specialized academic courses (see Barrow & Sartain, 2017). Indeed, Gwynne and Moore’s (2017) recent analysis of charter schools in CPS also noted the wide variation in curricula and quality for the growing charter school sector in Chicago.
The schools in the open enrollment system all required applications for enrollment, and lotteries were used to determine enrollment for oversubscribed schools (Barrow & Sartain, 2017). In recent years, CPS adopted a single, streamlined, application system that asks parents to rank their top choices across the district (see https://go.cps.edu/about-gocps). However, when students in our sample were first enrolling in high school, many schools still required separate applications, and charter schools required their own application process. Not surprisingly, navigating this admissions process can be arduous for families because families are forced to consider multiple factors, including distance, public transportation, safe passage routes, school demographic characteristics, and school performance, when setting their preferences (see Bell, 2009; Glazerman & Dotter, 2017).
Most schools allow students from across the district to apply for open enrollment slots, although neighborhood factors and academic performance can be incorporated in admissions decisions for certain high performing schools. In particular, children from more disadvantaged areas of Chicago are given priority in admissions for selective enrollment schools and some magnet programs (an issue we revisit in the Supplemental Material available on the journal website; see Barrow & Sartain, 2017). We examined how neighborhood factors might have influenced our results in additional analyses described in the following, and we provide more details regarding these issues in the Supplemental Material available on the journal website.
Measures
School type
We generated a data-scraping program that used student addresses and the CPS school locator website (https://schoolinfo.cps.edu/schoollocator/index.html) to find each students’ assigned neighborhood school. We then categorized the remaining schools according to the classification method used in Barrow and Sartain (2017) and grouped schools into the following categories: other neighborhood schools (i.e., neighborhood schools outside the student’s attendance boundary), charter schools, selective enrollment schools, and “Other” CPS schools (includes career academies, military academies, etc.).
School quality
For school quality, we relied on publicly available measures of school performance and culture. During the 2016–2017 school year, we collected high school enrollment data from students, parents, and the CPS district office. We then matched each student’s school to the Illinois School Report Card (ISRC; Illinois State Board of Education, 2017), a public information source that provides school performance metrics for each public high school in the state (a sample “report card” is provided in the Supplemental Material available on the journal website). We supplemented the ISRC performance metrics with school-level ACT scores taken from the ISBE data library (www.isbe.net), and we used Illinois’s “5Essentials” website (www.5-essentials.org/illinois/) to draw ratings of school climate and culture. Finally, for students enrolled in CPS schools, we collected global ratings of school quality, called School Quality Rating Policy (SQRP) scores (Department of School Quality Measurement, 2018). These SQRP scores (available at https://cps.edu/SchoolData/Pages/SchoolData.aspx) were calculated by CPS using an original formula that took into account many of the same factors considered in our analysis but also added information regarding dropout rate, freshman on-track rate, and college persistence (Chicago Public Schools, 2016).
These measures of school performance and quality are listed in Table 1 (see Supplemental Material available on the journal website for measurement details). Due to concerns over multiple testing, we averaged together all nonmissing measures of school academic performance for each student to generate a standardized school performance composite score using the four measures shown under the “School Performance Composite” subheading in Table 1 (α = .838). We also followed the same procedure for the 5Essentials measures of school culture to create a school culture composite score (α = .843). Finally, we combined these measures, along with the indicator for teacher retention, to generate an overall school quality composite score (α = .842).
Descriptive Characteristics and Correlations Among Various High School Quality Measures
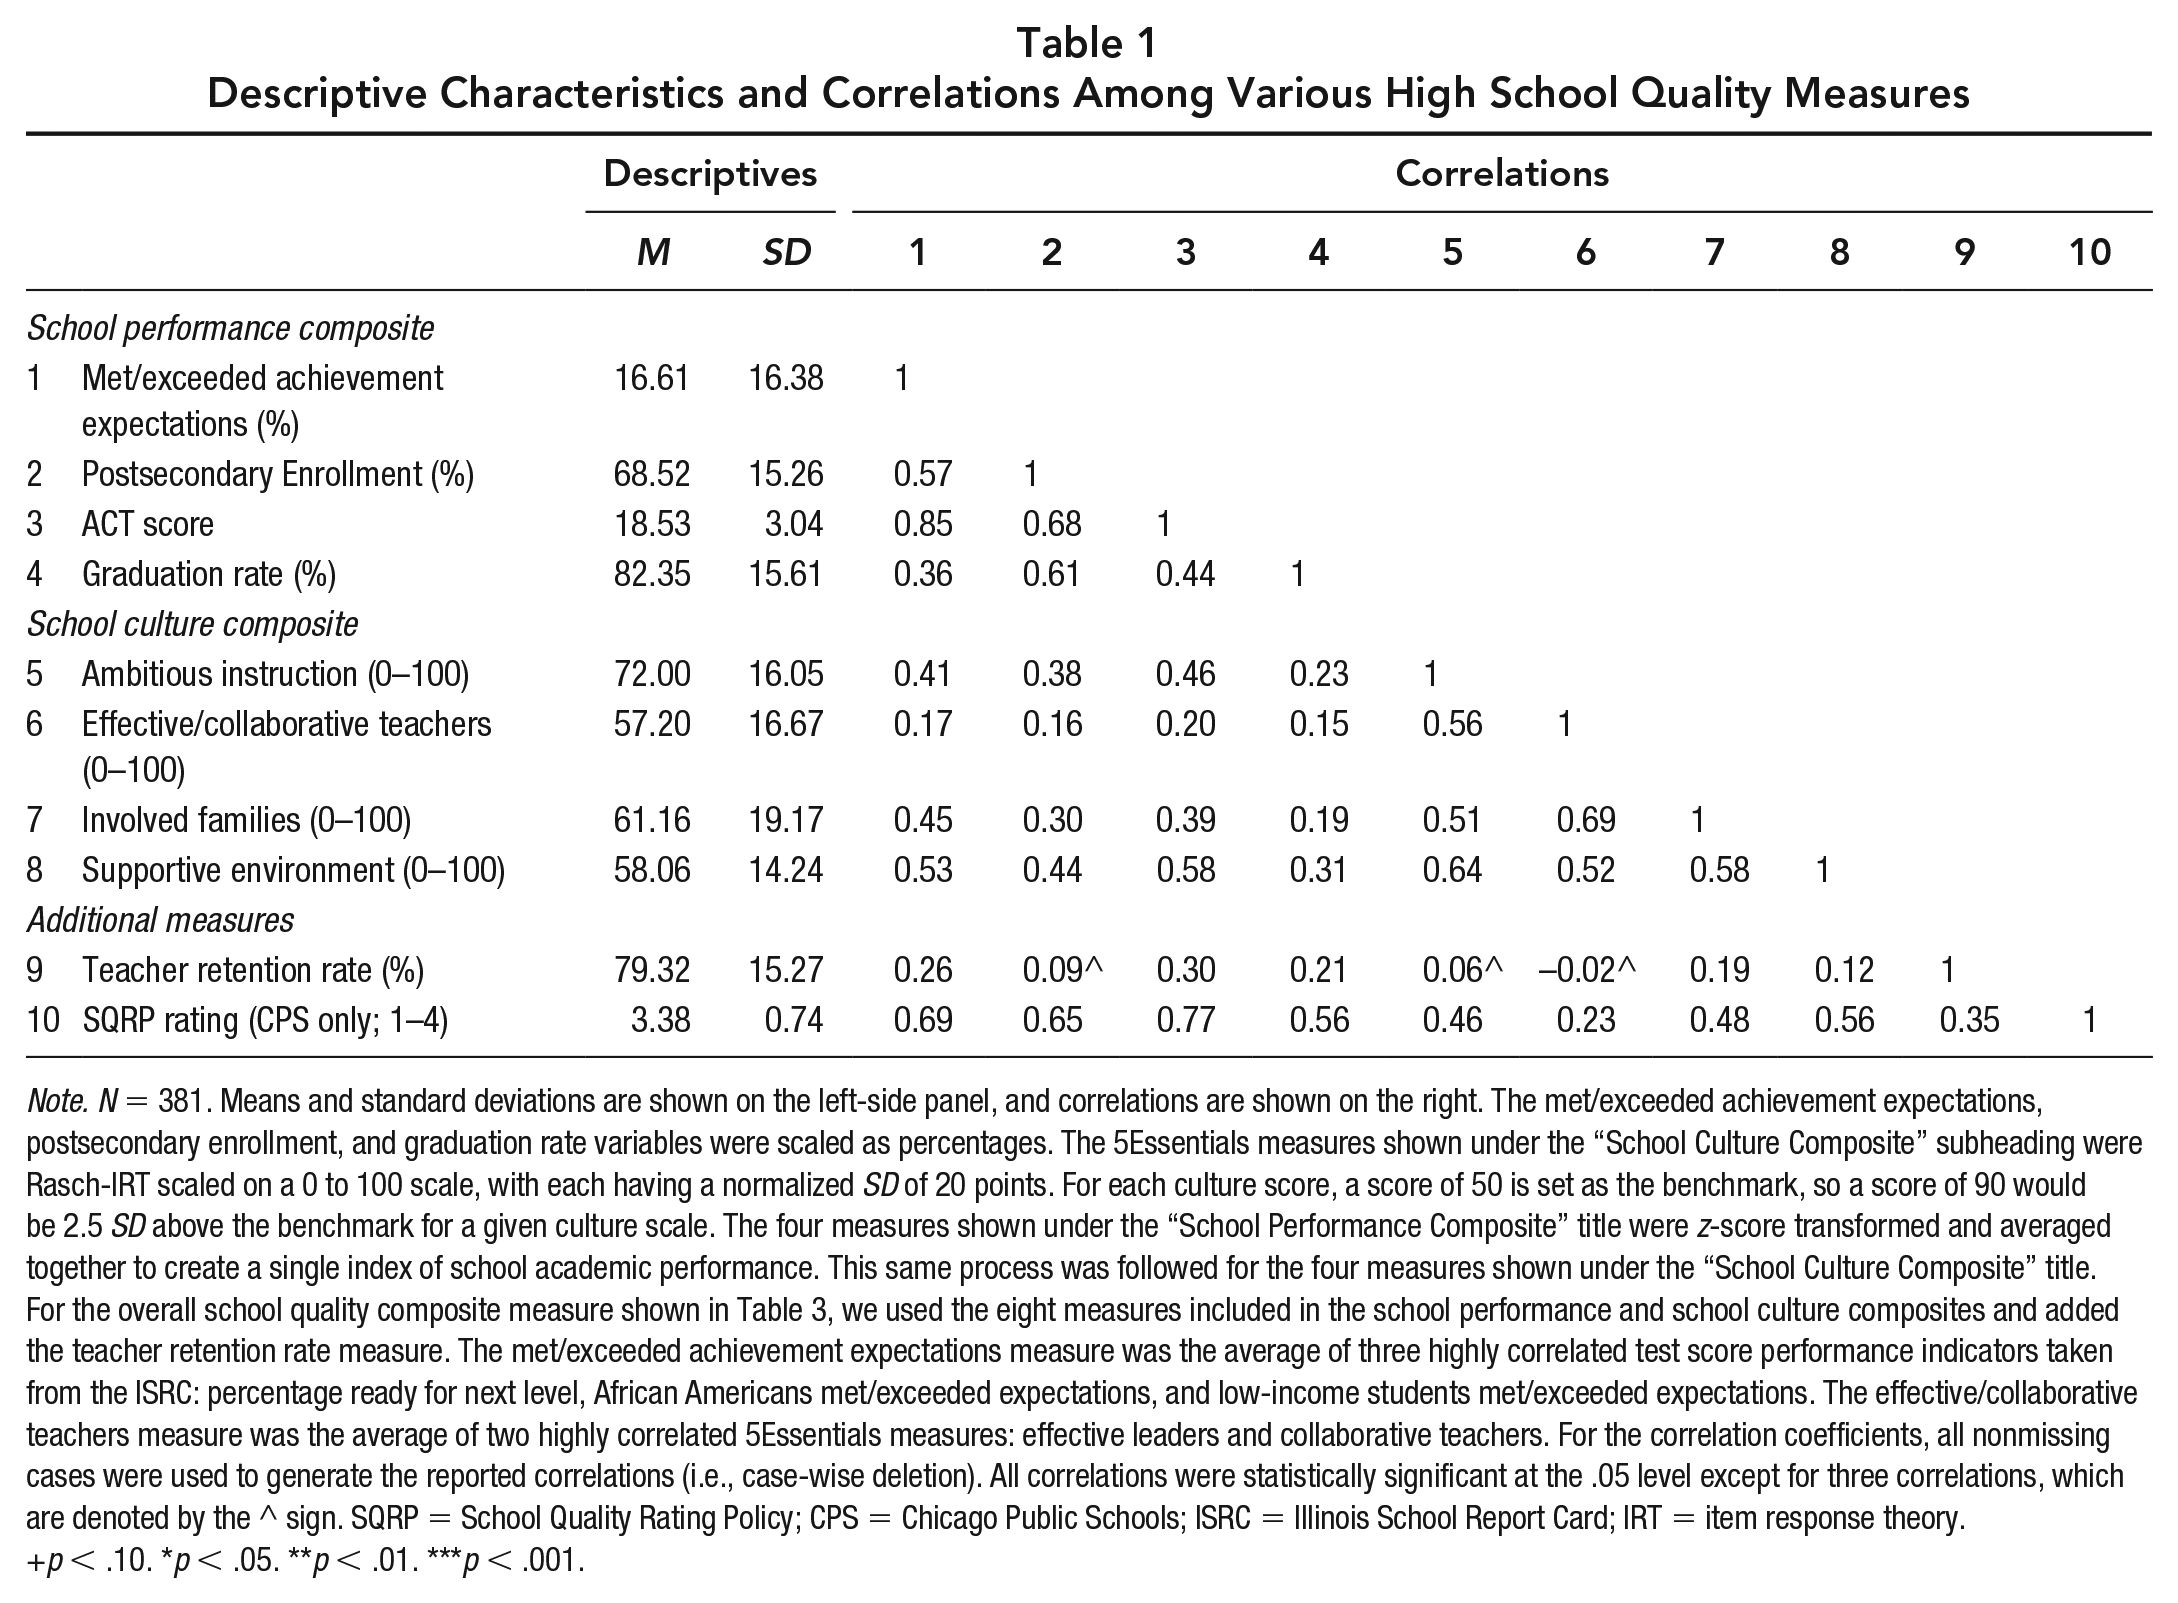
Note. N = 381. Means and standard deviations are shown on the left-side panel, and correlations are shown on the right. The met/exceeded achievement expectations, postsecondary enrollment, and graduation rate variables were scaled as percentages. The 5Essentials measures shown under the “School Culture Composite” subheading were Rasch-IRT scaled on a 0 to 100 scale, with each having a normalized SD of 20 points. For each culture score, a score of 50 is set as the benchmark, so a score of 90 would be 2.5 SD above the benchmark for a given culture scale. The four measures shown under the “School Performance Composite” title were z-score transformed and averaged together to create a single index of school academic performance. This same process was followed for the four measures shown under the “School Culture Composite” title. For the overall school quality composite measure shown in Table 3, we used the eight measures included in the school performance and school culture composites and added the teacher retention rate measure. The met/exceeded achievement expectations measure was the average of three highly correlated test score performance indicators taken from the ISRC: percentage ready for next level, African Americans met/exceeded expectations, and low-income students met/exceeded expectations. The effective/collaborative teachers measure was the average of two highly correlated 5Essentials measures: effective leaders and collaborative teachers. For the correlation coefficients, all nonmissing cases were used to generate the reported correlations (i.e., case-wise deletion). All correlations were statistically significant at the .05 level except for three correlations, which are denoted by the ^ sign. SQRP = School Quality Rating Policy; CPS = Chicago Public Schools; ISRC = Illinois School Report Card; IRT = item response theory.
p < .10. *p < .05. **p < .01. ***p < .001.
Baseline measures
To account for any sources of imbalance between the treatment and control groups at the time of random assignment, we included a host of baseline covariates in our fully specified treatment impact models. At baseline (i.e., the beginning of the preschool year), measures of family characteristics were collected via parent survey; children’s cognitive, behavioral, and emotional skills were collected via direct assessment; and measures of classroom quality and teacher characteristics were collected via classroom observations and teacher surveys. Neighborhood census tract was used to pull publicly available information regarding student neighborhood characteristics. Table 2 provides a reduced list of these baseline measures, and the full list of baseline measures is shown in Table S1 (in the Supplemental Material available on the journal website), along with additional information on measurement properties.
Descriptive Information for Selected Baseline Characteristics

Note. The full set of baseline characteristics can be found in the Supplemental Material available on the journal website (Table S1). Blocking-group-adjusted means values are presented, and p values were generated from a series of regressions in which each respective baseline characteristic was regressed on treatment status and the set of blocking group fixed effects. In these models, standard errors were adjusted for site-level clustering. The F test was generated from a model that regressed treatment status on all covariates (see Table S1 in the Supplemental Material available on the journal website) and evaluated whether the set of covariates statistically significantly differed between conditions.
p < .10. *p < .05. **p < .01. ***p < .001.
Mediators
To examine possible mechanisms linking the CSRP program to high school enrollment choices, we tested models that included measures of elementary school quality and eighth-grade test performance as potential mediators. Elementary school quality was measured using average school-reported test score (Illinois Standards Achievement Test, or ISAT) performance from both the kindergarten and Grade 5 follow-up waves. In eighth grade, students in CPS took the Northwest Evaluation Association (NWEA) tests, which assessed proficiency in math and reading (see Supplemental Material available on the journal website).
Analysis
To generate program impact estimates, we regressed each outcome variable on treatment status and the host of baseline controls collected at preschool entry. Because the intervention was evaluated through a cluster randomized design, we include blocking group (i.e., the site-level pairs used for random assignment) fixed effects in all analysis models, and standard errors were adjusted for site-level clustering using the sandwich estimator in Stata 15.0 (StataCorp, 2017). Missing data on baseline control variables were accounted for using full information maximum likelihood (FIML) in Stata (see Acock, 2012). In the Supplemental Material (available on the journal website), we present results from a host of alternative modeling specifications that considered different approaches for (a) modeling the multilevel study design, (b) accounting for missing data, and (c) estimating standard errors.
We also tested various elementary and middle school factors as mediators of our key treatment impacts. These mediational models were run using the sem commands in Stata and again included FIML estimation for missing data with blocking group fixed effects and cluster-adjusted standard errors.
Results
Descriptive Results
As Table 1 illustrates, students in the current sample largely attended schools that struggled to reach targeted benchmarks on state achievement tests. Only 16.61% of students in these schools met or exceeded test score expectations, and the average ACT score was 18.53. The average graduation rate was 82.35%, although we also observed considerable variation in graduation rate (SD = 15.61%) and test score performance (SD = 16.38%). The school climate and culture measures (varying 0–100 on a Rasch-IRT score, with a score of 50 set as the benchmark; see Table 1 note) indicated generally favorable ratings, with the Ambitious Instruction dimension posting the highest score (M = 72.00; SD = 16.05) and the other three dimensions posting scores close to 60.
Baseline Balance
As has been reported in other analyses from the current sample (Watts et al., 2018), we found evidence that random assignment failed to produce equivalent groups across all measures collected at baseline. As Table 2 illustrates, our F test assessing equivalence across all baseline characteristics (see full list in Table S1) indicated nonequivalence between the groups, F(45, 316) = 7.09, p < .001, with student cognitive assessments tending to favor the treatment group and baseline teacher assessments tending to favor the control group. We found some differences in baseline neighborhood characteristics, although most were not statistically significant. Of note, neighborhoods for intervention students tended to have higher concentrations of Black residents (p = .118), although they also had lower concentrations of people living without high school diplomas (p = .065) or below the poverty line (p < .01). We found little difference in median household income (p = .234). In the analyses that follow, we present results that controlled for all baseline characteristics, including neighborhood factors, alongside results that included no covariates. This approach follows standard program evaluation practice (see Angrist & Pischke, 2014; What Works Clearinghouse, 2018), allowing us to assess the degree to which baseline nonequivalence might have biased the results.
School Type
We began by examining the types of schools attended by high school students in the follow-up sample (n = 442), and we observed several differences in long-term selection patterns between CSRP intervention and control groups. Here, we describe results from cluster-adjusted models with no baseline controls in order to present meaningful control group means. In the Supplemental Material available on the journal website, we present results from models that included all baseline covariates as well as adjustments for attrition, and results were largely consistent. However, we note any instances where point estimates meaningfully differed.
As the top panel of Figure 1 shows, we observed that students assigned to the CSRP preschool program were 11.11 percentage points less likely to remain in Chicago by the high school follow-up wave (p < 0.01; cluster-adjusted control M = 77.30%) and 11.84 percentage points less likely (p < .001; cluster-adjusted control M = 74.74%) to enroll in a CPS high school. Consequently, they were 6.16 percentage points more likely to enroll in a non-CPS public school in IL (p < .05; cluster-adjusted control M = 15.91%) and 5.14 percentage points more likely to leave the state or enroll in a private school (p < .05; cluster-adjusted control M = 9.39%). Thus, this movement to non-CPS schools reflects some residential mobility by the CSRP group out of Chicago city limits. Interestingly, in fully controlled models, we found that controlling for whether the family remained in Chicago reduced the CSRP and control group difference in likelihood of CPS enrollment from 12.58% (p < .001) to 4.57% (p < .05), indicating that even among students who remained in Chicago, CSRP students were still less likely to enroll in CPS.
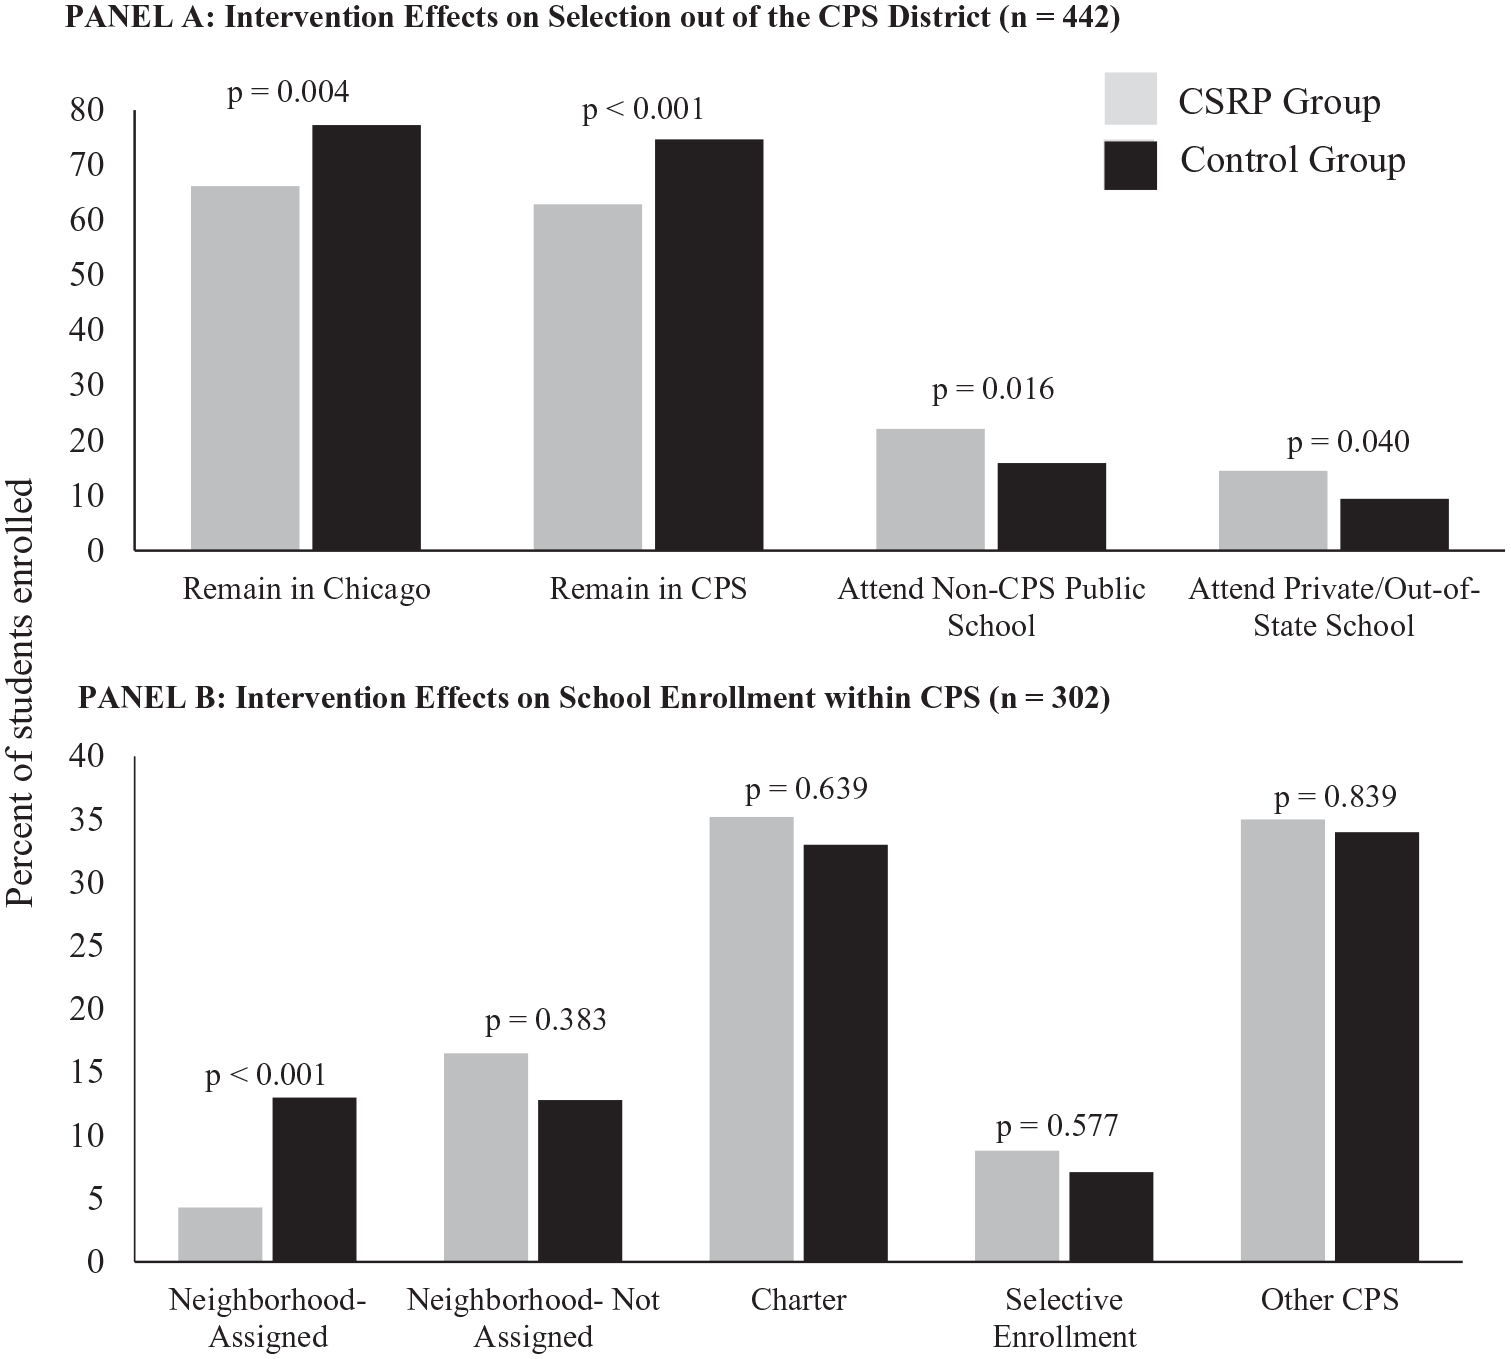
High school enrollment patterns disaggregated by school type.
Figure 1 presents differences in high school enrollment for students who remained in CPS (n = 302). Among this group, we observed that students in the CSRP program were 8.67 percentage points less likely (p < .001; cluster-adjusted control M = 13.04%) to enroll in their assigned neighborhood school (with full controls added, this fell to 6.38%, p < .05). Although we observed that intervention students were more likely to enroll in every other type of school within CPS (e.g., charter schools, selective enrollment school, etc.), none of these single-group differences were statistically significant. In the Supplemental Material available on the journal website, we present results from models that adjusted for selection out of CPS, and we again observed that intervention students were 8.01 percentage points less likely to enroll in their assigned neighborhood school (p < .01).
School Quality
Table 3 presents our key impact estimates on student selection into higher quality schools, which were measured for both CPS and non-CPS enrolled students (i.e., any student enrolled in an IL public high school). We began in Column 1 with models that included no baseline covariates before introducing baseline measures of child, family, classroom, and neighborhood characteristics in Column 2. In Column 1, estimates suggested that the CSRP group selected into higher quality schools, with marginally statistically significant effects detected for both the school performance composite (β = 0.21; SE = 0.12; p = .083) and the overall school quality composite (β = 0.20; SE = 0.12; p = .082). As controls were added, coefficient estimates tended to become larger, indicating that sources of baseline imbalance likely favored the control group to the extent that those differences also related to variation in later school enrollment. As such, we observed substantively meaningful and statistically significant impacts on the school performance composite (β = 0.29; SE = 0.12; p < .05) and the overall school quality composite (β = 0.23; SE = 0.11; p < .05) when the full set of controls were included. We found mainly positive but statistically nonsignificant effects on the school culture composite across models.
Impacts of the Chicago School Readiness Project Program on High School Selection
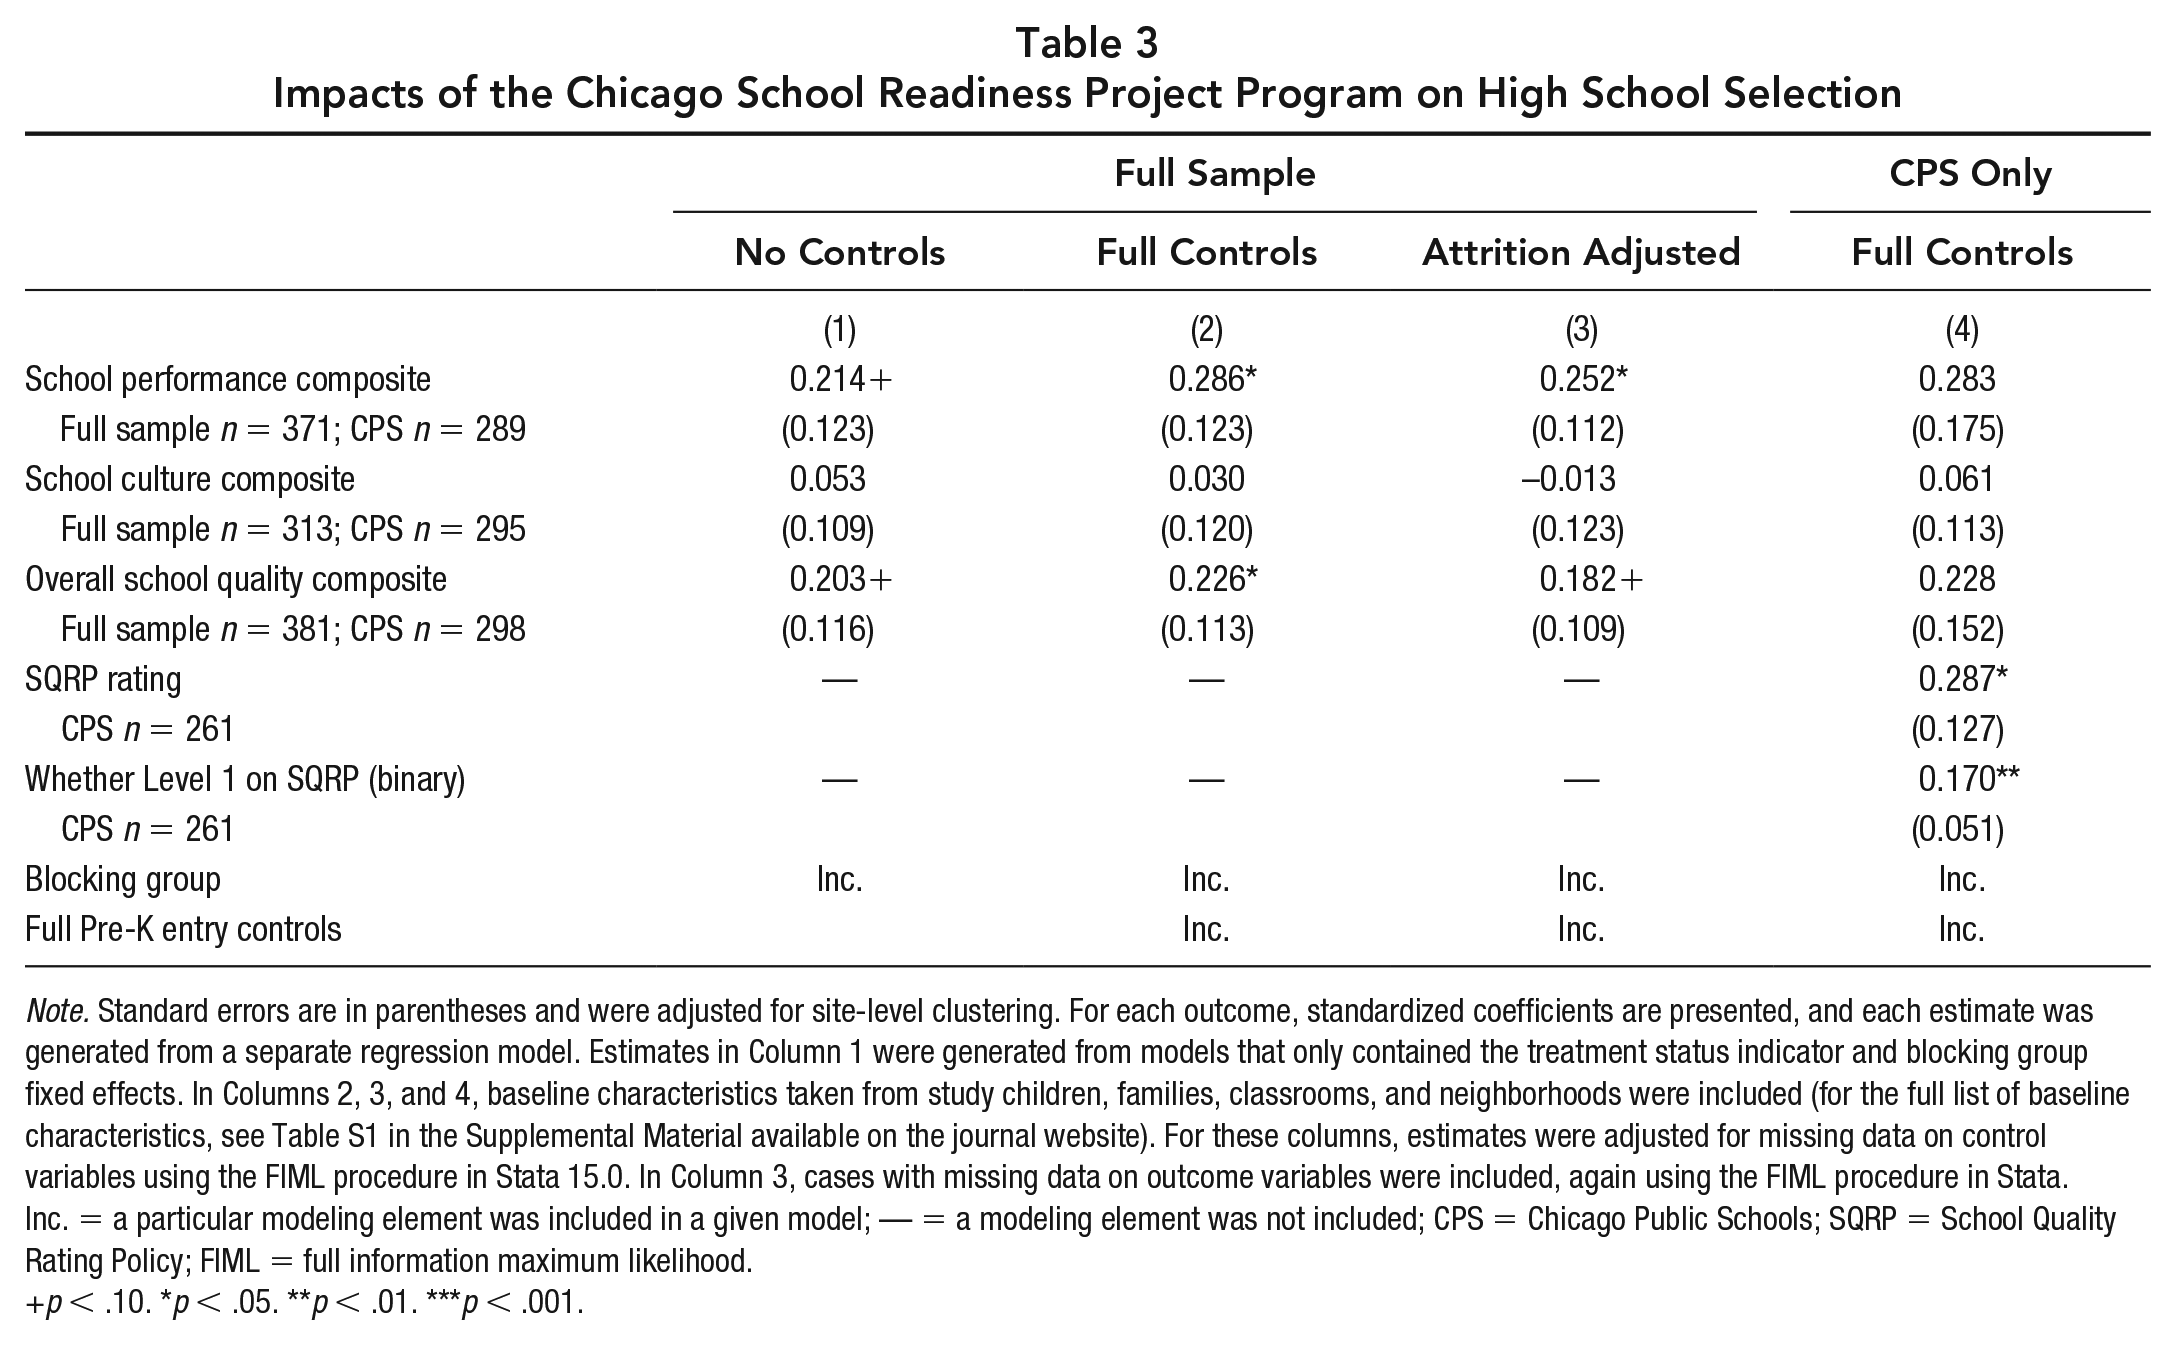
Note. Standard errors are in parentheses and were adjusted for site-level clustering. For each outcome, standardized coefficients are presented, and each estimate was generated from a separate regression model. Estimates in Column 1 were generated from models that only contained the treatment status indicator and blocking group fixed effects. In Columns 2, 3, and 4, baseline characteristics taken from study children, families, classrooms, and neighborhoods were included (for the full list of baseline characteristics, see Table S1 in the Supplemental Material available on the journal website). For these columns, estimates were adjusted for missing data on control variables using the FIML procedure in Stata 15.0. In Column 3, cases with missing data on outcome variables were included, again using the FIML procedure in Stata. Inc. = a particular modeling element was included in a given model; — = a modeling element was not included; CPS = Chicago Public Schools; SQRP = School Quality Rating Policy; FIML = full information maximum likelihood.
p < .10. *p < .05. **p < .01. ***p < .001.
To examine possible bias due to attrition out of our sample (recall that we observed little indication of differential attrition from the sample included in Table 3), we next turned to models that adjusted for missing data on school quality ratings using FIML estimation. These models used all of the baseline information available to estimate program impacts for students with no outcome data, and as Column 3 reflects, estimates were similar, although slightly smaller (12–20%), than those shown in Column 2. In the Supplemental Material available on the journal website, we also present results that used inverse probability weights to adjust for attrition, and results were again consistent with those shown in Column 2.
Because intervention students were more likely to leave the CPS district, we examined if our estimates on school quality were due to selection out of CPS. If so, this would indicate that results were not driven by differences in navigation of the CPS school choice system but were rather driven by mobility out of CPS altogether. In models shown in Column 4, we restricted the sample to only children who remained in CPS and found consistent point estimates to those shown in Column 2 (although standard errors rose and t statistics fell, due to the smaller sample size). Finally, we also present results for the CPS-generated SQRP score, which included additional factors related to quality not considered in our composite scores (e.g., college persistence). We again found that CSRP students selected into schools with higher SQRP scores (β = 0.29; SE = 0.13; p < .05), and we found that they were approximately 17 percentage points more likely to attend a school that passed the “high quality” threshold set by CPS (p < .01).
Mediation
To test our hypothesis that school selection effects could arise due to changes in preferences toward high-quality educational experiences, we examined whether the program shaped preferences for high-performing elementary schools and whether these changes might mediate the high school effects reported here (see Table 4). Although we found indications that the intervention positively affected selection into higher quality elementary schools (βs ranged from 0.09, p = 0.444, to 0.21, p = .025), we found little indication that this effect explained the impacts we observed on high school choice. For the models estimating impacts on the high school measures of school performance and overall quality, we found indirect effects of approximately 0.02 SD (not statistically significant). Moreover, we also found no indication that elementary school quality predicted selection out of the CPS district (β = −0.04; SE = 0.03; p = .206).
Examining Elementary School Quality as a Mediator
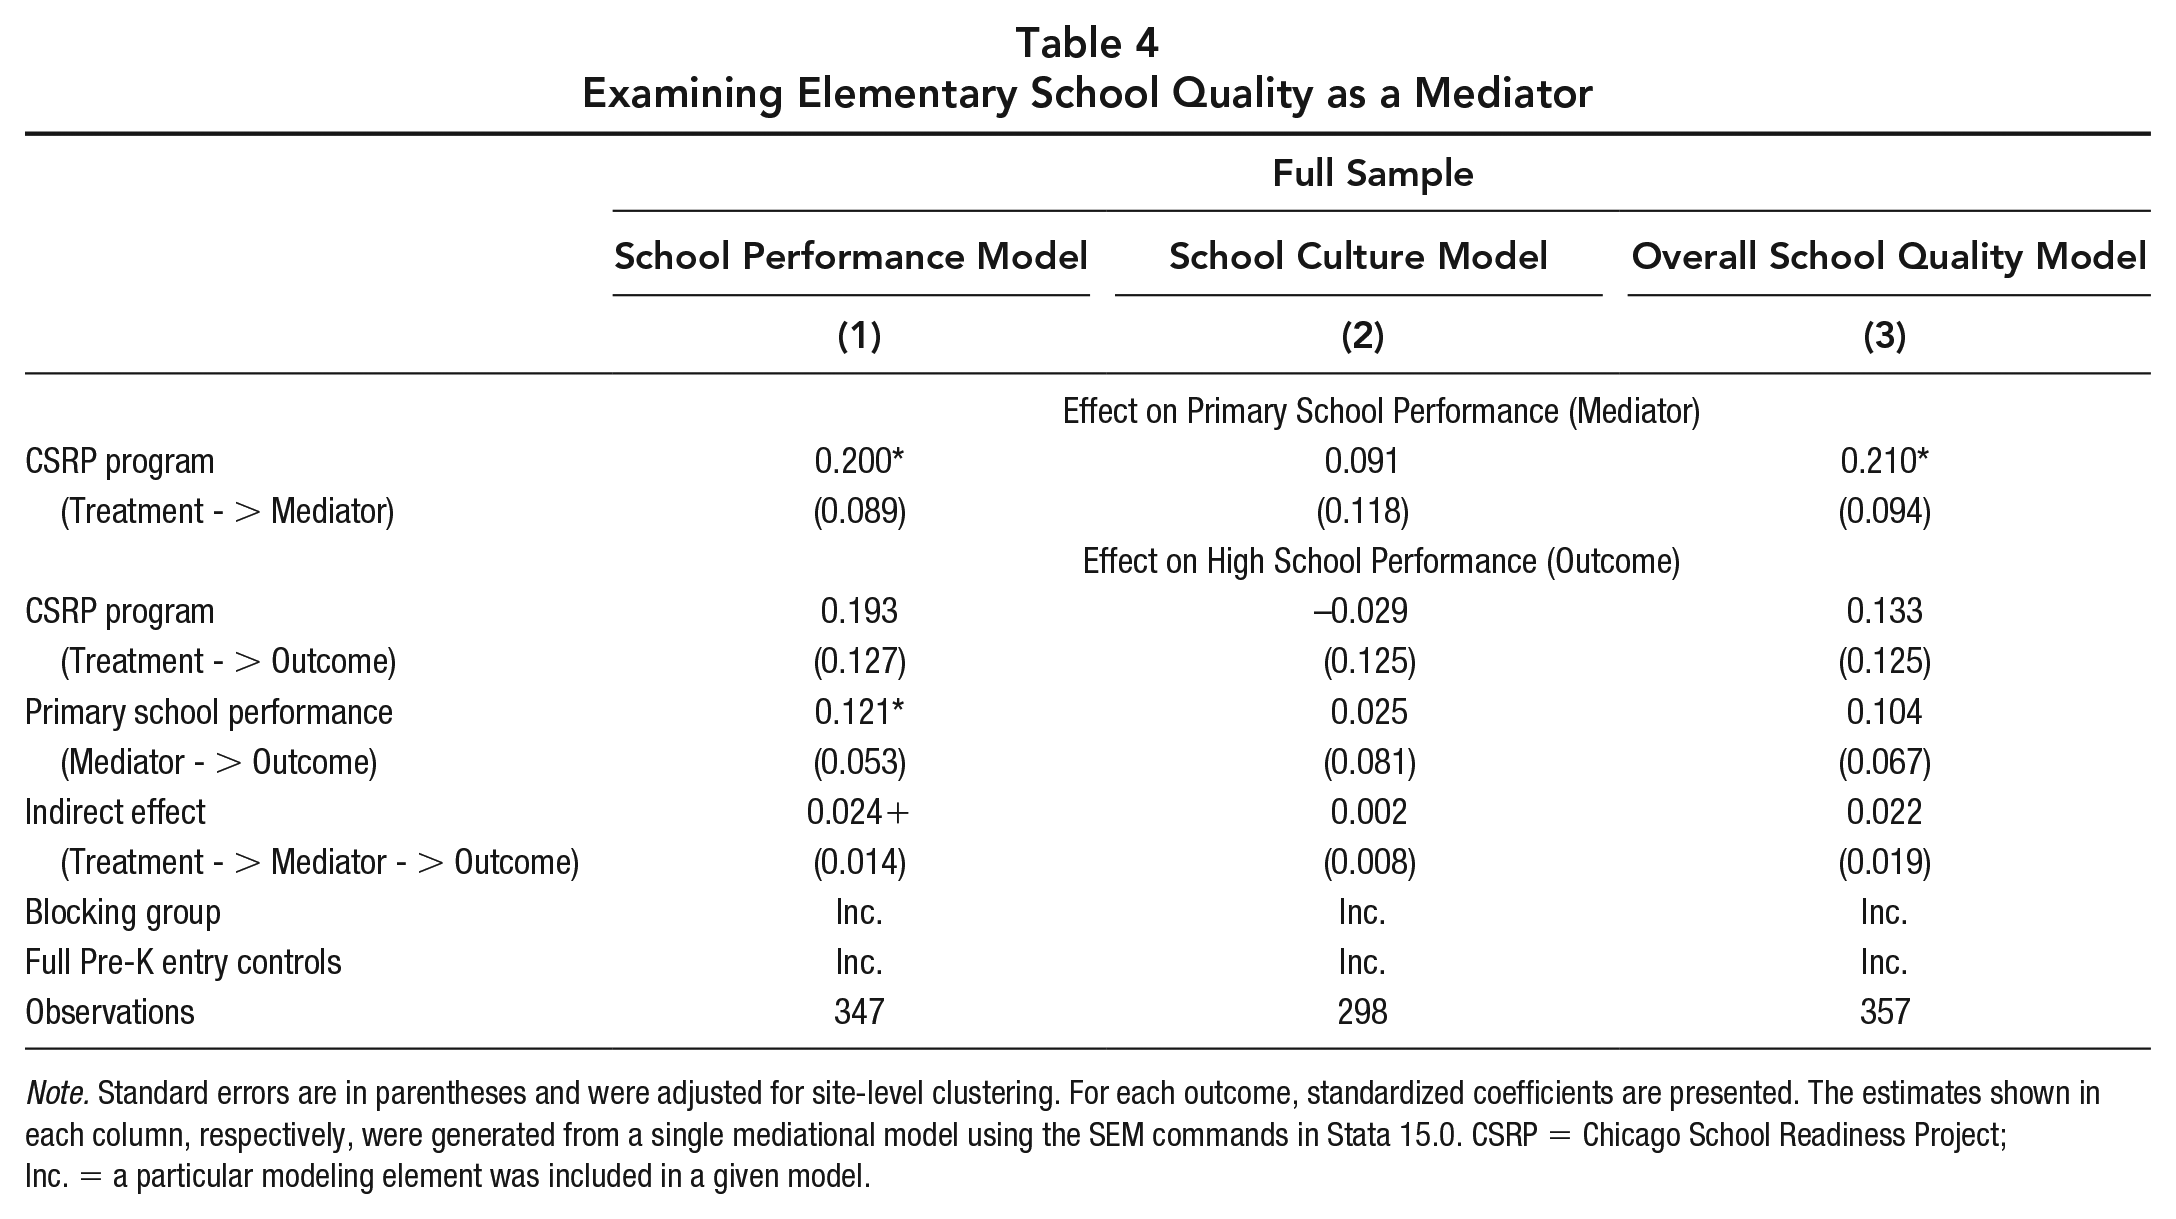
Note. Standard errors are in parentheses and were adjusted for site-level clustering. For each outcome, standardized coefficients are presented. The estimates shown in each column, respectively, were generated from a single mediational model using the SEM commands in Stata 15.0. CSRP = Chicago School Readiness Project; Inc. = a particular modeling element was included in a given model.
Because we hypothesized that changes in child skills might also account for later school selection effects, we also examined eighth-grade test scores as a possible mechanism. Unfortunately, we were only able to acquire these test scores for 272 students in the current sample (i.e., students in a CPS school for eighth grade), and intervention students were approximately 10% less likely to have eighth-grade test scores (p < .05). Because these mediational tests were less informative due to low power and biased missing patterns, we have included them in the Supplemental Material available on the journal website. As such, we found no effect of the program on eighth-grade test scores and consequently, no indication of mediation through test scores.
Additional Results
In the Supplemental Material available on the journal website, we detail results from a host of alternative models. First, we present results on the individual measures that comprise our school quality composites (Tables S2 and S3), and we present aforementioned results from models that used the full set of controls to estimate impacts on selection into school types (Table S4). Table S5 presents various alternative modeling specifications, including results from models that used hierarchical linear modeling and alternative approaches to estimating standard errors. In Table S6, we present alternative attrition adjusted estimates, and in Table S7, we detail results from models that used baseline characteristics to predict attrition into the various samples used in our key models.
Finally, in Table S8, we present results from models that assessed the robustness of our results to various control variables measured during high school, such as factors relating to residential mobility and the distance between the student’s home and school. Of note, we also examined how students’ high school home addresses might have affected their enrollment. Although CPS is an open enrollment district, some CPS schools give priority in admissions to students who live nearby. CPS also assigns neighborhoods a “tier rating” based on socioeconomic status and the quality of schools in the area, and this rating is factored into admissions decisions for many high-performing schools (see Barrow & Sartain, 2017). As we detail in the Supplemental Material available on the journal website, we found no indication that our results were driven by enrollment in schools that use residential proximity in admissions decisions, and we also found that results held when controlling for the neighborhood tier ratings.
Discussion
When considering the mechanisms that might lead ECE interventions to produce long-run effects on key adolescent and adult outcomes, researchers have placed increasing attention on children’s subsequent schooling experiences (e.g., Kitchens et al., 2020). We offer new evidence regarding school selection effects following an intensive ECE intervention given that the randomly assigned CSRP program had positive and statistically significant effects on students’ later selection into higher quality high schools. CSRP students were more likely to leave the CPS district, and for those who remained, they were more likely to select out of their assigned neighborhood school. Among students who did and did not remain in CPS, CSRP students were also more likely to attend schools with higher ratings on measures of academic performance (e.g., graduation rate, test scores). In general, we did not observe statistically significant differences on measures of school culture, although CSRP students who stayed in the CPS district attended schools with higher scores on the CPS-generated global quality rating. These results were robust to a host of modeling specifications, including adjustments for differential attrition, and controls for high school neighborhood factors that play a role in determining selection into higher performing schools.
We hypothesized that school selection differences could arise if the CSRP program led to changes in family preferences for high-quality educational experiences. We found evidence indicating mixed support for this hypothesis. On one hand, CSRP students were more likely to leave the CPS district, which was partly driven by residential mobility outside of CPS, indicating possible effects on family preference for schooling environments. However, although we also observed intervention effects on selection into higher performing elementary schools, we saw little indication that these effects accounted for the observed impacts on high school enrollment.
We also hypothesized that school selection differences could result from lasting program impacts on child skills and behaviors that influence enrollment in higher performing schools. Yet, we found no effect of the intervention on middle school test scores used in high school admissions. However, previous work with this sample indicates that the program may have positively affected adolescent executive function and achievement (Watts et al., 2018), and these skill changes could have affected school enrollment decisions. Unfortunately, the skill impacts observed by Watts et al. (2018) were drawn from follow-up measures assessed 1 year preceding the school enrollment effects observed here, when approximately half of the sample was already enrolled in high school. Thus, the impacts reported in Watts et al. cannot be easily disentangled as either causes or effects of the school selection results reported here.
The lack of any clear indication that these effects were driven solely by changes in child skills and behaviors underscores the importance for continued consideration of the broad processes that ECE interventions might affect. Yet, any expectations about the generalizability of these findings should be tempered pending replication across other ECE interventions and settings. The CSRP intervention was relatively unique, and efforts to replicate certain elements of the intervention have produced mixed results (Morris et al., 2013). Furthermore, the school choice system in Chicago differs in some important ways from other large urban settings. Whereas other large cities (see Abdulkadi̇roğlu et al., 2005; Harris & Larsen, 2015) use a process that requires students to make open enrollment decisions, students in Chicago who do not make an active choice are enrolled by default in their neighborhood school. CPS also uses neighborhood characteristics to help determine enrollment in high-performing schools, whereas most school choice systems rely solely on academic performance metrics (Barrow & Sartain, 2017). However, some features of school choice systems appear to be universal across cities given that research has consistently noted the burden placed on families by school choice systems (e.g., Corcoran et al., 2018; Denice & Gross, 2014) and that concerns for travel distance and academic performance often color families’ preferences (Corcoran et al., 2018; Denice & Gross, 2016). Indeed, across our models, we found that results were strongest for ratings of academic performance, and we also found that results held when controlling for the distance between schools and family homes.
However, several limitations should be noted. First, we were unable to observe students’ actual school applications. Thus, we do not know how families perceived their school options, preventing us from directly measuring families’ school choice sets (see Glazerman & Dotter, 2017; Hastings et al., 2009; Harris & Larsen, 2015). It should be noted that approximately 85% of the sample moved residences since Head Start, leading to the possibility that intervention parents moved their families to areas that they thought provided them with better school options. Indeed, the effects we observed on selection out of the CPS district suggests this was partly the case. Yet, in the Supplemental Material available on the journal website, we detail results from models that controlled for neighborhood factors that CPS incorporates into admissions decisions, and we also examined if results were driven by enrollment in schools that use residential proximity in admissions. We found little indication that results were driven by these factors.
Second, baseline balance and attrition can both present threats to the validity of randomized controlled trials. Our patterns of attrition fall at the border of the “acceptable” range for What Works Clearinghouse (2018) guidelines (see Supplemental Material available on the journal website), and our attrition-adjusted models produced estimates consistent with our main specification. However, issues with baseline imbalance could present a more substantial problem because some baseline classroom and neighborhood characteristics had differences larger than 0.25 SD (outside the acceptable range for What Works Clearinghouse, 2018; see Supplemental Material available on the journal website). This leaves open the possibility that unmeasured baseline differences between the treatment and control groups could have produced the effects reported here. Yet, it should be noted that including the entire set of baseline characteristics made intervention impact estimates grow larger, indicating that baseline differences likely favored the control group to the extent that they also affected school selection. Thus, if unmeasured baseline differences produced the results reported here, such differences would have to be uncorrelated with the large set of family, student, classroom, and neighborhood characteristics included in our models—an unlikely but possible scenario.
It remains unclear how the school enrollment patterns reported here will affect students in the long term. Student outcomes vary greatly within a school, and only future research can determine if these higher performing schools positively affected the students in the intervention group. Finally, more work is needed to understand the specific processes that led to the differences in school enrollment decisions reported here, and certainly, these effects were not predicted at the outset of the intervention. As such, these findings were exploratory in nature and should be interpreted as such.
Conclusion
The current study provides evidence suggesting that an intensive ECE intervention program, CSRP, had positive long-run effects on students’ selection into higher performing high schools. These effects suggest that the intervention could spur long-run outcomes on measures of attainment by affecting the educational paths that students take at key transition points. This work presents an interesting possible route of inquiry for ECE interventions that should be replicated across other settings and programs.
Supplemental Material
Watts_Online_Supplement_final – Supplemental material for Exploring the Impacts of an Early Childhood Educational Intervention on Later School Selection
Supplemental material, Watts_Online_Supplement_final for Exploring the Impacts of an Early Childhood Educational Intervention on Later School Selection by Tyler Watts, Deanna Ibrahim, Alaa Khader, Chen Li, Jill Gandhi and Cybele Raver in Educational Researcher
Footnotes
Notes
Authors
References
Supplementary Material
Please find the following supplemental material available below.
For Open Access articles published under a Creative Commons License, all supplemental material carries the same license as the article it is associated with.
For non-Open Access articles published, all supplemental material carries a non-exclusive license, and permission requests for re-use of supplemental material or any part of supplemental material shall be sent directly to the copyright owner as specified in the copyright notice associated with the article.