
Abstract
A survey targeting education researchers conducted in November 2020 provides forecasts of how much achievement gaps between low- and high-income students in U.S elementary schools will change as a result of COVID-related disruptions to in-class instruction and family life. Relative to a pre-COVID achievement gap of 1.00 SD, respondents’ median forecasts for the jump in the achievement gaps in elementary school by spring 2021 were large–a change from 1.00 to 1.30 and 1.25 SD for math and reading achievement. Forecasts were similar for 2022. Although forecasts were heterogeneous, respondents showed overwhelming consensus that gaps would grow. We discuss implications for strategies to reduce learning gaps exacerbated by the pandemic as well as the mental models researchers appear to employ in making their forecasts.
The onset of the coronavirus disease 2019 (COVID-19) pandemic in March 2020 created major disruptions in schooling for children in the United States. Public school systems have responded to the crisis in a variety of ways, some suspending in-class instruction in favor of online learning, whereas others have moved to a hybrid model that combines socially distanced in-class instruction with distance learning, and still others have continued to provide in-class instruction with smaller classes and shorter school days to allow for social distancing (Diliberti & Kaufman, 2020). There is also significant variation in the timing of responses to the pandemic; in-school instruction ended much sooner in locales such as New York City, where infection rates spiked early, than in parts of the country that experienced later spikes. However, increases in COVID-19 infection rates throughout the country during the fall of 2020 have made it clear to policymakers, parents, and formal educators that COVID-19 disruptions to schooling are widespread and severe.
Few analysts of American education doubt that the pandemic has hindered learning for a great many children. A critical related question is whether the COVID-19 pandemic and school systems’ responses are increasing achievement gaps between children from economically advantaged and disadvantaged families. This would be particularly troubling because family-income-based gaps in children’s achievement were already large before the pandemic, contributing to gaps in educational attainments and subsequent labor market earnings (Murnane & Levy, 1996; Papay et al., 2020).
There are several reasons why the disruptions caused by the pandemic may increase income-based achievement gaps (Bansak & Starr, 2021). First, parents in low-income families are more likely to be “frontline workers” exposed to the COVID-19 virus and are less likely to have access to high-quality health care (Berube & Bateman, 2020; Cole, 2020). Consequently, the pandemic may widen the gap between the high- and low-income parents with respect to health and the ability to support their children. Second, low-income families are less likely than more affluent families to have high-quality internet service and computers in their homes, making it more difficult for their children to access online instruction (Stelitano et al., 2020). Third, relative to their more affluent peers, children from low-income families are more likely to attend public schools that lack the resources to support teachers’ efforts to provide high-quality online instruction (Diliberti & Kaufman, 2020). Fourth, low-income parents are less able to supplement school instruction with private tutoring and other forms of enrichment (Lee et al., 2021). Moreover, they are less able to enroll their children in private schools if they conclude that public schools’ responses to the pandemic are inadequate.
As detailed below, analyses of data on the short-run impacts of the COVID-19 pandemic on children’s learning gains through a portion of the 2020–2021 school year have started to appear. Data on longer-run achievement impacts will not be available until 2022 at the earliest. We tap into another source of information about these short- and longer-run impacts—the forecasts of education researchers. In the current study, we recruited a large sample of education researchers and asked them to make quantitative forecasts of how socioeconomic gaps will change in the short run (from before the pandemic to the spring of 2021) and longer run (between springs of 2021 and 2022). We discuss the implications of both sets of forecasts for school district strategies to reduce the learning gaps exacerbated by the pandemic as well as in understanding the mental models researchers appear to employ in making their predictions.
Why Forecasts?
For several reasons, forecasts by researchers may be useful for quantifying and understanding the problems created by the COVID-19 pandemic and alerting policymakers to the nature of need for specific policy responses. One purpose of forecasts of trends in socioeconomic gaps in achievement test scores is to help policymakers anticipate the magnitudes of learning gaps teachers will face during the 2021–2022 school year and beyond. Will education researchers’ forecasts be accurate enough to accomplish this purpose?
Our survey solicited predictions about learning gaps in the springs of both 2021 and 2022 because we wanted to capture two kinds of predictions: 1-year jumps in socioeconomic status (SES)–based gaps between just before and a year after the onset of the pandemic and the subsequent-year amelioration in those jumps as (we hope) the education system returns to more normal functioning. Because our survey was conducted in the second half of November 2020, the accuracy of the first of these predictions may have been enhanced by emerging data about achievement changes during the spring and summer months of the pandemic. Our brief review of studies based on the emerging evidence distinguishes between those that appeared before our survey and those that appeared after. In contrast, no existing achievement data can directly inform the amelioration predictions between the springs of 2021 and 2022.
DellaVigna et al. (2019) and Tetlock et al. (2017) provide recent reviews of the utility of forecasts for research and practice. Careful recent work on the accuracy of forecasts finds that researcher predictions, especially when averaged, can provide an accurate forecast of the results of future experimental studies (DellaVigna & Pope, 2018; Dreber et al., 2015). In presenting results from our prediction survey, we concentrate on the averages and medians of the respondents’ forecasts.
Other research points to the fallibility of social scientists’ predictions. Hutcherson et al. (2021) asked social scientists and laypeople to make predictions about pandemic-induced changes in a range of social and psychological outcomes (e.g., depression, religiosity) and compared them with empirical estimates of changes in the same metrics between the spring and fall of 2020. Social scientists’ forecasts were no more accurate than laypeople’s forecasts, tended to be too large in magnitude, and were often mistaken in direction. More specific to the field of education, studies of education researchers’ implicit forecasts about effect sizes from large preregistered randomized controlled trials within education were too optimistic (Lortie-Forgues & Inglis, 2019).
Both these cases provide a more pessimistic view of the accuracy of researchers’ forecasts than we might observe in the current study: Hutcherson et al. (2021) collected forecasts about changes after the start of the pandemic, which are plausibly more difficult than forecasts about changes from a baseline before the pandemic. Also, for various reasons, it is likely that researchers’ forecasts do not perfectly align with study power in Lortie-Forgues and Inglis’s (2019) analysis. Still, the accuracy of education researchers’ forecasts about changes in achievement gaps during COVID-19 is far from guaranteed.
A second purpose of forecasts is to help guide education-related research efforts. Researcher beliefs that learning gaps are likely to increase sharply, and perhaps differentially for math and literacy, might be useful in catalyzing research on how best to address those problems and how to direct investments in the education system both during and after the pandemic. The field of public health provides an example of how forecasts from public health researchers gathered during the pandemic help to direct future research or intervention. Specifically, a Nature survey of immunologists, infectious disease researchers, and virologists indicated a strong consensus that it was likely that COVID-19 will become endemic in the future, primarily because of mutation-induced “immune escape” (Phillips, 2021). These predictions, if accurate, have clear implications for public health policy planning.
Third, researcher forecasts provide insights into the nature of the mental models researchers employ when they consider educational processes. This is particularly the case with predictions regarding the extent to which the pandemic-induced jumps in achievement gaps between the springs of 2020 and 2021 will decline over the subsequent year. Because no data are yet available on 2021–2022 achievement changes, researchers must rely on theory and evidence from other studies.
Theories of school organization often emphasize systems that are slow to change, which might lead to predictions of little amelioration (Bidwell, 2001). On the other hand, because the positive “shocks” of educational interventions on achievement outcomes often decrease substantially in magnitude in the year following the intervention (Bailey et al., 2020), researchers may reason that similar processes may cause the pandemic-induced negative shock in achievement gaps to fade out quickly. In the future, our forecasts and potential moderators of their accuracy can be checked against actual test score data, and this will tell us more about the ideas that might be useful to consider when forecasting other educationally relevant outcomes.
Evidence Produced Prior to and During Our Survey
As of the end of December 2020, researchers had developed three types of information on the impact of the COVID-19 pandemic on family-income-related gaps in children’s achievement. First are predictions based on evidence from previous events that have hindered children’s learning, such as weather-related school closures. Kuhfeld, Soland, et al. (2020) forecast substantially lower achievement gains as a result of COVID-related declines in instructional time, with larger relative losses in math than in reading and for lower-achieving students relative to high achievers. Notably, however, these forecasts fail to account for learning gains that may have been facilitated by online instruction between March and June 2020.
The second type of evidence relates to the responses of schools and parents to the onset of the COVID-19 epidemic. The vast majority of public school systems ended in-class instruction in the spring of 2020, albeit on different dates and for different lengths of time. Most moved to online schooling, providing varying levels of support as teachers sought to provide effective instruction. The evidence to date allows us to draw three conclusions: The amount of online instruction students receive is less than the amount of in-class instruction they were offered pre-COVID-19; the average quality of instruction is lower; and student participation rates are lower, especially among children from low-income families (Rapaport et al., 2020). Barnett and Jung (2020) have shown that these patterns also hold for the education provided to preschool-age children.
In response to school closings, many parents have searched online for learning resources for their children. According to Bacher-Hicks et al. (2021), online searches for both school-centered and parent-centered learning resources increased dramatically in the months following the onset of the COVID-19 pandemic. They also show that searches increased much more in relatively affluent than in lower income areas.
The third and most direct type of evidence is from the studies of children’s learning losses as a result of COVID-19. Engzell et al. (2020) examined learning losses in the Netherlands, where schools were closed for only 8 weeks and the infrastructure for remote learning is excellent. They report that because of COVID-19, primary school students lost 8% of a standard deviation (SD) of achievement in school subjects such as math and reading. This is equivalent to losing the academic progress a child is likely to achieve during one fifth of a year of schooling. They also show that the average child made little progress while learning from home through online instruction. An especially troubling finding is that learning losses were 55% larger among students whose parents had relatively low levels of educational attainment than among children with highly educated parents.
Data supplied to Chetty et al. (2020) by Zearn, an online platform for learning mathematics, provide additional insight into the impact of COVID-19 on children’s achievement. Zearn Math was being used by approximately 925,000 students in the United States in spring 2020, and schools continued to use this online platform as part of their math curriculum after COVID-19 caused a shift to remote learning. Chetty and his colleagues conducted a time-series analysis of the number of accomplishment badges children earned each week on Zearn Math between the beginning of January 2020 and the end of April 2020. They found that the accomplishments of children in high-income areas declined initially when COVID struck but quickly returned almost to the pre-COVID average. In contrast, the number of accomplishment badges completed by children in lower-income areas fell by 50% when the pandemic began and remained at this low level through the end of the school year. While acknowledging that the Zearn Math platform captures only one aspect of education, the research team concluded that the evidence suggests that the pandemic has increased inequality in children’s human capital development.
Curriculum Associates (2020) compare results on math and reading achievement from their proprietary assessments for large samples of first through eighth graders tested in the fall of 2020 with fall scores from the prior three school years. A noteworthy limitation of their 2020 samples is that they consist only of students who were physically attending their schools. Substantially larger fractions of students across all grades scored at least two grade levels below their current grade for math in fall 2020 than in the previous falls. In the case of reading, larger fractions of 2020 students in elementary grades were well below grade level than in prior cohorts, whereas scores for children attending middle school were slightly higher for the 2020 than prior cohorts. Importantly, increases in the percentage of students well below grade level on both math and reading were higher for lower- than higher-income students.
Renaissance Learning (2020) used the results from their proprietary STAR skills assessments to estimate the growth in reading and math skills students in Grades 2 to 8 between the fall of 2019 and the fall of 2020. They then compared these growth estimates with estimates of expected achievement growth that were based on evidence from earlier cohorts. Their sample included more than 1 million students from all 50 states, including students attending schools and those learning online. Their sample was restricted to students who took the STAR assessments in both the fall of 2019 and the fall of 2020. The Renaissance Learning team found a consistent pattern of growth in mathematics achievement between the fall of 2019 and 2020 that was below expectations for students in all grades between the fall of 2019 and 2020. Growth in reading achievement was below expectations for students in Grades 4 to 8 but not for students in earlier grades. Importantly, the greatest gaps between actual achievement gains and expected gains occurred for children in schools serving high percentages of students from low-income families.
Evidence Available After Our Survey
Kuhfeld, Tarasawa, et al. (2020) examined the short-run impact of COVID-19 by comparing the reading and math scores of more than 3 million elementary school students enrolled in more than 8,000 schools in fall 2020 with those of students enrolled in the same grades of the same schools in fall 2019. They reported that average student achievement in reading was similar in fall 2020 to that of comparable children in 2019 but 5 to 10 percentile points lower in math. In a technical appendix to their article, the researchers report that students in Grades 3 to 6 in high-poverty schools achieved lower scores in reading in fall 2020 than in fall 2019, although this was not the case for students in low-poverty schools. Moreover, students showed growth in both reading and math skills between winter 2020 (before COVID-19 struck) and fall 2020, but growth in math was slower than in previous years. Finally, Kuhfeld, Tarasawa, et al. (2020) point out that their estimates of relative learning losses from COVID-19, especially for children from low-income families, are probably underestimates since a disproportionate number of the students from low-income families in their sample did not take the fall 2020 assessments.
In summary, only limited evidence exists on the short-run impact of COVID-19 on the learning of American children from different backgrounds. Data suggest small to moderate initial impacts on student learning from COVID-based educational interruptions but inequality of access to online educational resources. Because it is so important to understand how the pandemic has affected short-term and longer-term family-income-based gaps in student achievement, and because of the role researchers might play in influencing education policy in the coming years, it seemed useful to survey education researchers about their forecasts of short- and longer-run impacts. Because unequal experiences during the school year might exacerbate gaps, and based on our discussions with education researchers, we hypothesized they would forecast substantial gaps in the springs of 2021 and 2022.
The Survey
Our data are based on 221 responses to a survey that we sent targeting education researchers. Responses were received between November 18 and 27, 2020. Owing to logistical and financial constraints, we opted for a convenience rather than a probability sample. And while we sought to elicit responses from a disciplinarily diverse set of researchers, because of the procedures we used in drawing the sample our results should not be assumed to be representative of potential responses of the population of researchers who work on education issues. Our procedures were registered with the Institutional Review Board at the University of California, Irvine.
After developing and refining our survey with the help of a number of researchers, the first three authors sent links to the survey to current and former colleagues, advisory boards, and heads of several professional associations and funders in the field of education research, plus the Twitter feed of a prominent science writer. To accurately describe the sources from which respondents accessed the survey, we generated 15 distinct survey links and tracked the responses associated with each link. Apart from collecting the email addresses of respondents who requested a copy of our results, our survey was anonymous.
The heart of our survey consists of questions asking for predictions of “NAEP (National Assessment of Educational Progress)-type” achievement gaps in math and reading in spring 2021 and spring 2022 for children attending elementary school (see Supplemental Appendix 1, available on the journal website, for survey question wording). To anchor these predictions, we asked respondents to assume that the actual achievement gaps for math and reading between children in the top and bottom quintiles of the family income distribution just prior to the onset of COVID-19 were 1.00 (SD)—gaps that correspond roughly to actual achievement gaps in elementary school (Duncan & Magnuson, 2011; Reardon, 2011).
Thus, a response of “1.20 SD” for the 2021 math gap constitutes a prediction that the income-based math gap would grow by 0.20 SD (i.e., from 1.00 SD to 1.20 SD) between winter 2020 and spring 2021. Third graders typically gain about 0.52 SD in math achievement and 0.36 SD in reading achievement over the course of the school year, so a 0.20 SD prediction amounts to a relative loss of about 4 months of math learning and 6 months of reading achievement for low-income students relative to their high-income peers (Hill et al., 2008).
Because transitory achievement gains and losses are much less worrisome than longer-term trends, we also asked respondents to predict the size of the relevant gaps in spring 2022. Comparing the predictions between the springs of 2021 and 2020 provides a measure of the expected degree to which achievement gap increases occasioned by the COVID-19 pandemic will narrow in the subsequent school year.
Last, we asked three questions designed to help explain differences in predictions across groups: Respondents were asked about their academic field, whether they had ever taught in a K–12 classroom, and whether they were living with school-age children. We expected that researchers with K–12 classroom teaching experience and those living with school-age children would be especially aware of the advantages that higher-income parents are able to provide for their children and thus predict the largest increases in achievement gaps. A summary of participant characteristics appears in Table 1.
Descriptive Statistics of Respondent Characteristics

Note. AERA = American Educational Research Association.
As with any survey, our questions represent only one of a number of possible ways to elicit these kinds of gap predictions. Since our ultimate goal is to compare predictions with observed changes in achievement gaps, we might have tied our questions to specific tests—for example, fourth grade NAEP scores or scores recorded in state administrative data sets. However, NAEP tests are administered only every other year—and the director of the National Center for Education Statistics recently announced that because of problems created by COVID-19, the planned 2021 administration of NAEP will be postponed for at least a year (Woodworth, 2020). State testing and data release policies vary across states and time, making it difficult to estimate the national changes in average achievement gaps. For these reasons, we opted for conceptual clarity by asking about predicted changes in family-income-related achievement gaps from just prior to the onset of the pandemic to 1 and 2 years later. 1
Our reference to “children attending elementary school” is broad and ignores the large differences in achievement growth rates across the first six school grades (Hill et al., 2008). In using the “elementary school” wording, we sought an average estimate among younger school-age children and avoided the worry that tying it to a particular grade might pick up idiosyncratic aspects of the chosen grade.
Four respondents’ forecasts for gaps in 2022 were very low (for reading, 0.05 or 0.10, indicating that gaps would shrink from 1.00 to near 0), whereas their forecasts for 2021 were larger than their forecasts for 2022 (0.10, 0.15, 0.20, and 0.60). We inferred from this pattern of responses (implausibly small 2022 forecasts, larger forecasts in 2021, and similarity of forecasts to the distribution of forecasts after adding 1 to them) that these respondents intended to offer forecasts that were 1.0 larger (i.e., that they were forecasting gap growth, rather than gaps) and recoded them accordingly. Additionally, five respondents made very large forecasts of between 2 and 4 SD. To limit the influence of these outlying observations on our estimates and descriptive figures, we recoded these responses to 2 SD. We also describe central tendencies with both means and medians and show the full distribution of responses.
Results
A summary of predictions is presented in the top panel of Table 2. The median forecast for the increase in the math achievement gap from before the pandemic to the spring of 2021 was a change from 1.00 to 1.30 SD—a change that amounts to more than half of the amount of math learning that typically occurs across the entire third grade year (Hill et al., 2008). The prediction for the reading achievement gap was only a bit smaller—a jump from 1.00 to 1.25 SD.
Descriptive Statistics of Researcher Predictions of Math and Reading Gaps in Spring 2021 and 2022

How successful will teachers and other educators be in making up for ground lost during the 2020–2021 school year? One possible measure of success is the extent to which achievement gaps in the spring of 2022 revert to their pre-COVID levels—assumed in our survey to be 1.00 SD. Few of the respondents made this prediction. In fact, median predictions of achievement gaps fell very modestly—from 1.30 to 1.25 SD for math and from 1.25 to 1.20 SD for reading. Indeed, one quarter of respondents even predicted that gaps in both math and reading would be larger in the spring of 2022 than in the spring of 2021.
Full distributions of forecasted SES-based gaps on math and reading tests are shown in Figure 1 (2021 predictions) and Figure 2 (2022 predictions). Each point corresponds to a survey response, and the cello-shaped figures smooth these points out with kernel density plots. Forecasts range from 0.80 SD (which represent a decrease in the gap) to 2.0 SD (which represent a doubling of the gap). In all cases, responses are positively skewed. In addition to the large number of responses between 1.10 and 1.30, responses clustered at round numbers, such as 1.10, 1.20, 1.50, and 2.
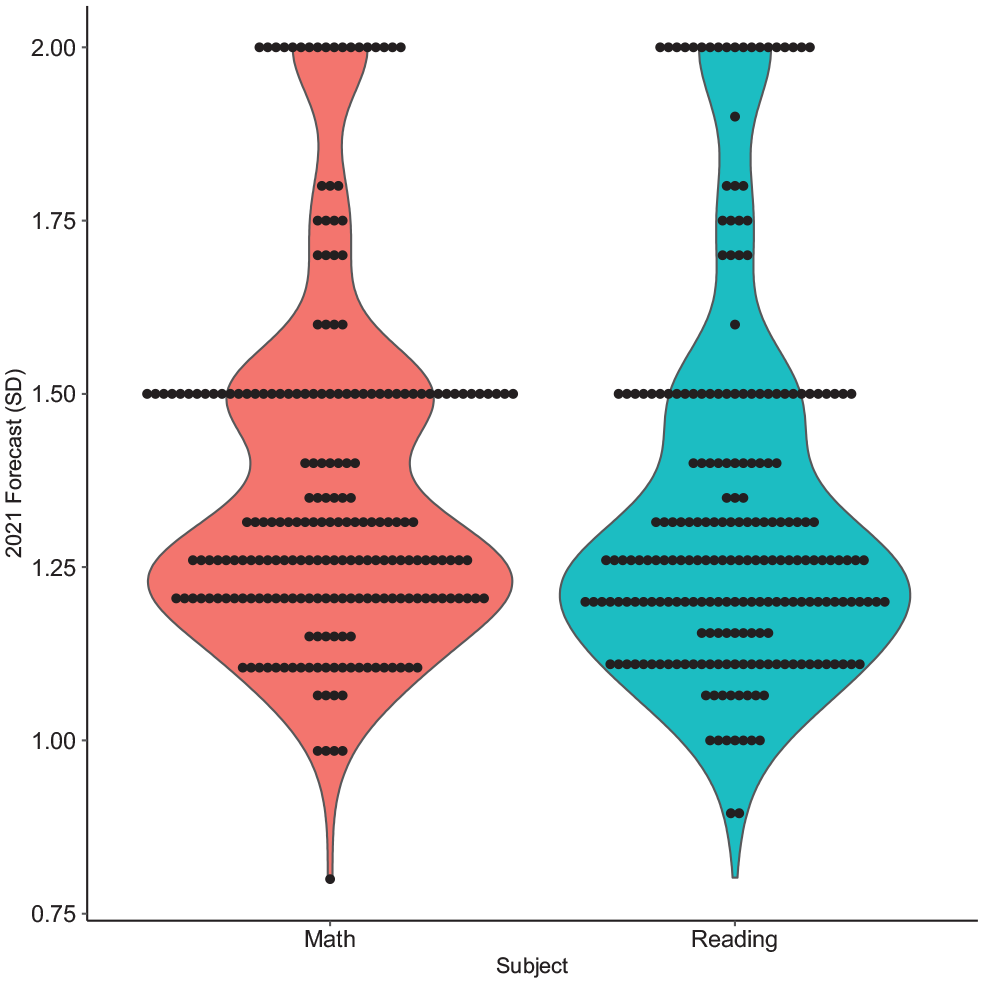
Distributions of 2021 forecasts.
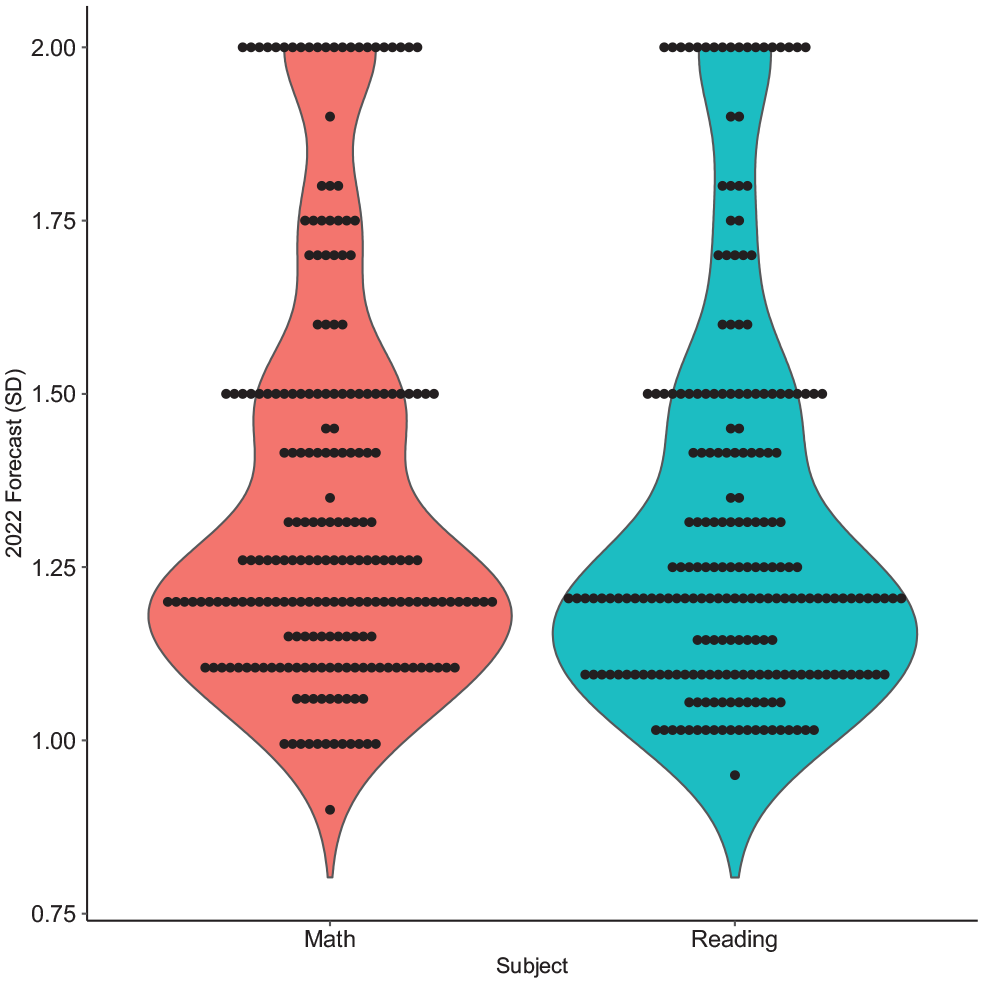
Distributions of 2022 forecasts.
Perhaps our most notable finding is the degree of consensus among researchers that gaps will grow between prepandemic months and the spring of 2021. Out of 221 respondents with nonmissing responses for each of the four forecasts, no more than two respondents per forecast estimated that gaps would decline (i.e., be smaller than 1 SD). No more than seven estimated that a gap in 2021 would be equal to 1, and no more than 18 estimated that a gap in 2022 would revert to its prepandemic assumed value of 1.0 SD. All other forecasts were greater than 1 and varied widely.
Figure 3 shows the distributions of differences in forecasts between 2021 and 2022. The y-axis is scaled to indicate fade out, that is, shrinking gaps between the springs of 2021 and 2022. Differences were roughly centered on zero, indicating that, on average, researchers did not expect the pandemic-related increases in achievement gaps to change across the 2021–2022 school year. However, more forecast a smaller gap in 2022 than in 2021 (48% of respondents for math and 45% for reading) than predicted a larger gap (30% and 27% of respondents for math and reading) or no change at all (22% and 28% of respondents for math and reading). Thus, researchers showed substantial heterogeneity in their forecasts of the nature of changes in gaps between 2021 and 2022.
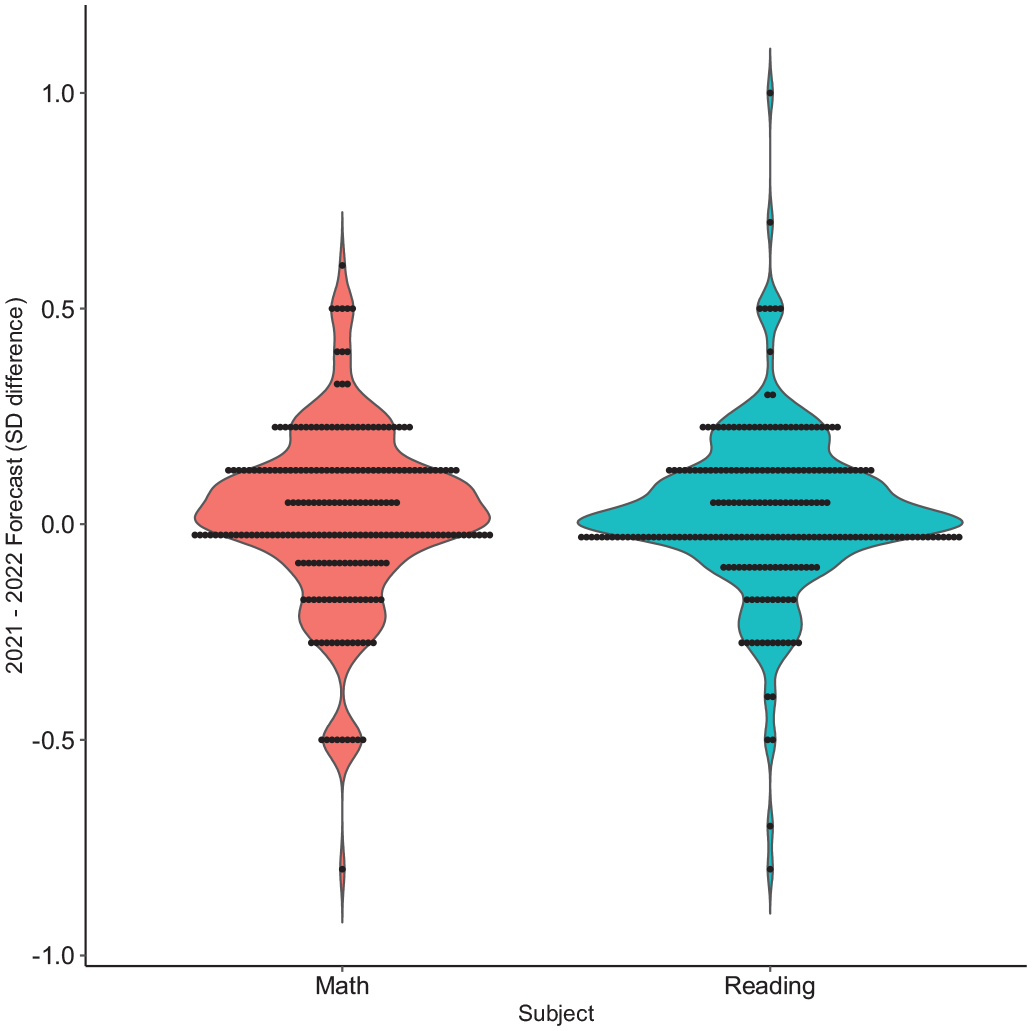
Distributions of fadeout forecasts.
We gauged the statistical significance of some of these changes by regressing forecasts on subject and year in a linear mixed-effects model, with observations nested within participants. Forecasts of gap growth were significantly smaller for reading than math (b = −.036, p = .0002), and smaller in 2022 than in 2021 (b = −.021, p = .028), although the sizes of both of these differences were small relative to the median forecasted gap growth values of .20 to .30.
Forecasts of means by subgroup are displayed in Figure 4. Estimates were smaller for researchers with training in economics or who selected the “other” response option, with larger estimates for researchers with training in psychology, education, or public policy. Differences by K–12 teaching status and having a school-age child at home were small.
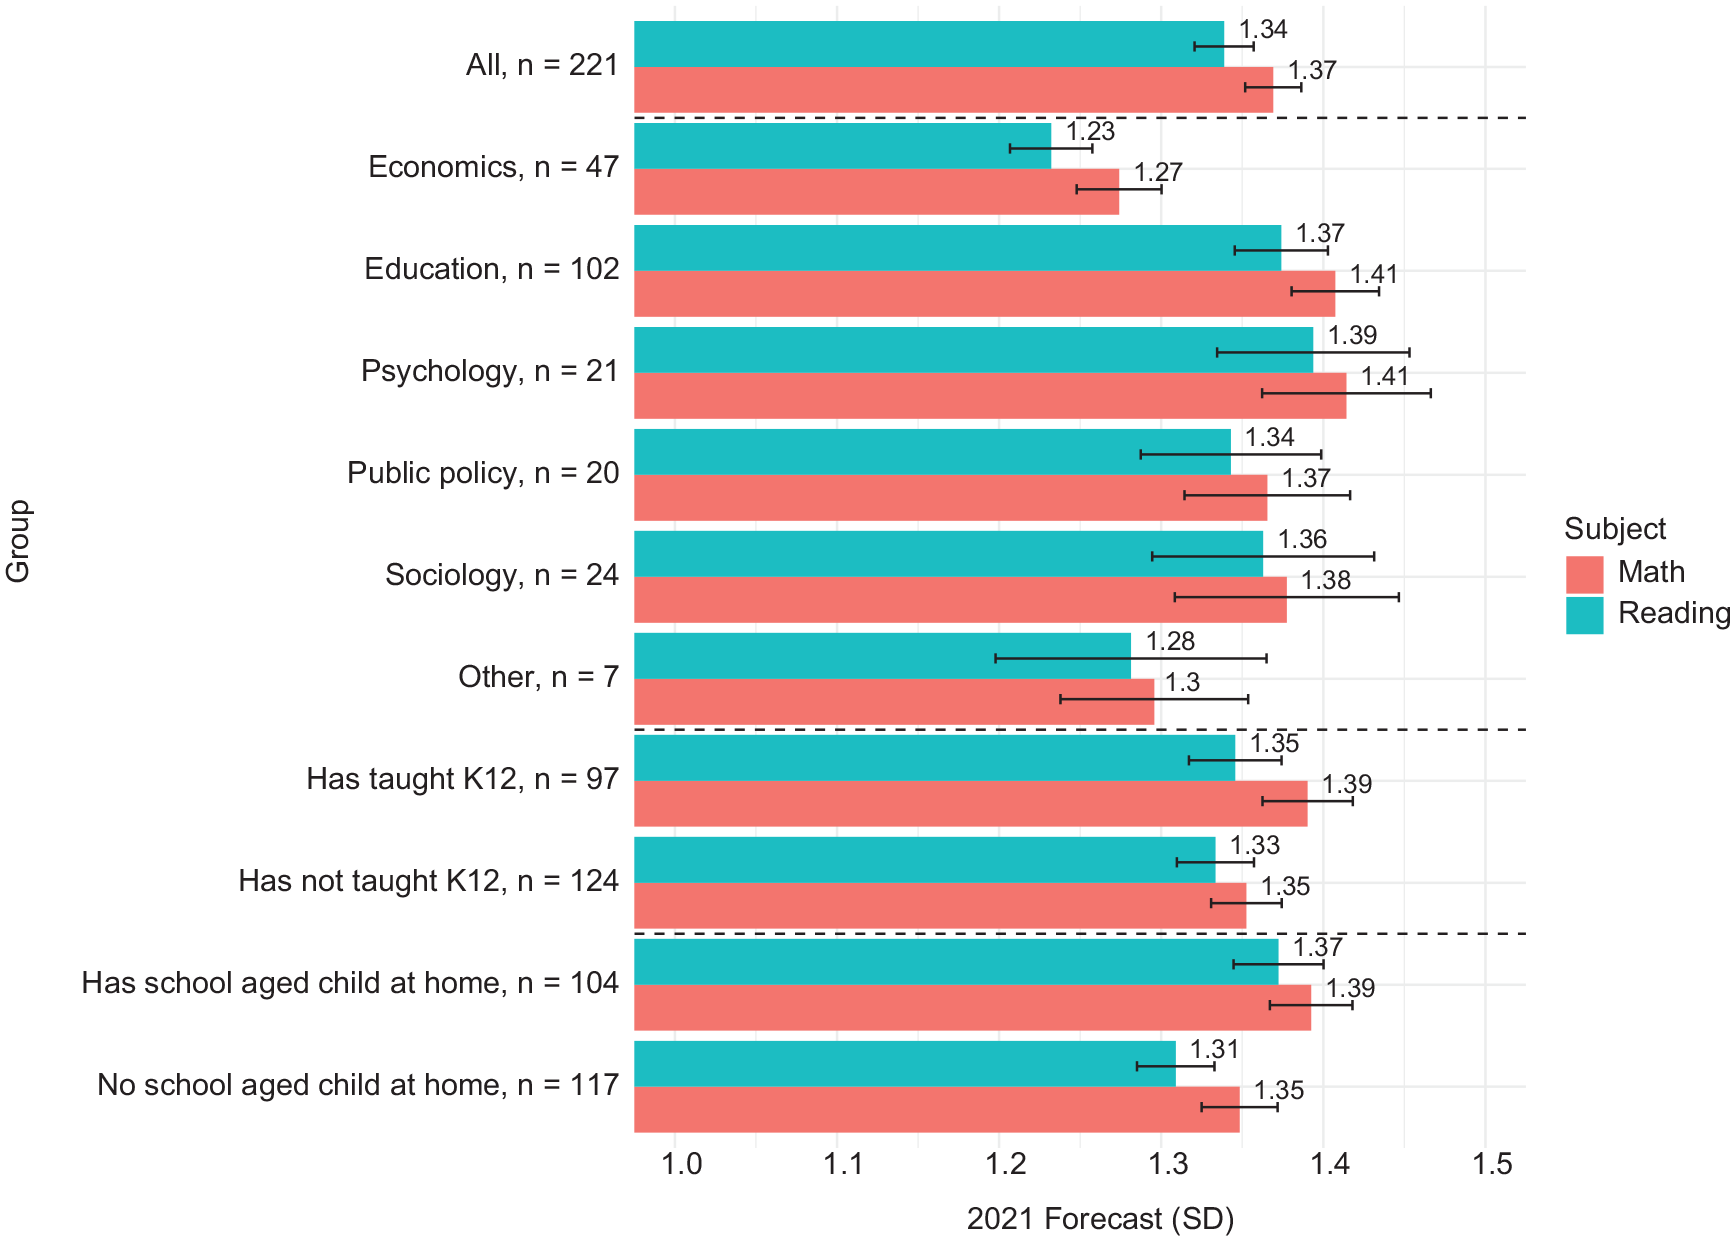
Estimated 2021 gaps by respondent subgroup.
To test whether forecasts differed by discipline, having been a K–12 teacher, or having school-age children at home, we added each of these factors, one by one, to the linear mixed-effects model with year and subject as the other regressors. Likelihood ratio tests indicated that forecasts differed significantly by discipline, χ2(5) = 13.6, p = .019 but not by K–12 teaching experience, χ2(1) = .5, p = .50, or having a school-age child at home, χ2(1) = 1.1, p = .30.
A number of our respondents provided ideas in the “Comment” field of the survey. Some thought that the results would differ across elementary school grades and between elementary and middle school grades. Of the 15 respondents who mentioned age as a potential moderator, 10 expected gaps to grow more among younger children, one thought gaps would grow more among older children, and four did not specify a direction of the moderating effect of age. Some respondents speculated that the results would depend on the nature of distance learning, state policies around schooling, or by race/ethnicity, urbanicity, and other demographic characteristics. Some indicated that parent involvement would be an important factor in this context. Some participants explained that they expected math gaps to grow more than reading gaps because home activities are more likely to substitute for reading instruction than for math instruction. Some wished that we had asked about changes in socioemotional functioning. We agree with the thrust of many of these comments but worried that asking more than seven questions would adversely affect our response rates. We welcome similar surveys by other researchers.
Discussion
Education researchers predict that COVID-19 will markedly increase achievement gaps between children from low-income families and those from higher-income families. Expressed in terms of typical patterns of learning for third graders, the lost ground amounts to children from low-income families falling an extra half-year behind those from more affluent families in both math and reading. Moreover, the researchers doubt that the increased gaps will decline significantly in the course of the 2021–2022 school year. If not reversed, these trends will seriously jeopardize the ability of schools to improve the life chances of children growing up in low-income families and further increase the high level of income inequality in the United States.
Implications for Understanding Education Researchers
Results shed light on aspects of researchers’ mental models of factors influencing children’s academic achievement and how these factors might be affected by the pandemic. Respondents’ median and modal estimates of the differences in gaps between 2021 and 2022 were close to 0. This is somewhat striking given the smaller levels of persistence produced by some other shocks on children’s academic achievement test scores (including having an effective teacher; Jacob et al., 2010). This indicates that many researchers believe that either changes will be of the kind that are difficult to remediate (perhaps, e.g., because they affect children’s home lives as well as their schooling experiences or that the education system will struggle to adapt to students’ needs (e.g., because school closures will happen beyond 2020–2021 school year or because schools will not receive the resources they need to compensate for socioeconomically disadvantaged students’ diminished learning opportunities during the pandemic). The high level of variation in differences in researchers’ forecasts between 2021 and 2022 is consistent with the possibility that some researchers think the effects of the pandemic will be short-lived, whereas others believe they will grow more between 2021 and 2022. Of course, longer-term forecasts are more vulnerable to unanticipated future challenges or opportunities than shorter-term forecasts, but this pattern certainly raises the possibility that schools will need additional resources to mitigate effects of the pandemic on learning extending beyond the 2021–2022 school year.
Forecasts from education researchers are, to the best of our knowledge, rarely systematically collected or published. Because education is an applied field with important policy implications, we view forecasts as an important (although certainly incomplete) way to judge researchers’ skill at making useful judgments. We encourage future work to use these and other researcher forecasts as benchmarks against which to compare estimated effect sizes. In addition to serving as ongoing checks on researchers’ judgments and mental models, we hope these comparisons will benefit researchers themselves. First, researchers can improve the calibration of their mental models. Making concrete prospective forecasts may make differences between forecasts and realized outcomes more salient to researchers when they occur, and surprise has been shown to improve memory (Fazio & Marsh, 2009). Second, comparing forecasts to realized outcomes may help identify patterns of characteristics (e.g., expertise, subfield, or cognitive strategies) that might make forecasts more accurate, which may be useful for training purposes.
Practical Implications
Here, we assume that researchers’ forecasts are at least directionally correct, based on a combination of their strong consensus and existing relevant evidence, the strongest of which emerged after the survey was conducted. As long as the risk of COVID-19 infection remains high, school districts have limited options for promoting in-class instruction and other methods of addressing the problem of growing achievement gaps. So it is prudent to begin to devise strategies for meeting the learning needs of children when in-class instruction can resume on a large scale—one hopes in the fall of 2021. If, as predicted by the education researchers who responded to our survey, achievement gaps indeed increase by between one fifth and one third in the course of the 2020–2021 school year, many teachers will face the challenge of teaching students whose learning needs are much more heterogeneous than prior to the pandemic.
Although there are no silver bullets to reverse the increase in income-related achievement gaps, evidence from a variety of sources shows that thoughtful investments will make a difference. Moreover, educators can learn from a growing number of resources about promising investment strategies. For example, Kraft and Falken (2020) provide an evidence-based blueprint for scaling effective tutoring strategies. Guryan et al. (2020) show that a particular mentoring strategy improved attendance and reduced course failures among high-risk students in Chicago middle schools. The U.S. Department of Education’s Institute of Education Sciences commissioned the country’s Regional Education Labs to produce a series of evidence-based resources and guidance about teaching and learning in a remote environment. The IES-funded What Works Clearinghouse (Sahni et al., 2021) provides a careful review of the evidence from research on the effectiveness of distance learning. Reich et al. (2020) summarize guidance from state education agencies about ways to maximize the effectiveness of remote learning strategies. Reimers and Schleicher (2020) and Reimers et al. (2020) provide descriptions of strategies other countries have adopted to reverse learning losses resulting from the pandemic.
Of course, it will be important to study the effectiveness of specific strategies that states and school districts implement to reverse pandemic-related increases in achievement gaps. IES has signaled that this will be a priority for the organization (Schneider & Karg, 2020). However, enough is known about promising strategies to merit significant investment in reversing the education consequences of COVID-19, especially for socioeconomically disadvantaged students. Although the costs will be significant, the costs of not making these investments could be far larger and long-lasting.
Supplemental Material
sj-pdf-1-edr-10.3102_0013189X211011237 – Supplemental material for Achievement Gaps in the Wake of COVID-19
Supplemental material, sj-pdf-1-edr-10.3102_0013189X211011237 for Achievement Gaps in the Wake of COVID-19 by Drew H. Bailey, Greg J. Duncan, Richard J. Murnane and Natalie Au Yeung in Educational Researcher
Footnotes
Notes
Authors
References
Supplementary Material
Please find the following supplemental material available below.
For Open Access articles published under a Creative Commons License, all supplemental material carries the same license as the article it is associated with.
For non-Open Access articles published, all supplemental material carries a non-exclusive license, and permission requests for re-use of supplemental material or any part of supplemental material shall be sent directly to the copyright owner as specified in the copyright notice associated with the article.