



Abstract
Crowdfunding platforms direct millions of dollars annually to schools across the country, but the scholarly and policy communities have a limited understanding of their operations. In this paper we leverage data from DonorsChoose and the Common Core of Data to examine the characteristics of schools whose teachers do and do not submit projects to DonorsChoose, the subject areas and resource requests of these projects, and the characteristics of projects that achieve full funding. We find that teachers in schools serving disadvantaged student populations in the lowest-spending states are most likely to post projects on DonorsChoose. Despite accounting for a majority of submitted projects, math and reading projects are less likely to reach full funding than those in other subject areas.
Keywords
America’s education system is rife with resource inequality. These inequalities are apparent across states, with some states spending more than $20,000 for each student they educate while others spend less than $9,000 per pupil (Snyder et al., 2019). They are also present within states, with the highest-spending districts in a state routinely spending two or even three times as much per pupil as their less affluent peers (Kelly, 2020). Such realities regularly lead to scenarios where students in well-off districts have access to state-of-the art technology, while their peers in less affluent districts work with tattered textbooks and struggle to gain access to basic supplies (Palmer, 2018). In the face of these inequalities, and perhaps in response to them, crowdfunding has become an increasingly popular approach that teachers use to acquire classroom supplies. Indeed, according to DonorsChoose—the largest education-focused crowdfunding platform in the United States—over the past two decades, teachers at more than 80% of all U.S. public schools have posted a project on their platform, resulting in more than 4.3 million individual donors contributing almost $1 billion to fund teachers’ asks (DonorsChoose, n.d.).
The fact that crowdfunding directs hundreds of millions of dollars annually to classrooms across the country raises a number of important questions that, to date, have largely flown under the scholarly radar. What types of schools post projects to crowdfunding sites like DonorsChoose? What types of materials do they solicit in those posts? Which sorts of projects are most likely to be fully funded? In what schools? In this article, we address such questions by compiling and analyzing unique data containing a wide range of information on the universe of projects submitted to DonorsChoose, combined with state- and school-level characteristics collected from the National Center for Education Statistics’ (NCES) Common Core of Data (CCD). The results of these analyses have important equity implications. Most notably, they will provide insight into whether crowdfunding works to mitigate or exacerbate the funding inequities produced by states’ formal financing systems.
Our analyses return several interesting findings. First, looking across states, we show that the proportion of schools submitting a project to DonorsChoose varies substantially, with the proportion of schools submitting a project in a state inversely related to state per-pupil funding levels. Second, at the school level, we show that DonorsChoose projects are more likely to be submitted by teachers in schools with high proportions of economically disadvantaged and non-White students. This pattern holds both across states and within them. Third, most projects aim to supply needs in the most basic subject areas—mathematics and language arts—but these projects have a lower likelihood of being funded compared with projects that request supplies for more peripheral subjects, such as the arts, financial literacy, and nutrition. Additionally, we find that, relative to their more advantaged peers, schools enrolling an economically disadvantaged student body are more likely to have inexpensive projects funded but less likely to see pricier projects amass donations. Together, these results have a number of important implications for the role of crowdfunding in our nation’s education system. Perhaps most importantly, they suggest that most teachers use DonorsChoose, and likely crowdfunding more generally, in a manner designed to alleviate existing financial and resource inequities.
(Crowd)Funding in U.S. Public Education
School Finance in the United States
Like many issues in public education, funding falls almost exclusively under the purview of the states. Their control on this issue stems from the U.S. Constitution not specifying a fundamental right to education, combined with the Tenth Amendment, which reserves powers not explicitly delegated to the federal government for the states. As with most issues where states exercise significant control, this arrangement results in substantial variability in average funding levels across states. Indeed, as alluded to above, the lowest- and highest-spending states—Utah and New York, respectively—are separated by more than $12,000 on a per-pupil basis (Chingos & Blagg, 2017).
Along with differences in average per-pupil spending levels, states also vary in how they elect to allocate dollars across the districts within their borders. Historically, most states designed their finance systems to rely on property taxes in order to fund local districts. This design choice resulted in affluent districts—specifically those with high levels of property wealth—spending more to educate their students, than less affluent districts, even if the low-wealth districts taxed their property at higher rates than high-wealth districts. These prima facie inequities were exacerbated by the reality that disadvantaged students typically require more resources than their affluent peers to achieve a given outcome level (Odden et al., 2008). Over time, a number of states redesigned their finance systems to increase funding allocations to less affluent districts (Jackson et al., 2016), but these redesigns have not eliminated concerns that many districts and, ultimately, teachers lack the resources they need to effectively educate their students.
From the standpoint of student outcomes, these financial inequities could ultimately be benign if funding was unrelated to student achievement or attainment, at least above some minimum funding threshold that states generally exceed. Such a view held significant sway in portions of the scholarly and policymaking communities throughout the 1980s, 1990s, and even the 2000s. This view was supported by Hanushek’s work (1986, 1997, 2006, 2007) concluding that money does not matter or, at least, it does not matter very much. Recent years, however, have produced a steady stream of studies reaching the conclusion that money does matter. Indeed, analyses that leverage variation evidence from court cases (e.g., Jackson et al., 2016; Candelaria & Shores, 2019), referenda (e.g., Kogan et al., 2017; Abott et al., 2020), and statutory provisions (e.g., Kreisman & Steinberg, 2019; Guryan, 2001; Lee & Polachek, 2018) all conclude that increased funding improved student outcomes (see Jackson, 2020 for a review of this recent work).
Shadow Financing Mechanisms
In addition to formal finance systems, large sums of money make their way to K–12 schools and classrooms through a number of informal financing mechanisms—we highlight four such “shadow” financing mechanisms here. First, philanthropic foundations contribute hundreds of millions of dollars in ways that shape important education policy conversations (Hess & Henig, 2015; Reckhow, 2012; Reckhow & Snyder, 2014). And although these funds make their way to a broad set of schools and districts across the country, they are disproportionately concentrated in those where formal finance systems do not provide the funding needed to meet students’ educational needs. Second, organizations such as PTAs/PTOs (Parent–Teacher Association/Parent–Teacher Organization), booster clubs, and school foundations have forged an increased role for themselves in channeling finances to preferred schools. The number of such organizations has skyrocketed in recent years, growing from 3,475 school-supporting nonprofits in 1995 to 11,453 in 2010 (Nelson & Gazley, 2014). Substantial increases in donations have accompanied such growth, and, in contrast to philanthropic efforts, these fundraising efforts disproportionately benefit schools serving affluent student populations—these organizations provide dollars with many fewer strings attached.
Contributions from teachers themselves represent a third source of educational funding that accumulates outside formal state finance systems. Indeed, data from the NCES’ series of nationally representative teacher surveys regularly indicate that about 95% of teachers spend their own money on supplies for their students, with the average teacher spending almost $500 (NCES, 2016). Teachers’ out-of-pocket expenditures are so common that the tax code contains an explicit deduction for these costs, the Educator Expense Deduction. For teachers in many states—particularly those with low average salaries or those with a high cost of living—a $500 expenditure is acutely felt in the pocketbook.
In light of these significant out-of-pocket expenditures, it is perhaps unsurprising that teachers have increasingly turned to crowdfunding in recent years—our fourth shadow financing mechanism—as a means for obtaining classroom supplies. Crowdfunding has long been used as a financing tool in areas like entertainment (Gamble et al., 2017), journalism (Aitamurto, 2011), and health (Young & Scheinberg, 2017), but it is a relatively recent addition to the education scene. As crowdfunding has become a more popular funding approach among teachers, the number of platforms and strategies has grown. #ClearTheList has emerged as a visible campaign encouraging donors to purchase items on teachers’ Amazon wish lists. AdoptAClassroom.org connects funders with individual teachers whose classrooms need additional materials. For the past 20 years, though, DonorsChoose has consistently been the largest and most popular education crowdfunding platform.
DonorsChoose
Founded in 2000 by Charles Best, then a high school teacher in New York City, DonorsChoose initially only accepted project requests from public school teachers in the state of New York. The platform was so popular among teachers, however, that word quickly spread across the country, and by 2007, DonorsChoose was open to public school teachers in all 50 states. 1 Figure 1 plots the number of projects submitted to DonorsChoose annually from the 2002–2003 school year to 2015–2016 school year. The figure exhibits the steady growth that DonorsChoose has undergone in the two decades since its founding, with the number of projects increasing from 859 in 2002–2003 to 221,306 in 2015–2016. Cumulatively, DonorsChoose has directed nearly $1 billion in donations to fund projects benefiting more than 39 million students in almost 84,000 different schools in all 50 states.
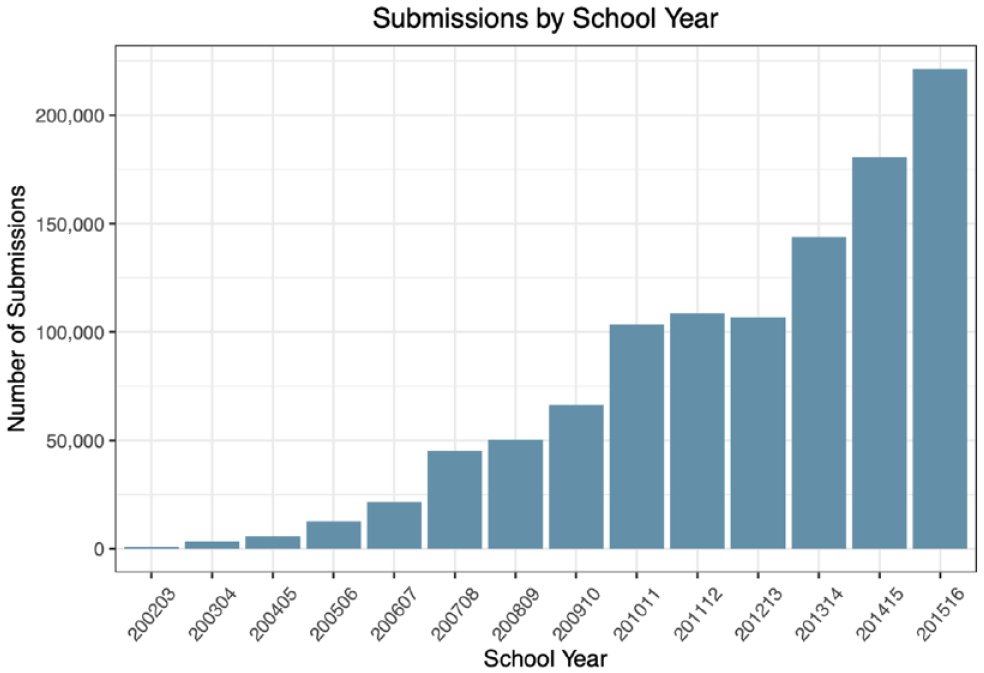
Number of project submissions to DonorsChoose, by school year.
In order to submit a project to DonorsChoose, a teacher must be employed full time at a traditional public school, charter school, or Head Start center in the United States. The submission process requires teachers to develop a list of requested items and write a short description of their classroom and its needs. DonorsChoose then reviews the project to ensure that it meets all requirements and, pending approval, posts it on their website, where donors are able to read the description, see what the requested funds will provide, and donate. 2 DonorsChoose uses an all-or-nothing donation system, meaning that if a project is not fully funded within 4 months of posting, any donations it has garnered will be returned to a donor’s account, allowing them to allocate the dollars to a different project. While an all-or-nothing system might seem like a deterrent to teachers interested in posting projects, research on other crowdfunding platforms indicates that these systems tend to reach full funding at a higher rate than those using a keep-it-all model (Cumming et al., 2020), particularly for projects that require more coordination among donors (Wash & Solomon, 2014). When a project reaches its funding goal, DonorsChoose orders the requested supplies and ships them directly to the teacher. This process has resulted in DonorsChoose directing resources to classrooms in every state and in more than half of the public schools throughout the country.
In theory, the emergence of competing platforms, combined with DonorsChoose’s all-or-nothing design, might prompt teachers to crowdfund elsewhere. In practice, though, DonorsChoose continues to retain its position as the top education crowdfunding platform. And although there are undoubtedly multiple reasons for its continued popularity, we highlight two major ones here. First, by virtue of being the first major entrant in the education crowdfunding space, DonorsChoose has developed some degree of “brand loyalty” with a substantial number of teachers, and their familiarity and satisfaction with the platform keeps them coming back. Second, relative to its competitors, DonorsChoose does more to instill confidence in its donor base that their dollars go directly to fund verified classroom needs. For example, DonorsChoose requires projects to be vetted by fellow teachers before they are posted to the platform. They promote their top-notch ratings from agencies like Charity Watch, Charity Navigator, and Guidestar. These efforts attract and retain donors, which, in turn, serves to attract and retain teachers on the platform.
Conceptual Framework
Together, the literatures on formal and informal school finance mechanisms provide a useful framework for considering crowdfunding generally, and DonorsChoose specifically. School finance in the United States is layered with inequality, with formal finance systems producing significant funding disparities both across states and within them. These disparities lead to resource gaps that are sometimes addressed through a series of shadow school finance mechanisms: donations from philanthropic foundations, parent organizations, teachers, and crowdfunding platforms like DonorsChoose. But just as these shadow financing mechanisms are often a product of inequality, they can feed back into the system in a manner that either mitigates or exacerbates inequalities.
These sorts of feedback effects have been recognized and systematically analyzed for most of the shadow financing mechanisms we reference above, including philanthropic gifts (Hess & Henig, 2015; Reckhow, 2012; Reckhow & Snyder, 2014), parent organizations (Good & Nelson, 2020; Nelson & Gazley, 2014), and teachers (Olszewski & Maury, 1997; Spiegelman, 2018). However, crowdfunding, in general, and DonorsChoose, in particular, have largely avoided the type of scrutiny that has been applied to other shadow financing mechanisms, to say nothing of the formal state finance systems. As such, we have a number of open pathways for investigation that can be guided by the framework outlined above. We have little understanding of the characteristics of schools whose teachers post projects to DonorsChoose. We do not know what sorts of materials those projects solicit. It is not clear what types of projects in which kinds of schools are most likely to be fully funded. In the following section, we describe the data we use to provide insight into such questions and, in doing so, gain a better grasp on the degree to which DonorsChoose mitigates or exacerbates inequality.
Data and Sample
We leverage data from two sources to examine patterns of project submission and funding via DonorsChoose. First, we obtained data providing a wide range of information on the universe of projects submitted to DonorsChoose between September 2002 and October 2016. In addition to containing a unique project identifier, these data provide several pieces of information about the school employing the submitting teacher, including its name and the city, state, zip code, county, and school district in which it is located. Importantly, the data also contain the NCES school identifier, which we use as the basis for merging in school characteristics that we describe in greater detail below. Along with this school-level information, the data contain characteristics of the submitting teacher, as well as the project itself. With respect to the submitting teacher, for whom there is a unique teacher identifier, the data detail the teacher’s salutation (Mrs., Ms., Mr., etc.) and contain indicators for whether the teacher was part of Teach for America or the New York City Teaching Fellows program.
Regarding the submitted project, the data record the date the project was posted, the grade level at which the project is targeted, the total dollar value requested, the number of students who would directly benefit from the project, the total number of donations the project received, the number of unique donors contributing to the project, the eligibility of the project for various donation matching programs, whether the project reached its funding goal, and the type of resource the project requests. With regard to resource requests, the data classify each project into one of six categories: books, supplies, technology, trips, visitors, and other requests. Perhaps most important for the purposes of our analyses, however, is the information on the substantive focus of the project. DonorsChoose classifies each project into one of 28 subject areas, and the data record the primary subject area of each project. For our analyses below, we collapse the 28 subject areas into five groups of project topics: (1) math and reading, (2) specific student groups (e.g., English learners, special education), (3) science and the humanities, (4) arts, health, and languages, (5) extracurricular. 3
Second, we draw on a broad set of school-level information collected from NCES’ CCD. Specifically, we collected information on schools’ enrollment, racial/ethnic composition, percentage of students eligible for subsidized lunches, and pupil–teacher ratio. At the state level, we gathered finance information, specifically total per-pupil revenues from federal, state, and local sources.
We use these two data sources to construct two separate datasets that we draw on in our analyses below. First, we create a school-level dataset consisting of the universe of U.S. public schools in 2015–2016. This dataset, which we refer to as our “school dataset,” contains the school- and state-level information collected from the CCD described above, along with an indicator flagging schools whose teachers submitted at least one project to DonorsChoose. Second, we create a project-level dataset consisting of the universe of projects submitted to DonorsChoose in 2015–2016. This dataset, which we refer to as our “project dataset,” contains the project information outlined earlier along with characteristics of the submitting school collected from the CCD. Supplemental Table A1 in the appendix (available on the journal website) presents summary statistics for each of these datasets. The top panel presents statistics for the school dataset, while the bottom panel presents information for the project dataset. The table indicates that in 2015–2016 the average school enrolled a student body in which about 47% of students were non-White and 54% were eligible for subsidized lunch. The average project, however, was submitted by a teacher in a school where about 64% of students were non-White and 66% were eligible for subsidized lunch. The average project cost was just less than $700 and was projected to benefit 93 students.
In Which Schools Do Teachers Submit Projects to DonorsChoose?
We begin our analysis by using our school dataset to gain basic insight into the proportion of schools whose teachers submitted at least one project to DonorsChoose in 2015–2016, and the variation in submissions across states. This data show that a full 30% of schools posted at least one project on DonorsChoose in 2015–2016. This overall number, however, masks considerable variation across states. As we show in Figure 2, more than half of schools in Hawaii (67%), South Carolina (63%), and North Carolina (52%) submitted projects to DonorsChoose, while just 10% of schools in Wyoming and Nebraska solicited donations via the crowdfunding platform. Submission rates in other states fall in between.
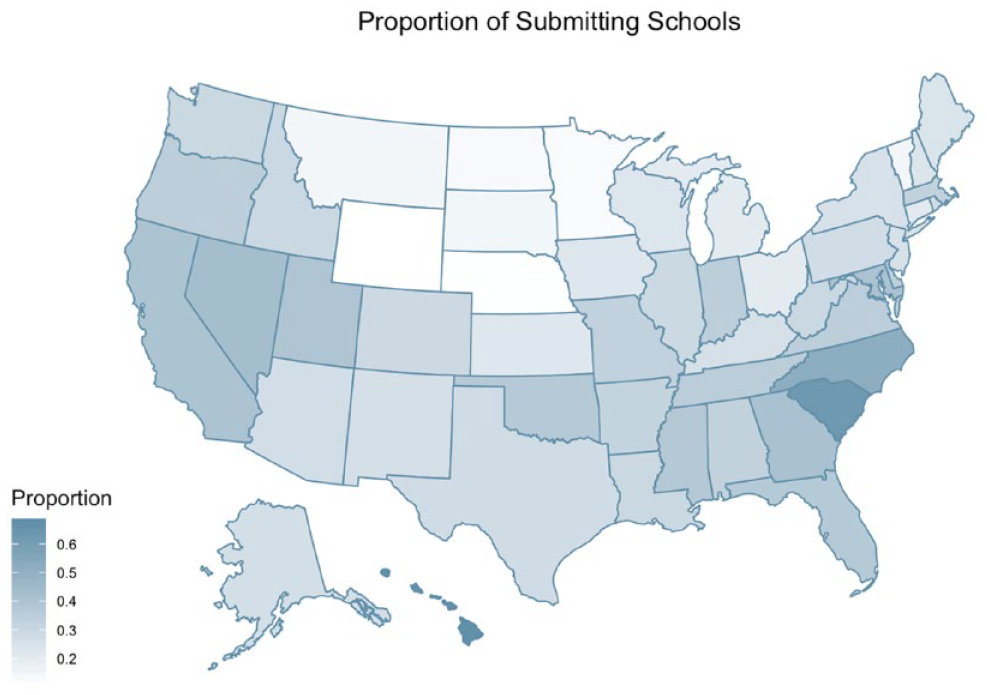
Proportion of schools submitting a project to DonorsChoose, by state.
The substantial cross-state variation depicted in Figure 2 naturally raises the question of whether differences in submission rates relate to state funding levels. Figure 3 provides evidence that such a relationship does indeed exist. The upper left-hand panel plots each state in a two-dimensional space with the proportion of schools submitting a project to DonorsChoose on the y-axis and mean per-pupil revenue on the x-axis; we also fit a regression line through the plot. 4 The figure makes clear that a significantly greater proportion of schools in states with below-average per-pupil revenues submit a project to DonorsChoose, compared with states with higher average revenues. Specifically, the regression results indicate that the predicted submission rates in the lowest-revenue states are 15 percentage points lower than in the highest-revenue states, 35% versus 20%.
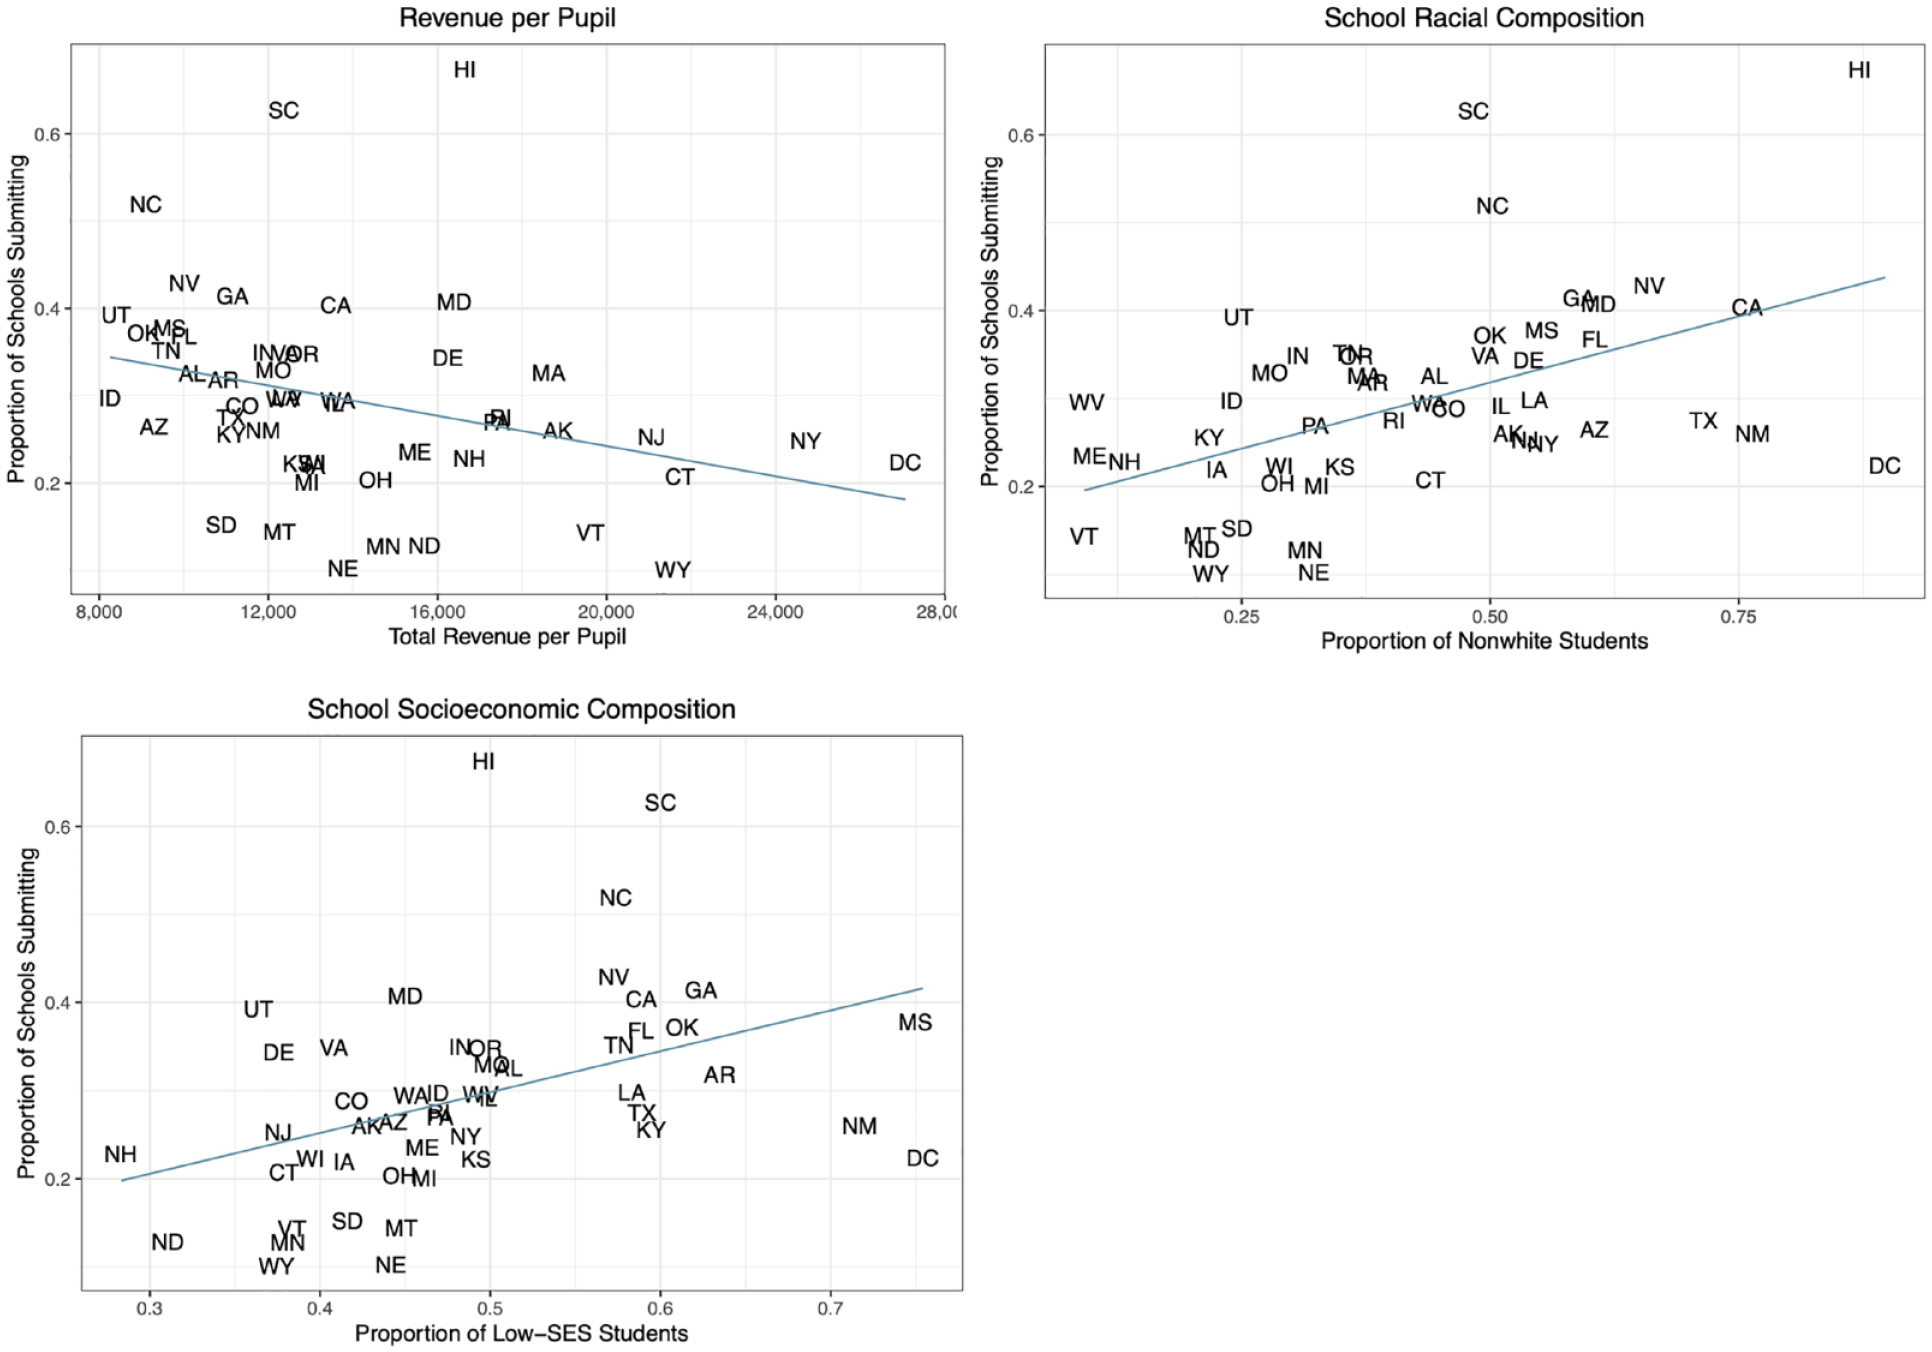
Scatterplot of proportion of schools in each state submitting a project to DonorsChoose and total revenue per pupil (top left panel), school racial composition (right panel), and socioeconomic composition (bottom left panel).
With such a clear relationship between state funding levels and the proportion of schools with teachers submitting projects, it seems likely that other state-level measures of student disadvantage, such as the percentage of students eligible for subsidized lunches and the percentage of students from historically marginalized racial or ethnic groups, might also be related to submissions. The other two panels of Figure 3 show that this is indeed the case. The regression line in the right-hand panel of the figure demonstrates that about 20% of schools in states with the lowest percentage of non-White students were predicted to submit a DonorsChoose project in 2015–2016, a number more than 25 percentage points lower than predicted submission in states with the largest non-White populations. The lower left-hand panel of Figure 3 exhibits a similarly sized disparity in submission rates between states with the lowest and highest percentages of students eligible for subsidized lunch.
Having demonstrated substantial variation across states in DonorsChoose submission rates—and that this variation relates to state funding levels, racial composition, and socioeconomic makeup—we next assess whether we observe similar within-state patterns. That is, we examine whether, within a given state, schools with relatively large disadvantaged student populations are more likely to submit DonorsChoose projects than schools with more advantaged student populations. To perform this analysis, we again draw on our schools dataset and estimate a regression of the form:

where D indicates that school i in state s submitted a project to DonorsChoose in 2015–2016, X represents a school characteristic,
Supplemental Table A3 in the appendix (available on the journal website) makes clear that the same dynamics that play out across states also operate within states. The results indicate that, even conditional on a state fixed effect, a school composed entirely of non-White students is nearly 30 percentage points more likely to submit a project to DonorsChoose, relative to a school with an all-White enrollment. Similarly, the probability of a DonorsChoose submission increases by nearly 25 percentage points when moving from a school where no students are eligible for subsidized lunch to one where all students are eligible. When included together, both measures remain positive and significant, but it is clear that the proportion of non-White students is the primary driver of increased submission probability. The coefficient on that measure is .222, compared with a coefficient of .096 for the measure of subsidized lunch eligibility.
Overall, the story emerging from our first question is one where both across- and within-state inequalities relate to the likelihood of schools submitting a project to DonorsChoose. Together, the results illustrate that teachers from a broad swath of schools across the United States request resources through DonorsChoose and that these requests disproportionately come from teachers at schools serving historically disadvantaged student populations in the least-resourced states.
What Types of Projects Do Teachers Submit to DonorsChoose?
Having gained insight into the characteristics of schools where teachers are more and less likely to submit projects to DonorsChoose, we next turn to examining the substance of the projects that teachers submit. This analysis is motivated by the question of whether teachers are using DonorsChoose to obtain materials in core academic subjects—materials that should arguably be obtained using dollars allocated by a state’s funding system—or whether teachers use DonorsChoose to obtain materials in more peripheral subjects.
We begin this analysis by simply plotting the distribution of submissions across the five project categories delineated earlier: (1) math and reading, (2) specific student groups, (3) science and the humanities, (4) arts, health, and languages, (5) extracurricular. Supplemental Figure A1 in the appendix (available on the journal website) makes clear that the majority of submitted projects—54%—request materials for math and reading; this high submission rate is consistent with the fact that most schools spend a significant portion of the school day on math and reading (Hamilton et al., 2007). The other 46% of submissions are approximately evenly split across the other four categories, with slightly more requests in the area of science and the humanities and slightly fewer requests in the extracurricular field. Further analysis reveals that these submission patterns are broadly consistent across states. Together, these results suggest that teachers around the country primarily use DonorsChoose in an effort to enhance students’ learning in core academic subjects.
To gain additional insight into the projects that teachers submit to DonorsChoose, we next plot the distribution of requested resources—books, technology, trips, visitors, supplies, or other resources—for each of the five project categories. Supplemental Figure A2 in the appendix (available on the journal website) shows that a plurality of math and reading projects request technological resources, with supplies and books the second and third most requested resources, respectively. Supplies are the modal resource request in each of the other four project categories, but technology requests are quite common. Relatively few projects request trips or visitors. And, perhaps surprisingly, books are a relatively uncommon request outside projects with a math or reading focus.
Although Supplemental Figures A1 and A2 (available on the journal website) convey important information about the projects submitted to DonorsChoose, they shed little light on whether the focus of submitted projects varies across schools with different characteristics. Indeed, the results presented thus far point toward a scenario where schools serving historically disadvantaged student populations are even more likely than the average school to submit projects requesting materials in core academic subjects. To assess this proposition, we draw on our schools dataset and construct a series of variables indicating whether a school submitted a project in each of the five project categories. We then specify these indicators as the outcome in a series of regressions of the form:

where school i in state s submitting a project in category C is a function of a school characteristic, X, and a state fixed effect. As in our analyses above, we estimate two variants of this model via OLS, one where X represents the proportion of students from a historically marginalized racial/ethnic group and another where it represents the proportion of students eligible for subsidized lunch. Figure 4 presents the substantive takeaways from estimating equation (2).
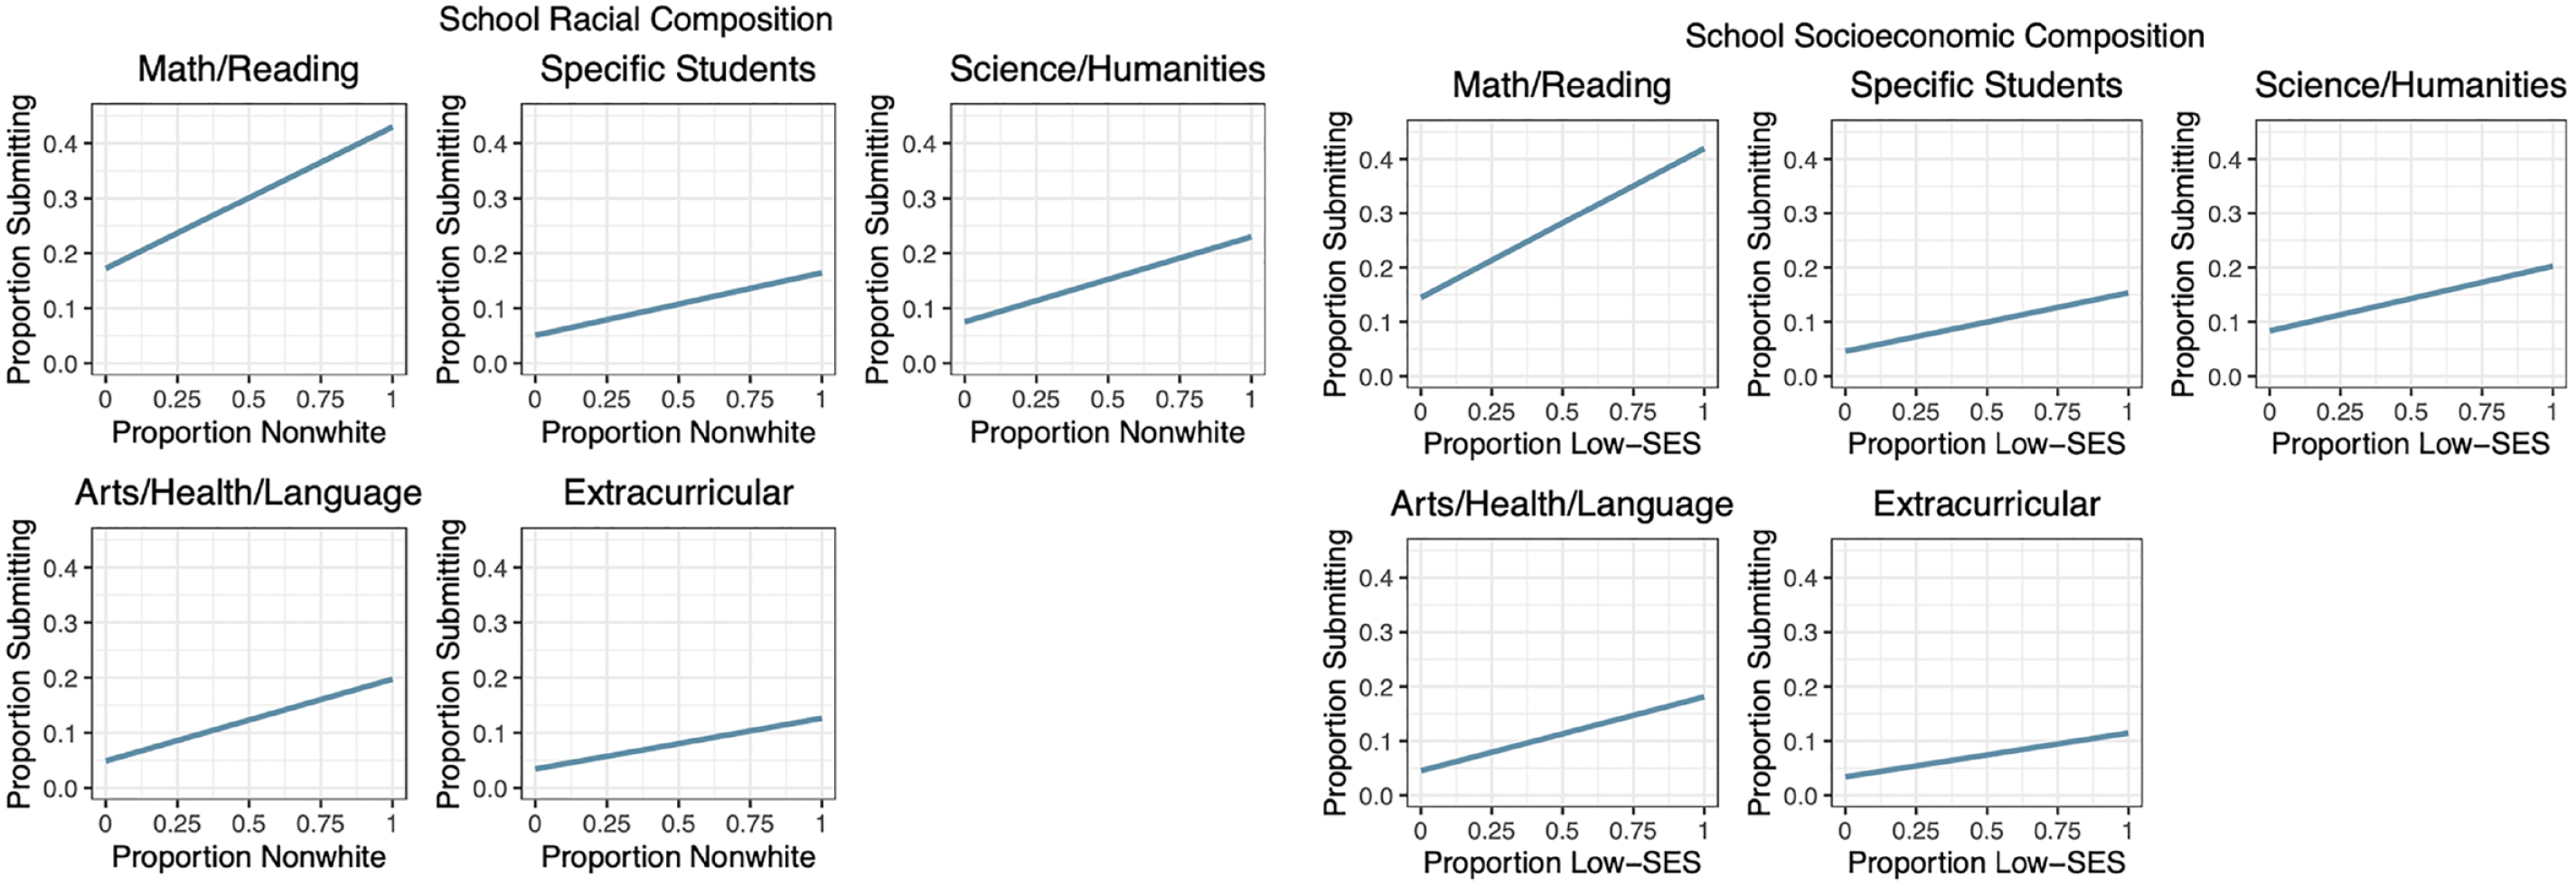
Predicted proportion of schools submitting a project to DonorsChoose in each subject category by school racial composition (left panel) and socioeconomic composition (right panel).
Consistent with the results in the previous section, all coefficients on the variables measuring schools’ disadvantaged student population are positive and significant. Notably, however, the slopes in the math and reading project category are much larger than their analogs in the other four project areas. To illustrate, the results indicate that a school enrolling an entirely non-White student body is more than 25 percentage points more likely to have submitted a DonorsChoose project requesting math and reading materials than a school with a completely White student body. For the other four project areas, though, the estimated differences in submission rates between entirely White and completely non-White students are only 10 to 14 percentage points. We see a similar dynamic play out with socioeconomic status, where a school in which the entire student body is eligible for subsidized lunch is 24 percentage points more likely to have requested math and reading supplies than a school with no eligible students. The analogous disparities in the other four subject categories are just 7 to 12 percentage points.
Overall, the results presented in this section indicate that DonorsChoose is an important platform for teachers seeking educational materials in core academic subjects, especially for teachers at schools enrolling large proportions of historically disadvantaged student populations. Such findings have important equity implications that we discuss in greater detail in the concluding section of the article.
What Types of Projects Get Funded?
To this point, we have analyzed a number of issues surrounding DonorsChoose project submission. However, a submitted project is by no means guaranteed to be funded. Indeed, only about 70% of projects submitted in 2015–2016 amassed the donations required for full funding, a fact that raises questions about the characteristics of projects that do and do not achieve this threshold. We use our project dataset to investigate such questions in three main ways. First, we assess whether a project’s subject category relates to the likelihood that it achieves full funding. We are particularly interested in whether projects in the area of math and reading, which comprised a majority of all submitted projects in 2015–2016, exhibit a differential likelihood of achieving full funding than projects in the other four subject areas. To address this question, we estimate the following regression:

where we model full funding, F, for project i as a function of the five subject-area indicators, S, and an error term,
Second, we analyze whether the type of resource requested by a project relates to the probability that it reaches full funding. We address this question by estimating a regression similar in structure to Equation (3), with the only difference being that we replace the
Third, we examine whether a school’s demographic characteristics—specifically its’ racial and socioeconomic makeup—are related to the probability that projects submitted by its teachers reach full funding. We again perform this analysis in a regression framework, estimating:

where full funding, F, for project i in school s is a function of a school characteristic, X, and an error term. We estimate two variants of this model via OLS, one where X represents the proportion of students from a historically marginalized racial/ethnic group and another where it represents the proportion of students eligible for subsidized lunch. In addition to estimating this model across the full set of projects, we also estimate it separately for each project cost quartile, allowing us to assess whether the overall relationships hold across the full range of project costs.
Turning to the results, the left-hand panel of Figure 5 shows that projects submitted in the area of math and reading are funded at significantly lower rates than projects in each of the other four areas. To illustrate, the regression results indicate that about 71% of math and reading projects achieve full funding while 73% to 75% of projects in the areas of specific student groups, science and the humanities, and arts, health, and languages are fully funded. The right-hand panel of Figure 5 illustrates that the lower funding rate for math and reading projects is not attributable to different mean prices across the subject categories. Conditioning on price slightly increases the disparity in full funding rates between math and reading projects, and those submitted in other areas.
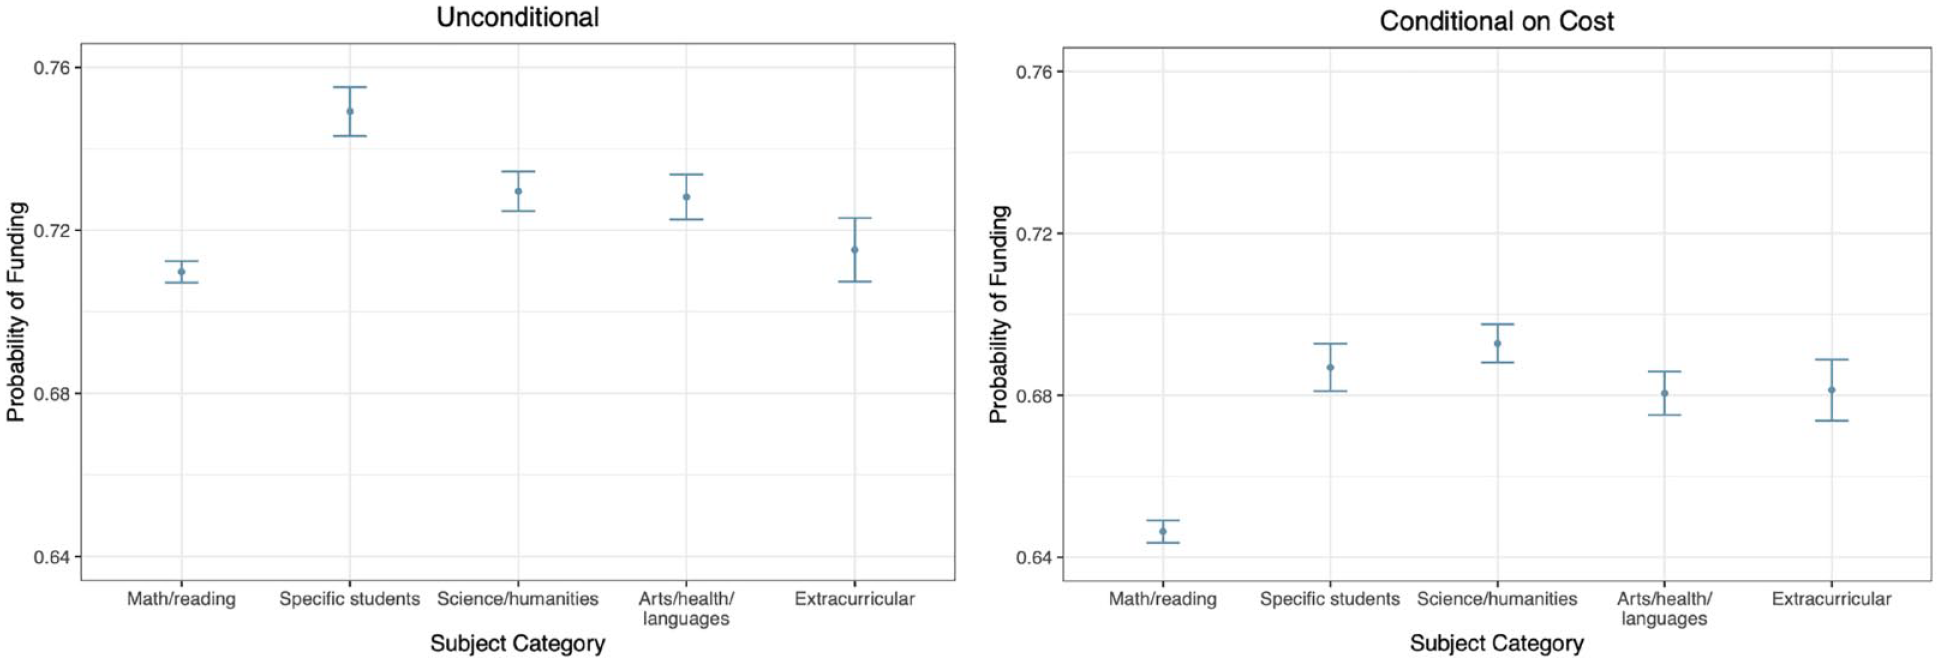
Predicted probability and 95% CI of a project reaching full funding, by subject category and conditioning on project cost.
With regard to the type of requested resource, the left-hand panel of Figure 6 illustrates that projects requesting trips and books are most likely to achieve full funding, with nearly 80% of such requests reaching their financial goal. Projects requesting technology resources, by contrast, are least likely to reach full funding, with only about 65% of such projects achieving that status. The right-hand panel of Figure 6, which presents the probability of reaching full funding for a project of average cost, provides further insight into the relationship between requested resource type and full funding. In particular, the right-hand panel of Figure 6 shows that, for a given cost level, projects requesting visitors and, especially, trips, are the most likely to reach full funding, while technology requests are still least likely to achieve their funding goal. Figure 7 shows that the general patterns seen in Figure 6 play out across each subject category, albeit at slightly different levels. Conditional on cost, projects requesting trips and visitors are most likely to achieve full funding, while those requesting technology, classroom supplies, and other resources are least likely to reach their funding goal; full funding rates for book requests fall in between.
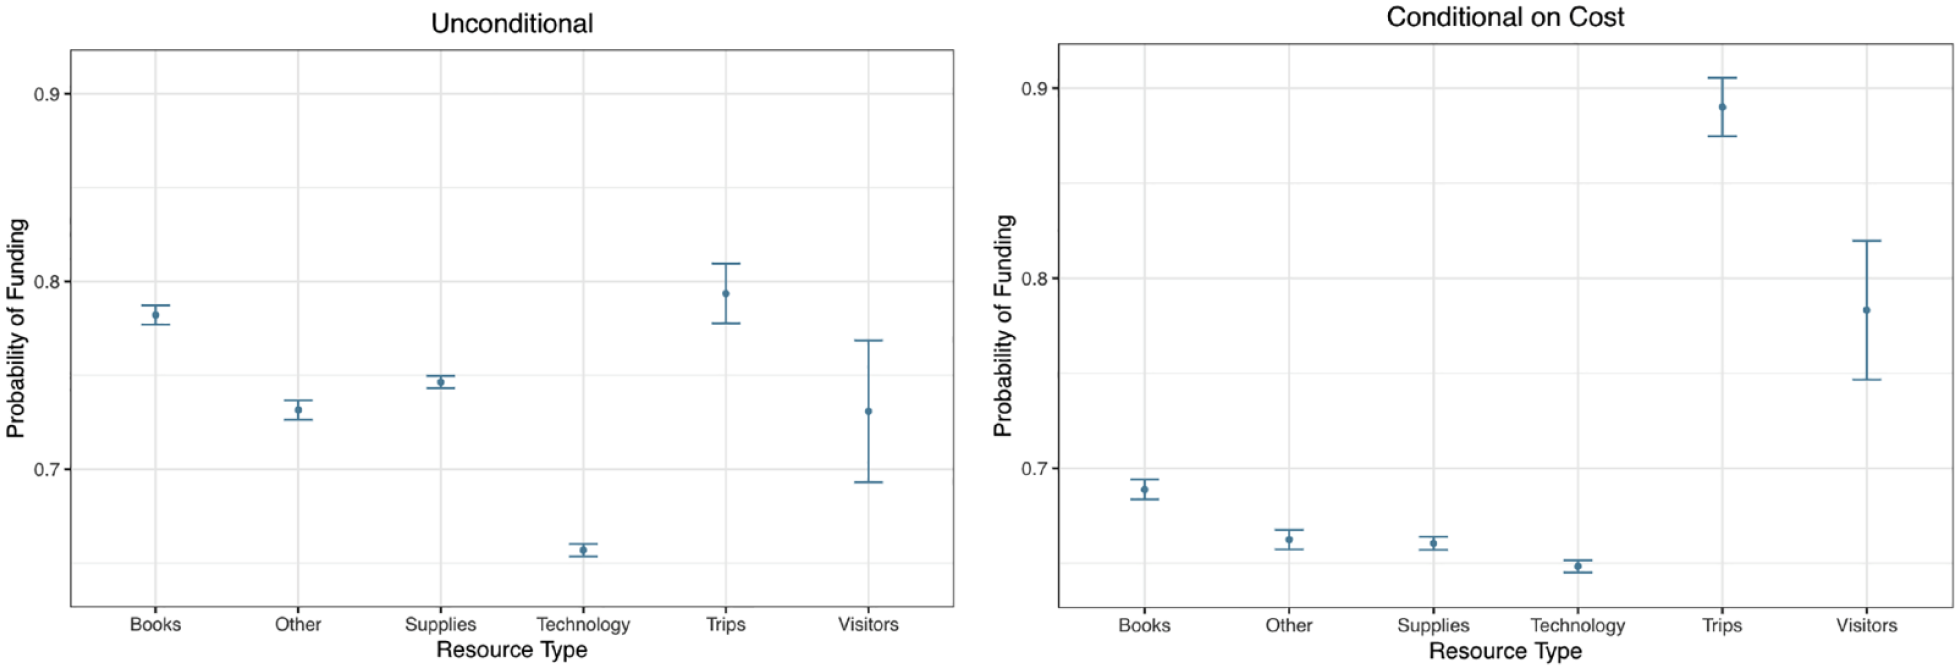
Predicted probability and 95% CI of a project reaching full funding, by type of resource requested and conditioning on project cost.
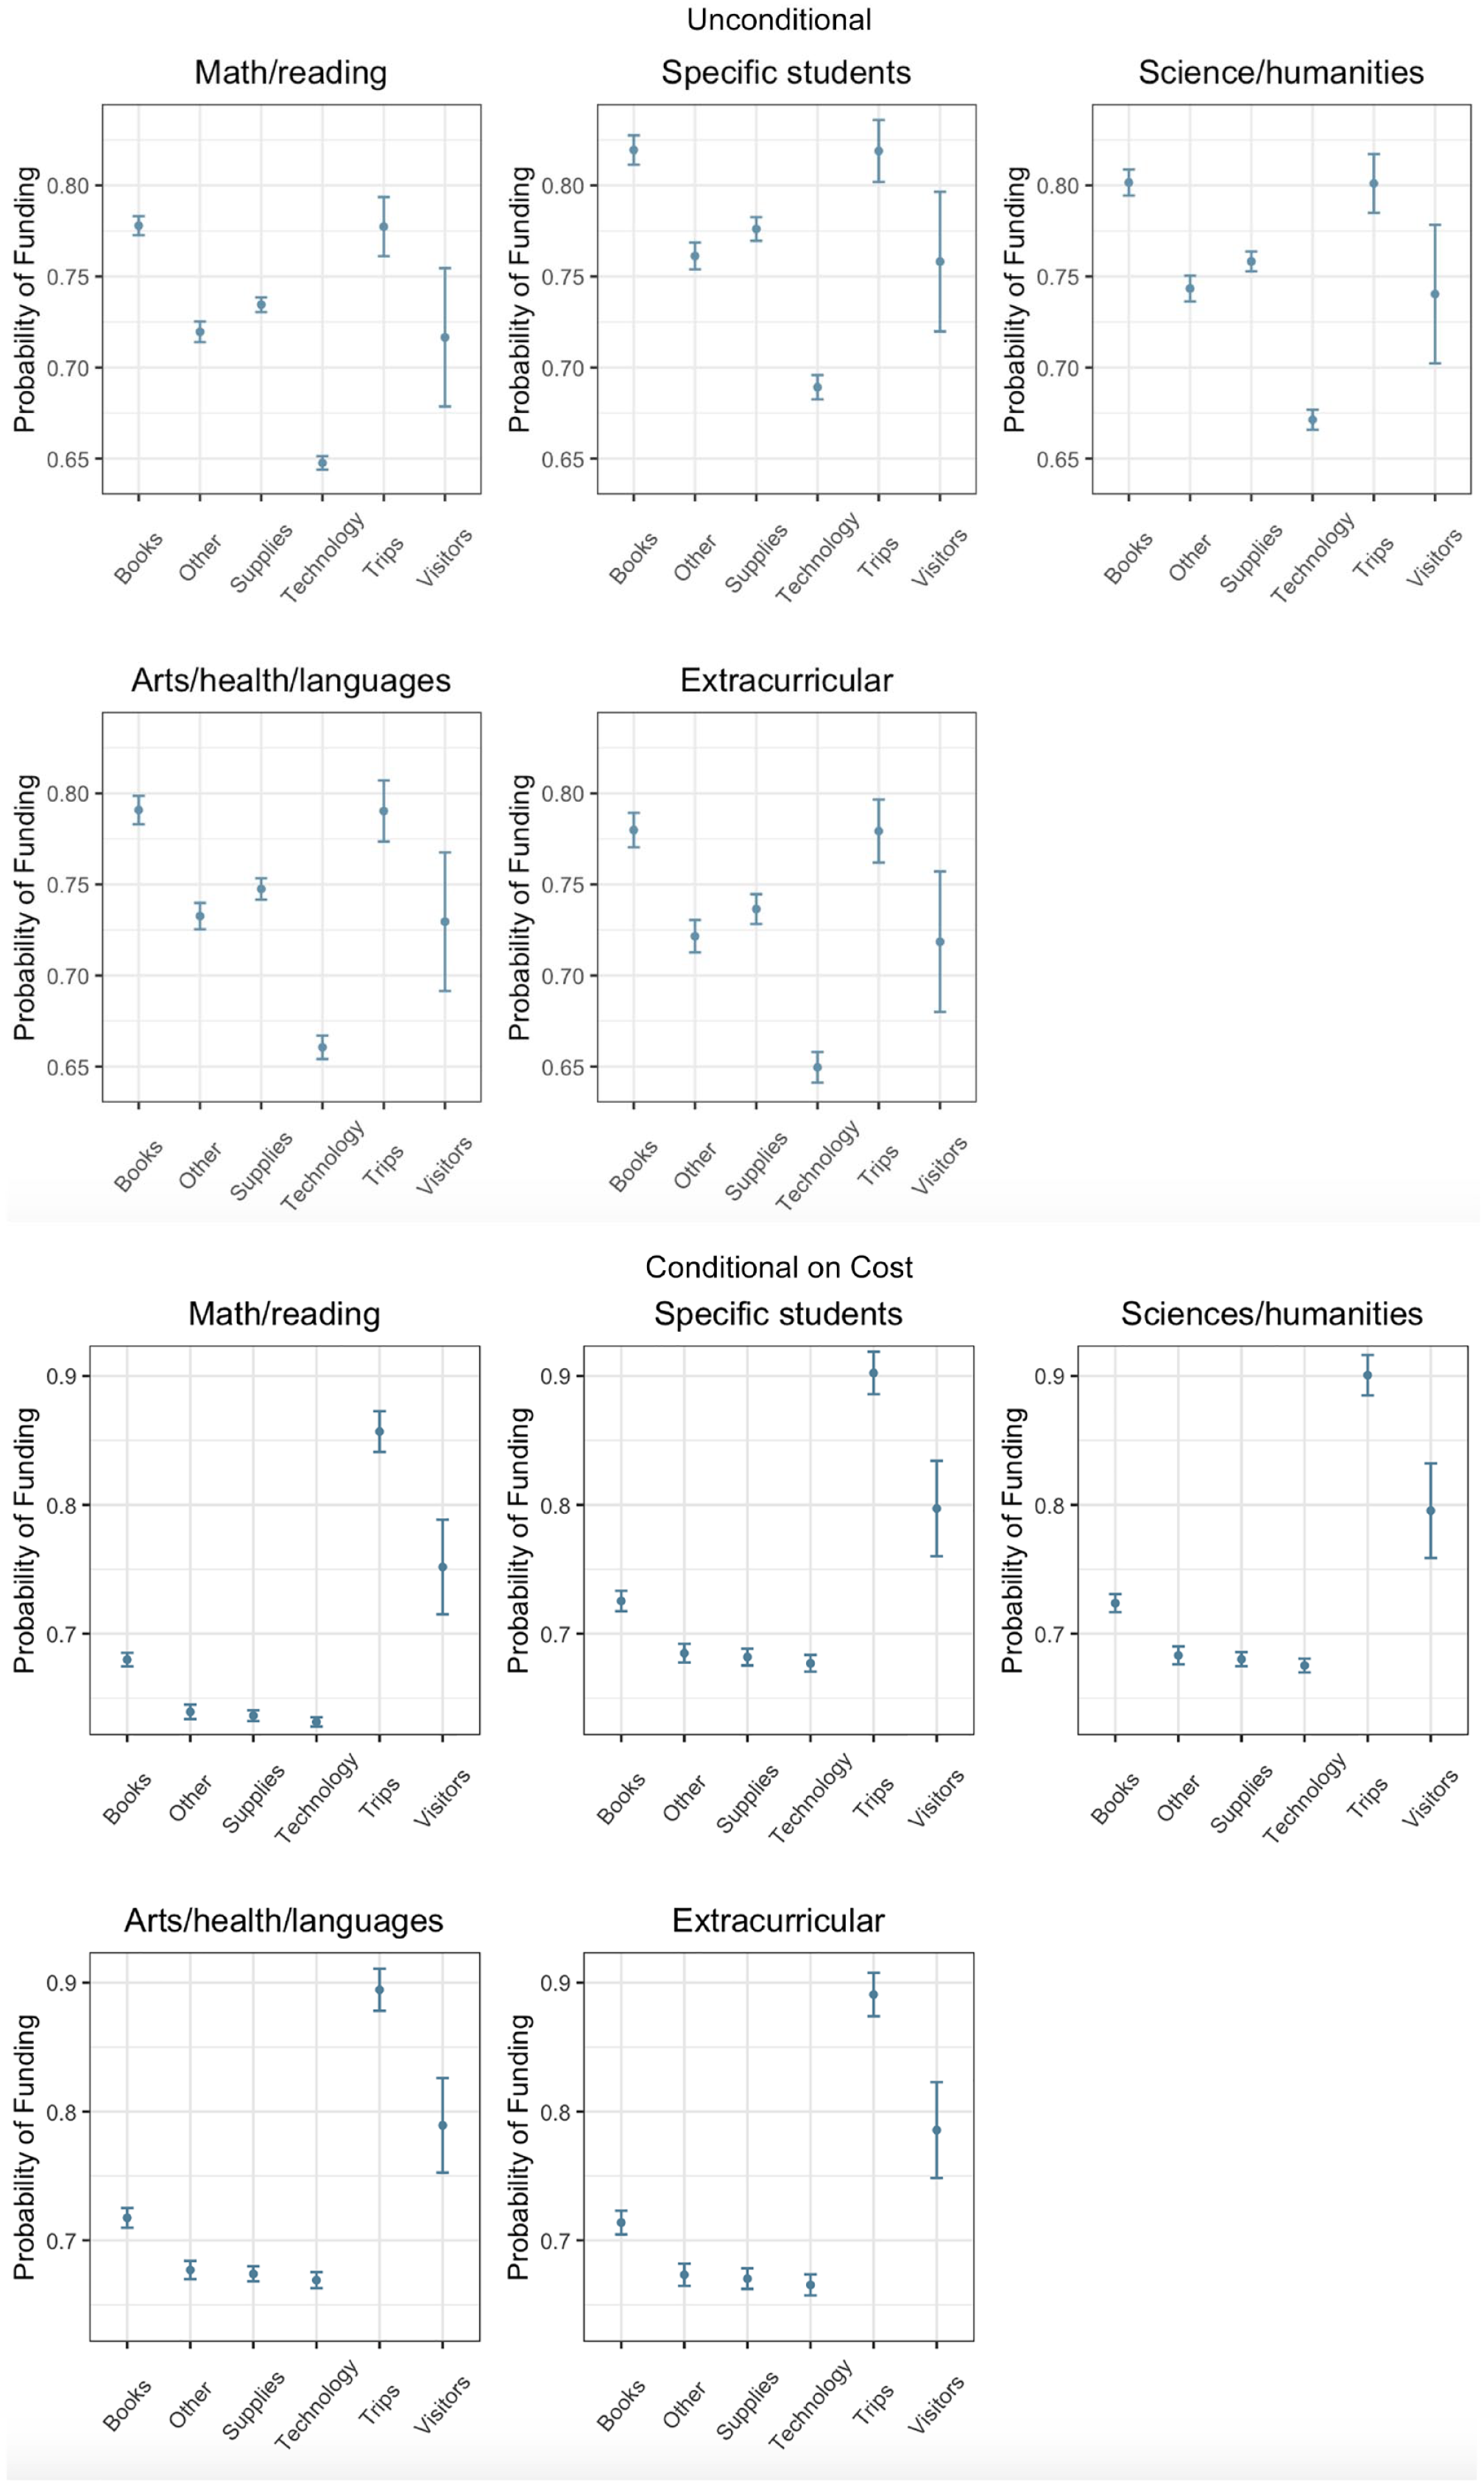
Predicted probability and 95% CI of a project reaching full funding, by subject, type of resource requested, and conditioning on project cost.
Regarding school characteristics, the left-hand panel of Figure 8 shows slight positive relationships between full funding and the proportion of both non-White and socioeconomically disadvantaged students. As shown in the top left panel, about 70% of projects submitted by teachers in schools with entirely White student bodies achieve full funding, compared with nearly 75% of projects in schools with all non-White student bodies. The upper right-hand panel of Figure 8 illustrates that this relationship holds across each of the four project cost quartiles, although at different levels, with more expensive projects less likely to be funded than less expensive ones. The results for socioeconomic composition are a bit more nuanced, with the positive overall relationship between full funding and the proportion of students eligible for subsidized lunch masking considerable heterogeneity across project cost quartiles. Results for the first three project cost quartiles broadly mirror the overall findings. However, results markedly differ for the most expensive quarter of projects, with a strong negative relationship between full funding and the proportion of students eligible for subsidized lunch. Substantively, this means that, relative to their more advantaged peers, schools serving disadvantaged student populations are slightly more likely to have relatively inexpensive projects funded but substantially less likely to achieve full funding for expensive projects.
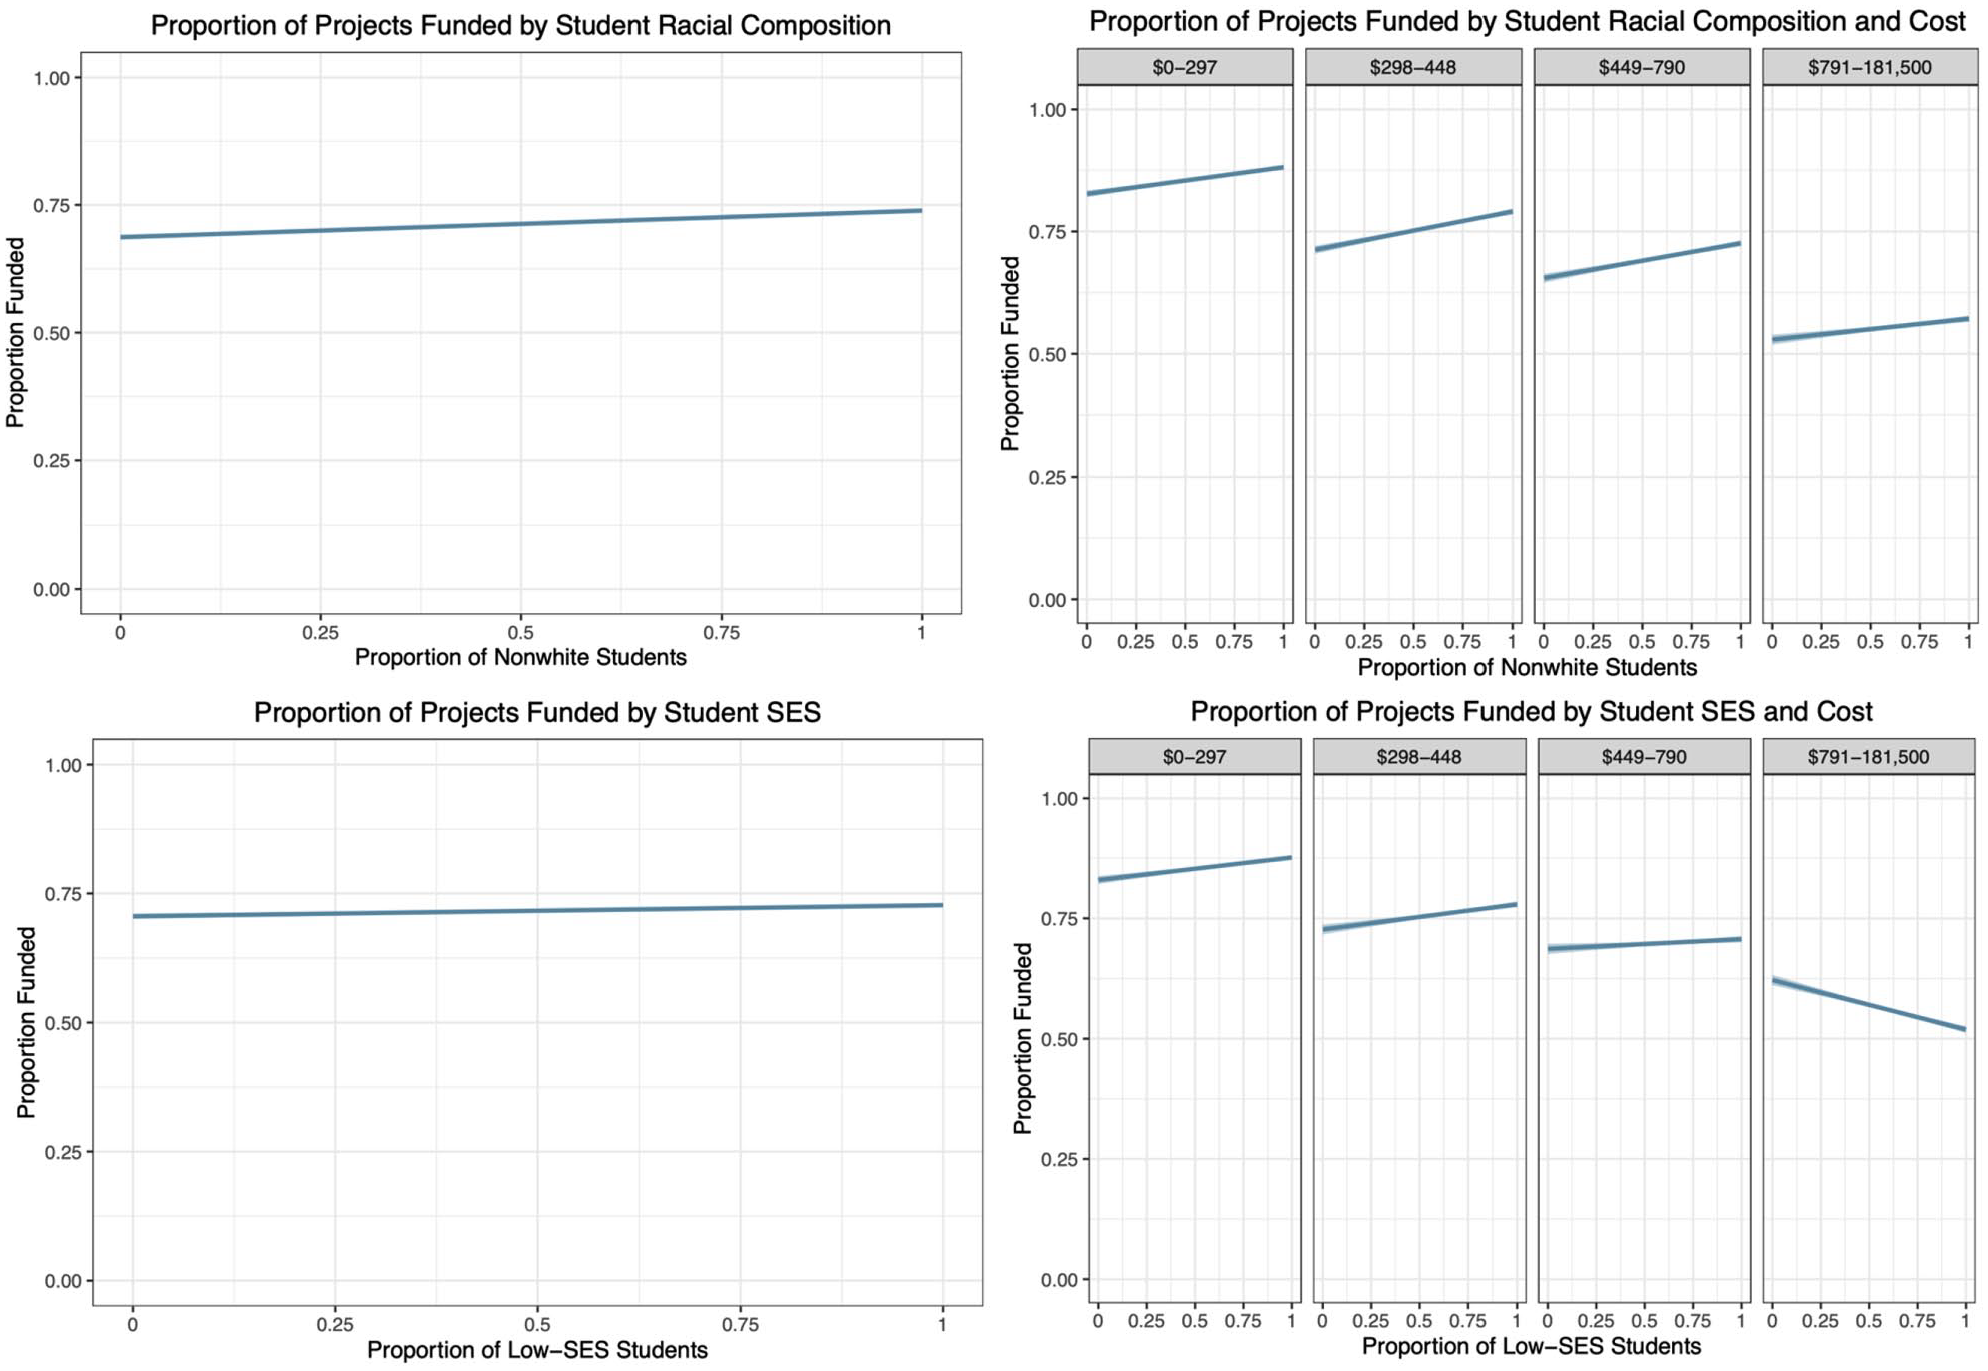
Predicted proportion of projects funded by school characteristic (left panel) and school characteristic and project cost (right panel).
Considered as a whole, the results in this section tell a clear story that builds on the findings of prior sections. In particular, the results demonstrate that projects submitted in the subjects of math and reading, which account for a majority of all those submitted, are somewhat less likely to be funded than projects in each of the other four project areas. Further analysis makes clear that the tendency to fund math and reading projects at lower rates is not attributable to any differences in project cost. Considering the type of resource requested, projects asking for trips and books are most likely to achieve full funding, while those asking for technological resources are least likely to reach their goal. Importantly, conditioning on cost paints a somewhat different picture. For a given project cost, donors are most likely to fully fund projects asking for trips and visitors, and least likely to fund requests for technology—this pattern holds across all subject categories. With respect to school characteristics, the results show that the probability of a project achieving full funding is positively associated with the proportion of non-White students in the school and that this relationship holds regardless of project cost. The results also show a slight positive relationship between full project funding and the proportion of students eligible for subsidized lunch, at least for the three lowest project cost quartiles. For the most expensive projects, though, this slight positive relationship turns strongly negative. These results, coupled with those in the prior sections, have a number of important implications for educational policy and practice.
Discussion and Conclusion
Teachers’ use of crowdfunding platforms has grown significantly over the past two decades, reaching a point today where about one third of U.S. public schools annually post a project on DonorsChoose, the largest education-focused crowdfunding platform in the country. With such a wide reach, DonorsChoose has come to serve as something of a shadow financing mechanism—one that, to date, has operated with a fair degree of opacity. With little prior work to build on, we peek behind the proverbial curtain, analyzing submission and funding patterns for DonorsChoose projects. To do so, we use unique data on the universe of projects submitted to DonorsChoose in 2015–2016, combined with school- and state-level characteristics collected from CCD, to construct two datasets—a school dataset and a project dataset—that we leverage to gain insight into these issues. We explore the characteristics of schools whose teachers do and do not submit a project to DonorsChoose. We examine the subject areas of these submitted projects. And we assess which projects are most and least likely to be funded.
A clear story emerges over the course of this analysis. It is clear that teachers in schools serving disadvantaged student populations in the lowest-spending states are most likely to post projects on DonorsChoose. Furthermore, a majority of posted projects request materials in the central subjects of math and reading, which suggests that teachers are using DonorsChoose to improve student experiences in core subjects rather than peripheral ones. Despite accounting for a majority of all submitted projects, those in the area of math and reading are actually slightly less likely to reach full funding than projects in other subject areas—further analysis demonstrates that these disparities are not attributable to differences in project costs across subject areas. Finally, we see little overall relationship between a school’s demographic composition and the likelihood that a project achieves full funding. However, this overall relationship obscures important heterogeneity. Indeed, results show that schools enrolling substantial proportions of economically disadvantaged children are somewhat more likely to have relatively inexpensive projects to reach full funding but substantially less likely to have expensive projects funded.
These results have several implications for educational policy and practice; we briefly touch on three of them here. First, our analysis suggests that DonorsChoose is serving a purpose that should arguably be the responsibility of states’ school finance systems. By and large, teachers use DonorsChoose to request math and reading materials for students in schools serving disadvantaged and historically marginalized student populations. There are both legal and moral cases to be made that teachers should have ready access to such materials to educate our nation’s youth. Second, we note that the time teachers spend developing and submitting DonorsChoose projects is time they do not spend teaching or preparing to teach. The efforts to design and develop such projects are disproportionately undertaken by teachers in schools serving disadvantaged students in a laudable effort to mitigate inequalities. Paradoxically, though, these efforts may also reify existing disparities because teachers in more advantaged environs have the luxury of focusing almost exclusively on instruction, rather than procuring materials. Again, this underscores the failure of school systems to provide teachers with the materials they need for effective instruction. Finally, while we acknowledge the high-minded intentions of DonorsChoose and other crowdfunding platforms, we also highlight the possibility that they provide policymakers with a degree of protection from public dissatisfaction with the state of public education. Teachers’ crowdfunding efforts may mitigate discontent among parents and the public that would have otherwise been directed at public officials.
Along with their implications for policy and practice, our findings also illuminate several productive avenues for future research on crowdfunding in education generally, and DonorsChoose specifically. First, future work would do well to explore the temporal dynamics of crowdfunding. We focus on a single year to maximize the ability for our analyses to tell a clear, coherent story about the contemporary state of crowdfunding in American education. But just as our analyses answer many important questions, they raise others. How has teachers’ use of crowdfunding changed over the years? Submissions have clearly increased, but are teachers using crowdfunding for different purposes today than they did 10 years ago? What about donor behavior? Has it evolved over time? Questions like these are ripe for additional inquiry.
Second, future work should assess whether and how crowdfunding operates differently among elementary, middle, and high school teachers. Do teachers of different grades ask for different types of resources? In different subjects? Exploring the potential for heterogeneity by schooling level would represent an important contribution to the evidence base around crowdfunding. Third, scholars should consider undertaking work intended to uncover additional nuance in the relationship between school or teacher characteristics and submission to crowdfunding platforms. Qualitative work will be particularly important in this realm, as it will allow for a much deeper understanding of teachers’ intentions and motives when turning to DonorsChoose or another crowdfunding option. And as the school-level financial data mandated by the Every Students Succeeds Act make their way into the hands of researchers, we will be able to gain a clearer picture of the role that school finances play in nudging teachers toward crowdfunding platforms.
In closing, our research provides a window into the contemporary operations of the largest crowdfunding platform in U.S. public education, but it is clear that we still have much to learn. And as we continue down this road of inquiry, it will be important to document both the intended and unintended effects of crowdfunding in U.S. education.
Supplemental Material
sj-pdf-1-edr-10.3102_0013189X21990002 – Supplemental material for Who Chooses DonorsChoose? Submission and Funding Patterns on the Nation’s Largest Education Crowdfunding Platform
Supplemental material, sj-pdf-1-edr-10.3102_0013189X21990002 for Who Chooses DonorsChoose? Submission and Funding Patterns on the Nation’s Largest Education Crowdfunding Platform by Sarah Wolff and Deven Carlson in Educational Researcher
Footnotes
Notes
Authors
References
Supplementary Material
Please find the following supplemental material available below.
For Open Access articles published under a Creative Commons License, all supplemental material carries the same license as the article it is associated with.
For non-Open Access articles published, all supplemental material carries a non-exclusive license, and permission requests for re-use of supplemental material or any part of supplemental material shall be sent directly to the copyright owner as specified in the copyright notice associated with the article.
