



Abstract
Recently published social science research suggests that students attending schools with concentrations of disadvantaged racial minority populations achieve less academic progress than their otherwise comparable counterparts in more racially balanced or integrated schools, but to date no meta-analysis has estimated the effect size of school racial composition on mathematics outcomes. This metaregression analysis reviewed the social science literature published in the past 20 years on the relationship between mathematics outcomes and the racial composition of the K–12 schools students attend. The authors employed a two-level hierarchical linear model to analyze the 25 primary studies with 98 regression effects. Results indicate that school racial isolation has a small statistically significant negative effect on overall building-level mathematics outcomes. This relationship is moderated by the size of the sample in the study and by the way the independent variable was operationalized. Although it is small, the effect size is substantively meaningful. The effects are stronger in secondary compared to elementary grades, and racial gaps widen as students age. The emergence and widening of the race gaps as students move through the grades suggest that the association of racial segregation with mathematics performance compounds over time. Implications for educational policy and future research are discussed.
Mastery of mathematics by a nation’s youth is essential for individual and societal advancement. The generation and use of innovations in the fields of science, technology, engineering, transportation, medicine, public health and safety, and commerce require citizens with mathematical knowledge and skills. This nation’s ability to prepare the next generation to fully participate in civil society and to enter the increasingly technical workplace requires the public school system, where the vast majority of U.S. children receive their formal educations, to successfully teach mathematics to all children. Yet overall mathematics performance by U.S. students is relatively unimpressive compared to the performance of students from other advanced industrialized nations (National Center for Education Statistics [NCES], 2011a, 2011b). Although overall U.S. students’ mathematics performance has improved slightly in recent decades, racial gaps in mathematics have been relatively stable during the same time period, with only a slight narrowing between some groups in some grades (NCES, 2009). This article explores what the social science literature says about the role of school racial composition in students’ mathematics performance.
Stark racial and socioeconomic status (SES) disparities in mathematics knowledge, skills, and achievement compound the urgent predicament presented by the overall performance of U.S. students (NCES, 2011a, 2011b). Not only are White, Asian, and middle-class students more likely to score higher on achievement tests, they are more likely to enroll in more rigorous courses during high school, to attend college, and to choose scientific, mathematical, engineering, and technical majors than their less advantaged working-class, Black, Latino/a, and Native American counterparts (Mickelson & Nkomo, 2012). Weak mathematics knowledge and skills are detrimental for disadvantaged youths’ futures and their communities’ well-being. Poor mathematics outcomes also are problematic for the nation’s future workforce given the relative youthfulness and high growth rates of Black, Latino, Native American, and low-income populations.
Clearly, there are multiple sources of the race gaps in mathematics outcomes. The multiple student characteristics associated with mathematics performance are well documented. Family factors involve financial, cultural, and social capital resources (Bryk, Lee, & Holland, 1993; Lareau, 1999, 2011; Roscigno & Ainsworth-Darnell, 1999). Community sources include safety and crime levels, neighborhood SES, social networks, cultural values and norms, and others (Condron, 2009; Jencks & Mayer, 1990; Reardon & Bischoff, 2011; Saporito & Sohoni, 2007). Variations in these nonschool factors alone are insufficient to account for the racial gaps in mathematics achievement outcomes because structural features of schools and classrooms, such as their racial and SES composition (Benson & Borman, 2010; Borman et al., 2004; Condron, 2009; Crosnoe, 2009; Hanushek, Kain, & Rivkin, 2009; Harris, 2006; Lucas, 1999, 2001), also contribute to learning outcomes.
The purpose of this article is to synthesize what the social, educational, and behavioral science literatures suggest is the contribution of school racial composition to race gaps in mathematics achievement. School racial segregation has long been widely acknowledged to be an institutional source of inequalities in opportunities to learn. That is why from the era of Brown v. Board of Education (1954) through the early 1990s, Supreme Court opinions and many education reforms were directed—with varying degrees of clarity and success—at creating schools that are not organized along racial lines. Compared to much of the second half of the 20th century when desegregation efforts were front and center in reform efforts, contemporary policymakers and social science researchers are less likely to pay attention to the role that school racial composition has on educational outcomes. Instead, current efforts to improve mathematics outcomes generally focus on improving curricula, enhancing teacher quality, incentivizing teacher pay, and the three linked reform strategies of standards, assessment, and accountability.
One reason for the decline in policymakers’ attention to school racial composition is that for many years the social science literature was equivocal as to the possible effects of school compositional features on outcomes such as achievement (Armor, 1995; Cook, 1986; St. John, 1975; Wells & Crain, 1994). However, since roughly the last decade of the 20th century, newer, better designed studies have reported that compositional characteristics of schools are associated with persistent race, ethnic, and social class differences in achievement (see Berends & Peñalosa, 2010; Borman & Dowling, 2010; Borman et al., 2004; Braddock & Eitle, 2004; Condron, 2009; Hanushek et al., 2009; Harris, 2006; Mickelson, 2008; Mickelson & Bottia, 2010; Vigdor & Ludwig, 2008). The preponderance of this newer and better research is consistent about the positive associations of diverse schooling and/or the negative relationships of racially segregated schooling with a host of educational outcomes. The growing body of high-quality newer social science research has returned educators’, scholars’, and policymakers’ attention to the role that school racial composition plays in shaping school outcomes (Ali & Perez, 2011; Duncan, 2011; Kirp, 2012).
This article contributes to the debate about the effects of school racial composition on educational outcomes by presenting results from a metaregression analysis of 25 social science studies reporting findings about the relationship of school racial composition to mathematics outcomes. Together, the studies indicate there is a small but substantively meaningful negative relationship between school racial segregation and mathematics outcomes for elementary, middle, and high school students and that mathematics outcomes are likely to be lower for students from all racial groups, SES backgrounds, and grade levels who attend racially isolated minority schools, although effect sizes vary by grade levels, immigrant status, and racial group.
The article proceeds as follows: After reviewing the evidence on racial and SES gaps in mathematics performance, we describe this study’s research design, data, and analytic procedures. We then summarize and interpret the findings and conclude with considerations of the findings’ limitations and implications for future research and policy.
Racial Gaps in Mathematics Performance
Despite decades of reforms aimed at closing racial gaps in educational outcomes, students’ mathematics performance continues to be correlated with their race. As an illustration, we report the percentage of students scoring below basic proficiency in mathematics in Grades 4, 8, and 12 on the 2009 National Assessment of Educational Progress test (NCES, 2011a). Table 1 shows the percentage of students scoring below states’ standards in Grades 4, 8, and 12. The table indicates that Asian and White students are more likely to be proficient than Black, Latino/a, and Native American youth in all grades (NCES, 2011a). Within all racial/ethnic groups, higher percentages of students score below proficiency in the upper grade levels. In addition, the data indicate that some of the gaps among the racial groups increase as students progress from elementary through secondary school. Interracial gaps change as students advance in school. The Black–White gap grows by 11 points between Grades 4 and 12, the White–Asian gap grows by 8 points, and the Latino/a–White gap grows by 10 points.
Percentage below basic proficiency for mathematics, Grades 4, 8, and 12 National Assessment of Educational Progress scores by race/ethnicity, 2009

Note. Standard errors in parentheses.
The persistence of racial gaps in proficiency does not mean that overall student performance has been stagnant over the decades. Although proficiency gaps among racial/ethnic groups in mathematics are still large and increase as students move from elementary through secondary school, it is important to note that National Assessment of Educational Progress (NAEP) data also show that both the Black–White and Hispanic–White test score gaps in mathematics were reduced in the period 1999 to 2004 in some grades. In fact, mathematics scale scores have improved during the past two decades for all racial and SES groups. Between 1975 and the late 1980s, the Black–White NAEP mathematics gap narrowed at all assessed grades. Mathematics scores continued to converge through the mid-1980s, largely because of the relative improvements by Black students. Between 1978 and 1986 the gap declined from 32 to 25 points for 9-year-olds and from 42 to 24 points for 13-year-olds. After the late 1980s, however, progress in closing the gap stalled. For the most part, it has held relatively steady since then, although the Black–White gap among eighth graders narrowed slightly between 2005 and 2009 (Magnuson & Waldfogel, 2008; NCES, 2011a, 2011b). Recent cross-sectional and time series data point to a strong association between levels of segregation and achievement gaps (Berends & Peñalosa, 2010). Notably, the period of relative stagnation in the narrowing of the gap corresponds with the period when desegregation stalled and income inequality grew.
Trends in Student Demography
The trends in test score performance should be considered in conjunction with striking changes in the demographic profile of U.S. public school students who today are more ethnically and racially diverse than their counterparts four decades ago. In 1968, 80% of public school students were White, 14% were Black, 5% were Latino/a, and 1% were Asian or Native American (Frankenberg, Lee, & Orfield, 2003). In 2010, the student population in public schools was 56% White, 22% Latino/a, 14% Black, 4% Asian, less than 1% Pacific Islander, 3% biracial, and 1% American Indian or Alaskan Native (NCES, 2010). At present, a majority of public school students in California, Florida, and Texas are children of color (Aud, Fox, & KewalRamani, 2010). Census Bureau projections suggest that by 2025, 52% of youth aged 15 to 19 will be students of color (U.S. Department of Commerce, 2012). Student populations have increasing numbers of immigrants, too. Approximately one quarter of the children younger than 17 had at least one immigrant parent (Batalova & Terrazas, 2012; Zhou, 1997). The proportion of immigrant children tends to be higher in urban school districts (Portes & Rumbaut, 2006).
In response to the recent dramatic shifts in the ethnic and racial backgrounds of student populations, the demographic compositions of American public schools in urban, suburban, and rural communities are changing as well. All types of communities today have higher percentages of Black and Latino/a students in their public schools compared to the past. In addition, levels of racial and socioeconomic segregation are increasing in public schools located in cities and suburbs. Although there is some disagreement among scholars over the extent to which U.S. schools are resegregating (Logan, 2004; Orfield & Frankenberg, 2008), there is widespread acknowledgement that progress toward desegregation has faltered since the early 1990s (Logan, Minca, & Adar, 2012; Orfield, 2009).
Segregation among school districts now surpasses segregation within school districts (Clotfelter, Ladd, & Vigdor, 2008). Almost half of Black and Latino students attend schools in inner-ring suburban communities of large metropolitan areas. Two-thirds of the schools that Blacks and Latinos attend are intensely racially segregated, with high concentrations of poor students (Logan et al., 2012; Orfield & Frankenberg, 2008). Asian Americans are more likely to attend integrated schools than any other ethnic group. Whites are the least likely of any student group to attend segregated minority schools, especially if their families live outside of central cities (Aud et al., 2010).
Demographic shifts in student populations mean that increasingly the proportion of the U.S. student population from advantaged backgrounds, who tend to score well in mathematics, is shrinking relative to the proportion of students from less advantaged backgrounds, who are less likely to perform well. Furthermore, the resegregation of public schools means that students from disadvantaged families are increasingly likely to attend schools with other children from similar backgrounds. This study investigates whether these demographic and segregation trends are related to students’ mathematics outcomes by meta-analyzing 25 studies that examined the relationship of school racial composition to mathematics performance.
Method
Although all social science studies discussed in this metaregression analysis examined the effects of school racial composition in relationship to an outcome, their foci, research designs, measurement of key constructs, and terminology differed across the disciplines and the decade in which a particular study was conducted. Thus, although the focus of a particular set of studies may be the effects of school racial composition on outcomes, the researchers may have labeled the construct variously as desegregation, integration, segregation, school racial composition, minority composition, or diversity. Early studies (prior to the late 1980s) tended to conduct experiments or quasi-experiments on the effects of court-ordered desegregation in a single school district. Because of the decline in the number of school systems under court desegregation orders, in subsequent years researchers switched to large-scale surveys that include measures of school and classroom composition (Linn & Welner, 2007; Mickelson, 2008). For these reasons, differences in the terminology across studies may reflect important distinctions in underlying conceptual frameworks, research goals, the nature of the relationships under investigation, and the social and political realities of the time frames in which the studies were conducted. Yet the core issue of interest across all the studies is essentially the same: the relationship of school racial composition to a mathematics outcome. With these complications and qualifications in mind, the following section presents an operationalization of the terminology employed across the studies examined, used in our database searches, and subsequently in the metaregression analysis we conducted.
Definition of Terms
Segregated schools
Many studies examined the relationship between levels of segregation and a particular outcome. Various terms used in these studies convey the notion that a school’s population was disproportionately composed of students from one race. Large-scale survey data sets typically measure composition as percentage minority in a school. The phrases concentrated minority, racially imbalanced, racially isolated, and segregated all denote a school’s student population has high concentrations of Black and/or Latino/a youth and occasionally American Indian students as well.
Diverse, desegregated, or integrated schools
Another set of studies focused on the relationship between varying levels of school racial and/or SES diversity and outcomes. Different labels for diverse schools reflect slightly different conceptualizations of the problematic. In the context of U.S. history, school desegregation is a legal, social, and policy process designed to create schools that no longer separate students by race from those that once practiced segregation. In a desegregated school students, staff, curricula, and extra- and cocurricular activities reflect the demographic balance of the community. Integrated schools also reflect the culture of their students.
Race
Typically researchers categorize students as Asian (or Asian American, Pacific Islander), Black (or African American), Latino/a (Hispanic), Native American (American Indian, Alaskan Native, Aleut, Inuit), Other (reserved for international or mixed-race students), or White (European American). In some cases, studies collapse all students of color into the category of minority, which is then contrasted with Whites. Research about the effects of race examines either if the race of individual students is associated with their outcomes (student level) or if the racial composition of a school is related to outcomes (the school level). Increasingly studies report on both.
These common categories blur meaningful within-race ethnic differences relevant to educational outcomes. For instance, among Asians, Hmong and Chinese students have distinctive educational patterns; among Latino/as, Colombian and Mexican youths are likely to perform differently. Generation in the United States further complicates racial and ethnic categorization because immigrant students frequently perform better than their native-born coethnics (Portes & Rumbaut, 2006). Much of the early school composition research focused solely on Blacks and Whites. Often there were too few Latino/as, Asians, or American Indian students in the local school district to allow for more comprehensive analyses of racial subpopulations. Although later studies are more likely to include Asian, American Indian, and Latino/a students, there are still relatively few contemporary studies that report findings separately for all racial and ethnic groups found in the U.S. student population.
Socioeconomic status
Prior research has established SES as an important individual- and school-level factor for educational outcomes (Kahlenberg, 2001; Lucas & Beresford, 2010; Reardon, Yun, & Kurlaender, 2006). SES is used interchangeably with the terms social class and family background in the literature, even though SES and social class are based on different sets of theoretical assumptions about the nature of stratification in society (Grodsky, Warren, & Felts, 2008; Lucas & Beresford, 2010). Discussions of the effects of SES refer either to how SES of individual students affects their outcomes (student level) or how the SES of a school is related to outcomes (school level).
All 25 primary studies in this metaregression analysis controlled for the SES of students, and the majority also controlled for school-level SES. Of the studies, 5 included only student-level measures of the construct. Studies operationalized SES in a variety of ways. One study operationalized SES as social capital (measured as an aggregate of parent’s participation at school and parent’s acquaintances). In addition, 14 studies included an aggregated school-level measure of SES, typically based on parent’s education, occupation, and family income. The crudest measure of SES is free- and/or reduced-price lunch eligibility (FRL) and 10 of the primary studies utilized this measure of school-level SES. FRL status distinguishes only poor children whose parents sign them up for free- and/or reduced lunches from those who are either not poor or who are poor but whose parents do not sign them up. A better measure of SES is parental education, typically denoted by mother’s educational attainment. A superior indicator is a combination of parental educational and occupational attainment.
Socioeconomic segregation is closely correlated with racial segregation. It has also intensified during the past few decades (Orfield, 2009; Reardon & Bischoff, 2011). Treating race effects as distinct from yet related to SES effects is premised on theory and evidence that although they are often correlated, they are discrete social forces. Notably, racial gaps in achievement persist even after researchers control for FRL status, parental income, education, and other measures of SES (Grodsky et al., 2008). Although methodologically challenging, unpacking the unique contributions of school racial composition and school SES composition to achievement outcomes is necessary for understanding the social context for teaching and learning mathematics. We address school SES composition on mathematics achievement in a companion study (Mickelson & Bottia, 2010).
Mathematics outcomes
Mathematics standardized test scores were the dependent variable in about three fourths of the studies we considered for inclusion. The remaining studies reported composite achievement scores that included mathematics (overall GPA, mathematics courses GPA, SAT total battery score, principal component analysis of Louisiana’s Graduation Exit Examination [GEE] standardized test raw scores in mathematics, language arts, and writing).
Database Searches
The quality of any synthesis depends on how fully and appropriately the scholarly literature is searched to locate relevant studies, the rigor of inclusion and exclusion criteria established, and whether those conducting the review dealt with the variation in methodological quality of the studies when summarizing their findings. We employed a complete but parsimonious approach to our synthesis to address as many of the potential threats to its validity and reliability as possible (Raudenbush, 1991).
The validity and reliability of potential studies informed our decision to limit our population of primary studies to those that were published in 1990 or later because of the stark differences in the quality of much of the research that appeared before this time line. Some meta-analysts maintain that the methodological quality of studies is like any other study characteristics that should be coded and then controlled for during analyses (Glass, McGaw, & Smith, 1981; Rosenthal & DiMatteo, 2001). We maintain that use of this time frame is appropriate because earlier studies of desegregation effects are more likely to suffer from serious shortcomings in design, implementation, sample selection, sample attrition, or statistical analysis that raise serious threats to their validity and reliability. Because of the availability of better data sets, more representative samples, and advances in statistical analyses, post-1990 studies are far less likely to suffer from these threats compared to the earlier ones (Bradley & Bradley, 1977; Cook, 1986; Linn & Welner, 2007; Mickelson, 2008).
The larger project from which this article is drawn focuses on searching the education, social, and behavioral science literatures for research about the effects of school composition on short- and long-term educational outcomes across cognitive, affective, and adult life course domains (for details, see Mickelson, 2008; Mickelson & Bottia, 2010; Mickelson & Nkomo, 2012). From 2006 through 2010 we conducted systematic searches of electronic databases in education and social and behavioral science for relevant studies on effects of school and classroom composition on outcomes. The databases included JSTOR, Psychology Abstracts, Sociology Abstracts, Google Scholar, ERIC, Educational Research Complete, Academic Search Premier, Project MUSE, National Bureau of Economic Research, and Dissertation Abstracts. With respect to mathematics outcomes, the keywords used in the searches (with an OR and an AND option) were selected because of their relevance to the topic studied in this meta-analysis. The terms for the key independent variable included racial composition, desegregation, integration, segregation, racial isolation, school racial composition, minority composition, and diversity. The terms for the key dependent variables included phrases that signify academic achievement in general (performance, outcomes, scores, test scores) and mathematics outcomes, specifically.
Inclusion and Exclusion Criteria
Our keyword search of electronic databases identified many hundreds of potential studies. In the first stage of our assessment process a prospective study’s abstract was retrieved and reviewed to determine if the research actually addressed the topic of interest. Based on information provided in abstracts, full articles, chapters, books, dissertations, paper presentations, and reports were obtained for further evaluation for suitability for inclusion the synthesis.
In the next stage of our assessment we subjected potential studies to the following preliminary inclusion criteria:
The study examined the effect of school composition on the math achievement of students.
The dependent variable was a score that measured math achievement (math item response theory [IRT] scores, math scale scores, etc. in 19 cases) or a composite score that included math achievement at the student level (overall GPA, GPA in mathematics courses, SAT total battery score, principal component analysis of Louisiana’s GEE standardized test raw scores in mathematics, language arts, and writing).
The sample involved K–12 students.
The study was written in English.
The primary study’s author employed appropriate statistical tools given the nature of the research design and the data set. By appropriate statistical tools, we refer to statistical techniques that allow researchers to conduct a more precise analyses where the relationship between student mathematics achievement and school racial composition may be mediated or moderated by other school, district, individual, or family factors.
The study was published, presented, or otherwise disseminated no earlier than 1990.
A total of 56 relevant studies of school compositional effects on mathematics outcomes met the preliminary criteria for inclusion in the synthesis of research about the effects of school composition on mathematics achievement.
Coding Procedure
The first two authors coded the studies that met all six inclusion criteria according to a formal coding form they developed for the larger project from which the mathematics metaregression analysis is drawn. The categories included for coding were (a) identifying information (author, title, journal, date of dissemination), (b) publication status, (c) research design, (d) description of the data set, (e) sampling frame, (f) sample characteristics, (g) independent and dependent variables, (h) keywords, (i) analysis method, and (j) key findings. The first two authors collaboratively resolved uncertainties in coding that revolved around questions of research design or sampling frame. A graduate student then independently coded a random sample of 12 studies. Interrater agreement for the categories was 98%. The first and second authors then reviewed each code in all 56 studies to ensure the accuracy of the coding.
Selection of Primary Studies
We then subjected the 56 studies to two final inclusion standards required for calculating an effect size for each regression coefficient that would be meta-analyzed:
The key independent variable was measured as a percentage racial-ethnic minority (percentage of Black students in school, percentage of Latino/a students in school, or percentage of minority students in school) rather than as a categorical variable such as “segregated” or “integrated,” and the key independent variable was not a school-level SES measure (e.g., percentage FRL).
The key dependent variable was not a mathematics gain score. Studies reporting gains scores were excluded because gain scores do not measure the same thing as the mathematics score. Gain scores compare the difference in performance from one period to another; therefore, gain scores’ range of values is smaller than the range of values of the actual mathematics scores. Because of this, a gain score that is correlated with a measure of racial composition will reflect the effects of racial composition on the change in gain scores, instead of the scores themselves. Furthermore, both the mean and variance of the population of gain score regression effects are likely to be different than those for the population of single-point-in-time regression effects, making the inclusion and synthesis of both types of effect sizes problematic.
Obtaining Missing Descriptive Statistics
The subsequent step was identifying and addressing missing descriptive statistics in studies that otherwise met the inclusion criteria. Metaregression analysis requires descriptive statistics for all possible effects sizes calculated in each study so that any regression coefficients can be standardized across studies. For instance, some otherwise qualified studies presented separate regressions for Blacks and Latinos in two or more grade levels but the author provided only means, Ns, and standard deviations for the overall sample, not the subsamples by race and grade level. In such cases (and others), we contacted researchers with requests for all missing descriptive statistics (means and standard deviations for their dependent variable and key independent variable, and the sample size for all of the different relevant regressions in each study). We eliminated studies whose author was unable to provide us with the necessary missing information.
Sample of Primary Studies
After applying the inclusion criteria and obtaining missing descriptive statistics, 25 of the originally identified 56 studies about school racial composition and mathematics achievement remained in the sample of primary studies that could be meta-analyzed. Appendix B presents specific information about the 31 excluded studies. The main reasons for excluding the 31 articles that otherwise met the preliminary criteria from the analysis were as follows:
The study’s dependent variable was not a continuous variable measuring math achievement at the student level.
The key racial composition independent variable was not measured as a percentage of minority, Black, or Latino/a students.
The study measured only the effects of school SES composition on math achievement and did not include a measure of school racial or ethnic composition.
The design of the study did not report beta coefficients suitable for further analysis.
We were not able to acquire the missing descriptive statistics needed to calculate standardized regression coefficients for an otherwise qualified study.
Specifically, we were not able to obtain missing descriptive statistics for 8 of the 31 excluded articles, 8 articles had a dependent variable that was not appropriate (typically gain scores), 4 studies utilized key independent variables that were not continuous measures of racial composition, in 6 cases the study focused solely on SES composition, and 5 studies employed a methodological approach that did not yield a coefficient (estimate) that measured the impact of racial composition on mathematics achievement (see Appendix B for details of the excluded studies).
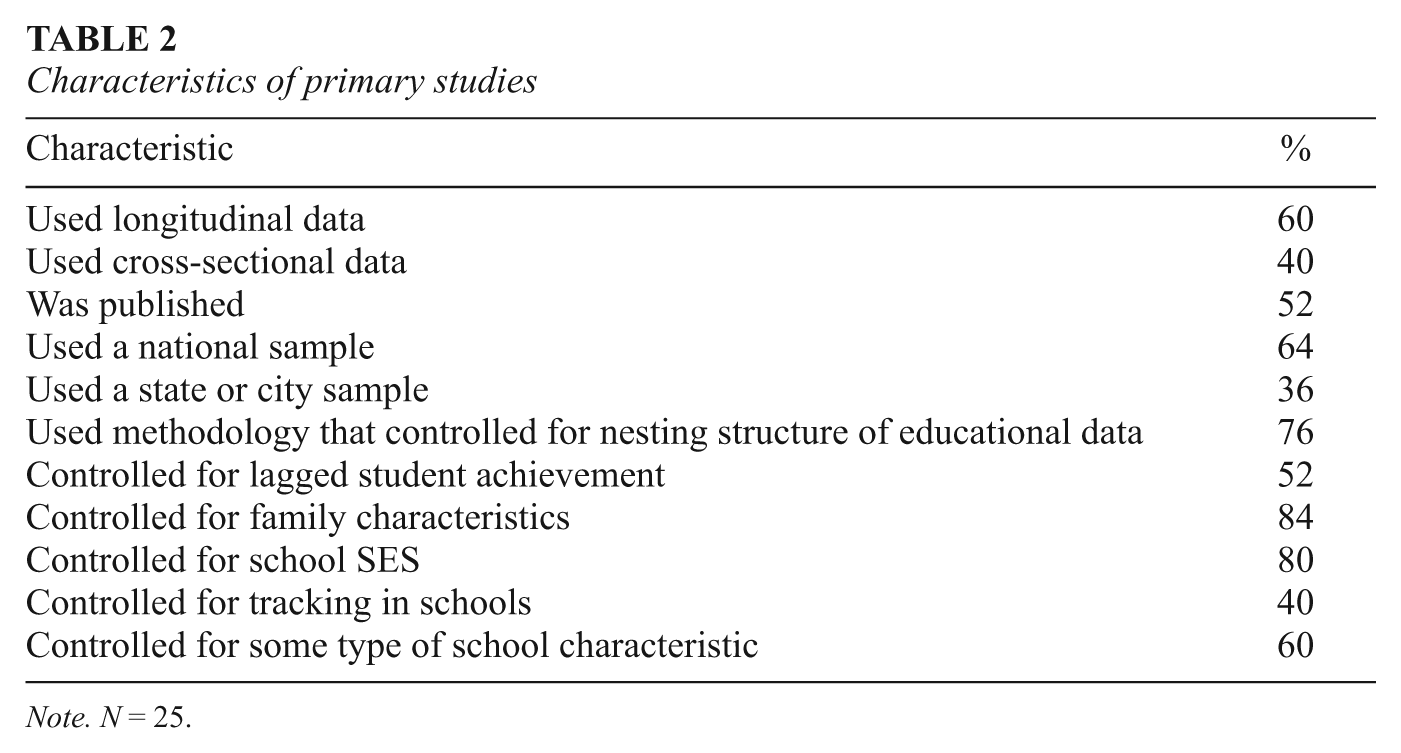
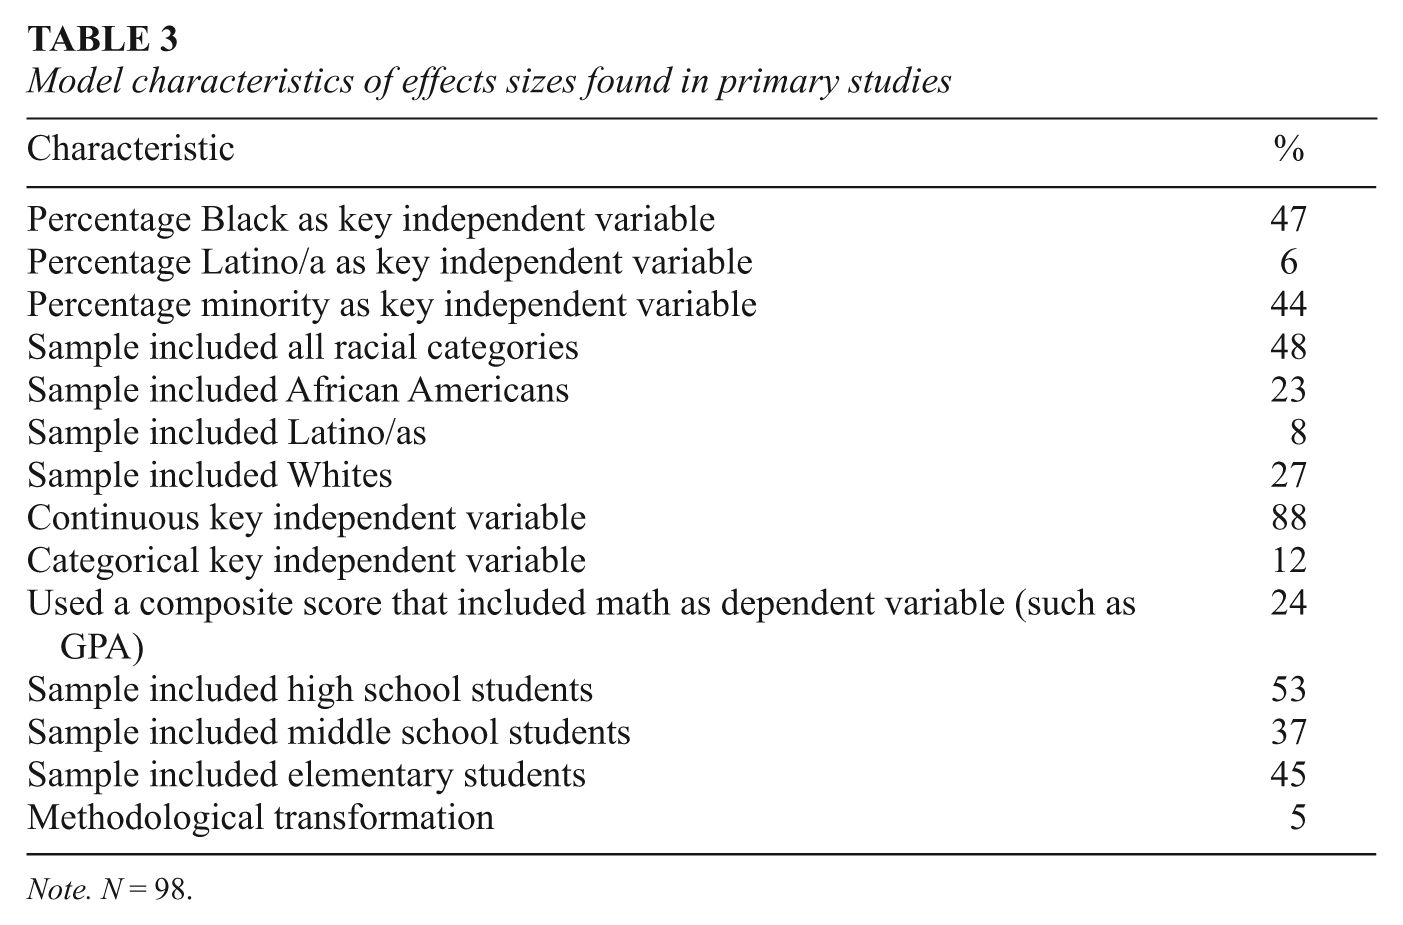
The final sample of 25 primary studies had 98 coefficient effects. Of the studies, 18 used math grades, math standardized tests, or standardized math scores derived using statistical methods from item response theory, 4 used GPAs, and 3 utilized other types of composite measures that include math achievement as dependent variables. Thus, 76% of the studies employed mathematics scores rather than a composite as a dependent variable. The majority of the 25 primary studies utilized longitudinal national data, utilized sophisticated statistical techniques for data analysis (typically multilevel models, Oaxaca decompositions, or fixed effects econometric models), and included controls for many student, family, and school characteristics. Almost half of the 98 coefficient effects came from regressions that employed percentage Black in the school as the main independent variable. Tables 2 and 3 provide the descriptive statistics for the studies and coefficient effects included in the metaregression. Appendix C (available in the online journal) presents details of the 25 meta-analyzed primary studies. Table 4 shows how the coefficients for the effect of school composition on mathematics achievement vary for different subgroups of students.
Characteristics of primary studies
Note. N = 25.
Model characteristics of effects sizes found in primary studies
Note. N = 98.
Characteristics of effect sizes by subgroup

Analytic Procedures
We began the construction of the data set for this metaregression analysis by identifying or creating standardized beta weights within the qualified studies. Standardized mathematics regression coefficients, the effect size quantities to be summarized, represent the expected number of standard deviation units of change in the study-specific outcome measures for every change of one standard deviation unit in the predictor variable. Standardized coefficients were chosen for summarization because of the varying scaling for both the outcome and predictor variables across the 25 primary studies. The outcome variables in each of the primary studies’ regression equations were some measure of student achievement (either a mathematics test score or a composite score that included mathematics), and the primary predictor variables were some measure of the concentration of minority students within a school context (most often percentage Black, percentage Latino/a, or percentage minority). For those primary studies that did not include standardized coefficients, we constructed them given available information about unstandardized coefficients and standard deviations for the outcome and predictor variables. Next, we transformed all standardized coefficients using the Fisher’s z transformation method to create a more normal distribution of effects for use in subsequent modeling and summarization (Van Ewijk & Sleegers, 2010a, 2010b). We used the following formula:

The z-transformed standardized mathematics coefficients served as our dependent variable.
Next, we examined control variables found across the 25 qualified primary studies for their potential as control variables in this metaregression analysis. Characteristics of each study’s regression analysis and characteristics of each study’s design were potential control variables. All variables in each study were identified as potential Level 1 and Level 2 predictors. Appendix A presents the full array of potential control variables coded for each of the 25 qualified primary studies included in the metaregression models. However, given that the data set consists of only 25 primary studies and 98 regression coefficients, the degrees of freedom limited the number of controls that could be introduced into our model. We selected only those control variables that preliminary analyses indicated were associated with between effect sizes, that occurred across a number of primarily studies, or that prior research or theory suggested were necessary to include in the model.
We selected the following effect size (regression model) characteristics as Level 1 predictors:
Sample size (in thousands)
Whether the regression model used the concentration of Latino/a students only as the independent variable (yes or no)
Whether a sample that included all racial groups was used to obtain the coefficient (yes or no)
Whether the dependent variable in the regression equation was an achievement composite score that included mathematics (as opposed to a mathematics achievement score; yes or no)
Whether a sample of only elementary students was used in the primary study (yes or no)
The following study characteristics were used as Level 2 predictors:
Whether the study was longitudinal (yes or no)
Whether the study was published (yes or no)
Whether the study used state- or district-level data (yes or no)
Whether the study used lagged achievement (in most cases measured as students’ previous mathematics achievement scores) as a control variable (yes or no)
Whether the study controlled for school-level characteristics (yes or no)
We chose to summarize effect sizes with a two-level multilevel model (Becker & Wu, 2007). The metaregression analysis hierarchical linear model is a special case of multilevel modeling applied to research synthesis (Raudenbush & Bryk, 2002). We used HLM software (version 6; Raudenbush, Bryk, & Congdon, 2008) to compute and summarize the effect sizes obtain by our primary studies. Our choices as to what predictors reflect Level 1 or Level 2 variability were constrained by the scope of research designs and regression models of the primary studies we meta-analyzed. Level 1 represented variability in regression models within the primary studies. Level 2 represented variability in research designs between the 25 primary studies.
In addition, we examined the fail-safe calculation for random effects meta-analysis models (Rosenberg, 2005). This method assists researchers in determining whether it is reasonable to ignore the possibility of publication bias because of the “file drawer” problem. In our case, this calculation indicated that approximately 79 more effect sizes of zero magnitude would have to be located for our estimate to be rendered not statistically significant.
Results
The results of the two-level hierarchical linear modeling model that analyzed the 98 regression effects nested within the 25 primary studies revealed that attending a racially segregated school has a statistically significant negative relationship to mathematics achievement. The overall effect size estimate from the unconditional model was −.069. This relationship, however, is moderated by the size of the sample in the study and by the way the independent variable was operationalized. The exact way in which this overall finding translates into differences in actual mathematics achievement varies depending on both the scaling of the achievement outcome variable in question and the variability of the minority concentration levels across a given group of schools.
The first step in the analysis estimated the unconditional model. We nested effect sizes within studies and included no Level 1 or Level 2 predictors. The z-transformed standardized mathematics coefficients served as the dependent variable. This model was constructed to estimate both the overall average effect size and the between- and within-primary-study variance components. The between-study variance component accounted for 59.03% of the variance among the z-transformed coefficients. The within-study variance component accounted for 40.97% of the variance among the z-transformed coefficients. The effect size estimate of −.069 represents the average z-transformed value once the nesting within the primary study was considered and therefore differs slightly from the value reported in Table 4. The average z-transformed value when converted back into the standardized beta weight scaling was also −.069.
All Level 1 predictor variables were entered as group mean centered to create intercept values that were equivalent to within-study mean effect size values. In the Level 1 model (see Table 5), sample size was a statistical significant predictor of effect size magnitude, t(87) = 3.253, p = .002. Larger sample sizes tend to yield larger (less negative) effect sizes. Note that this table intentionally included more decimal places than the rest of the tables to more fully illustrate the value of some of the smaller coefficients. Given the scaling of some of the predictor variables, very small coefficients can be statistically significant even when they would round to a value of zero at three decimal places.
Predictors of effect size magnitude
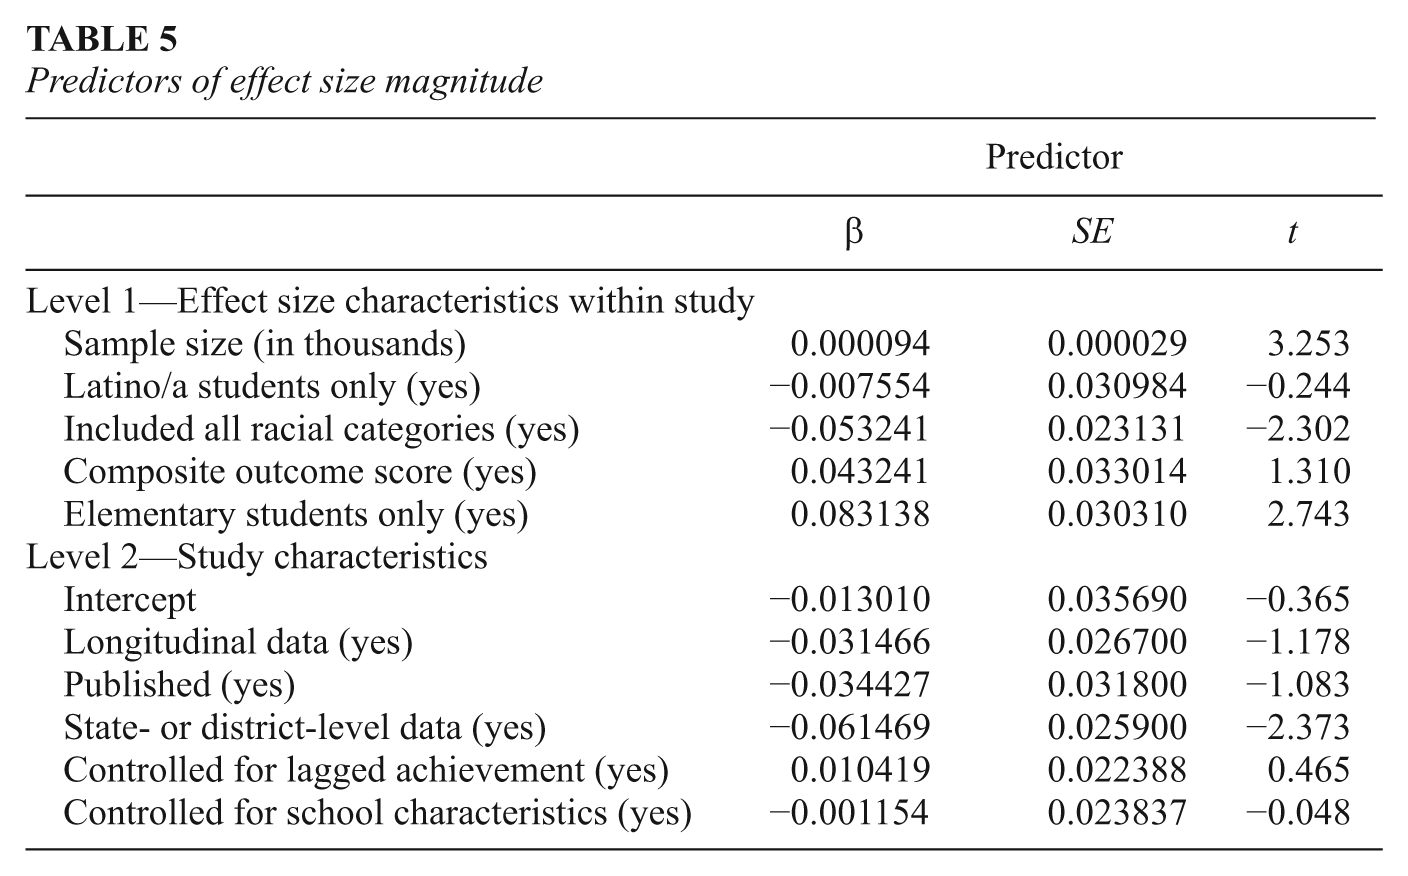
Coefficients from models that used an independent variable that represented the overall concentration level of all minority racial groups tended to be smaller in magnitude (more negative) than those that were specific to a single racial group, and this relationship was statistically significant, t(87) = −2.302, p = .024. Coefficients from models that used elementary students tended to be larger (less negative), and this relationship was also statistically significant, t(87) = 2.743, p = .008. The Level 2 model reveals that coefficients from studies that used state- or district-level data tended to be smaller in magnitude (more negative) than those that used school-level data, and this relationship was statistically significant, t(87) = −2.373, p = .028.
Table 6 includes both the z-transformed and the beta weight scaling values. The two types of estimates are very similar given that the Fisher’s z transform method has very little impact on small values. The overall average effect size was also estimated by weighting the effect sizes according to the method for random effects models (Rosenberg, 2005). This value was −.063, illustrating that sample size of the primary study in this case does not affect the effect magnitude in this sample. Most of the primary studies in this synthesis were longitudinal and published, and the estimate for such studies (−.064) did not vary substantially from the overall estimate. The results of the multilevel model were then used to estimate the effect sizes that included each of the model predictor variables. We employed the average sample size across the effect sizes to make these estimates.
Model-based effect size estimates
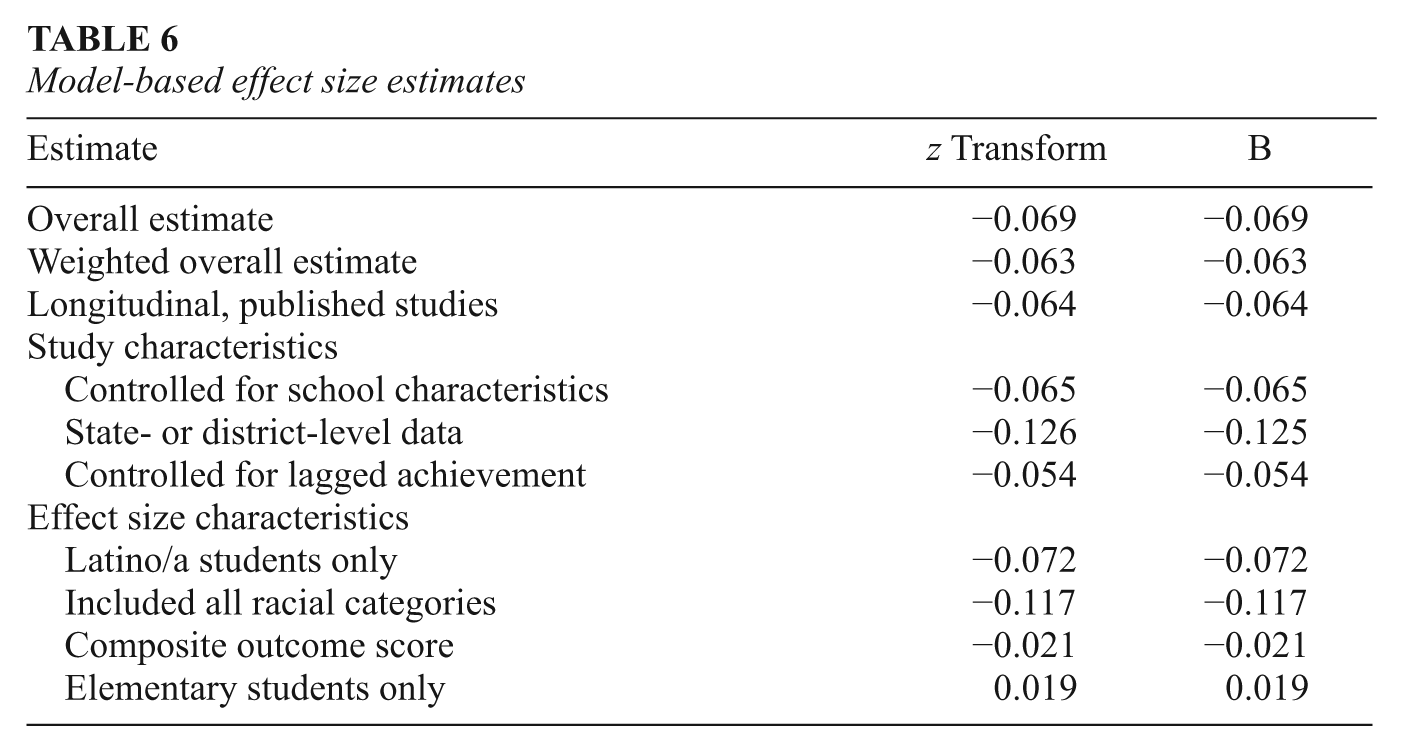
The final model estimated that studies adjusting for school-level characteristics did not yield substantially different effect sizes than the overall estimate (−.065). The model estimated that primarily studies that used state- or district-level data yielded effect sizes that were larger in absolute value (−.126) than studies that used national-level data. The model also estimated that studies that included all racial groups in the minority concentration variable yielded effect sizes that were larger in absolute value (−.117) than studies that used only a single racial group in the minority concentration variable.
Discussion
The findings from our metaregression analysis indicate a statistically significant small negative relationship of school minority concentration with mathematics achievement. This finding is consistent with a preponderance of post-1990 studies that examined the association of school racial composition in relation to a host of educational outcomes in the United States (Berends & Peñalosa, 2010; Braddock & Eitle, 2004; Hallinan, 1998; Hanushek et al., 2009; Harris, 2006; Mickelson, 2008; Mickelson & Bottia, 2010; Mickelson & Nkomo, 2012; Southworth, 2010; Trent, 1997; Wells & Crain, 1994; Welner, 2006; but also see Rumberger & Palardy, 2005, and Van Ewijk & Sleegers, 2010b, for more recent articles that did not find this relationship).
Although the magnitude of the minority concentration effect appears to be small in absolute terms, it is important to appreciate that it is far from trivial in substantive terms. To illustrate how the findings of an overall effect of −.069 translate into a practical example, consider the following scenario. Suppose a large school system had an average school-level minority concentration of 40% and a between school standard deviation of 10% points, and the achievement test score of interest was scaled according to the same scaling commonly used by tests such as the SAT and GRE, a mean of 500 and a standard deviation of 100. Under these conditions, the results of this study would lead us to expect a difference of approximately 7 points in average test scores between two schools that were one standard deviation apart in minority concentration level. One could expect, for example, a school with 40% minority students to have a schoolwide average score on such a test of, say, 500, a school with 50% minority students to have an average score of 493, and a school with 60% minority students to have an average score of 486. Hypersegregated schools, such as those with 90% to 100% disadvantaged minority student populations, could have average scores between 465 and 458.
Uncovering the mechanisms underlying the negative association between racial segregation and mathematics outcomes is beyond the scope of this article. The broader literature on the topic offers a variety of possible explanations. Harris (2010) proposed a taxonomy that distinguishes economic, sociological, and psychological theories based primarily on whether students are hypothesized to change each other’s beliefs and values (direct influences) versus more indirect influences, such as the allocation of teachers and school resources. Theories of peer effects illustrate the direct influences Harris hypothesizes. The large literature on peer influences suggests that attending school with advantaged peers has a positive impact on all students, although low-income minority students benefit more than middle-class and White students. Harris proposed a theory that peer effects are driven partly by “group-based contagion” (Harris, 2010, p. 1189) in which students follow the leads of their classmates (as in the epidemic theory), but especially those classmates who belong to the same group. Group identity might be based on race, SES, or other factors. The reference to “group” in the theory’s name also suggests the possibility that the groups themselves interact with one another. The inclusion of “contagion” in the theory’s title implies that this new theory is rooted in the older epidemic/contagion model, which implies further that peers influence one another’s beliefs and values more than they function as service providers or instruments. The group-based contagion theory allows for multiple groups with which individuals identify and therefore serve as relevant peer groups.
The Charlotte-Mecklenburg School District (CMS), once widely recognized as a successfully desegregated system, offers an example of the indirect effects of segregation operating primarily through teacher quality, a crucial school resource. Jackson (2009) examined the effects of changing school racial composition on teacher quality in the CMS. The federal court’s 2002 unitary decision and the district’s return to a neighborhood school-based assignment plan (Mickelson, Smith, & Southworth, 2009) triggered the rapid resegregation of that school system. The reshuffling of students resulting from the end of court-mandated desegregation provided a unique natural experiment to investigate the relationship between changes in school racial composition and changes in teacher quality that are not confounded with other changes in school or neighborhood characteristics. Using districtwide data from before and after unitary status, Jackson found schools that had a large influx of Black students also experienced a decrease in various measures of teacher quality. Jackson concluded resegregation caused better qualified teachers to transfer to more racially diverse suburban schools.
The substantive implications of interschool variations in teacher quality for the racial gaps in school mathematics outcomes are stark. Chetty, Friedman, and Rockoff’s (2011) teacher value-added study of the mathematics outcomes of 2.5 million students from a large urban school district between 1988 and 2009 indicated students with top teachers have better short- and long-term academic outcomes than students with poorer quality teachers. Although teacher value-added studies like theirs are controversial (Baker et al., 2010), they demonstrate the importance of better qualified teachers for student performance.
We examined the robustness and generalizability of the findings of the present study in several ways. First, we calculated the overall average across the multiple effect sizes in the study (−.063). Next, we examined the model estimated value from the random effects multilevel model (−.069). Then we created the weighted effect size according to the method for random effects models (−.063; Rosenberg, 2005), and finally we specified the average effect for only those with the most methodologically rigorous designs, that is, from longitudinal and published studies (−.064). This process made it clear that our findings remained very consistent across the methods, even when treating each effect size equally, accounting for the varying sampling variances of the effect size estimates, considering the nesting of effects within studies and the between and within effect size variances, and restricting the sample to only the most rigorous designs.
We caution readers to avoid interpreting effect magnitude according to simple rules of thumb regarding what constitutes small, medium, and large effects. The classic case of a small and seemingly trivial effect that has high-stakes implications for policy involves the difference in the rate of heart attacks between participants in the placebo condition and those taking small doses (81 mg tablets) of aspirin. The resulting effect size is .07 standard deviation units, but it translates into a substantial number of lives saved (34 out of 1,000) and therefore has changed clinical practice (Cooper & Hedges, 1994; Hattie, 2009; Rosenthal & DiMatteo, 2001). The specific benchmarks against which an effect can be meaningfully evaluated are context dependent. The nature of the effect, the sources of variability in effects, the target population, the nature of the outcome measures, and the policy decisions that could potentially be informed by estimates of the effects in question are all relevant factors when making such an evaluation (Hill, Bloom, Black, & Lipsey, 2008; Lipsey, 1990).
Specifically, Hill et al. (2008) argued that effect sizes related to achievement gaps should be interpreted relative to the size of the gap under investigation. For example, the multiple sources of variability in student achievement scores (family demographic factors, community context and resources, student motivation factors, school resources, teacher quality, etc.) have to be considered when evaluating influences on achievement gaps, which themselves have been shown to vary across school systems and grade levels (Hill et al., 2008). The effect size estimate from this study, specific as it is to building-level racial composition, can be meaningfully interpreted only relative to the size of mathematics achievement gaps by racial subgroups and the portion of those gaps that can be attributed to a host of school contextual and public policy-related factors.
Moreover, and perhaps more important, students who attend schools with high concentrations of disadvantaged minority peers experience the ill effects of segregation in relation to their mathematics performance year after year. Our results indicate that the effect of attending segregated minority schools becomes more pronounced as students move through elementary to secondary school. Just as the benefits of having a good teacher deepen over the course of a student’s educational career (Chetty et al., 2011) and the positive effects of cooperative learning increase with students’ grade level (Hattie, 2009), the ill effects of the negative association between racial segregation and mathematics outcomes likely compound as students move from elementary through high school. In fact, we believe that our finding that the elementary school association of minority concentration is weaker than it is in secondary school reflects precisely this dynamic: the disadvantages of math learning in segregated schools intensify as students move through the grades. Although it may be reasonable to draw this inference, our interpretation of the findings is offered with caution for two reasons. First, all of the statistics in our primary studies’ tables are about groups and not individuals. We do not have any information about the variability of the effect sizes for individual students. Second, the interpretation is only indirectly supported by the data we have available as we were not able to include studies that tracked the regression effects over time for the same cohort of students.
Our findings also indicate that studies with larger sample sizes yielded regression coefficients that were larger, that is, less negative than studies with smaller sample sizes. The model also estimated that studies that included all racial groups in the minority concentration variable yielded effect sizes that were larger in absolute value (−.117) than studies that used only a single racial group in the minority concentration variable. These findings may seem unusual at first glance. However, when the potential for restriction of range is considered, they appear to be more readily interpretable. Statistics from the Common Core of Data from NCES (2012) reveal that when larger samples such as statewide data or data from very large school systems are used, the data are more likely to represent the full range of variability in school-level racial composition. This is evident in both the range and standard deviation statistics. However, smaller samples, from small districts or more confined geographic areas, are more likely to yield restricted ranges of racial concentration levels, smaller standard deviations, and therefore attenuated regression coefficients. A similar argument can be made for statistics that describe the concentration levels across multiple minority groups. As can be seen from these examples, when percentages are combined across racial subgroups there will be much less chance of restriction of range, larger standard deviations, and thus less attenuation of the regression coefficients.
Limitations and Future Research
This study faces a number of limitations, each related to the others. First, the metaregression analysis does not permit an examination of optimal ranges of ethnic and racial diversity. Narrative syntheses, like the one conducted by Mickelson and Bottia (2010), or the handful of studies of mathematics outcomes and school composition that also examine critical ranges for diversity (Brown-Jeffy, 2008; McNalley, 2005; Schiff, Firestone, & Young, 1999; Southworth, 2010) report that diverse schools within certain ranges are not only better learning environments than segregated minority high-poverty schools, but are comparable or in some cases superior to racially segregated low-poverty White schools. This kind of more nuanced examination of minority composition and mathematics outcomes is not possible with meta-analysis. Thus, it is not appropriate to interpret the finding of an overall effect size of −.069 as suggesting that, ceteris paribus, schools with fewer minority students are likely to produce higher mathematics achievement.
Second, the relatively modest number of effect sizes (N = 98) from the small number of primary studies (N = 25) restricted the possible number of Level 1 effect size characteristics and Level 2 study characteristics that could be modeled in this metaregression analysis. Although we coded many more characteristics for both the study and effect size (see Appendix A), we were forced to select a subset of characteristics to model from the overall greater number of characteristics that we had coded. It is likely that our efforts to elaborate on the relationships between school composition and mathematics outcomes do not capture all the mediating factors at play. Future meta-analyses that employ more studies will permit more sophisticated models to be tested.
A third limitation is actually the source of the second one: The modest number of studies employed in the meta-analysis raises the possibility that the findings suffer from the influence of sampling error. Future meta-analyses with larger number of studies are needed to make sampling error less likely as an explanation for findings. A greater number of studies and effect sizes would likely result in more stable estimates of the effects under investigation. With a larger number of contributing studies, it may also be possible to incorporate weighting by study precision (the inverse of the standard error of the effect sizes) into the analyses.
A fourth limitation involves the several difficulties inherent in attempting to capture the effects of SES on achievement when it is operationalized as free and/or reduced lunch status as is the case with a portion of the studies we meta-analyzed. The uneven manner by which the construct of SES was operationalized across the primary studies complicates interpretations of the role of SES in mathematics outcomes. In addition, although it is conceptually and methodologically possible to separate SES from race, the reality that the two social forces are closely correlated requires researchers to pay special attention to claims regarding SES effects net of race effects. Nevertheless, although we acknowledge that race and SES are confounded in society as well as in social science research, we maintain that they are discrete—albeit correlated—social forces. It is possible to measure each factor’s contributions to outcomes (even factoring in the measurement problems with FRL), especially given the sophisticated statistical tools utilized by the primary studies’ authors.
A fifth limitation of this research arises from the diverse and often incompatible approaches to investigating racial compositional effects on mathematics outcomes. Meaningful research synthesis assumes that primary studies used outcome measures that are reliable, valid, and culturally sensitive. When using primary studies that include state and local accountability measures as their outcome measures, it is difficult to determine how well this criterion is met. Although we are not calling for standardization of measurement, we are suggesting that standardization for reporting results in quantitative studies—especially the provision of means, standard deviations, and N values for all subgroups discussed in a study—will facilitate other meta-analysts in their attempts to synthesize across disparate studies. We had to reject a number of primary studies that otherwise met the inclusion criteria because we could not obtain the relevant descriptive statistics necessary to standardize regression coefficients for all subgroups for whom results were reported.
Finally, it is important to note that the primary studies that we summarized in this effort used only linear models of the associations between concentrations of minority students and mathematics outcomes. In the future, researchers may wish to examine curvilinear models to evaluate whether there are unique effects for hypersegregated minority, majority, or completely integrated schools that extend beyond a simple linear pattern.
Conclusions and Policy Implications
The article’s findings are pertinent to the intersection of three features of U.S. schools that are targets of current reform efforts aimed at improving outcomes for all students. The first feature is the overall mediocre mathematics performance of U.S. students and the persistent racial and SES gaps in mathematics outcomes that grow larger as students move from elementary through high school. The second key aspect is the growing diversity of the student population attending these schools. The proportion of the U.S. student population from advantaged backgrounds, who tend to score well in mathematics, is shrinking relative to the proportion of students from less advantaged backgrounds, who are less likely to perform well. The third area is the return of racial resegregation after several decades of desegregation, especially in the South. The resegregation of public schools results in the increased likelihood that students from disadvantaged families will attend schools primarily with each other.
If the growth in concentrated minority schools is not relevant to our nation’s overall mathematics performance and to persistent racial gaps in educational outcomes, then the trend toward greater school racial segregation is a diversion from the genuine sources of the mathematic performance predicament. However, if racial isolation is a factor in creating and maintaining the gaps, the nation’s failure to address this trend will be problematic for any other reform’s likely success—just as failing to seal all sides of a window against the winter’s wind makes other efforts to raise a room’s temperature far less efficient.
The results of this metaregression analysis suggest that minority concentration has a small statistically significant negative association with mathematics outcomes. Results indicate that the effect is larger in magnitude as students move from elementary through high school. One reasonable interpretation of this finding is that over time the impact of attending segregated schools on mathematics outcomes builds as each year students who attend segregated minority schools fall more behind their otherwise comparable peers who learn mathematics in more racially diverse schools. We offer this interpretation with caution for two reasons. First, we do not have any information about the variability of the effect sizes for individual students, and, second, our interpretation is only indirectly supported by the data we have available.
The small size of the minority concentration coefficient should not be interpreted to mean that the effects of segregation are substantively trivial. The relevance of this small effect size must be considered from the perspective of a student’s educational trajectory. When we consider that the effects of the negative association between mathematics performance and attending schools with high minority concentrations likely compound over time, that Latino/a and Black students are the students most likely to attend schools with extremely high concentrations of disadvantaged minority youth, and that the percentage of Latino/a and Black students performing below proficiency increases with each grade level, the likely substantive consequences of even the modestly sized negative coefficient are cast into sharper relief.
Until the last decade of the 20th century, social science research about the effects of school racial composition on mathematics performance produced mixed results. This article’s findings contrast with those of earlier examinations of this topic because we draw on research that appeared since the 1990s. The 1990s marked the wider dissemination of research that used advanced statistical methods with high-quality large-scale data sets from nationally representative samples or statewide populations, all of which permitted researchers to avoid many of the methodological shortcomings found in earlier studies (Bradley & Bradley, 1977; Cook, 1986; Linn & Welner, 2007; Mickelson, 2008). This metaregression analysis relied on 25 post-1990 methodologically sophisticated studies that employed advanced statistical techniques with high-quality survey data collected from representative samples (or in some cases state population data) that allowed the primary studies’ researchers to properly conduct fine-grained analyses, particularly of the extent to which the association between student mathematics achievement and school racial composition is mediated or moderated by other school, district, individual, or family factors.
The findings reported in this article are important for public policy because organizational arrangements of schools are, in theory, more amenable to change through policy choices than student-level factors such as motivation or aptitude, or family characteristics such as cultural norms, family structure, parental education, or income—all well-known contributing factors to mathematics outcomes. The findings reported in this article provide an empirical warrant for educators, policymakers, and parents to reconsider the possible benefits of creating schools with diverse groups of students learning mathematics together. As Kirp (2012) observed, “Amid the ceaseless and cacophonous debates about how to close the achievement gap, we’ve turned away from one tool that has been shown to work: school desegregation” (p. SR1).
Addressing the various shortcomings in U.S. student performance in mathematics is the imperative for individual and societal advancement. Mathematically competent people are needed for the science, technology, and engineering jobs that are growing at rates three times that of many other occupations (National Science Board, 2004). The combination of an increased demand for technologically knowledgeable workers and a decrease in their supply will stress America’s ability to sustain a workforce of satisfactory scale and quality to meet the population’s demands for jobs and the economy’s needs for employees (U.S. Department of Education, 2008). More important, numeracy is necessary for informed membership and full participation in a democratic society (Moses & Cobb, 2001). Contemporary citizens must understand mathematical and scientific issues that are essential aspects of public policy. The financial crisis that began in 2007, the British Petroleum oil spill that defiled the waters in and near the Gulf of Mexico, and debates about economic recovery, debt, deficits, climate change, and health care reform require informed public policy responses and a thorough public discussion that can take place only among knowledgeable members of society who are numerate and have a working understanding of the principles of science and scientific research (Committee for Economic Development, 2004).
The findings from this metaregression analysis are potentially important for the judiciary, education policymakers, and practitioners who use empirical research in their deliberative processes (not all do, of course). As recently as the 2007 Parents Involved in Community Schools v. Seattle School District No. 1 case involving voluntary desegregation in Seattle, Washington, and Louisville, Kentucky, the chief justice of the Supreme Court referred to the debate among social scientists on precisely this question. He wrote that the inconsistent social science literature does not support the contention that integrated schools are a compelling state interest. Twenty-four years earlier Rossell (1983) presciently commented that with regard to desegregation research, “the ill effects of poor information lead to confusion, uncertainty, and bad decisions by the policymakers, lawyers, judges, educators, and citizens who utilize the incomplete information” (p. 69).
Of importance, in Parents Involved five of the nine justices reaffirmed the goals of promoting integration and avoiding racial isolation in K–12 education as compelling government interests (Ryan, 2007). The Supreme Court decision in Parents Involved provides educators and policymakers with the legal imprimatur to act on the policy implications of the findings reported in this article. Although the decision struck down specific elements of voluntary integration plans in Seattle and Louisville, a majority of the Court indicated support for a wide range of measures to promote school integration so long as they do not assign students based on their individual race. Justice Kennedy’s controlling opinion mentioned several constitutionally permissible strategies to create diverse schools, including strategic sitting of new schools and targeted recruitment of faculty and students. In addition, in December 2011 the U.S. Department of Justice and the U.S. Department of Education jointly issued a statement of guidance for K–12 school districts that wish to pursue policies that promote diversity and reduce racial isolation in public education (Ali & Perez, 2011).
Integrated education is consistent with principles of democracy, justice, and fairness (Anderson, 2010; Dewey, 1916/1944; Parents Involved, 2007). This study suggests integrated education also is a school organizational characteristic that can foster higher mathematics performance. Students who attend integrated schools are more likely to score higher on mathematics achievement tests compared to those who attend racially segregated minority schools. The higher students perform in mathematics, the more rigorous the courses they subsequently take and the more likely they are to go to college and to succeed in a science, technology, engineering, or mathematics majors. To the extent that the overall mathematics performance of U.S. students is enhanced and racial gaps in K–12 mathematics achievement are narrowed through the avoidance of racially segregated minority public schools, there is also a practical aspect to integrated education.
Footnotes
Appendix A
Appendix B
Characteristics of otherwise eligible studies not included
| # | Reference | Reason for Noninclusion | Result Regarding Racial Composition |
|---|---|---|---|
| 1 | Bali, V., & Alvarez, M., “The Race Gap in Student Achievement Scores: Longitudinal Evidence from a Racially Diverse School District,” Policy Studies Journal, 32(3): 393–415, 2004. | Lacks descriptive statistics for math scores | Racial diversity in schools positively affects Black students’ math achievement, as racial diversity increases in schools, mathematics outcomes do as well |
| 2 | Borman, K., Eitle, T., Michael, D., Eitle, D., Lee, R., Johnson, L., . . . Shircliffe, B., “Accountability in a Postdesegregation Era: The Continuing Significance of Racial Segregation in Florida’s Schools,” American Educational Research Journal, 41(3): 605–634, 2004. | DV is inappropriate (% of students passing math & reading) | Racial segregation negatively affects mathematics performance |
| 3 | Burke, M., & Sass, T., Classroom Peer Effects and Student Achievement. Boston: National Center for Analysis of Longitudinal Data in Education Research, Working Paper 18, 2008. | DV is gain scores | Found no significant race effect, although according to authors, racial composition likely still mattered for outcomes, but either their sample size or the nature of their data could not capture the effects of school composition |
| 4 | Callahan, R., Wilkinson, L., Muller C., & Frisco, M., “ESL Placement and Schools: Effects on Immigrant Achievement,” Educational Policy, 23(2): 355–384, 2009. | Key IV is inappropriate (ESL placement) | High concentrations of immigrants have an indirect effect on math outcomes through greater likelihood of ESL program placement, which itself positively affects mathematics achievement |
| 5 | Chubb, J., & Moe, T., Politics Markets & America’s Schools. Washington, DC: Brookings Institution, 1990. | Lacks necessary descriptive statistics | No significant relationships between racial composition and achievement |
| 6 | Covay, E., Composition Matters: The Relationship Between Race and School Composition in Explaining the Black–White Gap. Paper presented at the annual meeting of the American Sociological Association, Boston, MA, 2008. | DV is inappropriate (highest math course taken) | Racial segregation negatively affects likelihood of taking a higher-level math course. |
| 7 | Crosnoe, R., “The Diverse Experiences of Hispanic Students in the American Educational System,” Sociological Forum, 20: 561–588, 2005. | DV is inappropriate (student profile) | Racial segregation negatively affects Latino/a achievement in mathematics |
| 8 | Entwisle, D., & Alexander, K., “Summer Setback: Race, Poverty, School Composition, and Mathematics Achievement in the First Two Years of School,” American Sociological Review, 57: 72–84, 1992. | DV is inappropriate (average gain) | Blacks who attended segregated schools gained less than Blacks and Whites who attended integrated schools. |
| 9 | Glenn, W., “Separate But Not yet Equal: The Relation Between School Finance Adequacy Litigation and African American Student Achievement,” Peabody Journal of Education, 81(3): 63–93, 2006. | Lacks information (sample size) | Racial segregation negatively affects mathematics performance |
| 10 | Goddard, R., Salloum, S., & Berbitsky, D., “Trust as a Mediator of the Relationships Between Poverty, Racial Composition, and Academic Achievement: Evidence From Michigan’s Public Elementary Schools,” Educational Administration Quarterly, 45(2):292–311, 2009. | Key IV is inappropriate (trust) | The negative relationship between school SES and racial composition and achievement is mediated by trust |
| 11 | Goldsmith, P., “All Segregation Is Not Equal: The Impact of Latino and Black School Composition,” Sociological Perspectives, 46(1): 83–105, 2003. | Lacks information (descriptive statistics for the entire sample) | Racially diverse schools offer more students the chance to excel in math than either racially isolated White schools or isolated minority schools |
| 12 | Hanushek, E., & Raymond, M., Does School Accountability Lead to Improved Student Performance, NBER Paper No. 10591, 2004. | DV is inappropriate (growth at the state level) | Minority concentration has a negative effect on mathematics achievement |
| 13 | Hanushek, E., & Rivkin, S., “Harming the Best: How Schools Affect the Black–White Achievement Gap,” Journal of Policy Analysis and Management, 28(3): 366–393, 2009. | Author suggested just including the other version of the study | Minority concentration has a negative effect on mathematics achievement |
| 14 | Hanushek, E., & Rivkin, S., School Quality and the Black–White Achievement Gap, NBER Paper No. 12651, 2006. | Duplicate of Hanushek, Kain, & Rivkin (2009), which is already included | Minority concentration has a negative effect on mathematics achievement |
| 15 | Harris, D., Lost Learning, Forgotten Promises—A National Analysis of School Racial Segregation, Student Achievement, and “Controlled Choice” Plans, Center for American Progress, 2006. | DV is inappropriate (second-year test score level for Blacks/Hispanics in school) | Racial diversity in schools positively affects Black students’ math achievement |
| 16 | Hoffer, T., “Middle School Ability Grouping and Achievement in Science and Mathematics,” Educational Evaluation and Policy Analysis, 14(3): 205–227, 1992. | IV is inappropriate (SES is included but not race) | n/a |
| 17 | Johnson, K., Comparing Math Scores of Black Students in D.C.’s Public and Catholic Schools, Heritage Foundation, Center for Data Analysis Report No. 99–08, 1999. | IV is inappropriate (SES is included but not race) | n/a |
| 18 | Lee, V., & Smith, J., “Effects of School Restructuring on the Achievement and Engagement of Middle-Grade Students,” Sociology of Education, 66: 164–18, 1993. | IV is inappropriate (SES is included but not race) | n/a |
| 19 | Lee, V., Smith, J., & Croninger, R., “How High School Organization Influences the Equitable Distribution of Learning in Mathematics and Science,” Sociology of Education, 70(2): 128–150, 1997. | DV is inappropriate (gains in grades) | Evidence of some negative effects of high minority-composition schools and low-average SES schools on achievement |
| 20 | Lee, V., Croninger, R., & Smith, J., “Course-Taking, Equity, and Mathematics Learning: Testing the Constrained Curriculum Hypothesis in U.S. Secondary Schools,” Educational Evaluation and Policy Analysis, 19(2), 99–121, 1997. | Lacks necessary descriptive statistics | Although racial composition was important to outcomes, the effects were not statistically significant or they were inconsistent because racial effects were found to be expressed through SES compositional effects |
| 21 | Lleras, C., “Racial Concentration, and the Dynamics of Educational Inequality Across Urban and Suburban Schools,” American Educational Research Journal, 45(4): 886–912, 2008. | IV is inappropriate (grouped according to minority status of school) | Racial segregation negatively affects mathematics performance |
| 22 | Murnane, R., Willett, J., & McCartney, K., “Understanding Trends in the Black–White Achievement Gaps During the First Years of School,” Brookings-Wharton Papers on Urban Affairs, 97–135, 2006. | Lacks necessary descriptive statistics | Although racial composition was important to outcomes, the effects were not statistically significant or were inconsistent because racial effects were found to be expressed through SES compositional effects |
| 23 | Page, L., Murnane, R., & Willett, J., Trends in the Black–White Achievement Gap: Clarifying the Meaning of Within-and between-school achievement Gaps, NBER Paper No. 14213, 2008. | DV is inappropriate (gap in math scores) | Racial segregation has negative effects on math outcomes |
| 24 | Palardy, G., “Differential School Effects Among Low, Middle, and High Social Class Composition Schools: A Multiple Group, Multilevel Latent Growth Curve Analysis,” School Effectiveness and School Improvement, 19(1): 21–49, 2008. | IV is inappropriate (SES included but not race) | n/a |
| 25 | Payne, K., & Biddle, B., “Poor School Funding, Child Poverty and Mathematics Achievement,” Educational Researcher, 28(6): 7–15, 2000. | DV is inappropriate (districtwide average math achievement); IV is inappropriate (SES included but not race) | n/a |
| 26 | Portes, A., & Hao, L., “The Schooling of Children of Immigrants: Contextual Effects on the Educational Attainment of the Second Generation,” Proceedings of the National Academy of Sciences of the USA, 101(33): 11920–11927, 2004. | Lacks necessary descriptive statistics | Latino segregation has a positive effect on their mathematics achievement |
| 27 | Rumberger, R., & Palardy, G., “Does Segregation Still Matter? The Impact of Student Composition on Academic Achievement in High School,” Teachers College Record, 107(9): 1999–2045, 2005. | Analysis is inappropriate for current study (lacks a model with minority composition) | Although racial composition was important to outcomes, the effects were not statistically significant or they were inconsistent because racial effects were expressed through SES compositional effects |
| 28 | Rumberger, R., & Willms, J. D., “The Impact of Racial and Ethnic Segregation on the Achievement Gap in California High Schools,” Evaluation and Policy Analysis, 14: 377–396, 1992. | DV is inappropriate (impact of minority composition) | Racial segregation negatively affects their mathematics performance |
| 29 | Schiff, J., Firestone, W., & Young, J., Organizational Context for Student Achievement: The Case of Student Racial Compositions, Paper presented at the annual conference of the American Educational Research Association, Montreal, Canada, 1999. | Lacks necessary descriptive statistics | Racial segregation negatively affects mathematics performance |
| 30 | Sorhaindo, L., The Relationship Between Degrees of Poverty and Student Achievement, Dissertation, University of Miami, 2003. | IV is inappropriate (SES included but not race) | n/a |
| 31 | Southworth S., School Segregation and Equity: An Assessment of School Resource Allocation by School Race and Social Class Composition, Dissertation, University of North Carolina at Charlotte, 2008. | Key IV is inappropriate (RIW, RIM, RB; low, middle, high poverty) | Racially diverse schools offer more students the chance to excel in math than either racially isolated White schools or isolated minority schools |

Note. DV = dependent variable; ESL = English as a second language; IV = independent variable; RB = racially balanced; RIM = racially isolated minority; RIW = racially isolated White; SES = socioeconomic status.
Notes
Authors
ROSLYN ARLIN MICKELSON is professor of sociology, public policy, women and gender studies, and information technology in the Department of Sociology at the University of North Carolina at Charlotte, 9201 University City Blvd., Charlotte, NC 28223; e-mail:
MARTHA CECILIA BOTTIA is research assistant professor in the Department of Sociology at the University of North Carolina at Charlotte. Her research interests include the effects of school racial and socioeconomic composition on educational outcomes, the education of immigrant students, the impact of the implemented curriculum on a racial and socioeconomically diverse students, and the role of K–12 school structural characteristics on college STEM outcomes. In addition, she is interested in terrorist organizations and the illegal drug trade.
RICHARD LAMBERT is a professor in the College of Education at the University of North Carolina at Charlotte and director of the Center for Educational Measurement and Evaluation. His research interests include applied statistics, evaluation of educational programs for young children, and teacher stress and coping.
References
Supplementary Material
Please find the following supplemental material available below.
For Open Access articles published under a Creative Commons License, all supplemental material carries the same license as the article it is associated with.
For non-Open Access articles published, all supplemental material carries a non-exclusive license, and permission requests for re-use of supplemental material or any part of supplemental material shall be sent directly to the copyright owner as specified in the copyright notice associated with the article.
