



Abstract
High rates of attrition make it challenging for schools to provide qualified special education teachers for students with disabilities, especially given chronic teacher shortages. We synthesize 30 studies from 2002 to 2017, examining factors associated with special educator attrition and retention, including (a) teacher preparation and qualifications, (b) school characteristics, (c) working conditions, and (d) teacher demographic and nonwork factors. Most studies examined working conditions (e.g., demands, administrative and collegial supports, resources, compensation) among special educators who left teaching, moved to other positions, transferred to general education teaching, or indicated that they intended to stay or leave. The majority of researchers used quantitative methods to analyze national, state, or other survey data, while eight used qualitative methods. Our critique identifies both strengths and weaknesses of this literature, suggests research priorities, and outlines specific implications for policy makers and leaders.
A growing and pervasive shortage of special education teachers threatens the quality of education students with disabilities receive. In the United States, 49 states report shortages of special educators (National Coalition on Personnel Shortages in Special Education and Related Services, 2016), and enrollment in teacher preparation is lower than at any point since the National Center for Education Statistics (NCES, 2016) began collecting these data. Special education teacher shortages have existed in the United States at least since 1975, when PL 94-142 (the Individuals with Disabilities Education Act [IDEA]) was first passed. Although educational opportunities were available to some students with disabilities before 1975, this law mandated, for the first time, that public schools educate all students, thus contributing to a dramatic increase in demand for special educators (Dewey et al., 2017). Since then, demand for special educators has consistently exceeded the supply, yielding a pervasive, chronic national shortage (McLeskey & Billingsley, 2008). Projections indicate shortages are currently growing, particularly in high-poverty urban and rural schools (Levin, Berg-Jacobsen, Atchinson, Lee, & Vontsolos, 2015).
Special educator attrition is particularly problematic, as it exacerbates the shortage, leaving many districts in the unfortunate position of having to hire unqualified personnel and requiring that limited resources be directed toward recruitment and induction rather than longer term district initiatives (McLeskey & Billingsley, 2008). High-poverty schools bear the brunt of high turnover, reducing the likelihood that students with disabilities who live in poverty will be taught by highly qualified special educators (Levin et al., 2015).
The overall U.S. teacher attrition rate was 16% in 2012–2013, with 8% of teachers leaving the profession and 8% moving to other schools, a rate far greater than the 3% to 4% attrition rate in other high-achieving countries’ school systems (Carver-Thomas & Darling-Hammond, 2017). Halving the attrition rate would “virtually eliminate” the teacher shortage (Carver-Thomas & Darling-Hammond, 2017, p. 3). The overall attrition rate for special educators was slightly higher than that of teachers overall: 17.1% of special educators left their schools in 2012–2013, including 10.5% who moved to other schools and 6.6% who left teaching (Goldring, Taie, & Riddles, 2014). For the same school year, Carver-Thomas and Darling-Hammond (2017) compared special educators to all teachers and found special education teacher attrition was second only to English language development teachers and was 46% higher than elementary teachers. Boe, Cook, and Sunderland (2008) reported that although special and general educators left teaching at similar rates, special educators moved to other schools at higher rates than general educators (10.2% and 7.4%, respectively). However, these national rates mask dramatic differences across regions, states, and districts within the United States. For example, Sullivan et al. (2017) reported that special education–certified teachers left Texas schools at about twice the rate of other teachers.
Researchers in the United States have primarily examined two types of attrition: leaving teaching and moving to other schools, with few studying a third type, transfer of special educators to general education (Boe et al., 2008). All three types of attrition likely have negative effects. In addition to the challenge of replacing teachers who leave, attrition negatively affects student achievement by reducing the aggregated effectiveness of teachers in a school, and disrupting collaborative relationships, resulting in a negative effect on the effectiveness of teachers who remain (Ronfeldt, Loeb, & Wyckoff, 2013). Furthermore, replacing a teacher who leaves is expensive, with estimates ranging from $9,000 to $23,000 (Milanowski & Odden, 2007). Other costs include the loss of teachers knowledgeable about students, the community, and as well as the loss of collaborative relationships (McLeskey & Billingsley, 2008).
In addition, movement between schools is problematic, as patterns of movement disadvantage students of color and those living in poverty (Boyd, Lankford, Loeb, & Wyckoff, 2005). Carver-Thomas and Darling-Hammond (2017) found attrition was 50% higher in Title 1 1 versus non–Title 1 schools, and 70% higher in schools serving the most students of color versus those serving the fewest. Furthermore, highly effective new teachers tend to move from high- to low-poverty schools, exacerbating inequities in access to skilled teachers (Boyd et al., 2005; Goldhaber, Theobald, & Fumia, 2018). The effects of transferring from special to general education, in the same school, are unclear; special educators who transfer may positively affect students with disabilities in general education (Bettini et al., 2017), but teacher effectiveness declines after changing roles in a school, and underserved students are more often assigned to teachers who changed roles (Atteberry, Loeb, & Wyckoff, 2017; Hanushek, Rivkin, & Schiman, 2016).
Some attrition is appropriate, either because teachers are retiring or because they are not skilled (Adnot, Dee, Katz, & Wyckoff, 2016), but retirement and involuntary attrition account for only 18% and 14% of all attrition, respectively (Carver-Thomas & Darling-Hammond, 2017). Thus, 67% of attrition is voluntary, unrelated to retirement, and may be amenable to intervention.
Purpose of the Review
Given the imperative to retain special educators amid growing shortages, a systematic review of special education teacher attrition and retention research is needed. Prior reviews are dated (Billingsley, 1993, 2004; Brownell & Smith, 1993), as they were conducted before the implementation of national standards–based accountability requirements, which created new teacher qualifications and responsibilities (No Child Left Behind, 2001). This review synthesizes research investigating relationships between special educators’ attrition and retention and their (a) preparation and qualifications, (b) school characteristics, (c) working conditions, and (d) demographic and nonwork factors. We compare results for general educators when available.
We use the following terms and definitions to describe types of attrition: (a) leaving refers to leaving for nonteaching activities (e.g., employment outside of education, retirement, or taking care of children); (b) moving refers to taking another special education position in a different school; (c) transferring refers to changing from one teaching field to another (e.g., special to general education); and (d) intent refers to teachers’ plans to stay or leave, usually within a specified time frame (1–5 years). We use authors’ terminology when reporting their results, with our terms in parentheses. We use attrition when referring to multiple types (e.g., intent, leaving) or when we refer to attrition generally.
Method
Selection Criteria
We sought studies from 2002 to 2017, seeking studies since Billingsley’s (2004) review. We initially screened each study to assure it examined special educators’ attrition or retention.
Definition of Attrition
We included empirical studies in which one or more of the primary research questions or the abstract addressed special education teacher leaving, moving, transferring, or intent to stay or leave, and excluded studies in which attrition arose from a secondary inductive analysis (e.g., Mitchem, Kossar, & Ludlow, 2006). In addition, we included studies of intent to stay or leave since it has been correlated with actual leaving (Gersten, Keating, Yovanoff, & Harniss, 2001), and teachers who want to leave, but cannot, may put forth less effort (Jones, Youngs, & Frank, 2013). We included Jones et al.’s (2013) study of commitment, since they used a measure consistent with intent (e.g., “I would prefer to continue teaching in this school”; Jones et al., 2013, p. 371). We excluded studies that purported to be about attrition but lacked attrition findings. For example, Gehrke and Murri’s (2006) purpose was focused on attrition, but their findings were about special educators’ experiences, not attrition.
Special Education Teacher
We defined special educators as teachers with assignments in special education, including speech-language pathologists. Some studies examined attrition among other educators (e.g., paraprofessionals, general educators), and we included these only if special educators were the majority of the sample (Albrecht, Johns, Mounstevens, & Olorunda, 2009), or if they disaggregated special educators’ findings. For example, we excluded Clotfelter, Glennie, Ladd, and Vigdor (2005), because they aggregated special educators and math/science teachers; in contrast, we included their follow-up study (i.e., Clotfelter, Glennie, Ladd, & Vigdor, 2008) as it disaggregated special educators. We also included studies of other stakeholders’ (e.g., administrators) perspectives on attrition (e.g., Berry, Petrin, Gravelle, & Farmer, 2011).
Types of U.S. Schools
We only included studies in U.S. schools, given variability in national policy contexts and approaches to special education. Countries differ in (a) the characteristics of students served in special education, (b) where students are taught (inclusive vs. segregated schools; UNESCO, 2018), and (c) how teachers are recruited and compensated (Darling-Hammond, Wei, Andree, Richardson, & Orphanos, 2009). These different contexts and factors likely influence teacher attrition. In the United States, we included teachers in public, private, special education, and charter schools, but not preschools, residential, hospital, wilderness, or juvenile justice settings (e.g., Houchins, Shippen, & Cattret, 2004).
Methods and Rigor
We included studies regardless of methodology and rigor, but we identify strengths and weaknesses in our critique, and we take these into account when drawing conclusions. We excluded studies that did not report sufficient methodological detail to judge reliability and generalizability (quantitative studies), or trustworthiness and credibility (qualitative, mixed methods studies). For example, we excluded a qualitative study by Nance and Calabrese (2009) because there was insufficient detail about sampling and analytic processes.
Type of Literature
We focused on peer-reviewed studies, but to reduce publication bias (Gage, Cook, & Reichow, 2017), we included grey literature (e.g., foundation reports) if data collection, analytic processes, and findings were included (i.e., Feng & Sass, 2017). We excluded unpublished work, except for Gilmour and Wehby (in press), as it received a national award.
Search Procedures
We used a multiple-gated search process to identify studies. Table 1 identifies the number of articles identified in the initial search and those meeting inclusionary and exclusionary criteria.
Search strategy and yield

After applying inclusion and exclusion criteria.
Electronic Search
We conducted a systematic search of the following databases in September 2017: Academic Search Complete, Business Source Premier, Education Full Text, ERIC, PsycINFO, and the Psychology and Behavioral Sciences Collection. Search terms included all combinations of the terms: (a) attrition (and related terms: retention, commitment, satisfaction, career intentions, career plans, intent to leave, intent to stay, mobility) and (b) special educat* (and related terms: students with disabilities). This yielded more than 18,000 articles that used some combination of the specified terms, after exact duplicates were removed.
We exported the title and abstract of each article into an Excel file, coding each article as either possibly or not meeting criteria. We erred on the side of obtaining false positives; for example, studies examining teacher attrition were coded as possibly meeting criteria, even if abstracts did not mention special educators. This yielded 166 studies that possibly met criteria. Each author independently examined the abstract and methods sections of the 166 articles. We made final decisions by consensus, referring to our inclusionary and exclusionary criteria to discuss and resolve discrepancies. This step yielded 25 studies that met inclusion criteria.
Additional Search Efforts
Searching specific journals
Given that educational policy researchers study attrition, we searched the table of contents of specific policy journals (i.e., Educational Evaluation and Policy Analysis, Educational Policy, and Education Finance and Policy), finding no additional papers. We searched two websites that publish working education policy papers (i.e., Center for Analysis of Longitudinal Data in Education Research, National Bureau of Economic Research), which yielded one working paper (Feng & Sass, 2017). Because we only found one paper about teachers of color (López-Estrada & Koyama, 2010), we searched the table of contents of Multiple Voices, a relevant, unindexed journal, yielding no studies.
Ancestral and progeny searches
We completed an ancestral search of the reference list in each study that met our criteria, and we found one additional study (Luekens, Lyter, Fox, & Chandler, 2004). Next, we completed a progeny search, reviewing titles and abstracts for the 709 studies referencing Billingsley’s (2004) review and found no additional studies meeting criteria.
Professional contacts
We identified three additional studies through professional contacts (Carver-Thomas & Darling-Hammond, 2017; DeAngelis & Pressley, 2011; Gilmour & Wehby, in press).
Data Analysis
We analyzed results using four phases. First, we created two- to three-page holistic summaries of each article, using an outline to summarize the following aspects of each study (i.e., research questions/purposes, definition of attrition, theoretical framework, methods, results, key quotes, and a study critique). Second, we developed analysis tables to carefully examine studies’ findings related to four factors: (a) teacher preparation and qualifications, (b) school characteristics, (c) working conditions, and (d) teacher demographics and nonwork factors. We identified these factors based on both prior attrition literature reviews (e.g., Billingsley, 2004; Borman & Dowling, 2008; Guarino, Santibañez, & Daley, 2006) and emerging findings from the present literature. Third, we identified subthemes for each of the four themes through thematic analyses, making decisions through discussions and working toward consensus over time (these appear as subheadings in the results). Fourth, we collaboratively reviewed and discussed initial drafts of the findings in a series of meetings over approximately 9 months, reviewing tables and drafts prior to meetings and “interrogating” each other by questioning interpretations to assure accuracy and completeness. This process was recursive, as we revised sections many times. We engaged in ongoing rereading of the methods and results of the 30 studies, checking them against our drafts and Table 2. Although each author drafted specific sections, both authors contributed substantially to each section of the article.
Attrition/retention studies by factors, methodological approaches, data sources, and samples
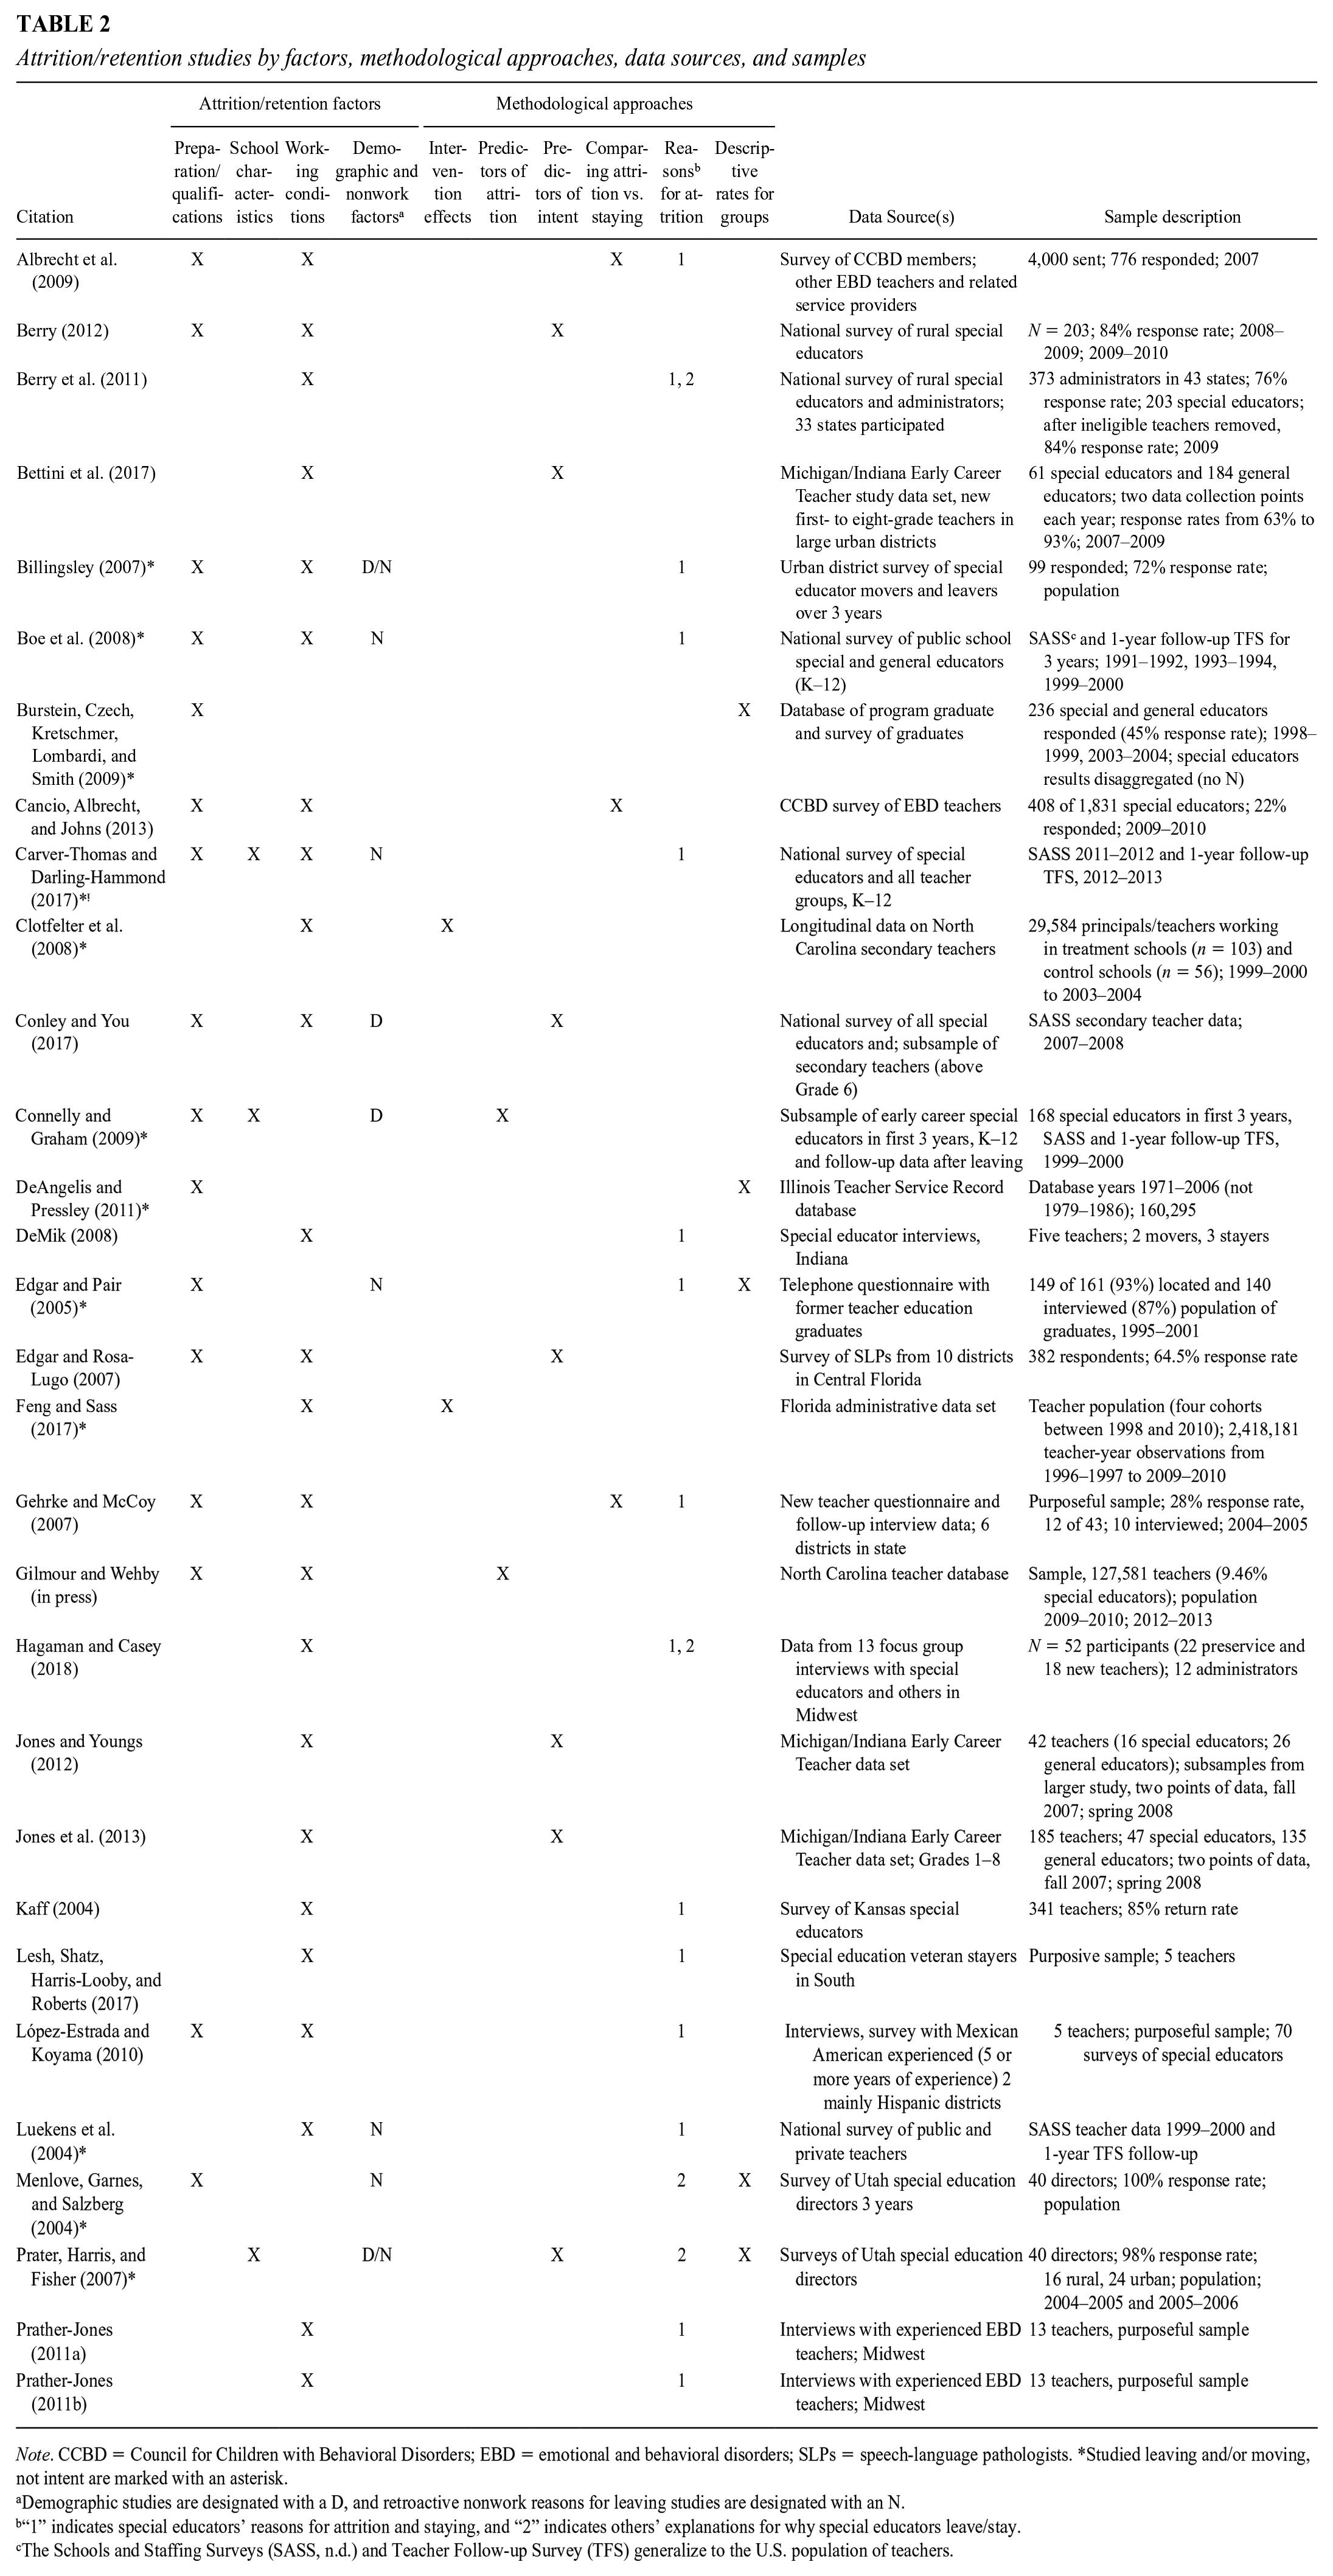
Note. CCBD = Council for Children with Behavioral Disorders; EBD = emotional and behavioral disorders; SLPs = speech-language pathologists. *Studied leaving and/or moving, not intent are marked with an asterisk.
Demographic studies are designated with a D, and retroactive nonwork reasons for leaving studies are designated with an N.
“1” indicates special educators’ reasons for attrition and staying, and “2” indicates others’ explanations for why special educators leave/stay.
The Schools and Staffing Surveys (SASS, n.d.) and Teacher Follow-up Survey (TFS) generalize to the U.S. population of teachers.
Results
We first provide a brief context for special education teachers’ work in the United States, to provide background relevant to understanding the research results. Next, we provide an overview of special education teacher attrition research, identifying factors studied, theories and frameworks used, methodological approaches, data sources, and samples (see Table 2). Finally, we synthesized results for each of the four major contributors to attrition, synthesizing what is known across the four themes, including drawing conclusions and identifying research needs.
The Context of Special Teachers Preparation and Work
In the United States, special educators are prepared to teach students in one or more of the 13 disabilities identified in IDEA (2004; e.g., specific learning disability, intellectual disability, hard of hearing). Special education licensure (i.e., certification) is typically comprehensive, from Grades K to 12 and there has been a clear trend toward noncategorical licensure since 2000 (Sindelar, Fisher, & Myers, 2019), allowing districts flexibility in assigning special educators to teach students with varied disabilities. Initial licensure requirements vary, with some states requiring “stand-alone special education” licensure, while others require an initial “general education licensure with, or prior to special education” licensure (Blanton, Boveda, Munoz, & Pugach, 2017, pp. 80–81).
The organization of special education instruction in K–12 schools also varies, with some teachers serving students identified with one disability (e.g., learning disabilities), while others teach students in cross-categorical programs, serving students identified with varied disabilities (e.g., Gehrke & McCoy, 2007). In addition, special educators’ teaching assignments vary based on the service delivery models adopted in their schools. For example, some special educators work primarily in inclusive settings, co-teaching with general educators (Scruggs, Mastropieri, & McDuffie, 2007). Others teach in resource or push-in models, providing small-group instruction in special or general education settings, respectively (Mitchell, Deshler, & Lenz, 2012), or a combination of these models (e.g., Kaff, 2004). A smaller percentage work in self-contained classrooms or special schools. These teachers typically provide instruction in all content areas to a small group of students with substantial learning and/or behavioral needs (Bettini, Wang, Cumming, Kimerling, & Schutz, 2018). Finally, special educators may serve as itinerant teachers, serving students in multiple schools (Edgar & Rosa-Lugo, 2007).
Special educators’ instructional demands vary substantially as well, depending on student needs, and the goals and services outlined in their students individualized education plans (IEPs). Some special educators teach only one content area (e.g., literacy), while others teach all content areas. In addition, special educators are often responsible for both supporting students in learning general education curricula and remediating foundational skill deficits (McLaughlin, 2010).
Special educators interact with numerous individuals to coordinate services for their students. They collaborate with general educators and related service providers (e.g., physical therapists), supervise paraprofessionals, and collaborate with their students’ parents. Beyond instruction, special educators typically have primary responsibility to manage IEP development and meetings and to assure all aspects of students’ program are consistent with legal requirements of IDEA (2004). These factors (e.g., characteristics of students, service-delivery models, instructional content, and noninstructional responsibilities) combine in unique ways to create teaching assignments that vary dramatically both within and across schools.
Overview of Attrition/Retention Studies
Attrition Factors Studied
As Table 2 shows, the most common attrition factor studied was special educators’ working conditions (e.g., demands, social contexts). The vast majority (80%; n = 24) of studies addressed the relationship between one or more working condition(s) and attrition. Sixteen (53%) investigated aspects of preparation (e.g., initial preparation) and qualifications (e.g., certification). Four studies (13%) addressed the relationship between teacher demographics (e.g., race/ethnicity) and attrition, while 7 (23%) examined special educators retrospective nonwork reasons for leaving or moving. Few examined relationships between school characteristics, such as school demographics and urbanicity, and attrition (n = 3; 10%).
Theories and Frameworks
Only a third of the studies (n = 10) referenced a specific theoretical or conceptual framework. Three used Billingsley’s (1993) model of special education teacher attrition (Lesh et al., 2017; Prather-Jones, 2011a, 2011b), two relied on conservation of resources theory (Bettini et al., 2017; Gilmour & Wehby, in press), and other frameworks were used once, including affective events theory (Jones & Youngs, 2012), ecological systems theory (Lesh et al., 2017; combining two conceptual frameworks), House’s theory of social support (Cancio et al., 2013), human capital theory (Connelly & Graham, 2009), and sense-making theory (Jones et al., 2013).
Methodological Approaches
Studies varied in their definitions/measurement of attrition and retention, the inferences their analyses permit, and their samples’ generalizability (Table 2).
Definition/measurement of attrition/retention
As Table 2 shows, less than half of the studies (n = 13; 43%) focused on teachers who actually left. Of these 13, four examined factors that predicted attrition/retention (e.g., Gilmour & Wehby, in press), while nine were descriptive studies of teachers’ retrospective reasons for their decisions to leave (Carver-Thomas & Darling-Hammond, 2017). In contrast, 17 studies did not examine actual leaving, but rather examined factors associated with intent to stay (n = 9; e.g., Bettini et al., 2017; Conley & You, 2017), why stayers remain (n = 4; e.g., Prather-Jones, 2011b), or others’ explanations for why special educators leave (e.g., administrators; n = 4; e.g., Berry et al., 2011).
Inferences
Studies varied in the strength of inferences permitted by their analytic methods. Only two (Clotfelter et al., 2008; Feng & Sass, 2017) used methods permitting causal inferences. Some studies used correlation-based methods (e.g., regression) to examine predictors of attrition or intent (e.g., Connelly & Graham, 2009). Others compared teachers intending to stay versus leave (e.g., Cancio et al., 2013) or provided descriptive rates of leaving for early career teachers (e.g., DeAngelis & Pressley, 2011). Finally, some used qualitative methods to investigate teachers’ explanations for why they stayed (e.g., Gehrke & McCoy, 2007; Prather-Jones, 2011b) or left/moved (Gehrke & McCoy, 2007).
Sampling and data sources
Studies varied in the representativeness of their samples (Table 2). Four (13%) used Schools and Staffing Surveys (SASS) and/or the Teacher Follow-up Surveys (TFS), which NCES administers every 4 years to a nationally representative sample (e.g., Boe et al., 2008). Other researchers used state data sets (e.g., Gilmour & Wehby, in press), local samples (e.g., Jones et al., 2013), or convenience samples (e.g., Albrecht et al., 2009).
Most studies included K–12 special educators, while others focused on specific groups. Six studies focused on early career teachers (Bettini et al., 2017; Connelly & Graham, 2009; Gehrke & McCoy, 2007; Hagaman & Casey, 2018; Jones et al., 2013; Jones & Youngs, 2012) and four studied experienced special educators (Lesh et al., 2017; López-Estrada & Koyama, 2010; Prather-Jones, 2011a, 2011b). Four focused on teachers serving students with emotional and behavioral disorders (EBD; Albrecht et al., 2009; Cancio et al., 2013; Prather-Jones, 2011a, 2011b) and another disaggregated special education teacher data (Gilmour & Wehby, in press). One study focused on speech/language pathologists (Edgar & Rosa-Lugo, 2007), two addressed secondary teachers (Clotfelter et al., 2008; Conley & You, 2017), and one focused on Mexican American teachers (López-Estrada & Koyama, 2010). Four studied teachers in urban districts (Bettini et al., 2017; Billingsley, 2007; Jones et al., 2013; Jones & Youngs, 2012) and two on rural (Berry, 2012; Berry et al., 2011), while one compared special educators in urban and rural settings (Prater et al., 2007).
Teacher Preparation and Qualifications
Researchers posited that knowledgeable, well-prepared special educators will likely be more effective than less prepared teachers, will find their work more satisfying, and, thus will be more likely to stay (e.g., Connelly & Graham, 2009). Thus, researchers studied whether components of special educators’ preparation (i.e., initial preparation, mentoring, professional development [PD]) and qualifications (i.e., certification and experience) were related to their attrition and retention.
Initial Preparation
The nature of teacher preparation varies considerably in the United States. For example, some programs are lengthier and more comprehensive (often traditional university programs), while others may have far fewer requirements, such as alternative programs (Billingsley & Bettini, 2017). Only three studies considered the relationship of initial preparation to teacher retention. Connelly and Graham (2008) analyzed SASS and TFS data using logistic regression to examine whether characteristics of initial preparation predicted the odds of 168 early career special educators remaining in teaching. They found that new teachers with 10 or more weeks of student teaching were more likely to be teaching 1 year later, with a 21% probability of leaving or moving, while those with less than 10 weeks had a 37% probability of leaving or moving (odds ratio = 2.18, p < .05). Almost 80% of special educators with more than 10 weeks of student teaching were still teaching after 1 year, compared to 63% of those with fewer than 10 weeks. Other aspects of preparation, such as coursework did not significantly predict retention.
In two studies, researchers reported their graduates stayed in special education at high rates, with the inference that quality preparation may enhance retention (Burstein et al., 2009; Edgar & Pair, 2005). Edgar and Pair (2005) conducted phone interviews with 149 of 161 graduates (93%) from seven cohorts of their special education program. They reported that attrition was lower than typical; 78% were still special educators, though 70% changed schools (consistent with high moving rates among new special education teachers; DeAngelis & Presley, 2011). Graduates of the dual certificate program had the highest attrition rate (28%), primarily transferring to general education. In a similar study, Burstein et al. (2009) surveyed graduates of Accelerate Collaborative Teacher, a full-time, year-long, graduate credential program. They reported an average 5-year retention rate of 74%, and a special educator retention rate of 71%, which are similar to Edgar and Pair’s findings. However, the response rate was low (45%) and they did not include systematic comparisons with nonrespondents. No conclusions can be drawn from these two studies given the small, unrepresentative populations and the absence of comparison groups.
Researchers should investigate the extent to which specific aspects of initial preparation (e.g., program comprehensiveness; quality of field experiences) are associated with retention. Furthermore, some special educators are prepared separately from general educators, while others graduate from dual or merged programs in which special and general education teacher candidates complete some or all of the same program components and may earn certification in both general and special education (Blanton et al., 2017). Edgar and Pair (2005) found higher transfer attrition from the dual program, suggesting the need to consider how more than one certification type influences retention. Future research should use administrative data sets for more nuanced investigations, such as Ronfeldt’s (2012) analysis of New York City’s data, which found preservice general educators’ practicum in a low-attrition school predicted longevity, regardless of whether the preservice placement matched in-service school demographics.
Mentoring and PD
Mentoring improves new general educators’ retention (Guarino et al., 2006; Ingersoll & Strong, 2011), but less evidence supports this relationship for special educators (Billingsley, 2004). Most special educators have mentors, but mentors may not be available in the same school or teach in the same area (Billingsley, Griffin, Smith, Kamman, & Israel, 2009). Fewer researchers have studied the relationship between PD opportunities and attrition.
Analyzing SASS/TFS data, Connelly and Graham (2009) found mentoring did not predict attrition among 168 early career special educators; however, they caution that most teachers in the sample reported working closely with mentors, and low variability may limit power to detect effects. Qualitative studies found special educators valued mentorship (e.g., López-Estrada & Koyama, 2010). For example, Gehrke and McCoy (2007) surveyed and interviewed seven stayers and three movers in their first years of teaching. They analyzed data thematically, though the coding process is not clearly described, and they omit key details (e.g., comparing respondents vs. nonrespondents). They reported movers made no references to mentor support, whereas stayers emphasized the importance of formal or informal mentorship.
Examining PD, Cancio et al. (2013) surveyed 408 special educators serving students with EBD, conducting group difference tests to examine factors differentiating those who planned to stay versus leave. They reported that administrators’ support for professional growth (e.g., workshops and opportunities to learn) was significantly higher for those who planned to stay (t = 2.089, p = .037). Similarly, Albrecht et al. (2009) surveyed 776 special educators serving students with EBD, also using group difference tests to determine differences between those planning to stay and leave. They found that “stayers” rated PD opportunities higher than “leavers” (t = 2.922, p < .01). Both of these studies are limited by the use of multiple significance tests without corrections, which can magnify Type I error rates, and by their sampling strategy (members of Council for Children with Behavioral Disorders), as membership in a professional group may indicate greater commitment than other teachers. However, their findings are consistent with qualitative studies, in which special educators reported valuing PD (e.g., Hagaman & Casey, 2018). For example, in their comparison of special educators planning to leave versus stay, Gehrke and McCoy (2007) found “stayers” referenced the value of PD on behavior management, induction focused on best teaching practices, conference attendance, opportunities to participate in content area curriculum development, and meetings with other new teachers; in contrast, only one mover discussed PD.
These studies suggest special educators value mentoring and PD, but the evidence of a relationship between these factors and retention is weak, as no studies measured PD duration or quality, and only two studies examined the significance of relationships between PD and intent (Albrecht et al., 2009; Cancio et al., 2013). Future research should address how specific characteristics of mentorship and PD relate to attrition and intervention research that permits causal inferences would be useful. For example, researchers could include measures of intent to stay in PD studies, to determine if PD supports plans to stay. Propensity score matching and/or regression discontinuity could also be used to make causal inferences using large data sets. For example, Ronfeldt and McQueen (2017) used propensity score matching to analyze SASS/TFS data, examining the causal impact of induction on attrition and found significant effects, permitting causal inferences. Similar studies in special education would be useful.
Certification
U.S. states often permit uncertified (unlicensed) teachers to be hired if qualified teachers are not available. Two studies compared certified and uncertified teachers, obtaining contradictory results (Albrecht et al., 2009; Conley & You, 2017), while Gilmour and Wehby (in press) compared teachers with different certifications, preventing comparison with the other two studies. Using structural equation modeling (SEM) to analyze SASS data, Conley and You (2017) found certified secondary special educators (those with any certificate) were less likely to intend to leave than uncertified teachers, controlling for social support. In contrast, Albrecht et al.’s (2009) study found licensure did not differentiate those planning to stay versus leave, though they do not report the analytic method (e.g., analysis of variance, chi-square). Conley and You’s (2017) study was methodologically stronger, with a nationally representative sample and controls for covariates.
Gilmour and Wehby (in press) compared special education and dual certified teachers to general education certified teachers, using logistic regression to examine North Carolina state data. Special education certification was associated with a 22% increase in odds of leaving (confidence interval [CI: 21%, 50%]). Dual certification was associated with a 14% increase in odds of leaving CI [11%, 33%]) compared to general education certification, controlling for teacher and school characteristics. It is not clear whether dual certified teachers were working as special or general educators, a major limitation. Thus, we cannot interpret whether the smaller attrition rate is due to certification or teachers’ assignments. Of note, this study describes how special versus dual versus general education certification relates to attrition, not the value of being certified versus uncertified.
Although the relationship between certification and attrition is mixed and future study is needed, Conley and You’s (2017) findings are consistent with prior research (Billingsley, 2004).
Experience
Past research suggests that attrition tends to be higher for less experienced teachers and then drops off until they reach retirement age (Guarino et al., 2006). Early career attrition is problematic as it contributes to the teacher shortage (Smith & Ingersoll, 2004) and teachers become more effective with experience (Henry, Bastian, & Fortner, 2011).
Current studies suggest that special educators with less experience moved at higher rates than general educators, but left teaching at comparable rates (Boe et al., 2008; DeAngelis & Pressley, 2011). Boe et al. (2008) analyzed three waves of SASS/TFS data, and differentiated among three types of attrition: leaving, moving, and transferring. For all three types, they found significant differences between special and general educators over their careers (exit attrition [leaving]: χ2 = 25.04, p < .001; transfer attrition: χ2 = 10.45, p < .01; school migration [moving]: χ2 = 60.31, p < .001). For both groups, exit attrition (leaving) was highest early in their careers, and then declined, but special education teacher exit attrition did not decline as much as general educators. Overall, migration rates (i.e., moving) were substantially higher than exit or field transfer attrition rates (Boe et al., 2008); 19.8% of special educators moved to a different school in their first 3 years, compared to 13.1% of general educators, a significant difference (X2 = 9.33, p < .01). Patterns differed slightly for teaching field transfers (Boe et al., 2008). Early career special and general educators were more likely to transfer, but general education transfer rates remained steady throughout their careers, while special educators transfer rates declined. Boe et al. (2008) did not report significance of these differences.
Other results were consistent with Boe et al. (2008), though none examined all three types of attrition. DeAngelis and Pressley (2011) analyzed administrative data in Illinois, examining leaving and moving among all teachers from 1987 to 2001, the longest time period included in any study. They found 75% of special educators exited in the first 5 years, including 42% who left teaching and 34% who moved schools within Illinois—substantially higher than the average 5-year attrition rate (40%) in other subject areas. Note that their study did not track teachers who stayed in teaching but moved out of state. Analyzing surveys of 99 special educators who left or moved from a large urban district over 3 years, Billingsley (2007) found 25% of those who left were in their first 4 years. A higher percentage of those with 10+ years of experience left “to pursue another career in education” and only those with 20 years of experience or more left to retire. Menlove et al. (2004) reported different patterns of attrition for early career special educators. Surveying all special education directors in Utah (100% response rate) about their district’s attrition, they found early career teachers (i.e., those with less than 5 years of experience) moved at higher rates, whereas their more experienced counterparts left to retire. Early career and experienced special educators transferred to general education at similar rates (15.23% early career, 19.54% experienced) over the 3-year period.
Although several studies examined relationships between experience and intent, none used models that accounted for evidence that special educators are more likely to leave at the beginning and end of their careers (i.e., none modeled a nonlinear relationship), potentially biasing results. Among special educators serving students with EBD, Albrecht et al. (2009) found experience differentiated those planning to stay versus leave; 84.4% of teachers with 10+ years of experience planned to stay, compared to 70.7% of those with 2 to 5 years of experience (they reported no results for teachers with 1 or 6 to 9 years of experience, without explanation). In contrast, Berry (2012) analyzed data from a national survey of 203 rural special educators, examining correlations with intent; as experience increased, intent decreased (r = −.15, p value not reported).
Conclusions About Teacher Preparation and Qualifications
The most consistent finding is that special educators with less experience are more likely to leave, a well-established finding from prior literature reviews (Billingsley, 2004; Guarino et al., 2006). However, recent research adds little to our understanding of the preparation and qualification factors that predict attrition and retention. No studies used strong measures of teacher quality or effectiveness to examine whether their knowledge, skills, or self-efficacy are related to attrition. The lack of research on teacher preparation and qualifications is surprising given an expanded federal policy focused on improving teacher quality, effectiveness, induction, and evaluation (e.g., No Child Left Behind, 2001; Every Student Succeeds Act, 2015) and expanded options for preparation, such as varied types of alternative programs (Cochran-Smith et al., 2016). Stronger studies are needed to determine the relationship of teacher preparation to attrition. Although researchers should use the National Teacher and Principal Survey (NTPS), as it includes some aspects of preparation, more comprehensive databases are needed to study preparation and licensure variables important to special education teachers’ preparation and attrition/retention.
School Characteristics
Only three studies examined how attrition related to school demographics (Carver-Thomas & Darling-Hammond, 2017; Prater et al., 2007) or perceptions of demographics (Conley & You, 2017). Carver-Thomas and Darling-Hammond (2017) used SASS (2011–2012) and TFS data, and found special educators’ attrition rates varied significantly based on the proportion of students of color in a school, with 20% attrition from schools serving >55% students of color (i.e., the top quartile), compared to 11% from schools serving <10% students of color (i.e., the bottom quartile). They also reported special educators’ attrition rates were higher in Title 1 than non–Title 1 schools, though these differences were not significant. 2
Conley and You’s (2017) analysis of the SASS was the only study to examine teachers’ perceptions of school demographics. They constructed a linear composite of ratings of whether poverty, parental involvement, and student apathy were problems in the school. Among 2,060 secondary special educators, this composite did not directly predict intent, but it did significantly predict work commitment (R2 = −.15, p < .05), career commitment (R2 = −.16, p < .05), and job satisfaction (R2 = −.10, p < .05), which mediated a significant indirect relationship between these conditions and intent; special educators who felt these conditions were more of a problem were more likely to intend to leave. They did not report the magnitude of the indirect relationship.
Only one study compared attrition in urban versus rural schools. Prater et al. (2007) surveyed 98% of district special education directors/designees in Utah and reported rural special education personnel left or moved at a lower rate than urban personnel, χ2(1) = 15.266, p < .001. Differences were significant for special educators, but not for other special education personnel (e.g., school psychologists). Overall, 7.8% of rural teachers left or moved, compared to 13.6% of urban teachers. Specifically, teachers of students with mild/moderate disabilities in rural schools (8.2%) left at significantly lower rates than in urban districts (13.1%), χ2(1) = 6.872, p < .009. Among teachers of students with severe disabilities, differences existed (8% left in rural schools, compared to 14.1% in urban schools), but they were not significant.
Conclusions About School Characteristics and Attrition
Few studies examined student race/ethnicity or poverty, but, consistent with research on general educators, all found that special educators were more likely to leave or plan to leave schools serving more students of color and more students living in poverty. Based primarily on studies of general educators, scholars have proposed two main explanations for this: (a) teachers’ racial/ethnic and socioeconomic biases may lead them to prefer teaching in schools with a larger proportion of White and socioeconomically privileged students (Hanushek, Kain, & Rivkin, 2004) or (b) demographics may be a proxy for other factors (e.g., working conditions, proximity of schools to teachers’ homes, safety) that covary with demographics (Johnson, Kraft, & Papay, 2012; Simon & Johnson, 2015). Studies of general educators provide empirical support for both explanations. For example, Johnson et al. (2012) found working conditions attenuated, but did not eliminate, a relationship between school poverty and student race/ethnicity and attrition. This suggests that working conditions may partially explain higher attrition in schools serving more students of color and students living in poverty, but still allows for the possibility that teacher preferences for Whiter and more affluent students may explain some proportion of the variance. Future research needs to determine why special educators’ attrition varies by school demographics, control for both working conditions and for teachers’ proximity to their schools and consider methods that would allow researchers to determine potential racial/ethnic biases in their decisions.
In addition, other school characteristics were barely studied and warrant further research; only one study compared urban versus rural schools (Prater et al., 2007), and no recent studies controlled for elementary versus secondary school level, despite prior evidence of higher attrition in secondary schools (Borman & Dowling, 2008).
Working Conditions
Working conditions include “physical features . . . organizational structure, and the sociological, political, psychological and educational features of the work environment” (Ladd, 2009, p. 6). Studies examined several aspects of special educators’ working conditions, including (a) demands, (b) social contexts, (c) resources, (d) financial compensation, and (e) affective responses and coping strategies.
Demands
As described above, special educators have many complex responsibilities, and they may experience frustration and be more likely to leave when their demands require more than they can reasonably provide (Bettini et al., 2017).
Overall demands
Bettini et al. (2017) used SEM to examine how perceptions of workload manageability in the fall predicted emotional exhaustion (a component of burnout) and intent in spring, among 61 novice special educators and 184 novice general educators. Emotional exhaustion mediated an indirect relationship between workload manageability and intent (special educators: R2 = .242, p = .050; general educators: R2 = .591, p = .000). The study had a relatively small sample for SEM, but results are consistent with other studies (Hagaman & Casey, 2018; Kaff, 2004). For example, Kaff (2004) found 48% of special educators who planned to leave reported too many demands interfered with serving students.
Caseload size and complexity
Several studies found the overall number of students taught was related to intent. In a national survey, Berry (2012) found rural teachers’ caseload size was significantly negatively correlated with intent (r = −.19, p values not reported). Billingsley (2007) found 33% of special educators who left a large urban district identified large caseloads as an important reason for leaving, more than any other factor. In addition, Hagaman and Casey (2017) found that 9 of 13 focus groups–reported caseload size was related to new teacher attrition; interestingly, preservice and early career teachers brought this up, but administrators did not. In Albrecht et al.’s (2009) survey of special educators serving students with EBD, one teacher who planned to leave shared how a large caseload shaped her experience: “I currently see well over 75 students a day with little support. . . . I feel as if I am thrown to the wolves on a daily basis” (p. 1015). In contrast, Carver-Thomas and Darling-Hammond’s (2017) analysis of TFS data found only 7% of special educators indicated caseload as a reason for leaving, compared to 10% of all teachers; however, they studied leavers, not movers or intent to leave. Most of these studies were descriptive and none used methods permitting strong inferences about the nature or strength of this relationship.
Two studies suggested the complexity of caseloads may matter. In Kaff’s (2004) study, 57% of those who planned to leave said the complexity of student needs on caseloads contributed. In DeMik’s (2008) qualitative study, teachers indicated that serving students with a wide range of needs challenged their capacity to effectively serve students.
Students’ disability and behavior
Several studies found that special educators teaching students with certain disabilities may be more likely to leave. Analyzing North Carolina’s data set, Gilmour and Wehby (in press) found most disability categories were unrelated to attrition, with one exception: special educators serving 100% students with EBD had a 4.37 odds of leaving, versus 1.66 odds among those serving no students with EBD. Berry et al. (2011) conducted a nationally representative survey of 373 rural special education administrators; 72% reported problems retaining special educators and 51% reported problems filling vacancies, especially in the areas of autism, EBD, severe/multiple disabilities, and sensory disabilities. Menlove et al. (2004) found administrators in Utah indicated high attrition among speech-language pathologists (11% to 15%) and special educators serving students with mild/moderate disabilities (11.9% to 13.9%), compared to those serving students with severe disabilities (5.8% to 11.2%).
High attrition among teachers of students with EBD (Gilmour & Wehby, in press) may be related to behavior, as some studies found that perceptions of student behavior were related to attrition. Conley and You (2017) examined how secondary special educators’ perceptions of student disengagement predicted intent, using SASS data. They measured disengagement using a linear composite of ratings of the extent to which class cutting, tardiness, and absenteeism were problems. Student disengagement did not directly predict intent, but it did predict work commitment (R2 = −.06, p < .05), career commitment (R2 = −.16, p < .05), and job satisfaction (R2 = −.10, p < .05), which mediated an indirect relationship with intent; those who perceived student disengagement as more of a problem were more likely to plan to leave (they did not report the magnitude of the indirect relationship). Likewise, Billingsley (2007) found 18% of special educators who left an urban district reported leaving due to “student discipline problems,” while 11% reported leaving due to “poor student attendance or motivation” (p. 15).
In contrast, Albrecht et al. (2009) found that, among special educators serving students with EBD, the number of times teachers were attacked by a student did not differentiate those who planned to stay versus leave, indicating student physical aggression may not be the aspect of behavior that contributes to intent. Albrecht et al. (2009) further found that those who planned to stay were significantly more likely to report using positive behavioral interventions and supports (PBIS) with a point system to manage student behavior, whereas those who intended to leave reported only using a point system or a non-PBIS approach (t = 0.26, p value not reported); 89.8% of those who reported using PBIS and a point system planned to stay, compared to 75% of those using only a point system or a non-PBIS approach. Further research is needed to confirm these results, examine other behaviors (e.g., verbal aggression), and examine if relationships between behavior and attrition may be attenuated by other factors (e.g., schoolwide positive behavior systems, training in behavior management, effective classroom management practices).
Students as a reason to stay
Student caseloads and characteristics may be challenging, but teachers often indicate their students are a primary reason for staying. Prather-Jones (2011b) used interviews and a focus group to examine why 13 experienced special educators continued serving students with EBD. She asked, “What do you like about teaching students with EBD?” and “many teachers leave this field, why do you stay?” (p. 182). Special educators reported wanting to teach students with EBD, feeling called to do their jobs. Lesh et al. (2017) also used the word “calling” to describe five teachers’ commitment to students with disabilities. One teacher shared, “I think that is why I am put on earth . . . ”; another stated, “I believe that, one student at a time, I will change their future” (p. 16). Similarly, in López-Estrada and Koyama’s (2010) study of why Mexican America special educators stayed, 94% agreed students were a primary reason to stay.
Gilmour and Wehby (in press) found that special educators serving students with EBD were more likely to leave, however, the proportion of students with disabilities a special education certified teacher served was positively associated with retention, such that special education certified teachers serving 100% students with disabilities were significantly less likely to leave or move schools than those serving less than 50% students with disabilities. A limitation of this study is that, although they were able to verify teachers’ licensure areas, they were not able to determine whether participants were actually assigned roles as special educators.
Service delivery model
Service delivery model may contribute to attrition, but only two studies addressed this possibility. Kaff (2004) reported 45% of special educators indicated serving students across dual service delivery models contributed to their plans to leave. DeMik (2008) described the challenge of one special educator, who stated, We have, in the front of our room, a class going on with direct instruction, sometimes two . . . in the back, we will have up to twenty kids in a study hall. . . . Then the kids will come in to have a test read . . . (p. 28)
Only one study examined itinerant special educators. Among speech-language pathologists, Edgar and Rosa-Lugo (2007) found assignment to a single school (vs. multiple schools) had a small (η2 = .033, p = .024) significant relationship with intent to stay.
Paperwork and nonteaching responsibilities
Paperwork (i.e., managing IEPs, ensuring compliance with IDEA) is a key responsibility, often taking time from special educators’ instructional responsibilities. Prior reviews suggest nonteaching responsibilities are burdensome to teachers, interfere with instruction, and may contribute to attrition (Billingsley, 2004).
Albrecht et al. (2009) found “time for paperwork” differentiated those who intended to leave from those who intended to stay, among teachers serving students with EBD (t = 4.020, p < .001). Billingsley (2007) surveyed 99 special educators who left an urban district over 3 years and found 24% indicated paperwork was an important contributor to their decision, the third most frequently identified reason. Other studies results were consistent with these (Hagaman & Casey, 2018; Kaff, 2004). Berry et al.’s (2011) survey of 373 rural special education administrators and 203 rural special educators, found administrators indicated paperwork was the second major work-related reason special educators left, however, fewer teachers gave it as a reason for leaving.
Qualitative studies provide special educators’ perspectives on paperwork. They indicated paperwork (a) is overwhelming and contributes to a difficult workload (DeMik, 2008; Kaff, 2004); (b) involves varied types of tasks, such as long IEP forms; (c) is redundant, requiring them to maintain multiple sets of records (DeMik, 2008); and (d) interferes with time to teach (DeMik, 2008; Hagaman & Casey, 2018; Kaff, 2004). One special educator shared how IEPs “[eat] up much of the time I would previously have devoted to my students” (Kaff, 2004, p. 12). Although paperwork was not included in most of the quantitative studies, when teachers were given open-ended opportunities to discuss their work, they often addressed paperwork. We note that although six studies investigated paperwork, none used methods that would permit strong inferences about the nature or the magnitude of the association between paperwork and attrition.
Accountability and assessment
Special educators’ responsibility for accountability and assessment has changed since No Child Left Behind Act (2001) made schools (and special educators) responsible for ensuring students with disabilities meet grade-level standards (McLaughlin, 2010). However, few researchers examined this issue.
Using 2000–2001 TFS data, Luekens et al. (2004) reported 7.1% of special educators who left teaching did so because they “did not feel prepared to implement or did not agree with new reform measures” (p. 18). However, using the more recent 2012–2013 TFS, Carver-Thomas and Darling-Hammond’s (2017) indicated that the most frequently selected reason special educators left teaching (24%) was “testing and accountability” (p. 5), similar to that of all teachers. In addition, 14% reported being dissatisfied with inadequate “support to prepare students for assessments,” and 6% reported being dissatisfied with having “compensation tied to student performance” (p. 7). Although these findings suggest concerns about accountability have increased over time, little is known about the specific accountability concerns that lead special educators to identify it as a reason for leaving. In qualitative studies, some teachers expressed concerns about the time spent testing instead of teaching (DeMik, 2008) and accountability paperwork (Kaff, 2004).
Social Contexts
Extant findings were consistent with prior reviews, finding that social contexts predicted teachers’ intent to stay or leave (Billingsley, 2004), and they extended prior research by identifying specific aspects of social contexts that may be especially important. They examined school culture, administrative support, collegial support, paraprofessional support, and the degree to which social contexts provided autonomy to make decisions.
School culture
School culture is the underlying social norms, values, and assumptions about schools, students, and about how teachers should act (Jones et al., 2013). Past research suggests special educators who experienced a positive school climate, a similar construct, were more likely to intend to stay than those who gave it lower ratings (Billingsley, 2004). Current studies extend this research by focusing on a culture of collective responsibility.
Jones et al. (2013) surveyed 47 special educators and 138 general educators in their first 3 years teaching in urban elementary and middle schools, predicting intent as a function of a culture of collective responsibility (measured by six items asking participants to rate the proportion of colleagues who, for example, “Take responsibility for helping one another do well”; p. 8) and fit (measured by six items evaluating the extent to which school culture aligned with special educators’ values; e.g., “My approach to teaching fits in throughout this school,” p. 8). They found special educators who perceived a culture of collective responsibility were more committed to the school (i.e., indicated intent to stay; R2= .053, p < .05), but there was no effect for general educators, and collective responsibility did not predict commitment to assignment for either group. For both groups, those who perceived strong fit were more committed to their assignment (R2 = .229, p < .01, for special educators; R2 = .050, p < .01, for general educators) and their school (R2 = .031, p < .10, for special educators; R2 = .021, p < .05, for general educators).
Similarly, analyzing the SASS, Conley and You (2017) predicted intent using a similar measure, using a three-item linear composite, labeled “teacher team efficacy” (i.e., “There is a great deal of cooperative effort among staff members,” p. 529). Although they labeled this scale differently, the content of these items overlaps with Jones et al.’s (2013) collective responsibility and fit scales. Conley and You (2017) found that secondary special educators who rated these items highly had higher intent (R2 = −.28, p < .05), work commitment (R2 = .34, p < .05), career commitment (R2 = .18, p < .05), and job satisfaction (R2 = .26, p < .05). These factors partially mediated a significant indirect relationship between this composite and intent. Two studies used less rigorous methodological approaches but findings were similar to the above studies. Berry (2012) found that rural special educators who reported a shared responsibility for students with disabilities had a higher intent to stay than those without such support. Albrecht et al. (2009) indicated teachers of students with EBD were more likely to stay if they perceived a positive school climate, a more general assessment than the other studies.
Support
Special educators need to interact with school and district administrators, general and special education colleagues, paraprofessionals, related service providers (e.g., speech-language pathologists), and parents (Billingsley, McLeskey, & Crockett, 2017) to meet their students’ needs. Several studies found special educators’ overall ratings of support from other professionals were associated with intent to stay (Berry, 2012; Kaff, 2004). For example, among rural special educators, Berry found overall support (a composite of district, school administration, collegial, and other support) explained 10% of variance in intent. Emphasizing the importance of a range of social supports, one teacher stated, “I have a great support system with paras, related service providers, the general education teachers, and parents. It’s not all on me” (Berry, 2012, p. 9). Other studies examined specific sources of support, including administrators, colleagues, paraprofessionals, and others; none examined support from parents.
Administrative support. Administrators support a positive environment for special educators when they support an inclusive culture, support special and general educators’ collaboration, and ensure all teachers have resources to do their work effectively; as such, they may help retain special educators (Billingsley, McLeskey, et al., 2017). Because special educators rely on coordination among many professionals to serve their students, their retention may be especially dependent on administrators (Youngs, Jones, & Low, 2011), and several studies investigated the role administrators play in attrition/retention. These studies defined and measured administrative support differently from one another. Most researchers conceptualized administrative support as a broad or global concept (e.g., access to administrative support; Albrecht et al., 2009), while some identified or focused on specific dimensions of administrative support, such as trust (e.g., Cancio et al., 2013) and involvement in decision making (Prather-Jones, 2011a).
Consistent with prior research (Billingsley, 2004), studies examining global ratings of school-based administrative support found special educators were more likely to intend to stay when they rated administrative support more highly. For example, Conley and You’s (2017) analysis of the SASS found secondary special educators who rated a linear composite measure of administrative support (e.g., “The school administration’s behavior toward staff is supportive and encouraging”) more positively had higher intent to stay (R2 = −.19, p < .05), work commitment (R2 = .58, p < .05), career commitment (R2 = .10, p < .05), and job satisfaction (R2 = .44, p < .05). These factors partially mediated a significant indirect relationship between administrative support and intent, though they did not report the magnitude of the indirect relationship (Conley & You, 2017). Similarly, in a survey of special educators serving students with EBD, Albrecht et al. (2009) found those who planned to stay were significantly more likely to report having access to administrative support (χ2 = 16.694, p < .001). Consistent with this, in studies asking teachers why they left or stayed, teachers reported administrative support played a role (Billingsley, 2007; Carver-Thomas & Darling Hammond, 2017; López-Estrada & Koyama, 2010).
Other studies examined specific aspects of administrative support. In a study of special educators serving students with EBD, Cancio et al. (2013) used House’s theory to focus on specific types of support: appreciation (t = 3.341, p = .001), trust (t = 2.148, p = .032), and opportunities for growth (reported above) were significantly higher for those who planned to stay longer versus the short term. Prather-Jones (2011a) conducted interviews with 13 special educators who taught students with EBD for 7 to 28 years, using inductive and deductive coding to examine their perspectives on why they stayed and others left. As in Cancio et al.’s (2013) study, Prather-Jones (2011a) found teachers felt supported when principals (a) expressed appreciation for them (e.g., “[He makes] me feel important. He talked about improvement in a lot of children . . . ,” p. 5); (b) demonstrated trust and respect (e.g., “feeling that you are a professional and that your judgment doesn’t need to be second-guessed,” p. 5), and (c) involved them in disciplinary decisions (e.g., principals “[brainstorm] with me about what we need to do with a student,” p. 5), and (d) fostered collegial support, although there were inadequate data to support this point. In contrast, Berry’s (2012) survey study found no relationship between 203 rural special educators’ intent and perceptions of school administrators’ helpfulness or understanding of their job. However, they used only two items with little overlap with Cancio et al.’s items and results from a bivariate correlation table should be interpreted with caution (Berry, 2012).
Few studies examined district-level administrative support, but studies generally found it was related to attrition. Berry (2012) found a significant correlation (r = .1, p value not reported) between rural special educators’ perceptions of district administrators’ helpfulness and intent to stay, but no correlation with perceptions that district administrators understood their job. In a study examining why special educators said they left, Billingsley’s (2007) reported that 25% of those who left an urban district reported “inadequate support from central administration” was a source of dissatisfaction; 8% reported it was the most important source of dissatisfaction—greater than the proportion who reported leaving due to dissatisfaction with principals. Similarly, in a study of why Mexican American teachers stayed, 70% agreed special education directors influenced their decisions (López-Estrada & Koyama, 2010).
Collegial support and collaboration. Collegial support can enhance teachers’ learning, provide emotional support for managing demands, and help teachers navigate schools’ structures (e.g., Grossman & Thompson, 2004). Some scholars posit that collegial support may be especially important for special educators, as they depend on collaboration to coordinate services and ensure students’ meaningful inclusion in general education (e.g., Billingsley, Bettini, & Jones, in press; Bettini et al., 2018). Because special educators depend on these relationships, a lack of collegial support requires them to expend energy building collaborative relationships (Griffin et al., 2009).
Several studies examined collegial support and collaboration, obtaining results largely consistent with prior research (Billingsley, 2004). Among a convenience sample of 776 special educators serving students with EBD, Albrecht et al. (2009) found those who planned to stay for 2+ years reported greater access to colleague support (t = 4.255, p < .001). Similarly, studies examining teachers’ explanations for why they stayed/left identified collegial support as an important contributor (DeMik, 2008; Hagaman & Casey, 2018; López-Estrada & Koyama, 2010). For example, DeMik (2008) used narrative inquiry to examine five current and former special educators’ perspectives on attrition. One mover described lack of support from colleagues, especially resistance to inclusion for students with disabilities. Colleagues referred to students with disabilities as “your kids” or “those kids,” and did not want to have “anything to do with me” (DeMik, p. 29); as a result, she had to devote more time to collaborative work. These results highlight how lack of collegial support can make collaborative efforts more time consuming.
Jones et al. (2013) extended prior research by examining the possibility that collegial support may be more important for special than general educators. They measured collegial support using a single item in which teachers rated the importance of collegial support. This item predicted commitment to assignment among new special educators (R2 = .665, p < .01) but not new general educators (R2 = .007); it did not predict commitment to school for either group.
Two studies differentiated among sources of collegial support. Berry (2012) found rural special educators’ perceptions of general educators’ helpfulness and understanding of their role were uncorrelated with intent, whereas perceived helpfulness of special education teacher colleagues correlated with intent (r = .13, p values not reported). In contrast, in an open-ended survey of 341 Kansas special educators, Kaff (2004) found 51% of those who planned to leave felt having more opportunities to collaborate and co-teach with general educators would be an inducement to stay. Both of these studies have substantial methodological limitations, but they indicate that it may be important to differentiate among sources of collegial support.
Several gaps are noteworthy. First, no studies differentiated among different kinds of collegial support (e.g., emotional support, instructional support). Second, no studies examined how collegial support may interact with other conditions to predict attrition. For example, scholars have posited that collegial support may be higher in schools with stronger administrative support (e.g., Gersten et al., 2001); no studies tested these kinds of complex relationships. Finally, collegial support may be differentially important for special educators working in inclusive settings. Although some studies focused on special educators serving students with a particular disability (e.g., EBD; Albrecht et al., 2009), none examined how service delivery model might moderate the relationship between collegial support and attrition.
Paraprofessional support. Paraprofessionals work under the supervision of a special educator to support students with disabilities (Office of Special Education Programs, 2016) and may be more important today as special educators’ caseload sizes have increased (Dewey et al., 2017). It is plausible that special educators’ attrition might be related to districts success in attracting and retaining strong paraprofessionals.
Findings from extant studies are consistent with this possibility, though only two studies examined paraprofessional support (Albrecht et al., 2009; López-Estrada & Koyama, 2010). For example, among special educators serving students with EBD, Albrecht et al. (2009) found those with daily access to paraprofessionals were significantly more likely to plan to stay (χ2 = 8.532, p = .014); 80% of those with daily paraprofessional support planned to stay, compared to 57.1% of those with paraprofessional support available on request. However, these two studies are insufficient to draw conclusions, especially given study limitations. More extensive research is needed to understand how paraprofessional support relates to special educators’ attrition, and how schools and districts can improve these supports.
Related service and other specialist support. Special educators coordinate their work with multiple service providers (e.g., physical therapists, applied behavioral analysts); however, only two studies examined support from related service providers. Among special educators serving students with EBD, Albrecht et al. (2009) found access to consultants (a term not clearly defined) differentiated those who planned to stay from those who did not (t = 5.381, p < .001), as did access to related service personnel (t = 5.372, p < .001). Berry (2012) found rural teachers’ ratings of helpfulness of related service providers significantly correlated with intent (r = .14, p value not reported). Future studies might consider support from specific types of related service providers; for example, support from applied behavior analysts may be especially important for special educators serving students with EBD and autism.
Autonomy
Autonomy is the extent to which the social context provides special educators latitude to make decisions about their work (Conley & You, 2017). Participation in decision making was linked to special educators’ attrition in a prior review (Billingsley, 1993).
Conley and You (2017) used SASS items to measure autonomy, asking secondary special educators about their perceived control over various aspects of their work (e.g., teaching techniques, discipline). Autonomy did not significantly directly predict intent, but it did significantly predict work commitment (R2 = .04, p < .05) and job satisfaction (R2 = .07, p < .05), which mediated an indirect relationship with intent; they did not report the magnitude of the indirect relationship. In Carver-Thomas and Darling-Hammond’s (2017) analysis of 2012–2013 TFS data, 6% of special educators who left reported autonomy was a reason for leaving.
Resources
Only, a few studies considered how materials (e.g., such as curricula) and time relate to special educators’ attrition.
Material resources
Special educators may teach both foundational skills and support in learning state standards; as a result, they may need a wide array of instructional resources. Several researchers investigated the relationship of material resources to attrition.
Among special educators serving students with EBD, Albrecht et al. (2009) found access to curricula and instructional materials (t = 3.966, p < .001) and technology (t = 3.687, p < .001) differentiated special educators who planned to stay from those who planned to leave; the quality of their classroom physical space did not differentiate those who planned to stay versus leave. Similarly, qualitative studies found that special educators who stayed or planned to stay reported having stronger access to curricula, while those who left or planned to leave shared that insufficient instructional materials played a role (Gehrke & McCoy, 2007; Kaff, 2004).
Time
Special educators’ time is dispersed across many activities, including paperwork, IEP meetings, instruction, and collaboration (among others; Vannest & Hagan-Burke, 2010). Several studies found their perceptions of the adequacy of their time was associated with intent.
Albrecht et al. (2009) found teachers of students with EBD who reported having adequate time for paperwork were more likely to plan to stay (t = 4.020, p < .001). Edgar and Rosa-Lugo (2007) found speech-language pathologists’ who held favorable views of school schedules were more likely to intend to stay (η2= .050, p = .002). 3 In a qualitative study, DeMik (2008) highlighted how limited preparation time, coupled with excessive demands, contributed to intent to leave, especially because special educators’ schedules were less structured. Special educators “felt compelled to give all of their time at school to students” (p. 28), including their lunchtime.
Financial Compensation
Teacher pay in the United States is determined at the district level, such that teachers in two neighboring districts can make very different salaries (Dee & Wyckoff, 2013). Within districts, salaries are determined by a relatively rigid salary schedule, in which compensation is determined by a combination of years of experience and educational attainment, though some districts have recently begun incorporating measures of teacher effectiveness into their salary schedules (Dee & Wyckoff, 2013). Two studies took advantage of state policy changes to test whether financial benefits for teachers causally effected their attrition (Clotfelter et al., 2008; Feng & Sass, 2017), the first such studies in special education. Clotfelter et al. (2008) used regression discontinuity and difference-in-difference analyses to examine North Carolina’s 1999–2000 to 2003–2004 administrative data, testing effects of an $1,800 bonus awarded to secondary teachers in shortage areas in low-performing, low-income schools. The authors caution that the bonus program was poorly publicized and administered on a timeline that limited its potential for informing teachers’ decisions (see Clotfelter et al., 2005). Aggregating across all shortage areas, they found eligible teachers in eligible schools were 12% less likely to leave than other teachers in the school, controlling for relevant factors (e.g., race/ethnicity, gender, middle/high school). However, using an interaction to test differential effects across math, science, and special education teachers, they found effects were primarily accounted for by math teachers; effects on special educators were insignificant.
Feng and Sass (2017) examined Florida’s administrative data set, using difference-in-difference analyses to test effects of a program that provided certified early career secondary teachers in “high needs” subjects student loan repayment and/or a bonus if they stayed in eligible subjects and grades. They estimated effects of each program on retention, conditional on relevant teacher characteristics, class characteristics, and school characteristics. The loan forgiveness program provided up to $2,500/year for undergraduate loans and up to $5,000 per year for graduate loans, with a maximum of $10,000/person; on average, teachers received a benefit equal to 3.4% of net pay. Loan forgiveness significantly reduced special educators’ attrition, though effects on special educators were smaller than effects on math and science teachers. The bonus program paid eligible teachers up to $1,200 in 1999–2000 if they remained in the same district and content area the following year; in 2001–2002, the program offered special education and English as Second Language teachers a smaller bonus, up to $850 (the average recipient received $750). The $1,200 bonus resulted in a 32.2% reduction in the likelihood of leaving; this result was robust to alternate specifications of the model. For special educators, a $1,200 bonus (equal to, on average, a 5.7% pay raise) reduced likelihood of attrition significantly, by 10.1% to 12.5%; the smaller bonus (equal to, on average, a 2% pay raise) had no significant effects.
Unlike most research in this review, researchers who examined financial compensation used sophisticated methods permitting causal inferences; these were the strongest in this review. These are the only studies of special education teacher attrition to date that permit causal inferences, providing a high degree of confidence in their findings (Clotfelter et al., 2008; Feng & Sass, 2017); furthermore, their findings are supported by three analyses of the TFS, in which special educators identified salary and benefits as important reasons for leaving teaching (Berry et al., 2011; Boe et al., 2008; Carver-Thomas & Darling-Hammond, 2017; Luekens et al., 2004). For example, in Carver-Thomas and Darling-Hammond’s analysis of the 2012–2013 TFS, 16% of special educators and 13% of general educators who left teaching indicated a better salary was a reason for leaving, while 8% of both groups reported leaving for better benefits.
One limitation to the extant research is that the effects of financial compensation are likely to vary across labor markets (e.g., availability of higher paying positions in teaching and other fields, local economic conditions; Imazeki, 2005) and based on teachers’ marketability, but no studies examined these nuances; for example, a teacher who believes she or he has few other employment options might choose to stay in teaching even with low compensation. In addition, further research is needed to calibrate what amount of compensation is necessary to have an effect, and what delivery mechanisms (e.g., bonuses, loan forgiveness) maximize the efficiency of increased compensation. Future studies could contribute value by testing whether relationships between financial compensation and attrition vary (a) based on the size and distribution mechanism (e.g., cash bonus vs. loan forgiveness vs. base salary increase), (b) across different labor markets, (c) longitudinally as economic conditions change, (d) across teachers whose qualifications are more/less marketable, and (e) across stages of teachers’ careers.
Affective Responses and Coping Strategies
Teachers experience positive and negative emotional responses to their work, and they deploy strategies for dealing with these responses (Sutton & Wheatley, 2003). These responses are shaped by both their working conditions as well as their emotional responses and coping strategies (e.g., their stress management strategies, emotional regulation; Cooley & Yovanoff, 1996). Several studies examined how these emotional responses and coping strategies contributed to attrition/intent.
In descriptive studies, researchers reported that 13% to 27% of special educators (or other informants) identified stress and/or burnout as a contributor to attrition (Berry et al., 2011; Billingsley, 2007; Hagaman & Casey, 2018; Kaff, 2004). Jones and Youngs (2012) used affective events theory, examining whether emotional responses (i.e., positive affect, negative affect, perceptions of skill, fatigue) predicted intent to stay among early career general (n = 26) and special educators (n = 14) in urban districts. They measured intent in fall and spring, and they examined emotional responses using the experience sampling method, a tool through which teachers respond at random times (averaging once/2 hours) during the workday, to questions about what they are doing and how they feel at that moment; items came from the well-validated Positive and Negative Affect scale. Although their special education sample included only 16 teachers, they found that mean positive affect (R2 = .46, p < .05) predicted teachers’ commitment to stay. Controlling for affective responses, special educators were significantly less likely than general educators to plan to stay (controlling for: positive affect, R2 = −.61, p < .10; negative affect, R2 = −.66, p < .05; perceptions of skill, R2 = −.64, p < .05; fatigue, R2 = −.66, p < .05). This implies that differences in affective responses cannot fully explain differences in special versus general educators’ intent, though caution is warranted given the small sample and the omission of working conditions from analyses.
Bettini et al. (2017), using the same survey, found emotional exhaustion (a component of burnout) in fall predicted both special educators’ (R2 = −.430, p = .021) and general educators’ (R2 = −.683, p = .000) spring intent; emotional exhaustion mediated relationships between workload manageability and intent for special educators (R2 = .242, p = .050) and general educators (R2 = .591, p = .000). Of note, Bettini et al. (2017) was the only study in the present review to consider affective responses as mediators of relationships between working conditions and intent. More research is needed to understand which working conditions and resulting affective responses contribute to attrition as well as identifying coping strategies that retain teachers.
Only one study identified coping strategies special educators used to address work demands. In a qualitative analysis of experienced special educators serving students with EBD, Prather-Jones (2011b) found that special educators felt it was essential to not take student behavior personally; for example, one teacher shared, “You can’t get bent out of shape when they say something derogatory towards you . . . ” (p. 184). Another strategy included “acceptance of limitations” as teachers said that, to remain over the long term, special educators must “learn not to blame themselves for students’ failures” (Prather-Jones, 2011b, p. 185), since they cannot solve all of students’ problems. Finally, teachers stated the need for flexibility, as teaching students with EBD is often unpredictable. The focus on a purposeful sample of experienced special educators was a strength of this study, but it was difficult to discern whether responses were related to retention or to other questions the authors asked the participants (e.g., what they like about their jobs).
These studies considered teacher responses to their working conditions (e.g., burnout, coping strategies), including those factors that made their work more or less attractive. Although the relationship between affective responses and attrition have been documented (Billingsley, 2004), coping strategies have received little attention. Working conditions and teacher qualifications likely shape their affective responses to their work in important ways (e.g., by presenting challenges and tools to deal such challenges), and affective responses may mediate relationships between these other factors and attrition/intent. Interventions that support teachers’ development of coping strategies may reduce negative affective responses and improve commitment (Cooley & Yovanoff, 1996) and future studies should explore these possibilities.
Conclusions About Working Conditions and Attrition
Studies examined a wide array of working conditions, generally finding that special educators are more likely to leave or intend to leave when they experience more demands (e.g., Gilmour & Wehby, in press) and weaker social supports (e.g., Conley & You, 2017). Relevant dimensions of social contexts include their school culture, administrative support, collegial support, and paraprofessional support. Studies of administrative support were especially useful, if they articulated specific aspects that support retention, some of which are inexpensive to incorporate into daily interactions with teachers (e.g., communicating trust, respect, appreciation). However, there are several key areas in which further research is needed.
First, it is unclear which demands, or combination of demands, are most predictive of attrition and how they contribute. Likely, a combination of demands, coupled with insufficient resources, contributes to negative affective responses, and thereby contributes to attrition or intent to leave. Demands that interfere with teachers’ effectiveness, in combination with the absence of resources essential for effectiveness (e.g., curricular materials, collaborative time for special educators in inclusive settings), may be particularly problematic, as they may prevent teachers’ from experiencing a “sense of success,” an important factor in career decisions (Johnson & Birkeland, 2003, p. 581). More research is needed to understand which demands are most impactful, and how those demands interact with other working conditions to shape attrition.
In that vein, extant studies provide little insight into how different aspects of social contexts may interact with one another to contribute to attrition. For example, scholars hypothesize that administrators cultivate healthy school cultures (Billingsley, McLeskey, et al., 2017) and create conditions for collegial support (Youngs et al., 2011), yet no studies examined these kinds of complex relationships among various dimensions of special educators’ social contexts.
More research is needed to articulate, more specifically, the forms of social supports that contribute to retention. Studies of social supports largely focused on generic interpersonal factors (e.g., trust), rather than supports specific to special education (e.g., leading for an inclusive vision, scheduling for collaboration; Billingsley, McLeskey, et al., 2017). Future studies should articulate relational, leadership, and administrative actions that support special educators’ instruction, to determine how these actions are associated with attrition.
Interestingly, some qualitative studies suggest some special educators perceive that they and their students are misunderstood, unappreciated, and unsupported (e.g., DeMik, 2008; Gehrke & McCoy, 2007; Hagaman & Casey, 2018), and perhaps even marginalized in their schools. Lack of support for including students in general education is of particular concern (e.g., DeMik, 2008), given special educators’ need to collaborate with general educators to address students’ needs across settings. If special educators feel marginalized in their interactions, specific types of administrative support may be needed (e.g., facilitating an inclusive ethic and collaborative structures/norms), and the relationship of these supports to attrition warrant further study.
Teacher Demographics and Nonwork Reasons for Leaving
A handful of studies examined how teachers’ demographic characteristics (i.e., race/ethnicity, gender, age) related to attrition, as well as the role of personal factors (e.g., pregnancy, retirement). In this section, we first address the relationship between teachers’ demographic characteristics and attrition, followed by their nonwork reasons for leaving.
Teacher Demographics
Retaining male teachers and teachers of color is especially important, given that the special education teacher workforce is substantially more White and female than the population of students with disabilities; in 2011–2012, only 18% of special educators were people of color, compared to 47% of students with disabilities (Billingsley, Bettini, & Williams, 2017). Yet, few researchers investigated the relationship between demographic variables and attrition.
Race/ethnicity
Although nationally representative samples of teachers demonstrate that teachers of color leave at higher rates than White teachers (Carver-Thomas & Darling-Hammond, 2017), we do not have sufficient evidence to determine whether this is the case among special educators, as very few studies included teachers’ racial/ethnic identity in their analyses. Billingsley (2007) found that 80% of European American special educators left an urban district with a high “minority” population, which is a disproportionately high percentage, given that only 60% of special educators in the district were European American. This is consistent with general education teacher attrition research, showing White teachers were more likely to leave high-poverty schools serving more students of color, while teachers of color were more likely to stay in schools serving more students of color (Ingersoll & May, 2011).
Only one study focused specifically on special educators of color. López-Estrada and Koyama (2010) examined why Mexican American teachers stayed in schools serving predominantly Mexican American students. They found many factors (described elsewhere) contributed to decisions to stay. Most of these factors were not specific to Mexican American teachers, with one exception: Participants reported that being bilingual was an important asset that allowed them to more effectively serve Mexican American students and families. Their sense of effectiveness in serving their students was one factor motivating them to stay.
Gender
Only one study examined gender. In Conley and You’s (2017) analysis of 2007–2008 SASS, male secondary special educator had higher intent to leave (R2 = .07, p < .05); however, previous reviews of the literature included more studies investigating the link between special education teacher attrition/retention and gender, however, the results of these studies were mixed (Billingsley, 1993, 2004).
Age
Conley and You’s (2017) analysis of the SASS found older secondary special educators were more likely to intend to stay (R2 = .08, p < .05); this is consistent with other studies’ findings that less experienced special educators were more likely to leave (discussed earlier). Berry (2012) found a significant negative correlation between age and intent (p value not reported), in contrast to Conley and You’s (2017) findings that older special educators were less likely to plan to stay. Differences may be due to samples, as Berry focused on rural teachers, while Conley and You focused on secondary teachers. However, results relying on bivariate correlations (Berry, 2012) should be considered with caution.
Nonwork Reasons for Leaving
Some teachers leave for reasons that are not malleable to intervention, such as child care, health, and family moves. Researchers identified these nonwork reasons for leaving using retrospective questionnaires (Billingsley, 2007; Boe et al., 2008; Menlove et al., 2004). We focus only on findings from nationally representative TFS studies (i.e., Boe et al., 2008; Carver-Thomas & Darling-Hammond; 2017; Luekens et al., 2004).
Not surprisingly, nonwork reasons play a substantial role in teachers’ decisions to leave, a reminder that many aspects of attrition may not be amenable to intervention. Carver-Thomas and Darling-Hammond (2017) combined items related pregnancy/child care, health, and caring for family, into “other personal life reasons” and found that 42% of special educators and 37% of general educators reported these as very important to their decisions to leave teaching. Boe et al. (2008) reported 14% of special educators and 16.9% of general educators left for family or personal reasons, 17.8% of special educators and 12.2% of general educators left for pregnancy/child rearing, and 1.7% of special educators and 5.2% of general educators left for health reasons. Although one might conclude that more teachers left for personal reasons in recent years, differences in response formats prevent such inferences about changes over time.
Some teachers leave for other careers. Using data prior to 2002, Boe et al. (2008) reported 14.5% of special educators and 9.3% of general educators left for other careers. In 2012–2013, pursuing another career was identified by a higher percentage of leavers, with 23% of former special educators and 28% of all former teachers indicating this was very important to their decision to leave (Carver-Thomas & Darling-Hammond, 2017). Although a substantial proportion of teachers pursue other careers, it is not clear whether these are careers within or outside of education.
The proportion of teachers leaving for retirement changed from earlier to more recent studies, perhaps due to changes in the TFS response options. Earlier versions of the TFS included selecting the top three reasons for leaving, while more recent versions included ratings of many different options. Boe et al. (2008) reported that a significantly lower percentage of special (16.5%) than general educators (28.8%) gave retirement as a reason for leaving (p < .02) and Luekens et al. (2004) reported similar results for special educators, with 18.9% leaving to retire. In contrast, more recently, Carver-Thomas and Darling-Hammond (2017) reported a higher proportion of special educators (37%) reported they left to retire, compared to 31% of all teachers.
Caution is needed when comparing results across these studies, as researchers (a) used TFS data with varied response formats (e.g., aggregating results across multiple versions of the TFS, Boe et al., 2008), (b) used different comparison groups (general educators vs. all teachers), (c) did not report all reasons for leaving (e.g., Boe et al., 2008), and (d) combined individual items into larger constructs, without reporting individual items (Carver-Thomas & Darling-Hammond, 2017). In the future, researchers should consider reporting both combined and individual items (e.g., Boe et al., 2008), to permit comparisons across studies and across different versions of the SASS/TFS and NTPS.
Conclusions About Teacher Demographics and Nonwork Reasons for Leaving
Identifying patterns of attrition is crucial for workforce planning and to design strategies for addressing attrition. Although we have a shortage of special educators of color (Billingsley, Bettini, et al., 2017), we do not have data about their attrition rates, suggesting a need to disaggregate results. There are a lower proportion of males in special education, suggesting the need to understand whether male special educators leave at differential rates, and if so, why. In general, researchers should include demographic data in attrition studies.
It is surprising that researchers studying special education teacher attrition with TFS data used only reasons for leaving, but not moving, especially given the higher moving rates among special educators. Carver-Thomas and Darling-Hammond (2017) reported both types of attrition, however, they did not disaggregate special education movers in their analyses.
Discussion
Our synthesis of special education teacher attrition research provided us with an opportunity to assess the state of research since 2002. In the following sections, we emphasize factors most strongly related to attrition, and critique substantive and methodological strengths and weaknesses, identifying research priorities and implications for practice.
Factors Most Strongly Associated With Attrition
The strongest findings relate to working conditions. Studies consistently found that demands were related to teachers’ attrition and retention. Because studies examined different demands (e.g., perceptions of demands, students, caseloads, paperwork), it is not clear which demands, or combination of demands, are most impactful. However, these aggregated studies suggest that special educators struggle with work demands and when these demands exceed their capacity to fulfill them, they may be at greater risk for attrition (e.g., Bettini et al., 2017).
Recent studies of school social contexts confirmed prior research (Billingsley, 2004), showing administrative and collegial support and school culture, particularly, a culture of collective responsibility, contribute to special education teacher retention (e.g., Berry, 2012; Conley & You, 2017; Jones et al., 2013).
Two studies of financial interventions were particularly important contributions. Clotfelter et al. (2008) and Feng and Sass (2017) were the first researchers to study the impact of financial incentives on retention, using methods permitting causal inferences. Findings suggest relatively modest financial incentives may make a difference in special educators’ retention, which may be cost effective given the high costs of attrition (Milanowski & Odden, 2007). Although increasing compensation may retain special educators, no research is available to suggest how long these better compensated teachers will remain.
As in prior research, recent studies suggest early career teachers were more likely to move to other schools (e.g., Boe et al., 2008). Two recent studies investigating school factors also suggest that attrition rates were higher in schools serving more students of color and students living in poverty (Carver-Thomas & Darling-Hammond, 2017; Conley & You, 2017).
Substantive and Methodological Critique and Research Priorities
Researchers considered a wide range of questions and used a variety of methods, a strength of the research. For example, small-scale studies with purposeful samples focused on teachers at high risk of attrition (e.g., Prather-Jones, 2011a), while others used large, representative samples to examine teachers’ reasons for leaving across the United States (e.g., Carver-Thomas & Darling-Hammond, 2017). Despite some strengths, substantial improvements are needed to improve the quality and usefulness of attrition research. Only 2.1 studies were published, per year, over the past 15 years. Given the low rate of research, researchers should be deliberate about questions, methods, and dissemination strategies that add substantially to the knowledge base.
Focus on Studies of Actual Attrition Versus Intent
Less than half of the researchers studied teachers’ actual leaving, relying on intent to leave and stay. Intent is a useful variable, as it is relatively inexpensive to measure and is moderately correlated with actual attrition (Gersten et al., 2001). However, overreliance on intent as a proxy for attrition is problematic, as the degree to which it predicts actual attrition may vary over the school year and it is possible that some factors shaping intent may be not be powerful enough to predict attrition.
Few studies differentiated movers versus leavers. We need more studies that include leaving and moving, especially as moving rates are higher among special educators than among most other teachers (Carver-Thomas & Darling-Hammond, 2017). In addition, transfers from general to special education are often not included in attrition research (Boe et al., 2008, is an exception).
Define Stayer
Several studies defined stayers as teachers who had remained for a set time, ranging from a minimum of 5 years (López-Estrada & Koyama, 2010) to a minimum of 12 years (Lesh et al., 2017). Defining stayers based on years of experience is potentially problematic, as stayers may in fact be planning to leave soon. In addition, researchers did not consider whether stayers demonstrated strong skills and would be desirable to retain. Future researchers should consider focusing on effective stayers, considering a combination of the number of years they stayed, their plans to stay in the future, and factors influencing their decisions.
Include or Generate Theory to Inform Understanding of Attrition
Only a third of the studies used a conceptual or theoretical framework to inform their work, a clear weakness in this body of research. Strong theoretical or conceptual frameworks are needed in future studies. They help researchers build off one another’s work in more deliberate ways, as they illuminate how different constructs relate to one another. In addition, they provide insights into potential new directions for inquiry. For example, Cancio et al. (2013) used House’s theory to parse varied types of administrative support; the theory supported a more focused inquiry into the construct of administrative support. Other studies (e.g., Bettini et al., 2017) used conservation of resources theory to justify examining workload manageability, a promising construct that may be useful for examining complex interactions among varied demands and supports. This theory might inform the design of interventions to improve retention. For example, does reducing demands (e.g., nonteaching responsibilities) and increasing support (e.g., PD, curricula, collaboration) lead to increased workload manageability, reduced burnout, stronger effectiveness, and increased retention? Researchers should also consider other potentially useful frameworks (see Guarino et al., 2006, for a discussion about theories relevant to the study of teacher attrition and retention).
Study Interrelationships Among Factors
Past researchers have examined complex interrelationships among predictors of intent (e.g., Billingsley, 2004), but few current studies examined these kinds of interrelationships. We need research that explores complex relationships among malleable factors (i.e., working conditions, preparation/qualifications), affective reactions to work (e.g., stress, burnout, job satisfaction), and attrition. A combination of complex demands (e.g., caseloads, problematic student behavior), weak supports (e.g., resources, social support), and insufficient preparation may be more stressful, and more strongly associated with attrition, than any single factor alone. Articulating these relationships, and how they might be mediated by affective responses, would be useful. For example, are some supports (e.g., collegial support) more strongly associated with attrition when others (e.g., administrative) are weak, or when demands (e.g., instructional responsibilities) are high? What specific social contexts are most important for less experienced teachers? Are social contexts more predictive of attrition for teachers from minoritized groups? These questions could be answered using SEM with survey data (e.g., SASS/NTPS), or by combining surveys with administrative data.
Conduct Intervention Studies
Only two studies permitted causal inferences (Clotfelter et al., 2008; Feng & Sass, 2017). Given that research has consistently found some conditions predict intent (e.g., administrative support, demands), scholars should evaluate the effects of interventions to improve retention to document causal relationships. For example, scholars could develop interventions to improve special educators’ working conditions and use single case design methods to document the effects of those interventions on proximal outcomes related to attrition (e.g., workload manageability, burnout, job satisfaction). In addition, scholars could embed measures of attrition into other intervention research, to determine how PD initiatives and school reform efforts (e.g., PBIS) relate to changes in attrition. In addition, using extant state and district administrative data sets, scholars can use regression discontinuity and propensity score methods to take advantage of natural variability in the implementation of intervention efforts, and determine how those efforts are associated with changes in attrition rates.
Use High-Quality Qualitative Methods
Some qualitative studies in this review contributed value by exploring areas that have seldom been examined in prior research (e.g., Prather-Jones, 2011b). However, some qualitative studies were unfocused, broadly examining factors teachers felt contributed to attrition, such that they provided little or no new information beyond what has long been known. We know that some factors relate to attrition, and simply reiterating that these conditions matter does not add to the literature. Qualitative research can add value if it is used to build stronger theory, illuminating what aspects of these factors are most important, why, for whom, and under what circumstances. For example, qualitative studies have unique potential to elaborate our understanding of collegial support, by, for instance, illuminating what dimensions of collegial support shape teachers’ plans.
Qualitative research could contribute particular value to understanding the process by which teachers choose to leave. Current studies of leavers and movers are largely quantitative, requiring teachers to respond to discrete, brief statements about their reasons for attrition. Thus, there are no studies that provide in-depth and contextualized accounts of teachers’ decisions to leave, a notable weakness (though Gehrke & McCoy, 2007, interviewed several teachers who left). Teachers do not decide to leave at a single time, rather, they consider their options over time with others in their social networks (Clandinin, Long, Schaefer, Downey, & Steeves, 2015). Yet, we have no studies investigating the process by which they decide to leave nor any studies following them from the time they enter teaching until they leave.
Examine the Role of Teacher Effectiveness
Only one study examined how teachers’ instructional practices related to intent (Albrecht et al., 2009). None examined how their effectiveness (or student achievement) related to attrition, despite strong research showing relationships between general educators’ effectiveness and attrition (Goldhaber et al., 2018). Ideally, retention efforts would be targeted to effective teachers. To target these teachers, we need research examining conditions under which more effective teachers leave. Furthermore, scholars have posited that teachers are more likely to leave when they do not experience success in serving students (Johnson & Birkeland, 2003). Several current studies suggested working conditions may influence attrition by reducing or promoting teachers’ capacities to effectively serve students (e.g., Kaff, 2004). For example, one teacher shared, “I have a great support system in my building. Until that system breaks down and I don’t have the support I need to run a positive, productive program, I plan to continue what I am doing” (Albrecht et al., 2009, p. 1014). Future research should consider including teachers’ perceptions of their own effectiveness as a mediator of relationships between various conditions and their attrition.
Consider Additional Comparisons for Specific Teacher Groups
There is a need for comparison studies for special educators at particular risk of leaving, as well as those teacher groups that have rarely been disaggregated in attrition/retention research. None of the research we reviewed was focused primarily on (a) teachers entering through varied pathways (e.g., alternative, for profit, on-line programs), (b) males, an important are of research given the lack of male special educators, (c) low-incidence teachers, a key shortage area (Levin et al., 2015), or (d) teachers working in varied service delivery models (e.g., co-teaching, self-contained). Several studies compared special and general educators, providing an understanding about how factors may differentially relate to their attrition (e.g., Jones et al., 2013) and research articulating such differences continues to add value.
It is particularly concerning that only one study addressed retention of Mexican American teachers, and none examined other teachers of color, despite an urgent need to retain teachers of color (Billingsley, Bettini, et al., 2017). We encourage researchers to move beyond reporting demographic identifiers for participants and begin considering how teachers’ sociocultural identities—their understandings of the key indicators of their own identity, including but not limited to their racial/ethnic identity—shape their attrition. Such work will require moving beyond the simplistic use of the racial/ethnic categories from the U.S. census, and will probably require qualitative and mixed methods approaches.
Use National Data Sets to Determine Reasons for Attrition
Several studies used TFS data to examine teachers’ retroactive reasons for why they actually left teaching (e.g., Boe et al., 2008; Carver-Thomas & Darling-Hammond, 2017), however, attrition data for some TFS years have not been reported. In addition, special educators’ reasons for moving or transferring to other fields were only explored by Boe et al. (2008). The TFS is readily available and (a) provides special educators’ perspectives about leaving and moving, allowing comparisons with general educators; (b) allows the comparison of reasons for attrition over time; (c) includes reasons that received little or no attention in other research (e.g., accountability Carver-Thomas & Darling-Hammond, 2017); (d) can be used to triangulate findings from studies of intent (Conley & You, 2017, administrative support); and (e) could include comparisons of teachers (e.g., urban vs. rural). The TFS is limited in that it cannot be used to study different groups of special educators (e.g., high vs. low incidence as it is not possible to assess these subgroups), so other surveys might be designed to make these comparisons. In addition, special educators’ reasons for leaving may be influenced by factors that they are unaware of; a teacher leaving because of student behavior may not realize that a mentor could have helped and is not likely to select “lack of mentorship” as a reason for attrition. We encourage those interested in surveying teachers about reasons for attrition to use the TFS data, which are currently underused or to extend the research by studying special education teacher groups and response options not included in the TFS.
Study the Consequences of Attrition
Some researchers have documented the deleterious financial and academic effects of general education teacher attrition (e.g., Ronfeldt et al., 2013). Yet, no studies have examined consequences of special education attrition. What effect does special education attrition have on their students, students’ families, and the teachers with whom they collaborated? How does attrition effect the achievement of students with disabilities?
Disseminate to Practitioner and Policy Audiences
Researchers need to disseminate findings about attrition/retention to a broader stakeholder group, those outside of special education (e.g., principals, district leaders). Only two of the present studies reached general education leadership or policy journals (Clotfelter et al., 2008; Feng & Sass, 2017), while one was published in a special education leadership journal (Billingsley, 2007). Scholars should consider improving dissemination efforts, especially to practitioner audiences responsible for retention, using varied types of material (e.g., briefs, newsletters, social media).
Implications for Policymakers, Leaders, and Teacher Educators
Policymakers, school and district leaders, and teacher educators share responsibility for cultivating and keeping a competent special education workforce. First, national policymakers should provide greater support for researchers interested in using the SASS/NTPS and TFS to study attrition, including funding studies and creating training opportunities in using restricted data. Similarly, state and local policymakers should consider learning from their administrative data sets. For example, Miami-Dade County (Florida) provided their administrative data set to researchers, who then provided unique insights into principals’ motivations to move schools and their impact on students (Beteille, Kalogrides, & Loeb, 2012), a possibility for other districts.
Second, institutions of higher education should focus on preparing leaders to support all teachers and students. Special educators may have differential access to support in schools (Jones et al., 2013) as principals and general educators may see special educators’ work as falling outside their area of expertise or responsibility. It is critical that states and districts invest in defining what effective leadership means in supporting special educators and their students (see Council of Chief State School Officers, 2017), as many leadership actions are low cost and can make a difference (e.g., learning about special educators’ work, supporting collective responsibility for students with disabilities, showing appreciation). Teacher educators also need to support special and general education teacher collaboration during preservice and provide special educators with strategies for structuring their work and advocating for supportive instructional conditions (see Blanton et al., 2017).
Third, district leaders have important roles in assessing working conditions, identifying current and potential problems specific to their district so interventions can be tailored to local needs. States could support them in these efforts, providing guidance for assessing (a) attrition rates, disaggregated by categories of interest to the district (disabilities taught, experience, race/ethnicity, service delivery) and (b) working conditions.
Fourth, leaders need to focus on supporting early career teachers (Billingsley et al., in press), as they are at a higher risk of leaving. Specifically, leaders should make efforts to assign new special educators in positions they are best qualified for, supporting their induction (Ingersoll & Strong, 2011) and structuring working conditions that support their effectiveness (e.g., material resources, planning time). Leaders need to consider the importance of collaboration to retention (Smith & Ingersoll, 2004), facilitating special educators as members of the school community.
Fifth, special educators’ demands are increasing as caseloads rise (Dewey et al., 2017), requiring more intensive collaboration (Scruggs et al., 2007). Given that special educators are more likely to consider leaving when demands are high (e.g., Bettini et al., 2017), leaders should carefully monitor demands (e.g., caseloads, instructional time, content areas taught, schedules for collaboration) and redistribute routine paperwork to staff, allowing them to focus on instruction.
Finally, leaders and policymakers should consider differentiating compensation and providing financial incentives to retain teachers. The studies reviewed here provide evidence that financial compensation can have an effect on retention, provided it is of sufficient magnitude.
Conclusions
Equitable opportunities for students with disabilities to learn are threatened, as special education teacher shortages and high teacher attrition rates persist. Despite progress in understanding contributors to attrition, the field needs to be more (a) strategic in designing and supporting a cohesive, national research agenda to better understand interrelationships among the many factors that contribute to special educators’ attrition, including intervention studies and (b) systematic in helping policy makers and leaders use what is already known to create the instructional conditions (e.g., collaboration, workloads, scheduling, resources) that support special educators’ retention and effectiveness. Such efforts require key stakeholders at multiple levels, as we are unlikely to improve retention without systematic and coordinated efforts across federal, state, and local institutions. As a special education field, we cannot document improvements or success in retention over the last 25 years. When the next review of teacher attrition is written, will we have made progress? Will we be able to describe the success of our efforts to improve retention?
Footnotes

Notes
Authors
BONNIE BILLINGSLEY is a professor in the School of Education, Virginia Polytechnic Institute and State University, 205 War Memorial Hall, Blacksburg, VA 24061-0313; email:
ELIZABETH BETTINI is an assistant professor in the special education program at Boston University’s Wheelock College of Education and Human Development, 2 Silber Way, Boston, MA 02215; email: