
Abstract
This article offers three contributions for conducting meta-analytic reviews in education research. First, we review publication bias and the challenges it presents for meta-analytic researchers. Second, we review the most recent and optimal techniques for evaluating the presence and influence of publication bias in meta-analyses. We then re-analyze two sets of meta-analytic data from the literacy literature that have been published in different journals. The analyses serve as case examples of the techniques reviewed, and the results demonstrate a range of findings from noticeable instances of publication bias to minimal or no bias. The conclusions have important implications for research, policymaking, and practice. Finally, we discuss recommendations for future research.
E
Meta-analytic research can be particularly useful in guiding policymaking in order to address educational challenges. Presently, the “minority achievement gap” is of particular concern. Data gathered by the National Assessment of Educational Progress (2009) in their Nation’s Report Card on reading indicate that the gap between minority and majority students on measures of reading is large. Although the gap between black and white students is historic and persistent (Johnston & Viadero, 2000), Hispanic students, especially new immigrants, also lag behind majority students on measures of reading. This issue is pressing enough that the U.S. Department of Education is planning to spend $150 million on dual-immersion instruction for English language learners (ELLs) (“Language a Barrier,” 2010). Although funding issues are a challenge, there is also a lack of a clear direction as to which policies and practices are the most effective. Meta-analytic research can be used to shed light on these issues as these reviews can quantitatively combine data from multiple empirical studies and provide estimates of population effect sizes (e.g., standardized mean- differences and correlations). However, our confidence in meta-analytic results is dependent upon the extent to which the findings are accurate and free from bias. One of the greatest threats to the validity of meta-analytic research (as well as other types of reviews such as narrative and systematic reviews) is publication bias (Rothstein, Sutton, & Borenstein, 2005a).
Publication bias exists when “the research that appears in the published literature is systematically unrepresentative of the population of completed studies” (Rothstein et al., 2005a, p. 1). In other words, publication bias is a problem for meta-analytic reviews when the studies included in the meta-analysis are systematically unrepresentative of all studies that have been completed on the question of interest (i.e., studies that would have met the inclusion criteria of the meta-analytic review). A common publication bias finding is that studies with small samples and statistically non-significant results are absent from the available literature (Dickersin, 2005; McDaniel, Rothstein, & Whetzel, 2006). It is thus similar to concepts such as the availability bias (Hunter & Schmidt, 2004) and the dissemination bias (Song, Easterwood, Gilbody, Duley, & Sutton, 2000) and has been referred to as “the kryptonite of evidence-based practice” (Banks & McDaniel, 2011) and “the Achilles’ heel of systematic reviews” (Torgerson, 2006). Publication bias could thus be considered the antagonist of meta-analytic reviews and, therefore, effective policymaking. If federal and state governments wish to engage in evidence-based practice and to direct funding toward educational policies and/or practices that have been found to be effective based on meta-analytic research, we must address the presence and magnitude of publication bias in our meta-analytic reviews.
As an example of the lack of attention paid to publication bias in educational meta-analytic reviews, consider the following. The Review of Educational Research is one of the most prominent and prestigious journal outlets for scientific education research and it has one of the highest impact factors in education as indicated by the 2010 Journal Citation Report. We conducted a review of all educational meta-analytic and systematic reviews published in the Review of Educational Research from January 2005 to July 2011. The year 2005 was used as the starting point as it corresponds with the release of the key publication, Publication Bias in Meta-Analysis by Rothstein, Sutton, and Borenstein (2005b). We identified 43 meta-analytic studies in our review. Of these, slightly more than half (56%) employed some type of publication bias method. Of those that did address publication bias, the inadequate failsafe N method (Becker, 2005; McDaniel et al., 2006) and a basic funnel plot (Sterne, Gavaghan, & Egger, 2005) were the two most commonly used methods (26% and 23%, respectively). Some studies also employed the trim and fill method (14% of studies) (Duval, 2005) and source comparisons (16%) between published and grey literature (e.g., conference papers, dissertations, government documents, technical reports, documents in a foreign language, etc.; Hopewell, Clarke, & Mallett, 2005). Only one fourth (26%) of the studies used at least two methods to evaluate publication bias.
In sum, the majority of meta-analytic studies in our review did not use advanced publication bias methods, nor did they make use of multiple methods that, when in agreement, serve to increase our confidence in conclusions regarding publication bias (Jick, 1979; Sackett & Larson, 1990). As the Review of Educational Research is one of the most rigorous journals in the field of education, the failure to adequately address the threat of publication bias could be worse in other journals. To address this issue, it is necessary to educate meta-analytic researchers, as well as a more general audience, of the need to deal with the threat of publication bias.
Contributions of This Article
This article serves to advance research in education in three important ways. First, we introduce publication bias and discuss its potential causes. Second, we review the most modern and effective techniques of assessing the presence of publication bias and estimating its influence on meta-analytic results. To provide context, we re-analyze two sets of meta-analytic data from literacy research that were published in different education journals. Finally, we propose recommendations for future research.
Causes of Publication Bias
The classic case of publication bias occurs as a result of a reliance on statistical significance tests to determine whether an intervention in a study “works” or not and, therefore, whether the results of that study are publishable. Thus, studies with results that are not statistically significant are less likely to be published (Greenwald, 1975). Studies with results that are statistically significant are likely to be of two kinds: (1) studies that have a large sample size (their results may achieve statistical significance regardless of the magnitude of the effect size) and (2) small sample size studies with effect sizes that are large in magnitude and, therefore, achieve statistical significance despite the small sample size. Typically, causes of publication bias can be classified as either outcome-level or sample-level causes. We briefly review both of these causes in the following sections.
Outcome-level causes
Outcome-level causes of publication bias typically occur as a result of selective reporting when studies “report only some of the outcomes measured and the selection of an outcome for reporting is associated with the statistical significance or importance of the result” (Song et al., 2010, p. 21). If a paper is accepted for publication at a journal or conference, researchers may not fully report all results (e.g., all outcome variables or sub-group analyses) or descriptive statistics (e.g., means and standard deviations) in their study necessary for inclusion in a meta-analysis (Sutton, 2005). For instance, multiple sub-group analyses are often conducted. Yet, only the results that are statistically significant are likely to be included in the paper (Sutton & Pigott, 2005). Also, editors and reviewers may ask to have specific analyses and/or results removed to save space (Evangelou, Trikalinos, & Ioannidis, 2005).
Sample-level causes
There are numerous ways that sample-level causes of publication bias occur. Some evidence indicates that researchers are the primary cause of publication bias because study results are often not widely disseminated or are never submitted for publication (Dickersin, 2005). It is also possible that editor or reviewer decisions cause publication bias. Researchers, editors, or reviewers may not encourage the publication of a study because the results are statistically insignificant. If the results of a study are not statistically significant (e.g., due to small effect size or small sample size), the results may be perceived as “uninteresting” and editors or reviewers may not recommend publication. Therefore, completely unpublished studies or studies in the grey literature (Hopewell et al., 2005) could be systematically different from the published literature. For instance, a group of teachers within a school who conduct an action research study on the use of literature circles may not submit their research because the results were statistically insignificant.
Publication bias can also occur because results are purposefully not released by an organization. Commercial organizations (e.g., test vendors) with monetary interests in a test or intervention may not release results from studies that could potentially cast their product in a negative light (McDaniel et al., 2006). Thus, research conducted by these entities would not be accessible by education researchers. Publication bias may also result from an inability to locate studies, particularly in the grey literature (Hopewell et al., 2005). A failure to locate research can happen because of a systematic search that lacks in rigor or because some research is simply inaccessible. This is of particular concern in the social sciences, including education, as research is typically widely dispersed and not necessarily readily available in published journals (Rothstein et al., 2005b). Thus, it is usually quite difficult and time-consuming to search the grey literature and to contact independent researchers for unpublished samples (Hopewell et al., 2005).
Empirical evidence indicates that publication bias can also occur due to the slow dissemination of research results. This phenomenon is referred to as a time-lag bias, such that the dissemination of research results (e.g., publication in a journal or conference) is faster for studies with large sample sizes and statistically significant results than for small sample size studies with small, statistically insignificant results (Banks, Kepes, & McDaniel, 2012; Ioannidis, 1998; Trikalinos & Ioannidis, 2005). Of a similar nature, the Proteus effect describes instances when research results that are dramatic are published more quickly (Trikalinos & Ioannidis, 2005). Under either condition, earlier effect sizes (e.g., a standardized mean-difference between a treatment and a control) tend to be larger in magnitude than results that emerge later in time (e.g., Banks et al., in press).
In summary, there are multiple outcome- and sample-level causes of publication bias. In the next section, we review different methods that can be used to detect and assess the severity of publication bias. We illustrate these methods on two previously published meta-analytic data sets.
Method
Data Source
This study used data from two meta-analytic reviews on literacy published in different education journals. These reviews were not selected because of any specific problem (our article complements and extends the work of these authors). Instead, they were randomly selected based on pre-set inclusion criteria: (1) reviews of literacy research for consistency in the literature area, (2) technical clarity—a clear and thorough explanation of the study design as well as statistical analyses, (3) reporting of primary data necessary for statistical analyses, and (4) at least 10 samples in the meta-analysis (Sterne et al., 2011) and an I2 statistic (Borenstein, Hedges, Higgins, & Rothstein, 2009; Higgins, Thompson, Deeks, & Altman, 2003) equal to or less than 75%.
From these studies, we obtained two data sets. The first data set from Bangert-Drowns, Hurley, and Wilkinson (2004) investigated the use of school-based writing-to-learn programs in order to improve academic achievement for a wide age group ranging from elementary school to college (see Table 1 in Bangert-Drowns et al., 2004, p. 40). Our second data set comes from Piasta and Wagner (2010). This meta-analytic review targeted instructional techniques that sought to improve alphabet learning outcomes (see Appendices A and B in Piasta & Wagner, 2010). 1 More specifically, the data set chosen included samples that examined how to improve letter name knowledge (LNK). To be consistent with the original studies, the results presented for Bangert-Drowns et al. (2004) are Cohen’s d and the results presented for Piasta and Wagner (2010) are Hedge’s g.
Meta-Analytically Derived Results and Publication Bias Analysis for Bangert-Drowns et al. (2004) a b
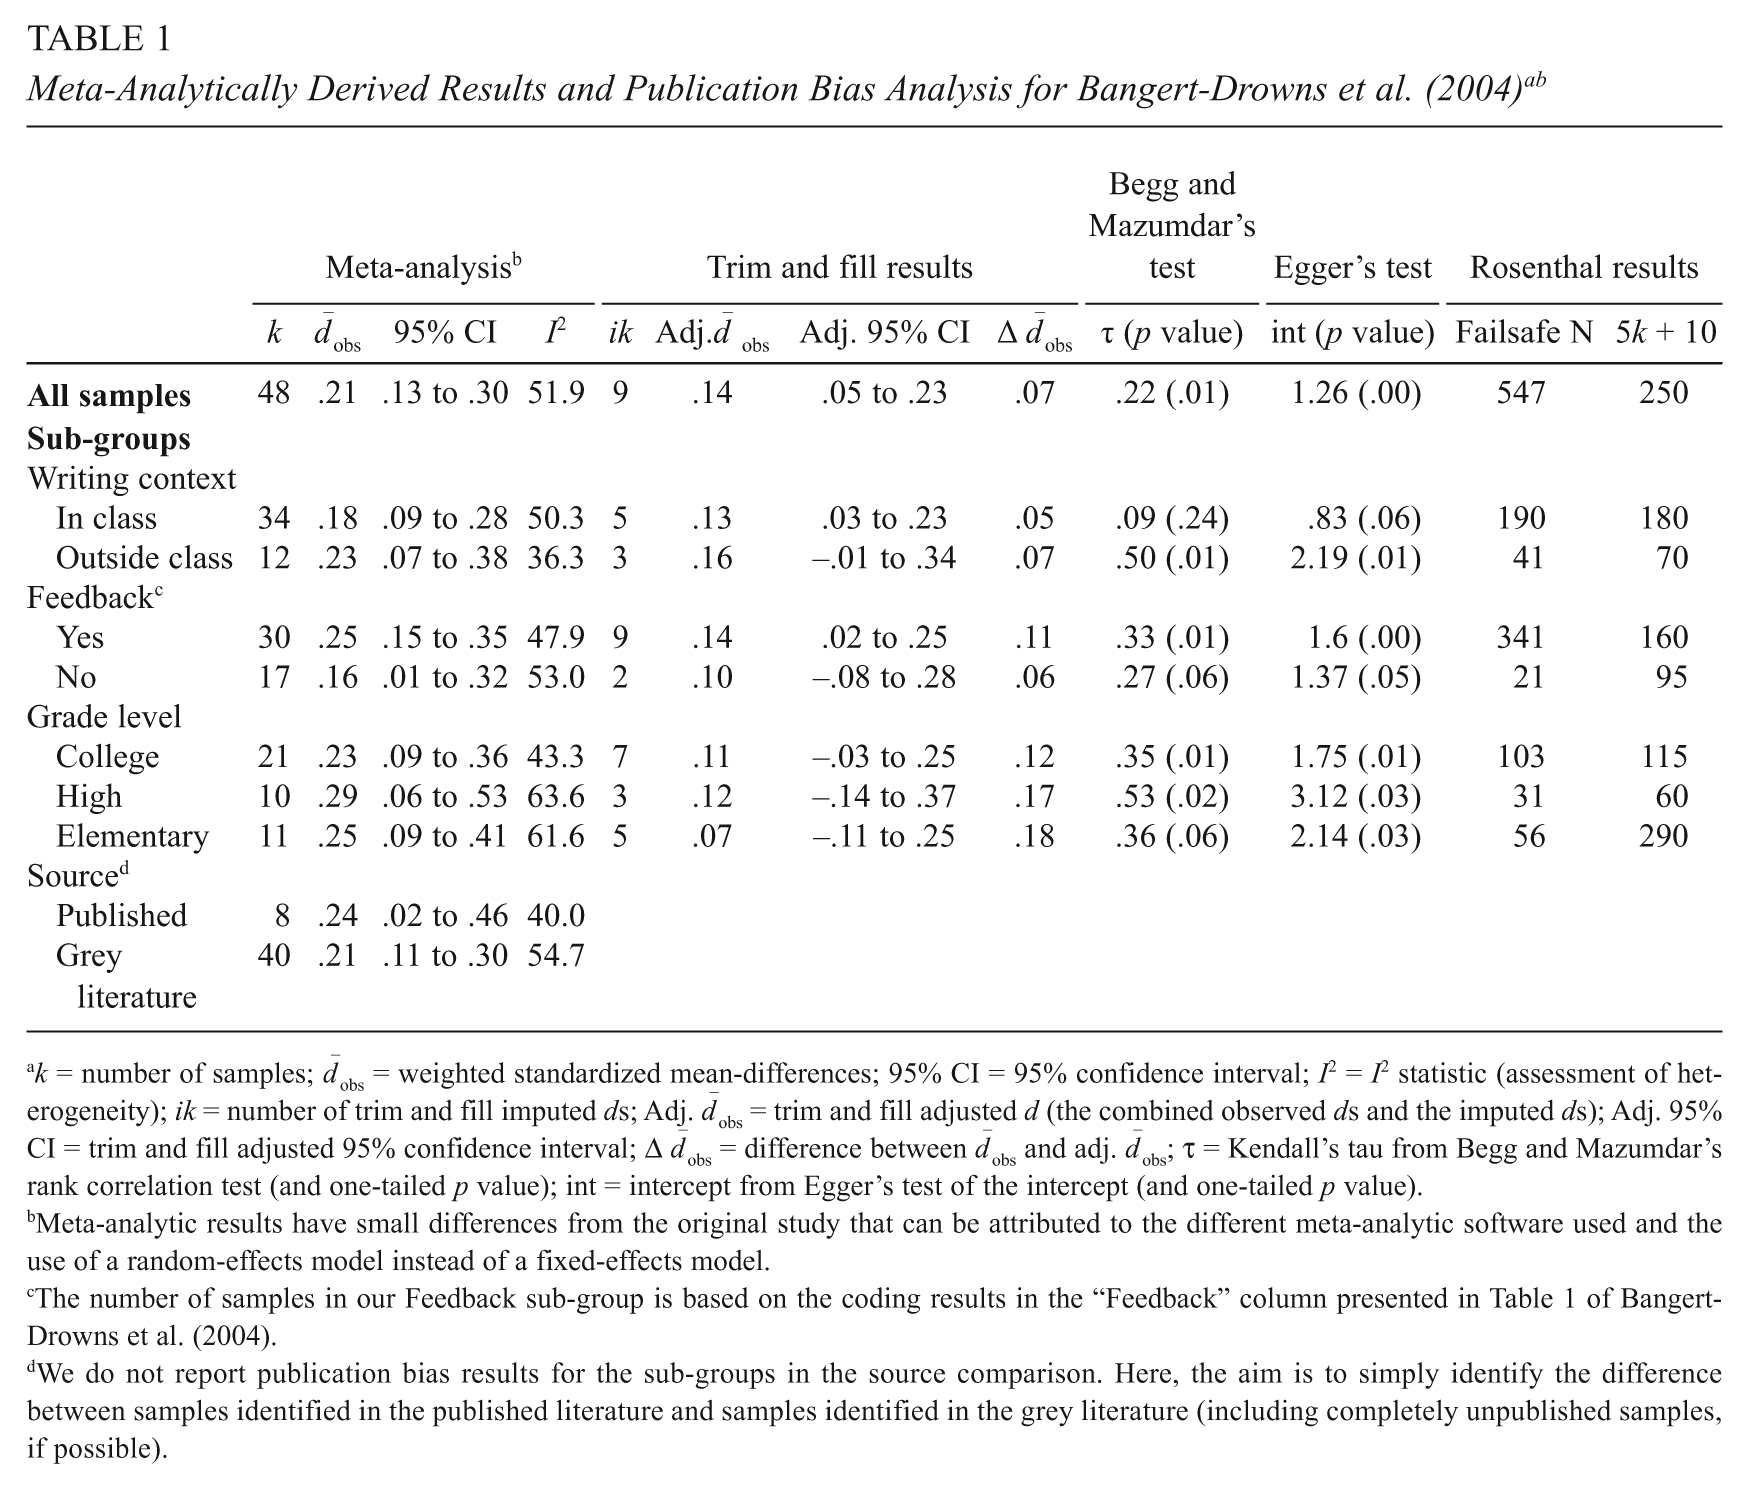
k = number of samples;
Meta-analytic results have small differences from the original study that can be attributed to the different meta-analytic software used and the use of a random-effects model instead of a fixed-effects model.
The number of samples in our Feedback sub-group is based on the coding results in the “Feedback” column presented in Table 1 of Bangert-Drowns et al. (2004).
We do not report publication bias results for the sub-groups in the source comparison. Here, the aim is to simply identify the difference between samples identified in the published literature and samples identified in the grey literature (including completely unpublished samples, if possible).
Methods for Dealing With Publication Bias
A random-effects model was used to analyze the observed effect sizes (e.g., standardized mean-differences) meta-analytically. Next, we used six publication bias assessment methods: (1) the contour-enhanced funnel plot; (2) the trim and fill technique; (3) cumulative meta-analyses by precision and by publication date; (4) Egger’s test of the intercept; (5) Begg and Mazumdar’s rank correlation; and, for comparative purposes, (6) Rosenthal’s failsafe N technique. The analyses were conducted using Stata (contour-enhanced funnel plots; Palmer, Peters, Sutton, & Moreno, 2008) and the Comprehensive Meta-Analysis (CMA) software (Borenstein, Hedges, Higgins, & Rothstein, 2005). Publication bias techniques can be employed with meta-analyses that are founded upon either a fixed- or random-effects model. The latter is the appropriate model and thus preferred in the social sciences (Borenstein et al., 2009; Hunter & Schmidt, 2004). Small differences in the meta-analytic results between this study and the original ones can be attributed to the use of a random-effects model instead of a fixed-effects model (i.e., Bangert-Drowns et al., 2004) and small differences in meta-analytic sample sizes (i.e., Piasta & Wagner, 2010). 2
The publication bias methods illustrated in this study are designed to identify “missing” samples. The reason for the “missingness” (i.e., outcome- or sample-level cause) cannot be determined by the current methods. Although Sutton and Pigott (2005) discussed several techniques to deal specifically with sample-level causes of sample suppression, many of the techniques to address this (e.g., complete-case analysis, mean substitution, maximum likelihood, multiple imputation, etc.) assume that the data pertaining to the missing samples are missing completely at random or missing at random (see also Schafer & Graham, 2002). Most likely, this assumption does not hold true for data suppression in the case of publication bias (Newman, 2003; Sutton & Pigott, 2005). Thus, we used methods that, although initially developed for the assessment of the missingness of whole samples, can be applied to other levels of missing data (i.e., outcome-level causes) (Sutton & Pigott, 2005).
We advocate the use of multiple methods to assess publication. First, each method provides a test of how robust the estimated effect size is to the influence of publication bias. Second, to the extent that the results are consistent across multiple publication bias methods, the results and conclusions should be more credible. In the event that publication bias methods rely on different assumptions, consistency may not be expected but should increase our confidence in the findings. In the event that multiple advanced publication bias methods are in disagreement, conclusions of publication bias are inconclusive and more research is required. A case for the use of multiple methods is founded on the concept of triangulation, which is the use of “multiple reference points to locate an object’s exact position” (Jick, 1979, p. 602). In the social sciences, triangulation references the use of multiple study designs, settings, samples, and methods to examine a research hypothesis (Sackett & Larson, 1990). In the context of publication bias research, the use of multiple methods can provide a more precise evaluation of the presence and magnitude of this bias.
Funnel plots
The basic funnel plot is an often-used publication bias detection method in the health sciences (Sterne et al., 2005). This plot displays the magnitude of the effect size along the X axis and precision (the inverse of a sample’s standard error) along the Y axis (Sterne & Egger, 2005). As a result, larger effect sizes (e.g., standardized mean-differences) are displayed on the right side of the funnel plot, and lower ones on the left side. More precise samples (i.e., larger samples, which more accurately reflect the true population because they suffer from less sampling error; Borenstein et al., 2009) have higher Y-values compared to less precise samples, which have lower Y-values. Because larger samples are, on average, more precise estimates of the population mean, these samples will be similar to each other and they will cluster together next to the center line of the funnel plot (i.e., the population mean). The opposite is true of small samples. As these samples typically have more sampling error, they tend to have larger deviations from the population parameter and, thus, scatter more widely at the base of the funnel plot.
If all samples conducted on a type of intervention were available to be graphed in a funnel plot, the distribution of effect sizes would be symmetrical (for an example, see Figure 1 in Banks, Batchelor, & McDaniel, 2010). Yet, if small samples with statistically insignificant effects were absent, asymmetry in the funnel plot would provide evidence that is consistent with a conclusion of publication bias. Typically, smaller samples are missing from the left side of the funnel plot, which indicates an absence of negative or close-to-zero effect sizes (i.e., insignificant effect sizes). Larger samples with small effects are less likely to be missing because these samples are large enough to achieve statistical significance.
Funnel plots of the observed effect sizes.
However, there can be other causes of funnel plot asymmetry that are not to be confused with publication bias. For instance, “true” heterogeneity can cause funnel plot asymmetry. A moderating variable, such as gender, may cause a bimodal distribution (i.e., different distributions for males and females on a literacy intervention) that results in funnel plot asymmetry. The small sample bias may also be a cause of funnel plot asymmetry. This bias occurs if, for instance, multiple samples in a literacy meta-analytic review are conducted in small “extreme” groups (i.e., samples with gifted students or students with identified learning disabilities). Samples drawn from small extreme groups are likely to demonstrate very different but “real” effect sizes from samples drawn from large, less extreme groups. As a funnel plot explores the distribution of samples according to precision and the magnitude of the effect size, such a situation (i.e., the small sample bias) can cause funnel plot asymmetry and could be confused with publication bias. Therefore, meta-analytic researchers should give consideration to their research question and the primary samples included in their meta-analytic review to determine if small sample bias is a concern (Sterne et al., 2011). In the meta-analytic reviews re-analyzed here, there does not seem to be any compelling evidence to assume that asymmetry could result from “true” differences between large and small samples.
Although the funnel plot provides an opportunity for a visual inspection, this plot is limited as it does not consider levels of statistical significance. In the classic case of publication bias, effect sizes that are not statistically significant are less likely to be published. Thus, in order to evaluate publication bias, it is useful to consider the statistical significance of effect sizes in a funnel plot. Contour-enhanced funnel plots are a more recent technique that allow for a visual inspection that is aided by information regarding the significance level of effect sizes. The advantage of having this additional information is that it allows the discrimination between publication bias and other causes of funnel plot asymmetry, such as small sample bias (Peters, Sutton, Jones, Abrams, & Rushton, 2008). If statistically insignificant samples are absent from the funnel plot distribution, one can have greater confidence that an asymmetrical funnel plot is the result of publication bias. By contrast, if insignificant samples are not missing in an asymmetric funnel plot distribution, one could conclude that there might be other causes of funnel plot asymmetry (e.g., asymmetry could be due to the small sample bias; Sterne et al., 2011).
Trim and fill
The trim and fill method, first introduced by Duval and Tweedie (2000a, 2000b), is designed to evaluate funnel plot symmetry and adjusts meta-analytic results for the potential influence of publication bias. This technique “trims” extreme samples from the skewed side of the funnel plot (typically the right side) with no corresponding sample on the opposite side of the funnel plot. This procedure is iterative; it is repeated until the distribution of samples is symmetrical. Next, trimmed observed samples are added back (i.e., “filled”) to the funnel plot with an imputed sample on the opposite side to maintain symmetry. Finally, an adjusted effect size estimate is calculated, taking into consideration the observed effects as well as the filled ones. Thus, an advantage of this method is that it provides an estimation of the magnitude of publication bias.
Although this adjusted effect size may not be viewed as the best estimate of the true effect size of an intervention, it provides some evidence regarding the potential severity of the publication bias. Thus, the trim and fill method, used as a sensitivity analysis, allows a more complete interpretation of the influence of publication bias (Duval, 2005). It has been suggested that if the difference between the observed and adjusted effect size is small, the evidence for publication bias is “minimal” (Borenstein, 2005; McDaniel et al., 2006; Rothstein et al., 2005a). In the event that there is a noticeable difference between the observed and adjusted effect size, but the overall conclusion of the intervention does not change, publication bias is “moderate.” This may occur, for instance, if a large magnitude mean-difference of .80 is adjusted downward to .50 and is, therefore, moderate in size (Cohen, 1988). If, however, the difference between the observed and adjusted effect size is large and the ultimate conclusion of the intervention’s effectiveness changes, publication bias can be interpreted as “severe” (McDaniel et al., 2006; Rothstein et al., 2005a). This might even be the case if a small magnitude mean-difference of .20 (Cohen, 1988) were to be rendered practically irrelevant (e.g., mean-difference of .04). However, there are limitations to this technique. One limitation of the trim and fill analysis is that it implicitly assumes that random sampling error is the only source of variance across samples (i.e., that the samples are homogeneous). Thus, if a distribution of samples (from a given population) is not homogeneous (e.g., due to moderators or the small sample bias), asymmetry in the funnel plot may occur for reasons other than publication bias.
The I2 statistic (Higgins et al., 2003) can provide empirical support for the presence of moderators. This statistic provides an estimation of the percentage of variance in an effect size that is not the result of statistical artifacts (e.g., random sampling error). The range of the I2 statistic is from 0 to 100% and, in the medical sciences, cutoffs of 25%, 50%, and 75% are used to interpret the amount of heterogeneity as low, moderate, and high, respectively (Borenstein et al., 2009). In the social sciences, strict adherence to these cutoffs may be unwarranted. Because the primary study designs used in the medical sciences are randomized controlled trials, meta-analytic reviews in medicine typically have significantly less heterogeneity than in social science fields, such as education, where field studies are often used. Field studies tend to contain more uncontrolled variation than randomized controlled trials. Thus, in the social sciences, the I2 cutoffs of low, moderate, and high amounts of heterogeneity should be higher than what might be expected in medical research (Borenstein et al. 2009).
If heterogeneity is present, theoretically supported moderators should be considered. Publication bias analyses can then be conducted on sub-groups that control for the influence of identified moderators. However, the use of sub-groups is unlikely to completely remove the observed heterogeneity. Instead, they may minimize the amount of it. Furthermore, the use of sub-group analyses can substantially reduce the number of samples in the analysis, which can result in second-order sampling error. Outliers may also have a stronger influence in sub-group analyses. To mitigate concerns regarding these limitations, we recommend that researchers employ publication bias methods, such as the trim and fill, when the number of samples in a meta-analysis is at least 10 (Sterne et al., 2011).
Cumulative meta-analysis
A cumulative meta-analysis is a meta-analysis in which samples are sorted by a characteristic of interest, samples are added one at a time to the meta-analysis, and the meta-analysis is re-calculated each time in an iterative fashion. One may sort the samples by precision (i.e., the inverse of the standard error). Then, the most precise samples are added first, followed by the addition of the less precise samples in descending order. The cumulative mean estimates at each point in the process can be plotted in a forest plot, and the result can be examined for evidence of “drift” (Borenstein et al., 2009; McDaniel, 2009). A positive drift indicates evidence consistent with a conclusion of publication bias. However, one cannot completely rule out the possibility that drift in a forest plot can be the result of other factors, such as changes in the true effect over time due to different populations or increasing or decreasing the strength of an intervention or treatment (Ioannidis, 2005).
Samples can also be sorted by year of publication (Lau & Antman, 1992; Lau, Schmid, & Chalmers, 1995) to assess the potential presence of a time-lag bias, including the Proteus effect (Ioannidis, 1998; Trikalinos & Ioannidis, 2005). In this instance, an inference of publication bias due to the time-lag bias could be made with the observation of a negative drift (i.e., a drift from larger cumulative means to smaller cumulative means). This indicates that large magnitude results were published earlier and that the parameter estimate diminished as later samples emerged.
Correlation and regression-based methods
Begg and Mazumdar’s (1994) rank correlation test evaluates the correlation between effect size and standard error. In the typical example of publication bias, small sample studies are more difficult to publish when their results are statistically insignificant. Conversely, large sample studies are easier to publish regardless of the magnitude of their effect sizes (i.e., due to their large sample, even small magnitude effect sizes are likely to be statistically significant). If this is the case, one can expect an inverse relation between sample size and effect size, which is assessed by the rank correlation (i.e., Kendall’s tau b).
Egger’s test of the intercept (Egger, Smith, Schneider, & Minder, 1997) suggests that one can identify the presence of publication bias by predicting a standardized effect with precision using the funnel plot. The regression line’s slope captures the effect size and publication bias is indicated by the intercept (Borenstein et al., 2009; Sterne & Egger, 2005). A significant non-zero intercept indicates the presence of publication bias as funnel plot asymmetry will preclude the regression line from running through its origin.
One limitation of these two methods is that they are relatively low in power; their results may not be statistically significant if the number of samples is too small (an exemption to this is a case of extreme publication bias; Sterne & Egger, 2005). Thus, one cannot “fail” the test (i.e., a statistically insignificant result is not necessarily an indication for the absence of publication bias; Borenstein et al., 2005, 2009). Egger’s test of the intercept is a more powerful test than Begg and Mazumdar’s (1994) test because it can control for other factors that influence the detection of publication bias, such as sample size and effect size (Borenstein et al., 2005). A second limitation of these methods is that they require clear variation in sample sizes and one or more medium to large samples (Sterne & Egger, 2005; Sterne, Gavaghan, & Egger, 2000).
In this study, we interpret these two methods only when the number of samples in the meta-analytic distribution is greater than 10 (Sterne et al., 2011). 3 In summary, we recommend that the results of these correlation and regression-based methods be used when the meta-analytic sample (k) contains (1) primary studies with varying sample sizes, (2) medium and large samples, and (3) a total number of samples of at least 10 (k ≥ 10). We also suggest that these tests be used in conjunction with other publication bias methods (e.g., trim and fill and cumulative meta-analysis), especially the cumulative meta-analysis because it is not based on the funnel plot and has fewer requirements for the meta-analytic sample (Borenstein et al., 2009).
Failsafe N
For comparison purposes, we also use the problematic failsafe N method (Becker, 2005; McDaniel et al., 2006). Despite the problems with the failsafe N, it is still used in meta-analytic reviews published in the Review of Educational Research and other journals. To mitigate concerns about publication bias, Rosenthal (1979) proposed to calculate the number of studies that would be needed to make an effect size statistically insignificant. If only a small number of studies are needed to make an effect size statistically insignificant, this would be a cause for concern. Although failsafe N analyses have been in use for more than 30 years, the technique has two critical limitations (Becker, 2005). The first limitation is that the technique is based on the illogical assumption that suppressed samples all have an effect size of zero, ignoring the strong likelihood that missing studies have effect sizes that are simply close to zero or in the opposite direction. A second limitation is that the failsafe N is only concerned with statistical significance. Thus, it ignores the practical significance of an effect size and offers no adjusted estimate. Nevertheless, we include failsafe N analyses to demonstrate its shortcomings. Although alternatives to Rosenthal’s (1979) failsafe N have been introduced (e.g., Orwin, 1983), these modified approaches are still problematic. Their use to assess the presence of publication bias is not encouraged (Becker, 2005).
Source comparisons
A common technique to test for publication bias is the source comparison of published versus grey and unpublished literature. For instance, one can compare samples from the published literature (e.g., journals and test manuals) with samples from the grey literature (e.g., conference papers, dissertations, technical reports, etc.) and completely unpublished samples. Although this sub-group analysis can provide an indication of the extent to which published literature systematically differs from grey literature (e.g., Banks et al., 2010), it implicitly assumes that all unpublished samples have been identified. More often than not, this assumption is not met (Hopewell et al., 2005). Nonetheless, a sub-group analysis between published and grey literature as well as completely unpublished samples could be used as a complementary method to the previously described techniques.
Results
Tables 1 and 2 display our results. In each table, the first five columns display the distribution (sub-group) analyzed, the number of samples in the analysis, the observed effect size, the 95% confidence interval around the estimate, and the I2 statistic, which indicates the percentage of variance due to moderators. Columns six through nine display the results of the trim and fill analysis, including the number of imputed samples, the adjusted standardized mean-difference, the adjusted 95% confidence interval, and the resulting difference between the observed and the adjusted effect size. The next set of columns displays the results of Begg and Mazumdar’s rank correlation test and Egger’s test of the intercept. Finally, the last two columns contain the results of the failsafe N analysis. Meta-analytic results are thought to be robust against the influence of publication bias if the failsafe N is equal to or greater than 5 times the number of studies in the meta-analysis, plus 10 (Mullen, Muellerleile, & Bryant, 2001; Rosenthal, 1979).
Meta-Analytically Derived Results and Publication Bias Analysis for Piasta and Wagner (2010) a b
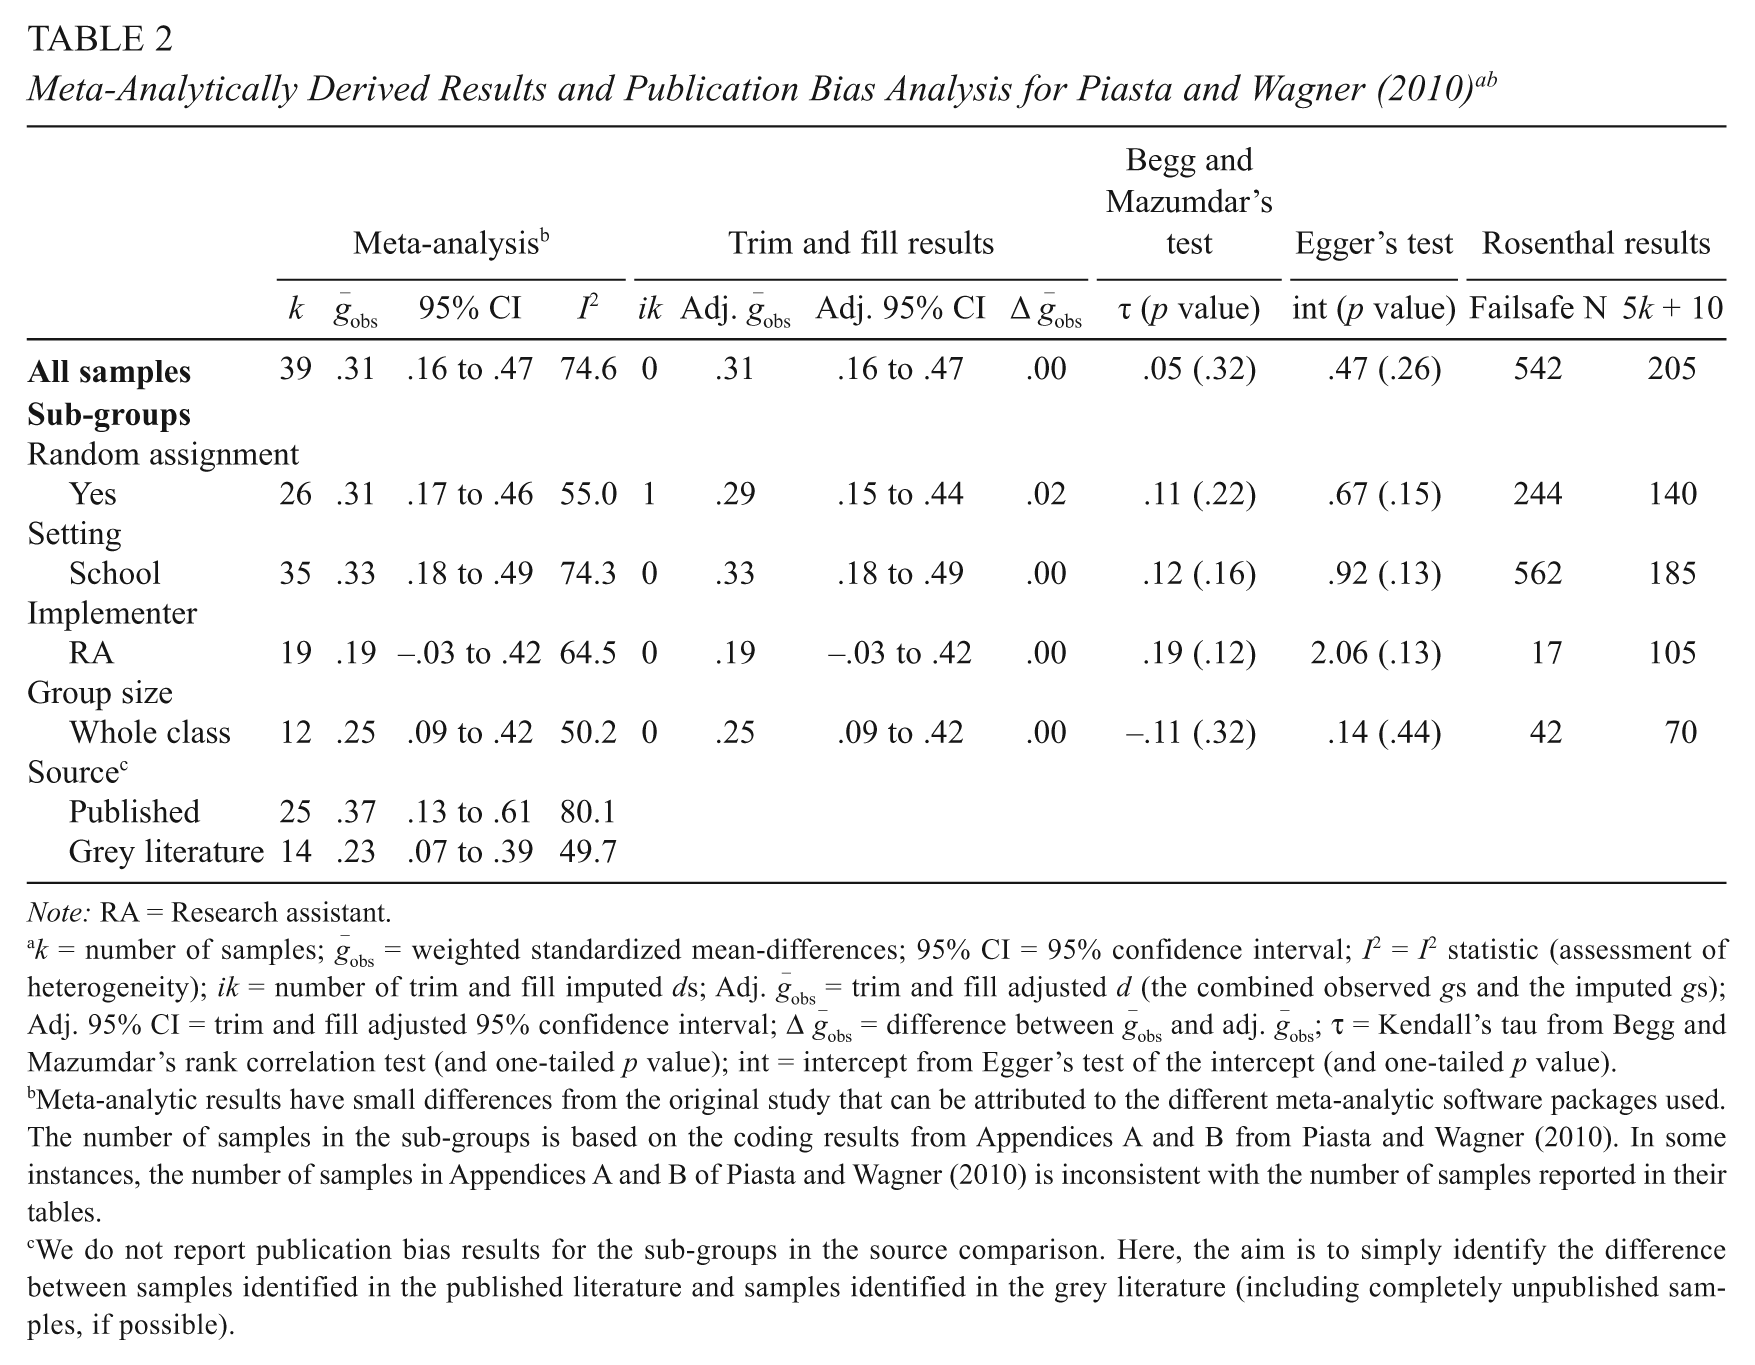
Note: RA = Research assistant.
k = number of samples;
Meta-analytic results have small differences from the original study that can be attributed to the different meta-analytic software packages used. The number of samples in the sub-groups is based on the coding results from Appendices A and B from Piasta and Wagner (2010). In some instances, the number of samples in Appendices A and B of Piasta and Wagner (2010) is inconsistent with the number of samples reported in their tables.
We do not report publication bias results for the sub-groups in the source comparison. Here, the aim is to simply identify the difference between samples identified in the published literature and samples identified in the grey literature (including completely unpublished samples, if possible).
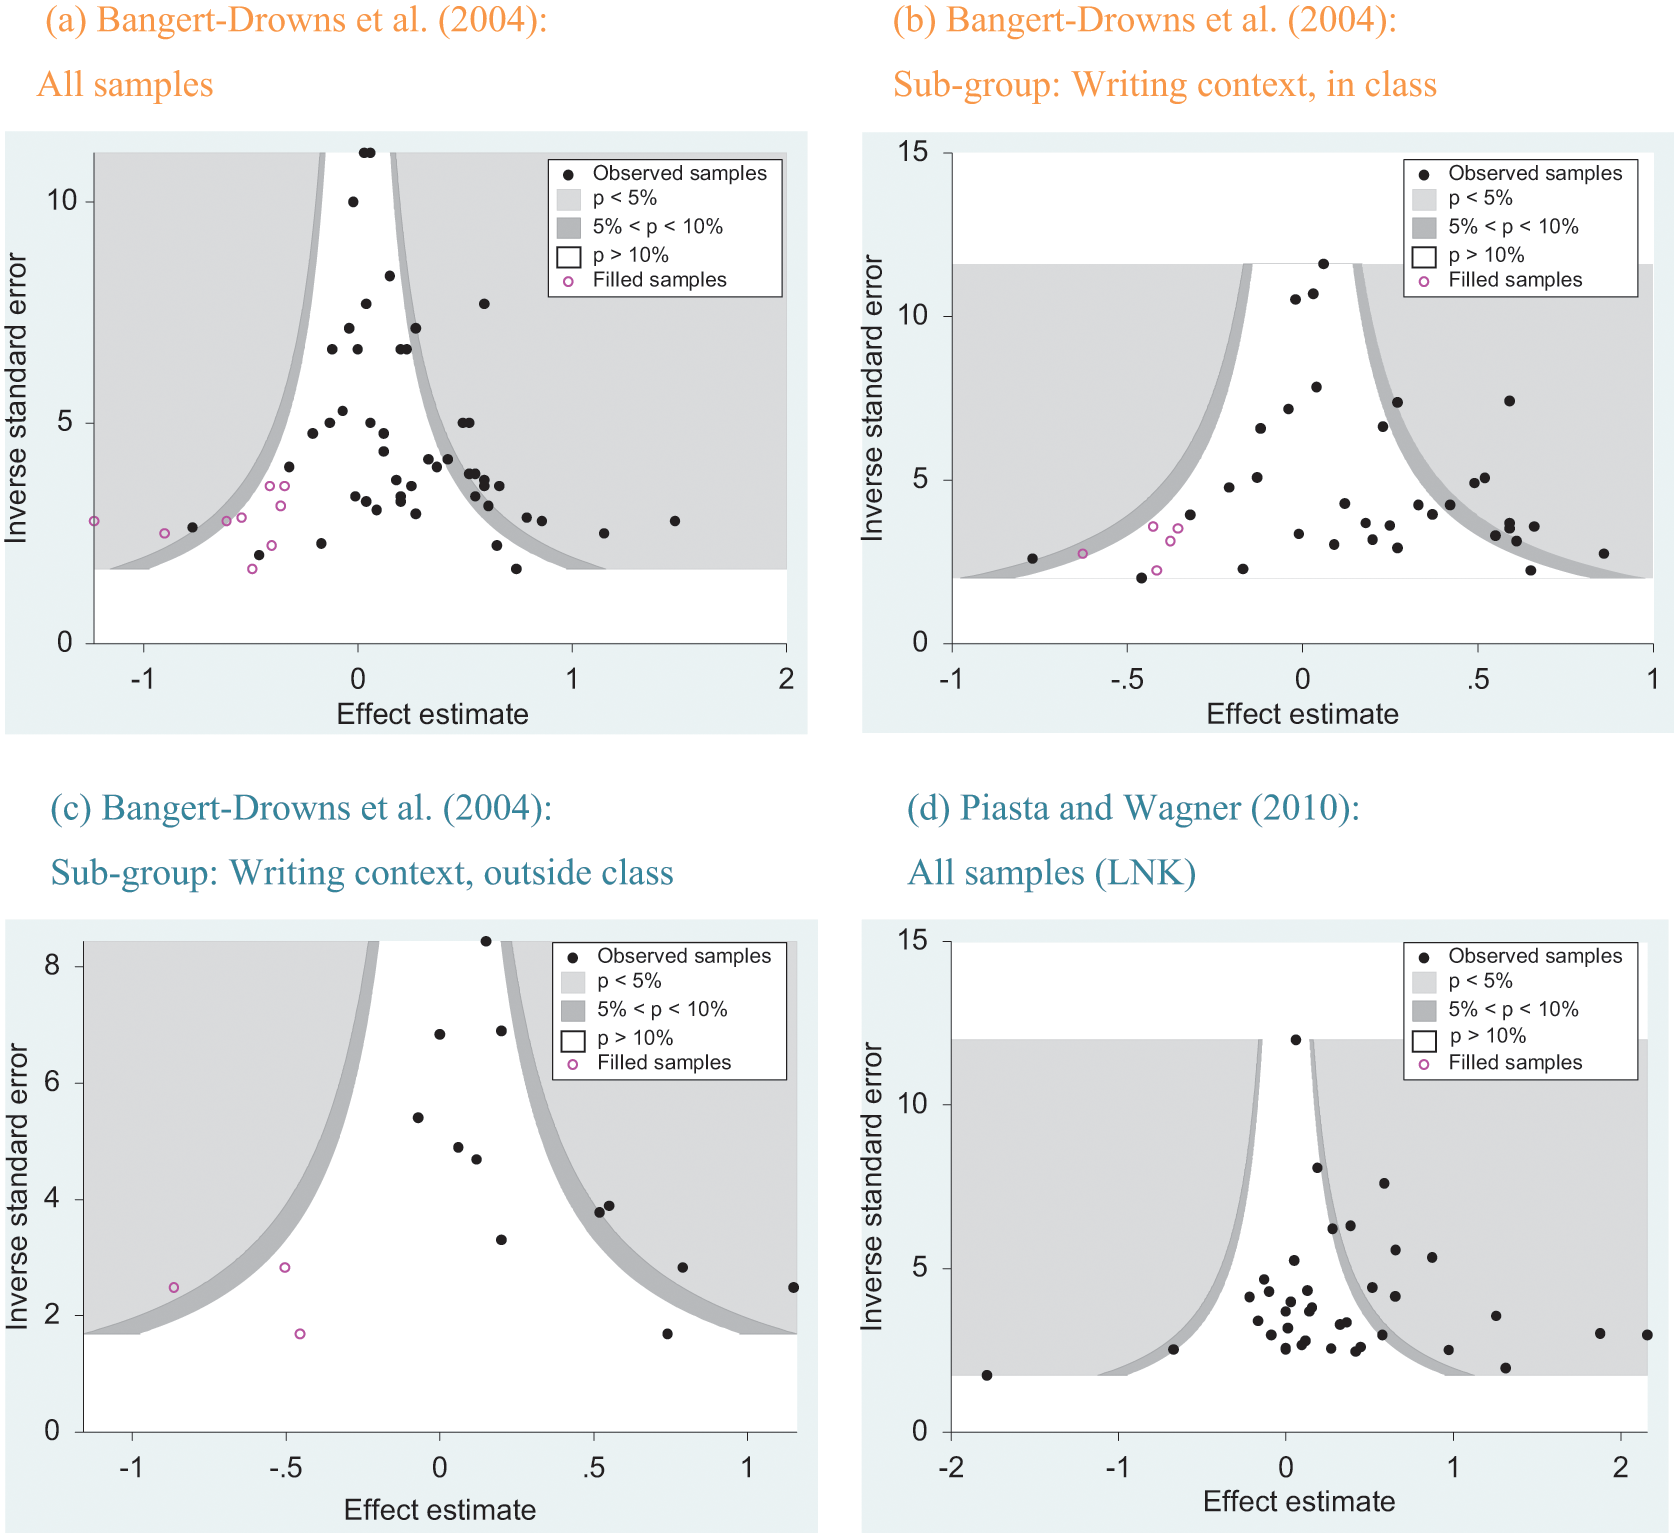
Figure 1 displays the contour-enhanced funnel plots for each data set along with the trim and fill imputed samples. The dark circles indicate the observed samples (i.e., standardized mean-differences), and the clear circles represent the imputed ones. The contour lines of the funnel plot demonstrate whether the results of a sample would be statistically significant at the p < .10 or p < .05 levels.
Bangert-Drowns et al. (2004)
Table 1 contains the results for the Bangert-Drowns et al. (2004) data set. The meta-analytic estimate for the standardized mean-difference is .21, with a confidence interval of .13 to .30. The results of the trim and fill analysis suggest that nine additional samples would be required to make the distribution of samples symmetrical (see Figure 1, panel [a]). Furthermore, the contour-enhanced funnel plot illustrates that the vast majority of imputed samples are in the area of statistical insignificance [see Figure 1, panel (a)], indicating that the small sample bias is unlikely to have caused the observed asymmetry (Peters et al., 2008; Sterne et al., 2011). The adjusted
This data set met the previously stated criteria for the correlation and regression-based publication bias methods. Both Begg and Mazumdar’s test (τ = .22, p < .01) and Egger’s test (1.26, p < .001) provide results consistent with an inference of publication bias, supporting the results from the trim and fill analysis. By contrast, the failsafe N of 547 exceeds the 250 sample cutoff, suggesting that the result is robust to publication bias. Thus, the conclusion of the failsafe N is inconsistent with the results and conclusions from the other publication bias methods.
The results of the cumulative meta-analyses are displayed in Figure 2. The cumulative meta-analysis by precision (see Figure 2, panel [a]) demonstrates a strong positive drift. The estimate of .05 after the four most precise samples (cumulative N [N cum ] = 1,739; 31% of N) increases to .13 once half of the sample sizes summed across samples (N cum = 2,861) are included. Ultimately, the effect size drifts in a positive direction to .21 at 100% of N (N cum = 5,576). The overall drift from .05 (31% of N, 10% of k) to .13 (51% of N, 19% of k) and .21 (100% of N, 100% of k) seems quite dramatic. The cumulative meta-analysis by publication date provides no support for the conclusion that the traditional time-lag bias was a cause of publication bias (see Figure 2, panel [b]). If anything, it suggests that more recent studies reported larger standardized-mean differences than earlier ones. Taken together, our results indicate that the literature reviewed is likely to have been influenced by publication bias resulting in an overestimation of the effect size.

Cumulative meta-analyses for Bangert-Drowns et al. (2004)
Bangert-Drowns et al. sub-groups
The I2 statistic of 51.9 in this data set indicates that there is some degree of heterogeneity. As previously described, the trim and fill and other funnel plot-based methods (e.g., Egger’s test of the intercept and Begg and Mazumdar’s rank correlation test) are based on the assumption that the only cause for variance in the distribution of samples is random sampling error. In the event that there are moderators, their results could be inaccurate. We thus perform sub-group analyses in an attempt to examine the potential presence of publication bias in more homogeneous sub-groups. 4 Four sub-group comparisons from Bangert-Drowns et al. (2004) were completed for illustrative purposes (see Table 1). These sub-groups met our criteria of at least 10 samples and an I2 statistic of less than 75%. We thus demonstrate the use of funnel plot-based publication bias methods on three types of moderator-based sub-groups that were identified in the original meta-analytic review. From Table 1, it can be seen that there remains evidence of at least a moderate degree of publication bias in the sub-groups. Figure 1, panels (b) and (c), displays the contour-enhanced funnel plots for the writing context sub-groups (the other contour-enhanced funnel plots are available from the first author). As with the entire sample, the majority of the imputed samples are in the area of statistical insignificance, supporting that our results are unlikely to be due to the small bias or other causes of true heterogeneity. Our publication bias analyses indicate that the data set is likely to have been affected by publication bias such that the original effect size estimates by Bangert-Drowns et al. are likely to be overestimates of the true observed effect.
We also conducted a comparison of published versus grey literature. Here, the results show that samples from published studies tend to report slightly larger standardized mean-differences (.24 vs. .21). Thus, the difference in effect sizes between published and grey literature appears to be small (.03). Yet, as previously described, simply conducting a sub-group analysis of published versus grey and unpublished literature provides limited information and should be used only as a complementary technique to other methods.
Piasta and Wagner (2010)
Table 2 displays the results for the letter name knowledge data set from Piasta and Wagner (2010). The standardized mean-difference is .31, with a confidence interval spanning from .16 to .47. The trim and fill analysis results in a zero-difference between the observed and adjusted
Piasta and Wagner sub-groups
The I2 statistic of 74.6 in this data set indicated that our results could have been affected by heterogeneity. To reduce the amount of heterogeneity, we formed sub-groups and conducted publication bias analyses within them. Four sub-groups that met our criteria (i.e., k ≥ 10, I2 ≤ 75%) were chosen for illustrative purposes. Overall, the results in Table 1 indicate that publication bias is unlikely to have influenced the meta-analytic results of this data set. The failsafe N indicates in two instances that bias may be present. Finally, we conducted a source comparison (i.e., published vs. the grey literature). Published studies did report noticeably larger standardized mean-differences (.36 vs. .24). In this instance, effect sizes from samples in the published literature are substantially larger than effect sizes from other sources.
Discussion
This article was designed to overview the issue of publication bias and to demonstrate methods for the assessment of this bias. In an application of these methods, we analyzed two data sets. We found that some previously published findings may have been affected by publication bias, thus decreasing our confidence in the results. However, we also found that published meta-analytic results may be free from the influence of publication bias, therefore increasing our confidence in the findings. In this section, we review the implications of the results. In general, results of our analyses reflect the need to fully explore meta-analytic research before spending precious economic resources as well as teacher and student time to pursue literacy interventions that may or may not positively influence student academic achievement. We also briefly discuss our recommendations for researchers, policymakers, and practitioners.
Bangert-Drowns et al. (2004)
Bangert-Drowns et al.’s (2004) meta-analytic review investigated the effectiveness of writing on conventional measures of academic achievement. Our analyses suggest that their overall results were noticeably affected by publication bias, such that the previous small, positive effect size estimate (observed estimate of .21) was overestimated by .07 (trim and fill adjusted estimate of .14), rendering the for publication bias adjusted standardized mean-difference potentially practically irrelevant (Cohen, 1988). If so, the degree of publication bias could be classified as severe; if not, the degree of publication can be classified as moderate (McDaniel et al., 2006; Rothstein et al., 2005b). Our analyses also indicate that the influence of publication bias within sub-groups is not negligible. For instance, the effectiveness of writing interventions at the college, high school, and elementary school levels may have been overestimated by 52%, 59%, and 72%, respectively, indicating a moderate to severe degree of bias. The results of the advanced publication bias assessment methods were largely in agreement regarding the conclusion of bias. Not surprisingly, results of the inadequate failsafe N were often inconsistent with the results of the other methods. Also, our study extends Bangert-Drowns et al.’s (2004) source comparison, which has very limited value for the assessment of publication bias (Hopewell et al., 2005).
The observed reduction of the estimated effect sizes from the trim and fill and related analyses (e.g., cumulative meta-analysis by precision) should decrease our confidence in the previously reported results. This should have scientific and practical implications for writing-to-learn programs. We encourage future research that continues to explore contingency variables that influence the effectiveness of writing programs.
Piasta and Wagner (2010)
The meta-analytic review by Piasta and Wagner (2010) explored various early literacy interventions aimed at promoting alphabet knowledge. We focused on interventions expected to improve letter name knowledge. The publication bias methods were largely in agreement (except for the problematic failsafe N in two instances), suggesting that the data set was not noticeably influenced by publication bias (i.e., we observed minimal to no bias). Thus, policymakers and practitioners should have increased confidence in the conclusions drawn from this data set. Our findings are thus consistent with the conclusions drawn by Piasta and Wagner (2010) regarding publication bias. However, our study extends Piasta and Wagner’s previously used methods (e.g., source comparison and failsafe N), which are very limited in their value (Becker, 2005; Hopewell et al., 2005).
Limitations
The publication bias methods demonstrated in this article are only as accurate as the assumptions underlying their use. Many of the publication bias detection and assessment methods evaluate the degree of asymmetry in the funnel plot (e.g., funnel plot, trim and fill, Egger’s test of the intercept, and Begg and Mazumdar’s rank correlation test). True heterogeneity due to moderators or the small sample bias can also cause funnel plot asymmetry and may lead to erroneous results in publication bias analyses. To address these concerns, we assessed the degree of heterogeneity. We also used previously identified moderators to form more homogeneous sub-groups. We then conducted publication bias analyses within them. Our results within sub-groups were very similar to the results of the overall samples. However, unidentified moderating variables could have caused some of the observed funnel plot asymmetry. To alleviate some of these concerns, cumulative meta-analysis, which is theoretically unaffected by moderator induced heterogeneity, provided confirmatory results. Finally, we also used contour-enhanced funnel plots to assess the possibility that the observed asymmetry was due to reasons other than publication bias, such as true differences between large and small samples (i.e., the small sample bias). Our results indicated that causes of funnel plot asymmetry other than publication bias are unlikely (Peters et al., 2008; Sterne et al., 2011).
Egger’s test of the intercept and Begg and Mazumdar’s rank correlation test have limited power; their potential insignificant results do not suggest that publication bias is absent (Borenstein et al., 2005, 2009). To mitigate these concerns, we formed sub-group distributions of at least 10 samples, which is the recommended minimum (Sterne et al., 2011). Also, most of our analyzed distributions are substantially larger than 10, and methods that are less affected by the number of samples included in a given distribution provided similar results.
Recommendations
In general, we suggest that publication bias analyses, as part of an overall sensitivity analysis (Borenstein et al., 2009), become a requirement for all meta-analytic reviews (Banks et al., 2012). Due to the influence of these reviews on policymaking, practice, and the accumulation of scientific knowledge, their results must be as accurate as possible. Our general recommendations for the evaluation of publication bias are presented in Table 3. Of the methods reviewed in this article, we recommend the use and reporting of (1) contour-enhanced funnel plots (Palmer et al., 2008; Peters et al., 2008); (2) the trim and fill analysis (Duval, 2005); (3) the cumulative meta-analysis by precision (Borenstein et al., 2009; McDaniel, 2009); (4) Begg and Mazumdar’s rank correlation (Begg & Mazumdar, 1994); and (5) Egger’s test of the intercept (Egger et al., 1997). Researchers may also conduct source comparisons between the published literature and grey literature (and, if possible, completely unpublished samples) and use cumulative meta-analyses by publication date to evaluate the potential for the time-lag bias. We join previous researchers in calling for the discontinuation of the use of the failsafe N to assess publication bias (Becker, 2005; McDaniel et al., 2006). Although all of the newly developed publication bias assessment methods were generally in agreement in their results, results of the failsafe N were often inconsistent with the results from other publication bias methods.
Recommendations

Table 3 also provides specific recommendations for the reporting of publication bias analyses. Primarily, researchers should report the extent to which publication bias was minimal, moderate, or severe (or inconclusive if multiple advanced methods are in disagreement), and provide an interpretation of the extent to which publication bias has influenced the meta-analytic findings and the resulting implications for policymakers and practitioners (e.g., teachers). Meta-analytic researchers should also continue to explore the relative merits of the publication bias methods and conduct research to evaluate the degree to which publication bias has influenced past meta-analytic results (and is affecting future meta-analytic results).
Recommendations for the prevention of publication bias, founded on the idea of increasing the number of available samples for meta-analytic reviews (Sutton, 2009), are included in Table 3 as well. For instance, one suggestion to increase the pool of samples on which to base meta-analytic reviews is to use research registries—a sort of “bank” in which studies are submitted (Berlin & Ghersi, 2005). Some initial steps have already been taken in the creation of two registries (e.g., the Registry of Evaluation Researchers and the Registry of Randomized Controlled Trials) by the What Works Clearinghouse, founded in 2002 by the U.S. Department of Education. The improvement and promotion of these registries could provide researchers and practitioners (e.g., teachers) with outlets to disseminate results. Many teacher preparation institutions include action research course requirements for pre-service teachers. An organized system that taps this invaluable data resource could increase the volume of studies available for meta-analyses while reducing the threat from publication bias. Other recommendations for the prevention of publication bias include more thorough systematic searches to obtain more relevant samples (see Rothstein, in press), providing supplemental results online on journal websites (see Evangelou et al., 2005), and conducting prospective meta-analytic reviews (see Berlin & Ghersi, 2005).
Conclusion
Publication bias presents a serious threat for the advancement of education research. Multiple methods have been developed for identifying and evaluating the influence of publication bias (Rothstein et al., 2005b). The American Psychological Association (2010) has recommended that all meta-analytic and systematic reviews address the issue of publication bias. We go one step further and suggest that it should not be a recommendation but a requirement. As results from meta-analytic reviews are used to make policy decisions, the future of education depends on the extent to which these reviews are free from biases, such as publication bias. We hope that this article serves to advance that effort.
Footnotes
Notes
Authors
GEORGE C. BANKS is a doctoral candidate at Virginia Commonwealth University, 301 W. Main Street, Box 844000, Richmond, VA 23284-4000;
SVEN KEPES is an Assistant Professor of Management at Virginia Commonwealth University. He received his PhD from the University of Arkansas. His research interests include staffing, compensation, and research methods, particularly meta-analysis and publication bias.
KAREN P. BANKS is an adjunct faculty member at George Mason University and a high school reading specialist in Loudoun County Public Schools. She has presented results of work with struggling adolescent readers for the Greater Washington Reading Council and the International Reading Association. She has served as a literacy consultant in a variety of educational programs, including Head Start, community and parent literacy services, elementary, middle and high school settings. Karen is the author of a parenting book, and contributing author of books related to teacher education and community development.