



Abstract
Colleges and universities are being pressed to seek innovative ways to measure student learning outcomes and identify the conditions that lead to their development. Understanding how students group according to a multidimensional set of learning outcomes provides information on the extent to which institutions are meeting goals. This study develops a typology based on engineering undergraduates’ array of outcomes. The study also demonstrates variation in personal and educational experiences across outcomes-based student groupings, thus providing insight into “what works” for programs who seek to graduate students who have developed an array of engineering-related outcomes. This outcomes-based approach is readily applicable to any set of student learning outcomes that programs or institutions seek to cultivate.
Introduction
Colleges and universities constantly face requests to demonstrate the added value that students experience following participation in a postsecondary education program. Students, parents, governing boards, funding agencies, and businesses seek measurable evidence of success and the value of their investments (e.g., Shavelson, 2010). The accountability movement and culture of assessment has influenced higher education to consider how to measure effectiveness (e.g., Kuh & Ikenberry, 2009; Lattuca & Stark, 2009; Shavelson, 2010). Adding to the sense of urgency to defend investments in education, empirical longitudinal studies in recent years have called into question the level of learning that actually occurs in undergraduate programs (e.g., Arum & Roksa, 2011). Thus, colleges and universities are being pressed to seek innovative ways to measure student learning outcomes and identify the conditions that lead to their development.
A common approach for investigating college student outcomes is to consider how students engage in their educational environments (e.g., Hu & McCormick, 2012). Decades of research support this assumption that students’ increased efforts and involvement within their educational environments promote a variety of learning outcomes (e.g., Pascarella & Terenzini, 1991, 2005). Many studies categorize students into typologies based on their characteristics and/or how they engage within their educational environments (e.g., Ammon, Bowman, & Mourad, 2008; Bahr, 2010; Boughan, 2000; Hagedorn & Prather, 2005; Kuh, Hu, & Vesper, 2000; VanDerLinden, 2002). For example, Kuh et al. (2000) developed a typology of students using the College Student Experiences Questionnaire and showed that gains made toward outcomes varied across 10 unique groupings of students based on their engagement in various activities. A recent study by Hu and McCormick (2012) followed a similar approach using data from the National Survey of Student Engagement and identified significant relationships between student types and direct-assessment learning outcomes, self-reported gains, grade point average, and persistence. These researchers concluded that typological approaches are useful for revealing subcultures within student populations to design institutional improvements.
Although most research focuses on whether and how college students develop a particular outcome (e.g., critical thinking or openness to diversity or quantitative literacy), institutions are interested in understanding how students develop comprehensively, building a variety of learning outcomes. For example, the Association of American Colleges and Universities (AAC&U; 2012) has compiled a set of essential learning outcomes that all students should develop, titled Liberal Education and America’s Promise (LEAP), which include knowledge of human cultures, the physical and natural world, intellectual and practical skills, personal and social responsibility, and integrative and applied learning. Regional accreditation agencies require colleges and universities to identify multiple student learning outcomes, so a technique for considering a combination of outcomes would have important implications for practice. Similarly, professional fields, such as nursing (American Association of Colleges of Nursing, 2009), medicine (Liaison Committee on Medical Education, 2011), and business (Association to Advance Collegiate Schools of Business, 2011), have also moved toward identifying and measuring a set of student learning outcomes for accreditation purposes. Understanding how students group according to a set of learning outcomes would provide insight into the extent to which an institution or program is meeting its goal. This approach shifts the research question of previous typological approaches from how do outcomes vary across students with different experiences to why may students with different sets of outcomes end up the way they do.
Context of the Present Study
The culture of assessment in higher education has been especially prominent in recent calls for expanded federal investment in STEM fields (e.g., National Academy of Sciences, 2007; U.S. Government Accountability Office, 2006). The federal government and industry have also renewed calls to improve engineering education so that the United States remains a world leader in innovation (e.g., White House, 2011), and reports have urged educators to focus on graduating engineers who will be successful in a competitive workforce of the future (National Academy of Sciences, 2007; U.S. Government Accountability Office, 2006). This study responds to the needs of engineering, which has been mandated to assess outcomes as a condition of accreditation (Accreditation Board for Engineering and Technology [ABET], 2011). Considering this set of challenges, undergraduate engineering programs are a well-defined microcosm of higher education.
The National Academy of Engineering (NAE; 2004) outlined a strategy that emphasizes a set of outcomes that will prepare engineering graduates for work in a dynamic, interdisciplinary, and global workplace. These abilities are similar to those outlined in accreditation criteria (e.g., fundamental skills, design skills, professional skills), but the “engineers of 2020” (“E2020”) must also develop interdisciplinary skills that extend beyond engineering, as well as contextual competence. Research investigating these outcomes also appears within the broader higher education and student development literatures. For example, Barber (2012) investigated the integration of learning as an educational outcome, or the ability to connect information from separate contexts and to apply those ideas in new contexts, and showed how students can develop this outcome in multiple in-class and out-of-class settings. Similarly, Boix Mansilla and Duraising (2007) focused on students’ interdisciplinarity as an outcome and developed a rubric to assess students’ work demonstrating this competency.
The current challenge for undergraduate engineering programs, like that faced by other fields, is to identify the organizational conditions, student experiences, and policies that support the development of this array of outcomes and thus promote high levels of proficiency that can be demonstrated by well-rounded graduates. Only a few engineering education studies (e.g., Lattuca, Terenzini, & Volkwein, 2006; Sheppard et al., 2010) have taken the comprehensive approach of studying the influence of in-class and out-of-class experiences on a range of outcomes. Each of those analyses related student characteristics and experiences to specific learning outcomes in isolation rather than considering how engineering students develop comprehensively.
In a notable exception, Besterfield-Sacre, Shuman, and Wolfe (2002) created a model that linked student experiences to multiple accreditation outcomes within a single engineering program. The researchers proposed an index of outcomes that could measure the overall quality of an engineering education. To calculate the index, outcomes were weighted differently based on their relative importance according to a focus group of working engineers; this general approach represents an effort to consider a set of learning outcomes simultaneously. The authors explained that some students may excel in certain areas, such as communication, but may be weaker in other areas, such as basic science and math knowledge (Besterfield-Sacre et al., 2002). These relative differences, however, are not apparent in a single index.
This study develops a typology of seniors based on their multidimensional skill sets. It identifies the personal and educational experiences during college that characterize a “model” group of students—those who are well-rounded on all outcomes—and compares their characteristics and experiences with other groups in the typology. This analysis provides insight into “what works” for programs who seek to graduate students who have developed an array of outcomes and considers a comprehensive set of E2020 learning outcomes without masking levels of competency on each outcome. This new approach responds to the needs of academic programs, which seek to cultivate an array of abilities in their graduates rather than just one. Specifically, the study addresses the following:
When seniors are categorized based on the extent to which they report achieving skills on a variety of learning outcomes, what groupings emerge?
How do students’ undergraduate precollege characteristics and undergraduate educa-tional experiences vary across outcomes-based groupings?
Organizing Conceptual Framework
In reviews of several decades of research on students, Pascarella and Terenzini (1991, 2005) demonstrated that a student’s content acquisition and higher order thinking skills, among many other outcomes, are enhanced by experiences during their college years. The “college impacts” framework by Terenzini and Reason (2005, 2010) brings coherence to over 50 years of higher education research and conceptually combines factors forming the “Undergraduate Experience” in an effort to explain student learning outcomes and persistence. Several research studies in higher education (e.g., Reason, Cox, Lutovsky-Quaye, & Terenzini, 2010; Reason, Terenzini, & Domingo, 2006, 2007), including ones grounded within engineering (e.g., Lattuca et al., 2006), empirically support the framework.
This study used a revised version of the framework, which was modified in light of empirical findings from two engineering-focused studies (see Figure 1). In general, Terenzini and Reason’s model hypothesizes that precollege characteristics shape students’ engagement with various aspects of their institutions and also, to a lesser extent, are related to outcomes. A variety of curricular (e.g., general education coursework, major coursework), classroom, and out-of-class experiences are ways in which students engage during college. These experiences occur within an institutional and program context, which include internal organizational characteristics, structures, practices, policies, and faculty cultures and environments. The revised model specifies the learning outcomes of interest (drawn from the NAE report). Following the logic of Astin’s (1991) input–environment–outcome model that has guided many studies of student outcomes, this article focuses on the “precollege characteristics and experiences,” “student experiences,” and “E2020 outcomes” portions of the framework. Future research will operationalize the institutional and program context components.
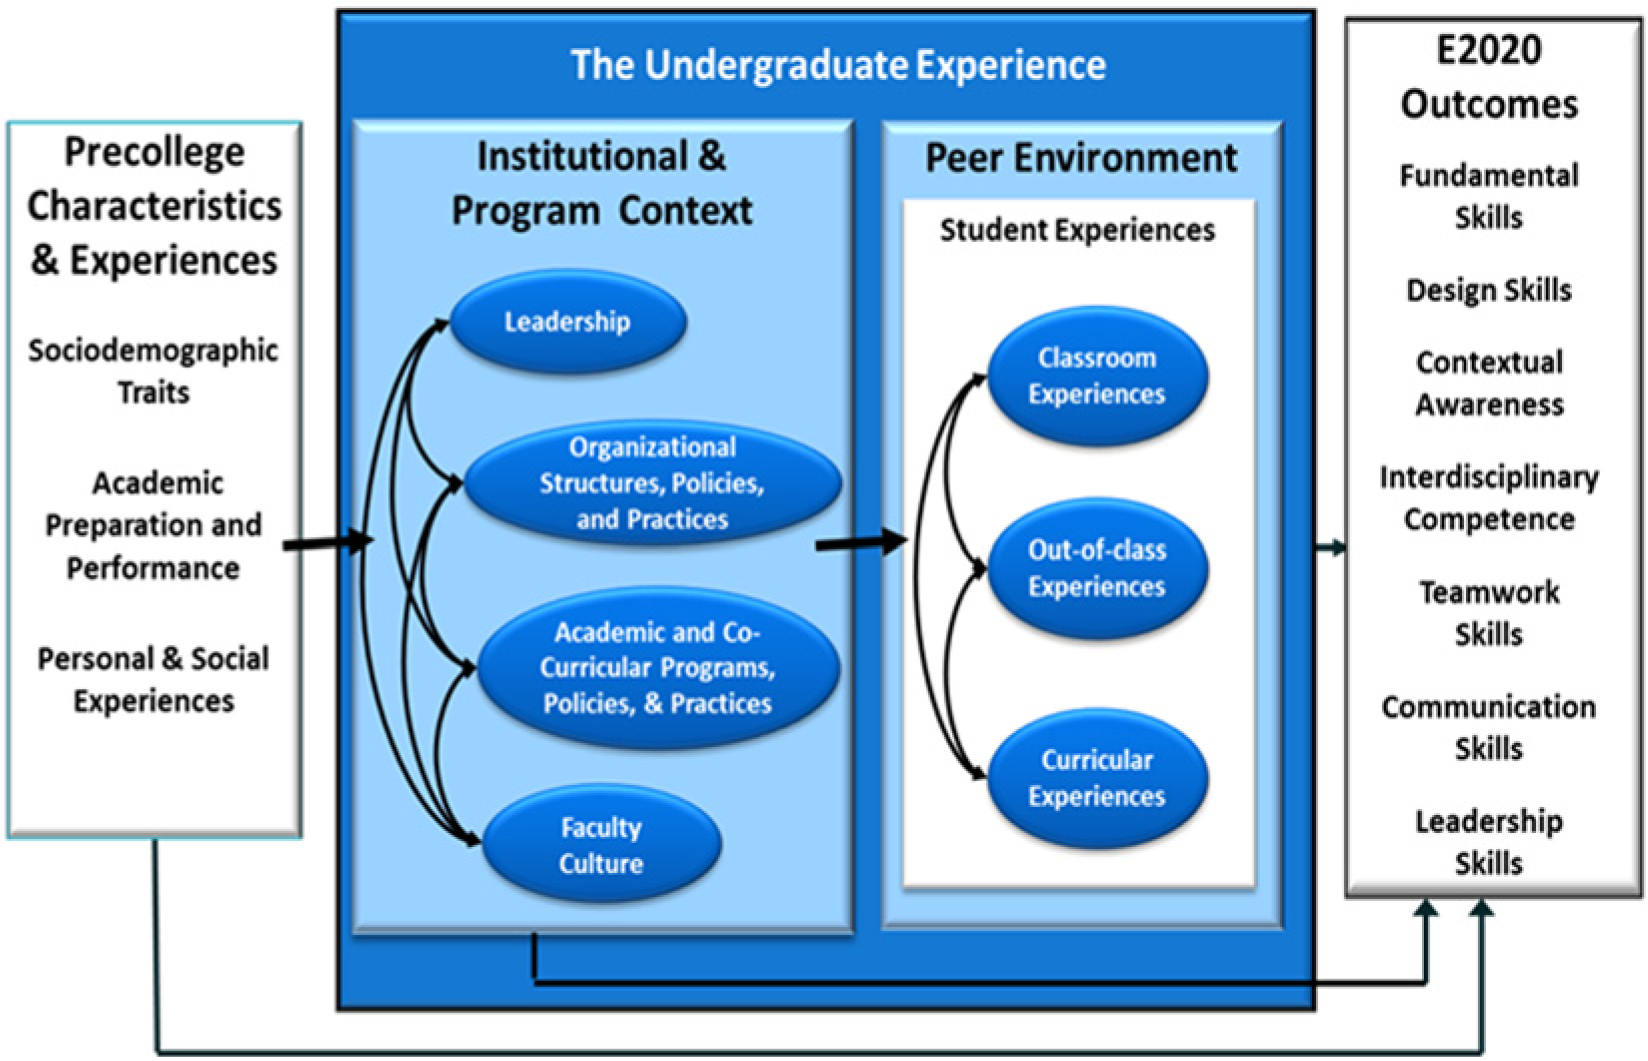
Organizing conceptual framework (revised from Terenzini & Reason, 2005, 2010).
Data and Method
Instrument Development
Drawing on data from the Prototype to Production: Processes and Conditions for Preparing the Engineer of 2020 (EEC-0550608) project sponsored by the National Science Foundation, this study utilizes student survey data from a nationally representative sample of engineering programs in the United States. Students provided information on their precollege academic preparation and sociodemographic characteristics, curricular and co-curricular experiences, and self-ratings of their engineering-related competencies. A team of education and engineering researchers collaborated on instrument development, beginning with an extensive literature review on key topics related to the E2020 learning outcomes both within undergraduate engineering education and from fields outside of engineering. In addition to providing conceptual guidance for survey development, findings from this literature review generated a bank of potential survey items related to interdisciplinary competence and contextual competence, as well as previously studied skills (e.g., teamwork skills). In cases where available scales had acceptable psychometric properties, items were adopted or minimally revised.
The team also conducted interviews and focus groups with engineering administrators, faculty members, students, and alumni at the following five campuses to develop new survey items and ensure appropriate coverage of key topics: Penn State–University Park, Penn State–Altoona, City College of New York, Borough of Manhattan Community College, and Hostos Community College. Drafts of potential survey items were reviewed by engineering faculty and administrators to evaluate and refine the survey, and the instrument was pilot tested with students at Penn State–University Park and Penn State–Altoona (n = 482) for newly developed items. The research team used factor analysis techniques to explore pilot results and further revised survey items based on these findings. The team again met with focus groups of engineering faculty members and administrators from Penn State–University Park to review the revised student survey and assess its construct validity (i.e., whether the items represent their intended purpose; Shadish, Cook, & Campbell, 2002) before administering the final version.
Data Collection and Preparation
Institutional sampling relied on the American Society for Engineering Education’s database, using institution- and program-level information for the 2007–2008 academic year. The sample has the following strata: six engineering disciplines (biomedical/bioengineering, chemical, civil, electrical, industrial, and mechanical), three levels of highest degree offered (bachelor’s, master’s, and doctorate), and two levels of institutional control (public and private). Five institutions that were participants in a companion qualitative study “preseeded” the sample. Because one of those offers only a general engineering degree, three institutions offering general engineering degrees were included as comparisons. These seven disciplines (i.e., six from the sampling frame plus general engineering) accounted for 70% of all baccalaureate engineering degrees awarded in 2008. The University Survey Research Center selected 23 additional institutions at random from the population within the sampling framework, bringing the total number of 4-year institutions in the sample to 31 (see Table 1).
Institutional Sample

Institution participating in the companion qualitative study.
Historically Black college or university.
Hispanic-serving institution.
The Survey Research Center was also responsible for data collection through a Web-based questionnaire; sample institutions provided contact lists for their sophomore, junior, and senior students enrolled in the seven investigated disciplines. Of the 32,737 surveys sent to these students, 5,249 were returned for a response rate of 16%. Because the study seeks to understand the preparation of students at the point at which they would be ready to enter the workforce, analyses include only students in their 4th or 5th years (n = 2,422; the senior response rate was also 16%). Although a higher rate was desired, response rates have been declining (Baruch, 1999; Porter & Umbach, 2001), perhaps because of increased use of surveys through Web-based forms (Porter & Umbach, 2006; Van Horn, Green, & Martinussen, 2009). The low response rate raises potential concerns for external validity, especially if the sample was not representative of the population of engineering undergraduates.
The research team addressed this issue in several ways. First, to minimize the number of cases lost and avoid several forms of bias that other procedures introduce (e.g., Cox, McIntosh, Reason, & Terenzini, 2010), missing data were imputed in accordance with social science research norms using the expectation-maximization (EM) algorithm of the Statistical Package for the Social Sciences (SPSS) software (Version 18), following procedures supported by Dempster, Laird, and Rubin (1977) and Graham (2009). Second, a series of chi-square goodness-of-fit tests determined the representativeness of the sample by gender, discipline, and race/ethnicity for the populations that received the survey at each institution. More extensive analyses could not be conducted to determine representativeness because institutions provided only data related to these variables for their enrollments. Statistical tests showed some response bias within institutions for these demographic variables. Across all institutions, females were overrepresented (28% of the sample compared with 19% of the population), African Americans and Hispanic/Latino Americans were underrepresented (9% compared with 18% of the population), Asian Americans were underrepresented (8% compared with 14%), and Caucasians were overrepresented (66% compared with 55%). Students in the “Other” category—dominated by students’ self-labeling as “multiracial”—were overrepresented (13% compared with 6%); each institution may label their students’ race/ethnicity differently, and discrepancies in “Other” may explain some differences between the sample and population for race/ethnicity. Discrepancies between the sample and population for each engineering discipline were within 3%.
To account for this bias in an effort to enhance external validity, weights were developed and applied (e.g., Kalton, 1983) so that the proportional representation of students by gender, race/ethnicity, and discipline within each institution was equal to the population of students at each institution (e.g., a different gender weight was applied for each institution). Response rates across institutions also varied, and another set of weights were applied so that the number of respondents from each institution was proportional in the overall sample to that of the institution’s total enrollment in the 31-institution sample. This adjustment had the effect of treating an institution’s respondents as if students from all institutions responded at the same rate. An overall weight was calculated by multiplying the gender weight by the race/ethnicity weight by the discipline weight by the race/ethnicity weight. That weight, reflecting all adjustments, was applied to all survey responses to account for differences between the distributions of respondents and the population to enhance external validity.
To understand the underlying dimensions of similar items, the team used principal axis analysis (oblimin with Kaiser normalization rotation). This statistical procedure determined the degree of correlation between items, and items highly correlated were combined to form scales. Items were assigned to scales based on the magnitude of loading from the principal axis analysis, the effect of keeping or discarding the item on the scale’s internal consistency reliability, and professional judgment. Scales were computed by summing respondents’ scores on component items and dividing it by the number of items in the scale, as recommended by Armor (1974).
Variables
E2020 outcomes
The survey consisted of 51 items that asked respondents to rate their abilities in engineering-related knowledge and skills (i.e., outcomes). Following data reduction techniques, nine separate outcomes scales emerged, which comprise the student outcome variables for this analysis (see Table 2). For all but three scales, students responded to statements related to their abilities on different tasks. For interdisciplinary skills, recognizing disciplinary perspectives, and reflective behavior practice scales, students were asked about their levels of agreement with statements related to each these outcomes.
Outcomes and Undergraduate Student Experience Variables

Note. E2020 = engineers of 2020.
1 = weak/none; 2 = fair; 3 = good; 4 = very good; 5 = excellent.
1 = strongly disagree; 2 = disagree; 3 = neither agree nor disagree; 4 = agree; 5 = strongly agree.
1 = little/no emphasis; 2 = slight; 3 = moderate; 4 = strong; 5 = very strong.
1 = never; 2 = rarely; 3 = sometimes; 4 = often; 5 = very often.
Number of months.
1 = not active; 2 = slightly active (attend occasionally); 3 = moderately active (attend regularly); 4 = highly active (participate in most activities); 5 = extremely active (hold a leadership post).
Number of weeks.
Number of interactions in the past 6 months.
Precollege characteristics
Demographic characteristics include gender (male or female), race/ethnicity (Asian American, African American, Hispanic/Latino/a, White, Other), and parents’ level of education (highest parent’s education level, a proxy for socioeconomic status). Academic characteristics are operationalized by SAT scores (critical reading, writing, and math). This study explores each SAT section independently because prior research identifies unique relationships with engineering outcomes (e.g., Knight, 2011).
Student experiences
Student experiences include the following mixture of scales and individual items: (a) curricular emphases (four scales), (b) course taking in humanities and social sciences (two items), (c) instructional practices (two scales), (d) co-curricular experiences (10 items), and (e) faculty interaction (three items; see Table 2). Curriculum questions asked students to rate the extent to which topics were emphasized in courses. Students indicated the number of courses in which they enrolled in humanities and social sciences, and instructional practice questions asked students to indicate how often certain pedagogies were used in their courses. Participation in the co-curriculum items varied between a 5-point scale characterizing level of participation and open-ended questions asking students how many weeks or months they participated in different activities. Students also estimated the number of times in the past 6 months they interacted with faculty in different capacities.
Analytical Method
Typology development
Cluster analysis identifies homogeneous groupings in multidimensional space within a sample. Students were clustered into groups using the nine E2020 learning outcome scales, thus addressing the first research question. In accordance with Steinley (2007), this analysis used Ward’s (1963) hierarchical method in Stage 1 to identify the numbers of clusters to run and calculated the initial seeds for the k-means cluster analysis from these solutions. A Stage 2 k-means method produced the final clusters by iteratively assigning students to the grouping to which it was closest in Euclidean distance (Steinley, 2006). The k-means analysis was completed for each of the k numbers of clusters to be explored, as identified in the first stage, and the final solution was based on the number of cases falling in each cluster and the cluster solution’s ability to provide meaningful distinctions between groups of students. For example, a cluster solution containing one cluster with 2% of students would be a useless typology. Cluster stability was demonstrated with discriminant function analysis, whereby the nine self-reported outcome variables predicted cluster membership (Tabachnick & Fidell, 2001). Showing consistencies in groupings across multiple techniques adds confidence in the typology’s stability.
Radar plots illustrate the reported levels of proficiency and well-roundedness of students in each cluster (as an example, see Figure 2). Each concentric circle represents the grid scale for an outcome, where the center is 2.0 out of 5.0 (no average values were less than 2.0), and the outer ring is the maximum 5.0. The plot’s nine spokes represent the E2020 learning outcomes, and the perimeter of the shaded area on each spoke represents the cluster mean. Cluster names were chosen to characterize the shape of the shaded area relative to the shaded area of the “E2020” cluster (i.e., the cluster with highest average outcomes and well-roundedness).

Example radar plot of a cluster with conceptual groupings of outcomes scales for qualitative characterizations.
Although all nine E2020 outcomes were used to assign students into clusters, describing a cluster on nine different dimensions was complex. To simplify discussion, four dimensions are referred to throughout the text, each comprising conceptually similar scales (see Figure 2). The fundamental skills scale describes applying foundational knowledge to solving engineering problems and is described on its own. Leadership, teamwork, and communication skills are described as a “professional skills” dimension, following the norm set by engineering education researchers and practitioners (e.g., Shuman, Besterfield-Sacre, & McGourty, 2005). Design skills and contextual awareness are described as one dimension since these are closely related competencies (e.g., Adams, Turns, & Atman, 2003; Palmer, Terenzini, Harper, McKenna, & Merson, 2011). Recognizing disciplinary perspectives, interdisciplinary skills, and reflective behavior practice are grouped into an “interdisciplinary competence” dimension because items originally were developed to measure this construct. The four dimensions are used for description and have no effect on calculations.
Cluster comparisons for each variable set
Chi-square tests compare categorical data across clusters. Results indicate whether certain groups of students are more likely to fall within a given cluster. Comparisons across clusters for SAT scores used a Kruskal–Wallis test (“K-W test”—the nonparametric analogue of analysis of variance [ANOVA]). Average values for the E2020 cluster were compared with the average of each other cluster using Mann–Whitney post hoc analyses, applying a Bonferroni correction when determining significance levels to account for multiple comparison errors. Similar analyses were completed for each set of student experience variables; these analyses used control variables via the Quade (1967) procedure (nonparametric analogue of analysis of covariance [ANCOVA]) to test the relationship between experiences and outcomes clusters net of precollege characteristics.
Cluster comparisons across variable sets
Multinomial logistic regression with robust standard errors was used to examine how students’ characteristics and experiences varied across the clusters (an unordered categorical variable). The “E2020 cluster”—or the “model” cluster with students who reported high proficiencies and well-roundedness on outcomes—served as the reference group to illuminate differences in characteristics and experiences with other clusters of students. For each independent variable, odds ratios greater than 1 indicate an increase in the likelihood of a different cluster membership relative to the E2020 cluster, and odds ratios less than 1 indicate a decrease in likelihood. Inverse odds ratios for variables with negative odds ratios are reported so that easy comparisons can be made for the relative effects of different variables (DesJardins, 2001).
This study focuses on the influences of student-level variables on student-level outcomes clusters. Students are nested within institutions, however, and hierarchical models were considered to account for institutional differences (Raudenbush & Bryk, 2002). With so many independent variables in this analysis, a limited sample size precluded the use of such a model, as the addition of a set of Level 2 variables would overfit the multinomial logit model. Although a multilevel approach may have been an improvement in analytical design, ignoring institution-level variables has only a limited effect. An unconditional model was used to partition the variance in cluster membership between individual and institutional levels of analysis (Porter, 2005; Raudenbush & Bryk 2002). The average intraclass correlation across the outcomes clusters indicated that only 6% of the variance in cluster membership was attributable to institution-level differences; 94% was attributable to individual-level differences. Therefore, although the sample size limited the use of a multilevel approach for this study, institution-level effects that are not captured by the analytical framework were relatively negligible.
Limitations
The purpose of the larger study from which data are drawn was to understand the development of a set of learning outcomes deemed important by the National Academy of Engineering. To provide this national portrait, the research team compromised on precision of direct measurements in favor of a survey format to enhance generalizability (McGrath, Martin, & Kulka, 1982). Ideally, a set of direct measures would have been administered to students to provide maximum confidence in the validity of dependent variables (i.e., student outcomes), but that was not possible because (a) direct measures do not exist for most of the E2020 outcomes, and (b) administering direct measures across 120 programs in 31 institutions was not realistic for the project’s time frame or budget.
Validity of results, therefore, relies on the accuracy and consistency of students’ reports of their own abilities. Research suggests that self-reports provide a reasonable approach to studying learning in the absence of appropriate direct measures (Anaya, 1999; Kuh, 2004; Kuh et al., 2005; Laing, Swayer, & Noble, 1989; Pace, 1985; Pike, 1995; Shavelson, 2010; Volkwein, Lattuca, Harper, & Domingo, 2007), especially under the present study’s conditions. These include the following: (a) Requested information is known to the respondents, (b) questions are phrased clearly and unambiguously, (c) questions refer to recent activities, and (d) answering questions does not threaten, embarrass, or violate a respondent’s privacy (as summarized by Kuh, 2005). Moreover, self-reported responses are considered valid and reliable when comparing the outcomes of groups of students (rather than when assessing individual students; Lattuca et al., 2006), which is the case for the present investigation.
Because their use has come under recent criticism (e.g., C. M. Campbell & Cabrera, 2011; Kuncel, Crede, & Thomas, 2005; Porter, 2011), further efforts were made to demonstrate construct validity. When possible, existing measures vetted through the peer review process were used (Lattuca et al., 2006). Internal consistency, reliability, construct validity, and concurrent validity for newly developed scales (interdisciplinary skills, recognizing disciplinary perspectives, reflective behavior practice, and contextual awareness) are demonstrated in Lattuca, Knight, and Bergom (2013) and Ro, Merson, Lattuca, and Terenzini (2012). For example, these investigations showed significantly higher average outcomes scores for seniors relative to sophomores and juniors and for certain disciplines as theoretically expected (e.g., biomedical engineering and general engineering students reported higher interdisciplinary skills than electrical or mechanical engineers). In addition, researchers have criticized self-report data focused on learning gains, showing that longitudinal measures do not correlate with cross-sectional reports of changes (Bowman, 2010). That critique is not applicable to the present study because students reported on their current skills and competencies as opposed to reporting on changes over time. Moreover, Bowman (2010), who only studied 1st-year students, also noted that the validity of upper-class students’ self-reports would be expected to be higher than 1st-year students. The present study only investigates seniors’ reports of their outcomes.
This study relied on cross-sectional data, so caution is taken to avoid making causal claims. Rather, results are described as variations in student characteristics and experiences across outcome groupings. Those characteristics and experiences certainly may have led to the development of certain outcomes, but the study design cannot test that assertion. The typological approach presented here, however, could readily be applied to a longitudinal design in future research to address this concern.
Despite these limitations, it is important to acknowledge that research simultaneously addressing multiple learning outcomes is still in its infancy. This investigation presents a method that reverses the logic from previous studies that develop student typologies. The self-report data enable analysis via a combination of learning outcomes variables. This, in turn, presents new opportunities to inform policy based on more robust assessment data. As researchers develop direct measures of outcomes, new variables can be incorporated into this approach to provide student learning information to administrators. The correlational evidence from this cross-sectional study also allows for data-based consideration of policies that may help STEM students develop a comprehensive set of outcomes. Results can inform more targeted longitudinal studies to test specific policy ideas, but in the meantime, it would be better to use this information in policy discussions rather than using no information at all.
Results and Discussion
Outcomes-Based Typology
Following Ward’s hierarchical cluster analysis, a single cluster emerged with high scores on all outcomes (i.e., the “E2020 cluster”) for a seven-cluster solution. The smallest cluster contained 7% of students, and the largest contained 19% (see the first two columns of Figure 3). A discriminant function analysis using outcome variables to predict cluster membership correctly predicted clusters for over 90% of cases, suggesting that this solution was stable. Other potential solutions were less preferable because they contained clusters with either too few or too many students for useful subsequent analyses. A multivariate analysis of variance for this seven-cluster solution identified significant differences (p < .05) for the nine outcomes across the seven clusters. Thus, the goal of producing unique outcomes-based clusters was met, each described as follows.
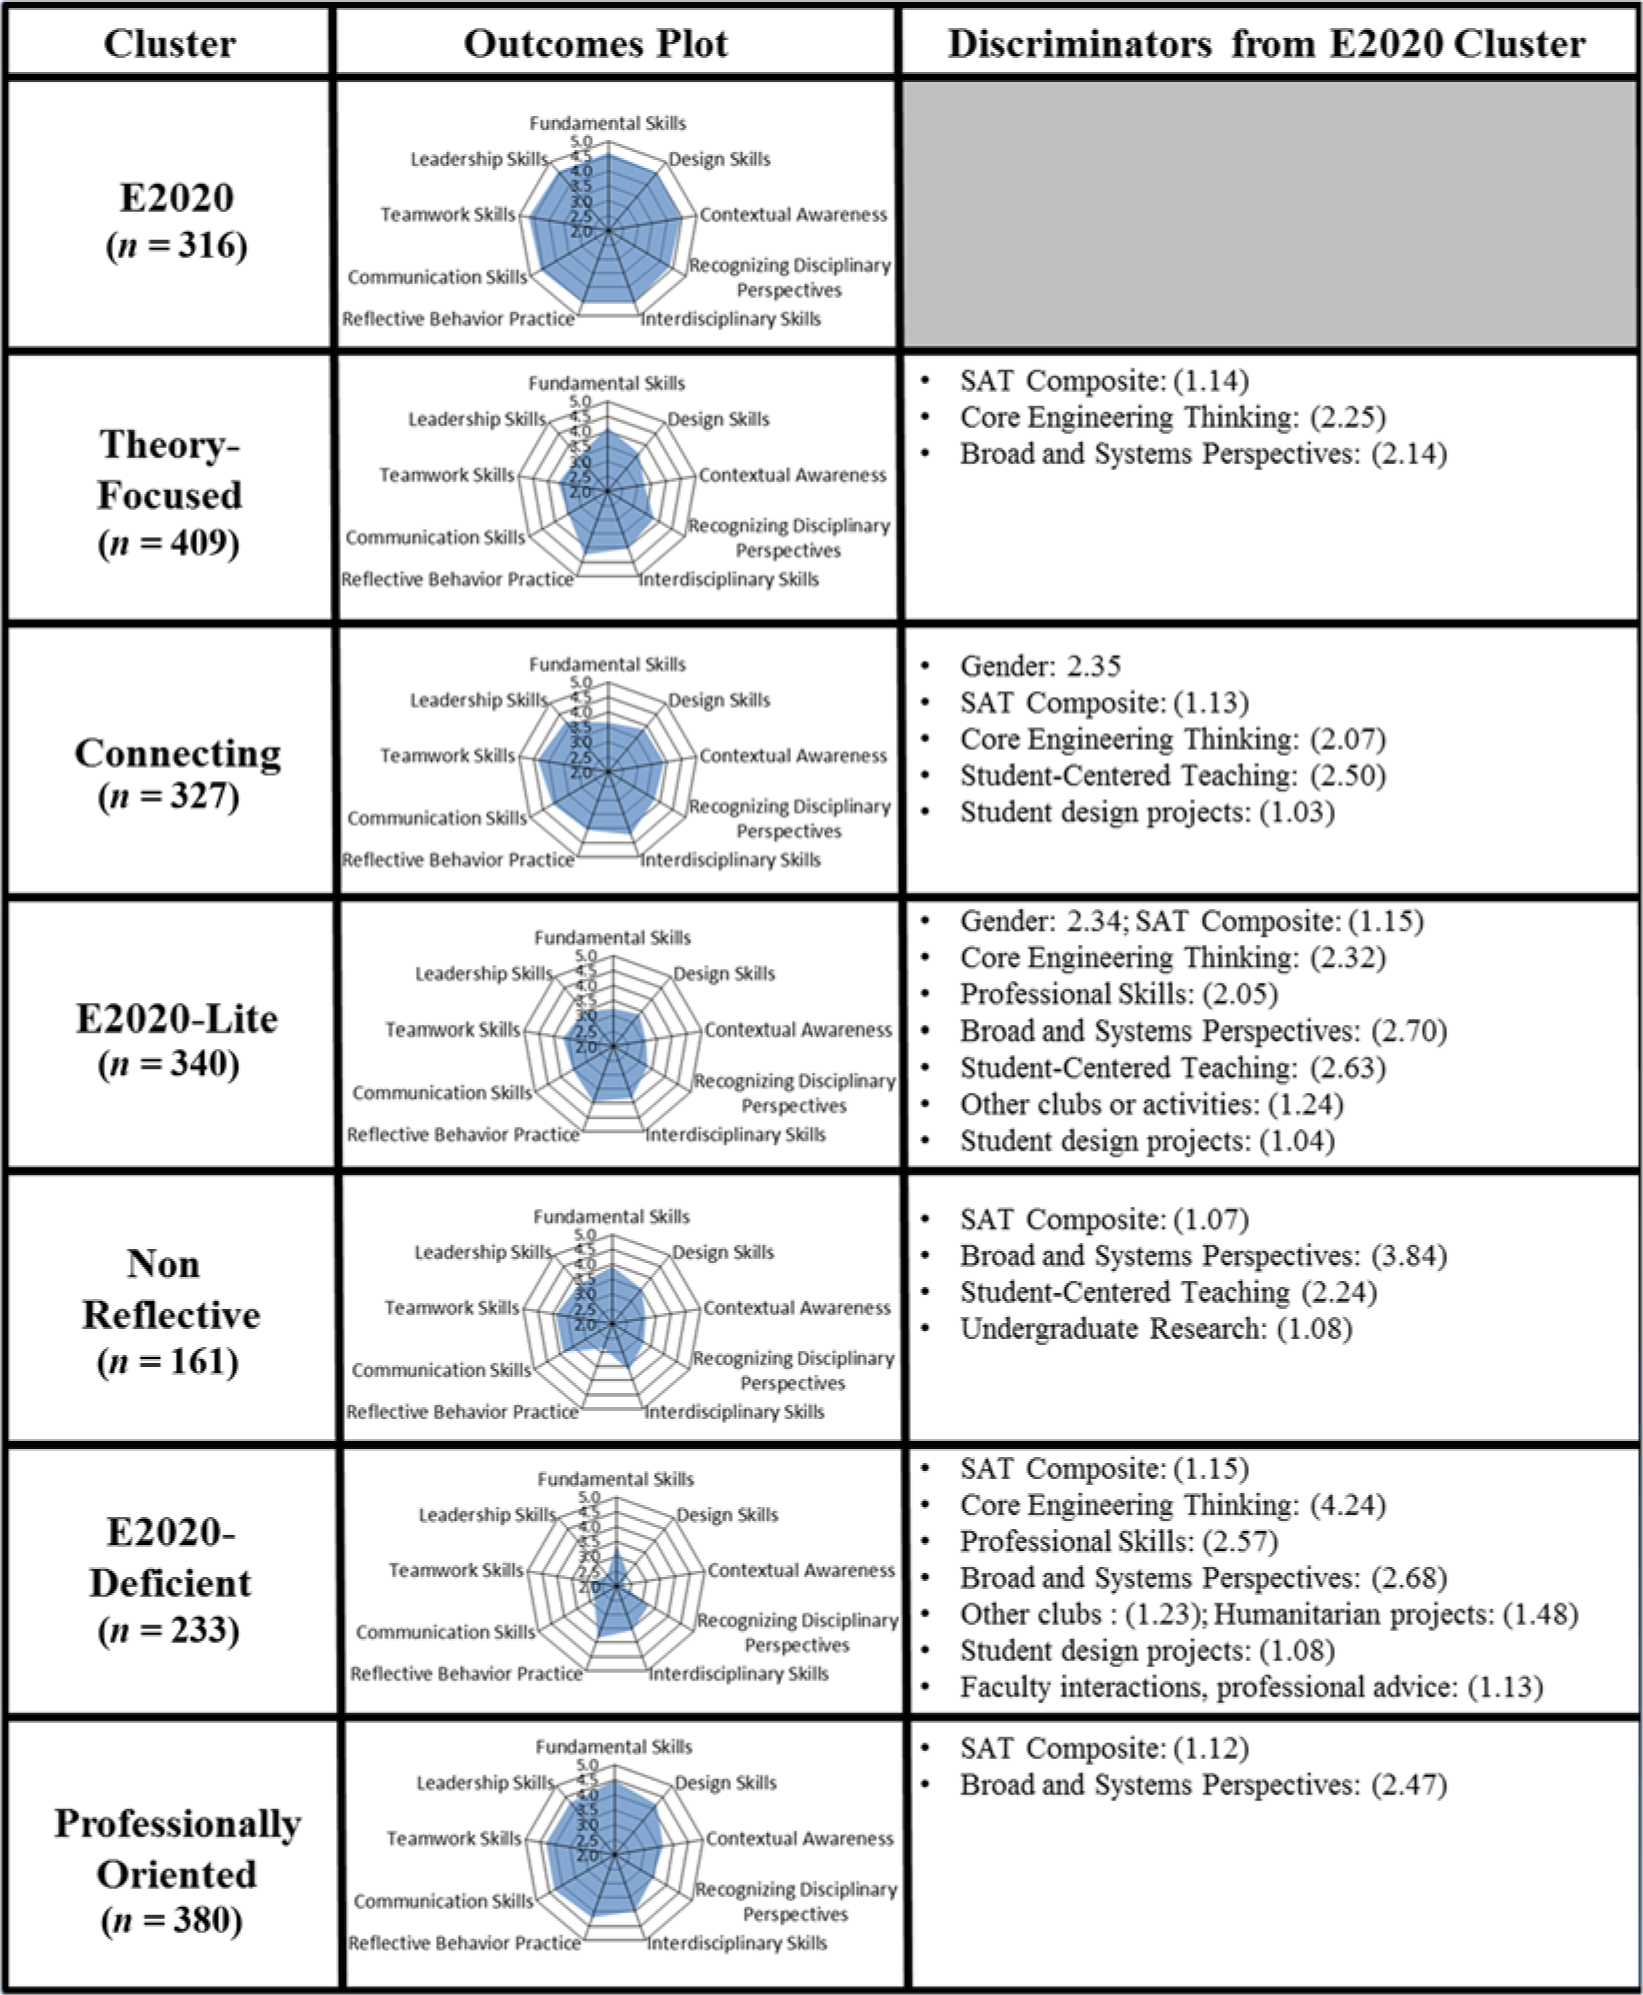
Combined cluster analysis and multinomial logistic regression model results.
E2020 engineers
An “E2020” cluster of students reported high proficiencies on all outcomes. A Mann–Whitney post hoc analysis indicated that reported outcomes by the E2020 cluster were significantly higher for every pairwise comparison with other clusters (see Table 3).
Average Values of Student-Reported Outcomes by Cluster

Note. E2020 = engineers of 2020.
Statistically significant difference between E2020 cluster and this cluster.
Theory-focused engineers
Students in this cluster looked most similar to the E2020 engineers on fundamental skills and interdisciplinary competence dimensions and reported lower abilities on design/contextual awareness dimensions and professional skills. Because the latter dimensions are related to practice within engineering, this cluster was named Theory-focused.
Connecting engineers
These students most starkly contrast with the E2020 engineers on the fundamental skills dimension, with an average value 79% of the E2020 value. Relative to the E2020 engineers, these students are most similar on the interdisciplinary competence and professional practice dimensions, which comprise the ability to connect topics from engineering to other fields and the ability to work and talk with others, hence the cluster name Connecting.
E2020-Lite engineers
Students in this cluster demonstrate approximate well-roundedness overall, but each of the outcomes is less than the E2020 cluster. The name E2020-Lite intends to capture the well-roundedness as well as the lower proficiencies for each outcome.
Nonreflective engineers
These students also are fairly well-rounded yet report lower proficiencies than the E2020 cluster. A striking contrast is the lower average on the reflective behavior practice scale, distinguishing these engineers as Nonreflective.
E2020-Deficient engineers
Students in this cluster report lowest proficiencies overall relative to the E2020 cluster. The design skills/contextual awareness outcomes were only 54% of the average reported abilities by E2020 students, and the professional skills were only 59% of the E2020 value. Relative fundamental skills and interdisciplinary competence values were slightly higher, at 74% and 79%, respectively. These students least resembled the engineers of the future described in the NAE report (2004) and are named the E2020-Deficient engineers.
Professionally oriented engineers
Across all dimensions, this cluster is most similar to the E2020 cluster. Average fundamental skills are nearly identical (97%), and professional skills are relatively high (93%). These students report slightly lower proficiencies on dimensions of interdisciplinary competence and design/contextual awareness (87% apiece). To capture this bias relative to the E2020 cluster, these students are referred to as Professionally oriented.
Cluster Comparisons for Each Variable Set
Precollege characteristics
Several significant associations between precollege characteristics and cluster membership are worth noting. Females comprised 17.9% of the P2P sample of engineering seniors (see Table 4). They were slightly less represented in the E2020 cluster (16.1%), but there were significant differences across clusters according to a chi-square test, ranging from 13.7% for the Theory-focused engineers to 25.1% for Connecting engineers. Females comprised larger proportions of clusters with higher scores on interdisciplinary competence and professional skills dimensions relative to fundamental skills or design/contextual awareness dimensions. This finding aligns with the literature on preferred learning environments of males and females. Females tend to be interested in broad concepts with societal relevance where several solutions are possible for a problem (Brotman & Moore, 2008; Haüssler & Hoffmann, 2002; Knight et al., 2012), and their reported abilities in interdisciplinary competence may reflect this. Males tend to prefer more objective, single-answer problems (Abu El-Haj, 2003), potentially explaining their overrepresentation in clusters relatively higher on fundamental skills. For professional skills (which include teamwork and communication), research indicates that working in small, collaborating groups enhances female STEM students’ attitudes and achievements in particular (P. B. Campbell, Jolly, Hoey, & Perlman, 2002; Johnson & Johnson, 1983; Pawley, 2004). These findings raise future research questions: (a) Might females have a different affinity for certain skills than males? and (b) Do females engage in different experiences leading to different outcomes than males?
Precollege Characteristic Profiles of Each Cluster a

Note. HS = high school; GED = General Educational Development; E2020 = engineers of 2020.
Percentages are calculated within a cluster for each precollege characteristic (e.g., 16.1% of students in the E2020 cluster were women engineers).
χ2(6, N = 2,165) = 22.1, p = .00.
χ2(24, N = 2,166) = 60.0, p = .00.
χ2(42, N = 2,160) = 177.7, p = .00.
Statistically significant difference (comparison group: E2020 cluster).
Among the four largest racial/ethnic groups in the data set (African American, Asian American, Hispanic/Latino American, and White American), the largest discrepancies between proportions in the E2020 cluster and proportions of the entire field were for Hispanic/Latino Americans (see Table 4). They comprised only 4.7% of the E2020 cluster but represented 10.2% of the field’s proportion. African Americans (4.8% of engineers in the overall sample) were overrepresented in Connecting and E2020-Lite clusters at over 7% apiece, as were Hispanic/Latino Americans. These two clusters are among the lowest on the fundamental skills, which has been shown to be a weakness, in general, for underrepresented minorities in engineering because of less advanced academic preparation in high school (P. B. Campbell et al., 2002). This study included only students who persisted to their senior years, and even after 4 or 5 years, underrepresented minorities still were more likely to be found in the weakest clusters and may not have “caught up” to their peers on all outcomes.
For parents’ education level, the E2020 cluster is similar to the distribution for the average of all engineering seniors, as many students in the sample came from well-educated families. Nearly three quarters of E2020 engineers had a parent who had earned at least a bachelor’s degree, and 17.7% had at least one parent with a doctorate. The “weakest” E2020-Deficient engineers notably had the highest proportion of students (8.6%) who indicated that their parents had not completed high school. If parents’ education level is a proxy for socioeconomic status, this finding may suggest that these students entered college less academically prepared, as would be expected according to Alon (2009), and were unable to “catch up” completely to their peers during their undergraduate programs.
Significant differences were apparent across clusters for each SAT component. Because patterns were the same across all sections, the multinomial logit model subsequently described only used the SAT composite variable for the sake of parsimony. Students in the E2020 cluster scored higher on their SATs than students in every other cluster, with the exception of the Nonreflective cluster. Thus, students who reported high proficiencies and well-roundedness on E2020 outcomes entered college with higher SAT scores, on average, than other students. Previous research similarly links SAT scores to performance in college (Astin, 1993) and in persistence and success within engineering (e.g., Bjorklund, Parente, & Sathianathan, 2004; Lattuca et al., 2006; Levin & Wyckoff, 1990; Zhang, Anderson, Ohland, & Thorndyke, 2004).
Curricular emphases
For each of the four curricular emphases, E2020 students reported significantly higher values than students in other clusters (see Table 5). Although the engineering curriculum is prescribed, these students may have enrolled in engineering elective courses that emphasized topics differently than courses chosen by students in other clusters. Alternatively, these students may be more attuned to recognizing such emphases. E2020 students also may have had a higher anchor point than other students and rated all survey answers highly. It is difficult to test this claim because experiencing greater curricular emphases on all of these variables would presumably develop students’ E2020 outcomes. Two instructional practice items, described subsequently, provide evidence against this notion.
Averages of Student Experience Variables of Each Cluster a

Note. E2020 = engineers of 2020; URM = underrepresented minority.
Variables are controlled for gender, race/ethnicity, parent education, and SAT composite score.
Statistically significant difference (comparison group: E2020 cluster).
Courses taken outside engineering
Differences across clusters in course taking are not as apparent. On average, E2020 seniors took 5.8 courses in humanities and 4.2 in social sciences. Students in other clusters took a similar number of humanities courses, but course taking in social sciences significantly distinguished E2020 students from Theory-focused, E2020-Deficient, and Professionally oriented engineers (see Table 5). Other than those exceptions, perhaps the lack of a pattern is indicative of the highly prescribed curriculum in engineering or that these courses are a nonpurposeful assortment of general education courses.
Instructional practices
E2020 students reported that they encounter student-centered teaching often to very often (4.2) but encounter active/collaborative learning less frequently (3.7; see Table 5). Students in other clusters reported lower frequencies of each instructional practice relative to E2020 students. Like the curricular emphases scales, E2020 students would be expected to encounter such high-quality pedagogy in courses, but it is also plausible that these students answered highly on all questions. Two items related to instructional practices that are not included in these scales would not be expected to support E2020 outcomes: (a) “instructors only cover what is in the textbook,” and (b) “instructors use lecture-style teaching.” For these items, there were no significant differences between E2020 students and those in other clusters. This finding adds confidence in the validity of self-reports by E2020 students and for the presence of real differences in experiences between the clusters.
Co-curricular participation
E2020 engineers spent more time participating in undergraduate research (7.1 months) than engineering internships (5.7 months) or cooperative education (2.1 months; see Table 5). They spent significantly more time in undergraduate research than Theory-focused, E2020-Lite, and Nonreflective engineers. Students in the E2020 cluster were more active on average in nonengineering clubs (3.4) than engineering-focused clubs (2.8), such as student chapters of professional societies. Perhaps having opportunities to engage with students from other majors relates to these students’ well-rounded outcomes profiles.
Compared with students in the weakest three clusters (E2020-Lite, Nonreflective, and E2020-Deficient), E2020 seniors participated significantly more in community service work, student design competitions, and humanitarian engineering projects. Participation in such projects may facilitate the development of E2020 outcomes, so programs may want to target such experiences toward weaker students in particular. Alternatively, some of these students, especially the E2020-Deficient engineers, may not be able to participate in co-curricular activities because of financial or achievement concerns. Future work should focus on this weakest cluster.
Finally, E2020 students participated in study abroad experiences for an average of 1 week, which is significantly lower than Connecting and E2020-Lite students (see Table 5). E2020 students in the aggregate may not participate in semester-long study abroad experiences and instead may participate in shorter summer tours or other activities. Longer experiences overseas may be associated with lower reported student outcomes, in particular on fundamentals and design dimensions. This result may indicate that students’ course sequences in the curriculum become disrupted, or it could indicate less commitment to an engineering career. Further work is needed to understand this relationship.
Faculty interaction
E2020 students interacted with faculty members more frequently than students in each of the other clusters, with the exception of Connecting engineers (see Table 5). Professionally oriented engineers talked informally with faculty members fewer times than E2020 students but exhibited no significant differences for interactions related to academic or career matters. Significant differences for the other clusters were consistent across the three types of interactions. The weakest E2020-Deficient engineers had less than half the number of interactions with faculty than their E2020 peers. It is unclear if these students failed to arrange meetings or if they faced unique barriers which precluded interactions from occurring.
Cluster Comparisons Across Variable Sets
Relative to a multinomial logistic regression model using only precollege characteristics to predict cluster membership, the McFadden’s adjusted R2 value of .12 for a model including student experiences was an 11% improvement in explained variance (see Table 6). The Bayesian information criterion (BIC) value of −456 was a decrease of 510 from the precollege model, also indicating a better overall model fit (Long & Freese, 2006). SAT was the only variable that significantly discriminated between the E2020 cluster and every other cluster. Rescaled so that one unit equals a change of 50 points, students were 7% to 15% more likely to be in the E2020 cluster for every 50-point increase in the SAT, suggesting that students’ academic preparation for college still relates to their self-reported, senior-year outcomes. Consistent with previous research (e.g., Harper, Lambert, & Lattuca, 2006; Lattuca et al., 2006; Strauss & Terenzini, 2007), the relationship between entering academic abilities and cluster membership was weaker than the relationship between certain college experiences and cluster membership.
Multinomial Logistic Regression Model Results With Clusters as the Dependent Variable a
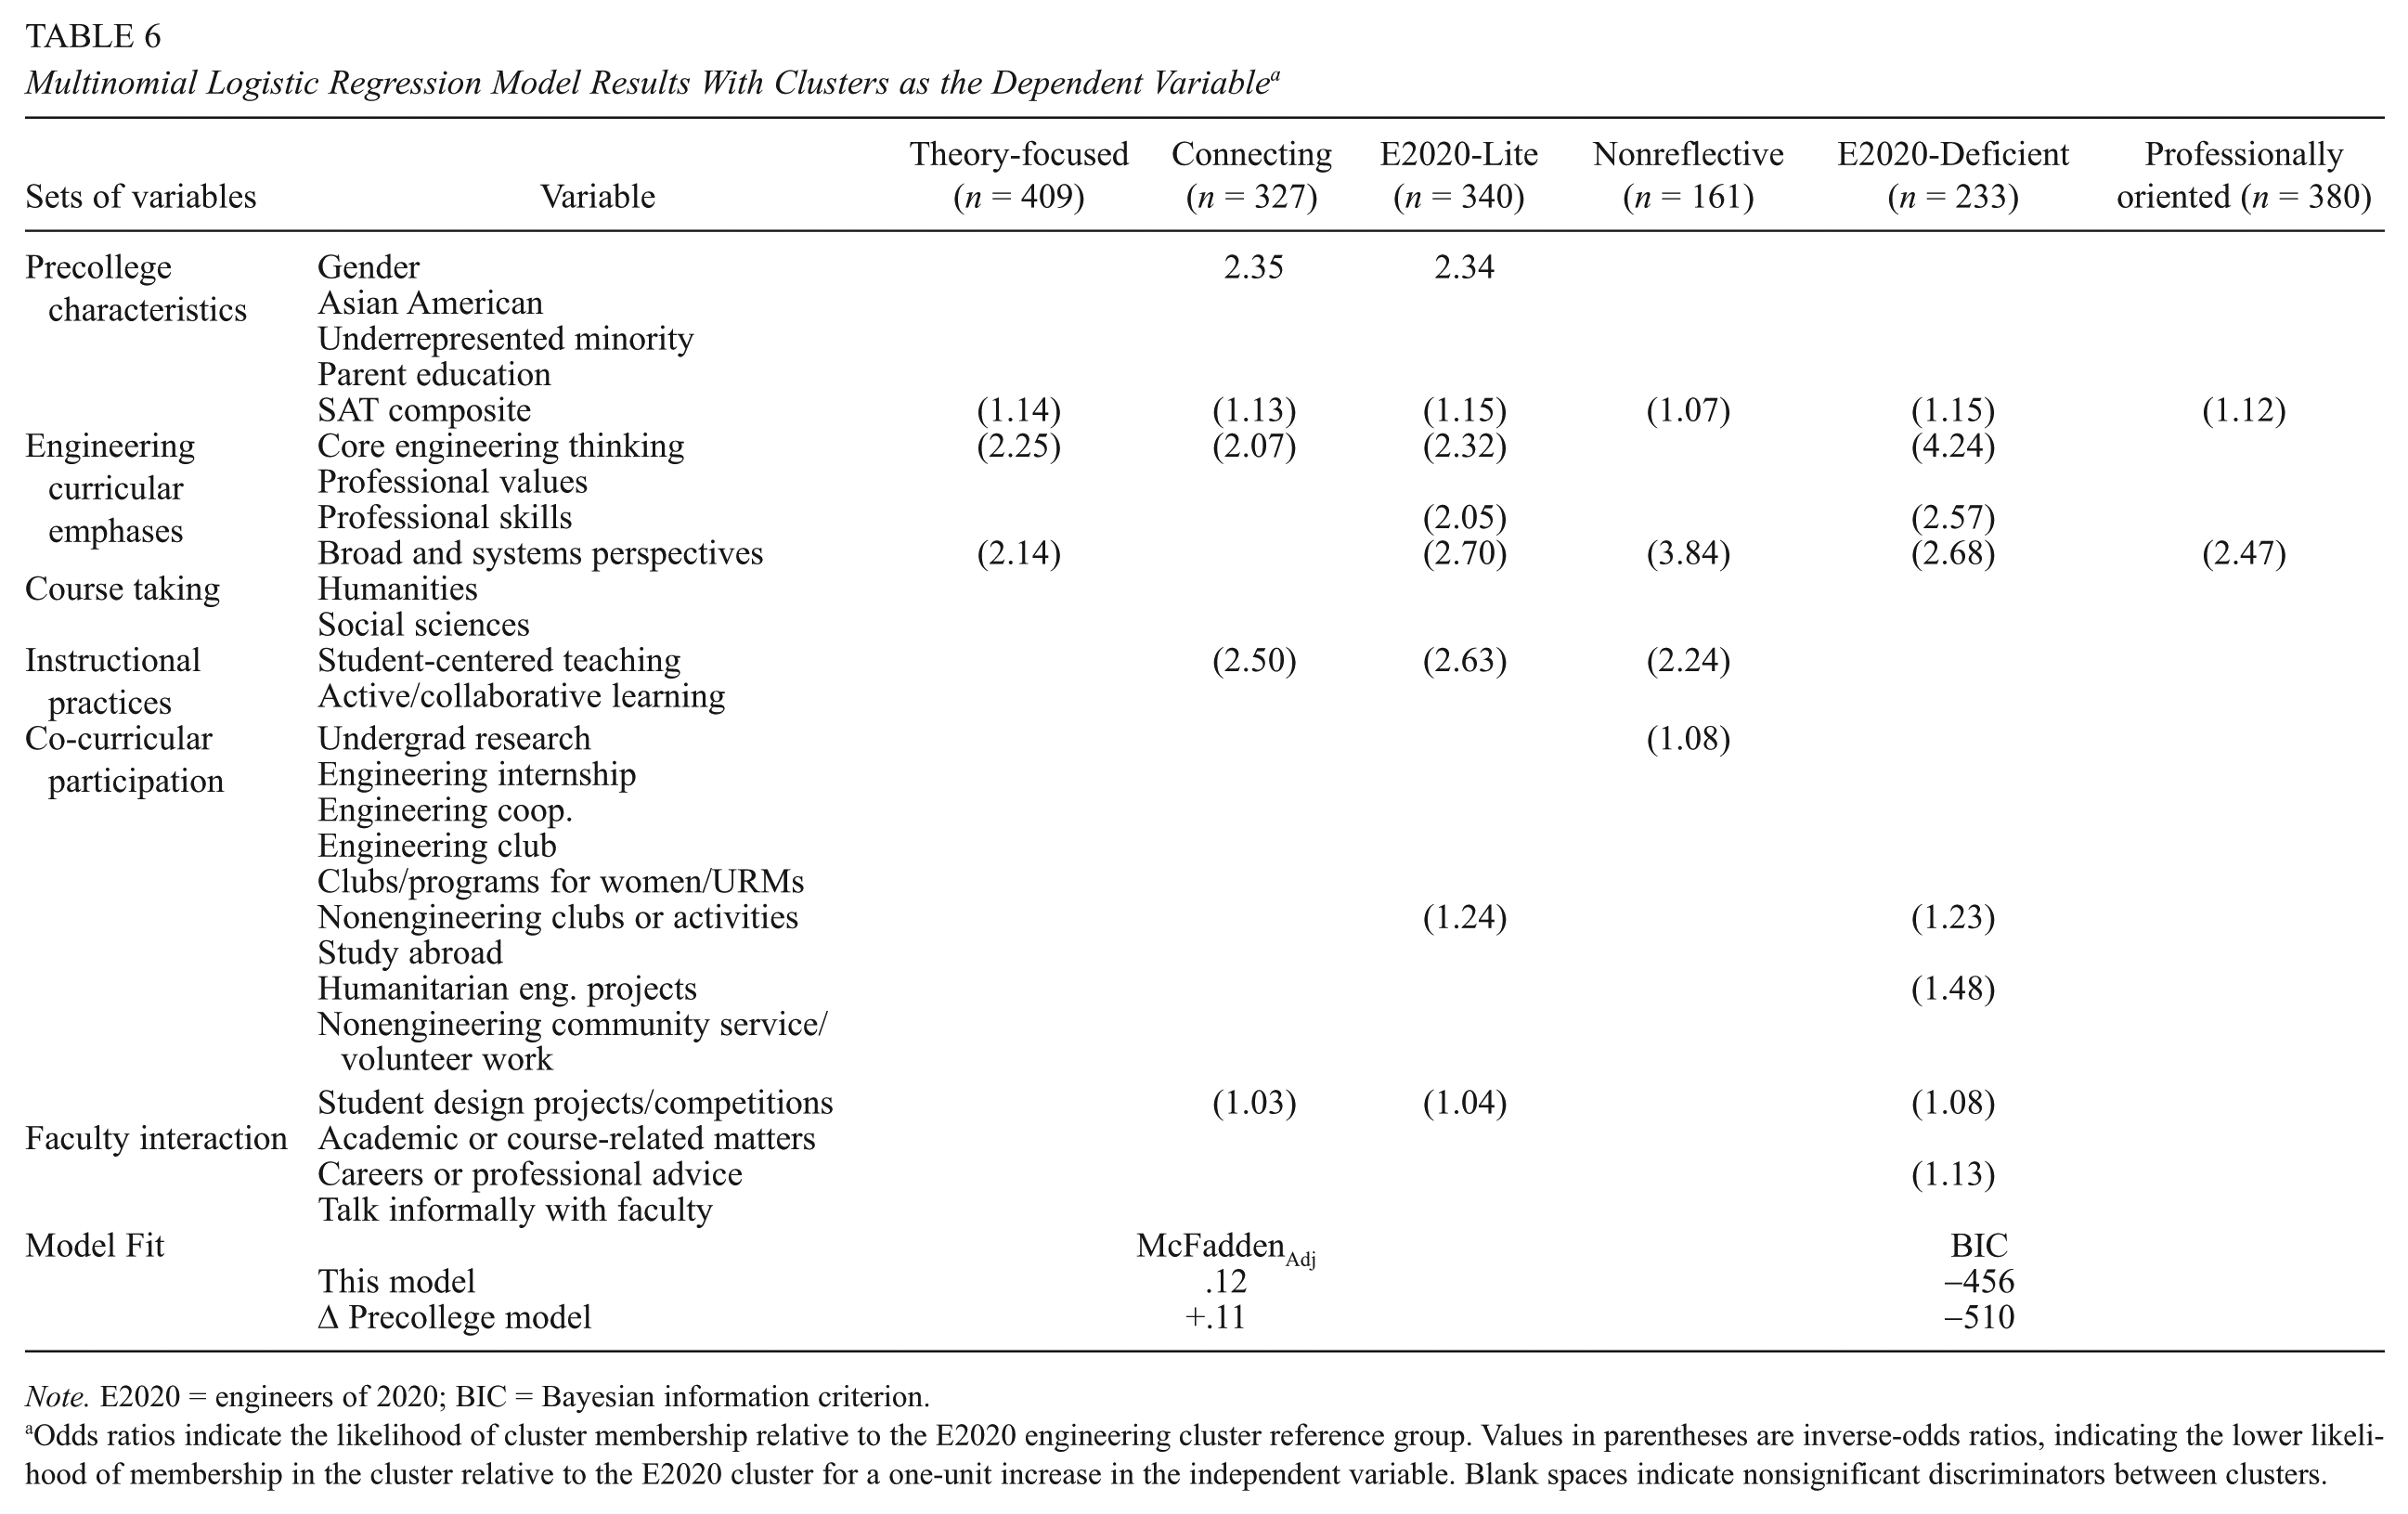
Note. E2020 = engineers of 2020; BIC = Bayesian information criterion.
Odds ratios indicate the likelihood of cluster membership relative to the E2020 engineering cluster reference group. Values in parentheses are inverse-odds ratios, indicating the lower likelihood of membership in the cluster relative to the E2020 cluster for a one-unit increase in the independent variable. Blank spaces indicate nonsignificant discriminators between clusters.
The variable measuring curricular emphasis on broad and systems perspectives consistently distinguished E2020 students from those in other clusters, with inverse odds ratios ranging from 2.14 to 3.84; the one exception is for Connecting engineers. If an engineering school sought a single way to expand its E2020 population, increasing curricular emphases on broad and systems perspectives would be the first recommendation from this research. Such a “silver bullet” solution is ill-advised, however, and examining each cluster of students independently produces more nuanced understandings.
Figure 3 combines results from the cluster analysis with the model output from Table 6 to depict differences between the E2020 cluster and other clusters. In addition to broad and systems perspectives, the Theory-focused cluster is distinguished from the E2020 cluster by lower reported emphases on core engineering thinking (inverse odds ratio = 2.25). Lesser curricular emphases on design (encompassed in the core engineering scale) intuitively appear to be related to the Theory-focused engineers’ lower reports of design and contextual awareness outcomes. These students also reported lower professional skills outcomes. Perhaps they enroll in fewer design courses than do E2020 students, and thus experience a lower core engineering curricular emphasis. Students often work in groups for design projects, an experience that can support the development of professional skills (i.e., teamwork, communication, and leadership). Thus, although these students perceive the same emphasis on professional skills as E2020 students, they may have fewer hands-on opportunities to practice those skills in course design projects.
Connecting engineers report relatively weaker fundamental skills and design outcomes. Higher reports of program emphases on core engineering thinking (inverse odds ratio = 2.07) as well as increased participation in out-of-class design projects (inverse odds ratio = 1.03) were associated with an increase in likelihood that students were in the E2020 group over this cluster. Both experiences would be expected to have a positive influence on fundamental skills and design outcomes in particular. In addition, students who report more student-centered teaching are 2.5 times as likely to be in the E2020 cluster than in the Connecting cluster.
E2020-Lite engineers similarly report lower fundamentals and design skills in particular than students in the E2020 cluster. As anticipated, core engineering thinking, student-centered teaching, and participation in design projects variables all distinguished these students from E2020 students. In addition, these students were weaker on the professional skills outcome dimension and slightly weaker on the interdisciplinary competence dimension than E2020 students. With an inverse odds ratio of 2.05, the professional skills curriculum emphasis statistically distinguished these students from the E2020 cluster. Moreover, these students participated less in nonengineering clubs and reported lower emphases on broad and systems perspectives, activities that previous studies have associated with greater interdisciplinarity (Knight, 2011; Lattuca, Trautvetter, Codd, & Knight, 2011). Females were more likely to fall in the E2020-Lite cluster than the E2020 cluster. It has been documented that females in STEM disciplines lose confidence in their abilities because of feelings of isolation (e.g., Seymour, 1995; Whitt, Pascarella, Neisheim, Marth, & Pierson, 2003). It is premature to conclude that females are less likely to be E2020 students. Rather, it is more reasonable to hypothesize that females may have systematically perceived and reported their abilities lower than males.
Nonreflective and Professionally oriented engineers report relatively lower abilities on design/contextual awareness and interdisciplinary competence outcomes dimensions. As anticipated, a curricular emphasis on broad and systems perspectives (i.e., a focus on contextual and interdisciplinary issues) is the most influential discriminator between these clusters and the E2020 cluster. Undergraduate research significantly discriminated Nonreflective engineers from E2020 cluster membership, as students were 8% more likely to reside in the E2020 cluster for an additional month of undergraduate research. In conducting research, stepping back to think about the problem is an important step in the process, and students who are engaged in research longer have more opportunities to develop this reflective skill.
Finally, an array of student experiences varied between the E2020-Deficient engineers and the E2020 students. As shown in Figure 3, these students’ outcomes are skewed toward interdisciplinary competence, which raises questions about the direction of their career aspirations. For some of these students, professional and design skills may be less important than the development of interdisciplinary skills, which may help explain why students are 13% more likely to be in the E2020 cluster than this weakest cluster for each additional interaction with faculty members about career-related issues. In addition, it may explain why students are 48% more likely to be in the E2020 cluster if they participate in additional humanitarian engineering projects. The E2020-Deficient cluster of students may choose not to engage in such activities if they are not training for a future in engineering, despite the fact that demonstrations of the social relevance of engineering may be the persuasion that these students need to remain in the field. Alternatively, because these students reportedly are less proficient, they may not be in a position to make a decision about remaining in engineering postgraduation.
Conclusion and Implications
An important contribution of this study is the development of a typology using a set of learning outcomes. Rather than disaggregating skills for individual students, it comprehensively considers an individual’s skills. Clusters demonstrate that the balance of reported learning outcomes varies across students. For example, although multiple groups of students report high abilities on fundamental skills, one group may be weaker on design skills, and another may be weaker on professional skills. This new approach has merit because most academic programs seek to develop an array of abilities in their graduates. The graphical representation makes student learning data accessible for faculty members and administrators seeking to evaluate the effectiveness of their academic programs in achieving the set of learning objectives they set forth. For assessments to be useful for improving educational conditions and outcomes, faculty members should be engaged throughout the process, which requires an easily accessible presentation of data (Hutchings, 2010; Mentkowski, 1991).
From a policy perspective, investing in STEM education has been a cornerstone of President Obama’s agenda (White House, 2011). The NAE’s vision for the engineer of 2020 clearly identifies the set of attributes that graduates will need to enter a competitive workforce in the global economy, and engineering programs presumably seek to graduate students who successfully have developed these skills and abilities. This study not only provides a benchmark of progress toward that vision for undergraduate engineering programs, but also yields the following implications for policy and practice:
Applicability to any set of learning outcomes in response to calls for accountability
Like engineering, other professional fields identify a target set of student learning outcomes, and accreditation processes in those arenas could use this approach to identify outcomes-based profiles. Similarly, colleges and universities have been pressed by accreditors, government, and the public to demonstrate the benefits of postsecondary education. For example, AAC&U’s (2012) LEAP learning outcomes include knowledge of human cultures and the physical and natural world, intellectual and practical skills, personal and social responsibility, and integrative and applied learning. The techniques in this study to consider multiple learning outcomes offers an approach for understanding institutional progress toward such general education outcomes.
Informing policy conversations that can lead to further longitudinal testing
This typology is meaningful because it identified variations in precollege characteristics and student experiences across outcomes-based clusters; thus, the method linked educational processes to outcomes from a system’s perspective of higher education. Policymakers and administrators can use the broad findings from this study to guide data-driven policy brainstorming sessions which would then lead to more targeted longitudinal studies of specific policy ideas. For example, results of this study strongly suggest that, relative to their peers, E2020 engineers experienced a curriculum that placed a greater emphasis on broad and systems perspectives. Funding agencies could use this evidence to rationalize allocating resources for longitudinal studies to test the impact of promoting such curricula.
Data-driven evidence that can guide decision making
Although this study design was cross-sectional, results provide preliminary indications of “what works” in helping undergraduate engineers develop an array of outcomes. With no similar information available, administrators could use these findings to guide resource allocation, programming decisions, and co-curricular offerings while more targeted longitudinal studies are carried out. Using these findings as a guide would be better than making administrative decisions “by feel.” For example, policymakers and funders who seek to promote the E2020 vision could prioritize revenue streams for student organizations that engage engineers with students from across the institution as opposed to engineering-centric organizations. Using these data to guide policies and priorities for funding should increase the desired return on investment.
Potential for attracting females to the field
Female students were overrepresented in clusters skewed toward interdisciplinary competence and professional skills dimensions; thus, females may have an affinity for these skills or prefer certain educational environments. Experiences emphasizing the role of cultural, environmental, economic, and nonengineering contexts in solving problems, and opportunities for team-based projects might boost the attractiveness of engineering to females. Programs seeking to diversify could consider expanding and advertising such curricula and offerings.
Guide for recruiting subpopulations of students into certain activities
Hispanic/Latino American, African American, and first-generation students overpopulated the weakest clusters (additional work should test the interactions among these variables). An initiative supported by this research could target recruitment efforts toward these students for specific co-curricular experiences for which E2020 students’ participation is high. First-generation students often have to work during college to meet family financial obligations (Corrigan, 2003). Programs could offer need-based scholarships for participation in specific co-curricular activities (e.g., a position on a student design team or humanitarian project) to allow these students to earn money while also engaging in an E2020-related activity.
Applicability for student advising
Faculty members and administrators may be able to identify their advisees’ relative strengths and weaknesses on a set of outcomes and could use cluster profiles as a guide for recommendations. If they place a student within a cluster (either empirically or via professional judgment), having a graphic like Figure 3 would allow for data-supported suggestions. For example, if they believe that one of their students should develop their reflective behavior, an advisor using these results may recommend that the student seek an undergraduate research opportunity. Applying this research approach’s results in this way would enable data-driven decision making for students at the individual level.
In summary, the assessment and accountability movements have engulfed all of higher education, and institutions are being asked to demonstrate effectiveness in educating students to show that investments in higher education are worthwhile (e.g., Shavelson, 2010). The approach in this study to develop a student typology based on a comprehensive set of learning outcomes provides one idea for measuring educational effectiveness. For any set of outcomes measures, institutions could cluster students from across class years to demonstrate that upper-class students populate more advanced clusters, and 1st-year students populate relatively “weaker” clusters. If this finding does not come to fruition, institutions would have empirical evidence for revising their educational offerings. Using outcomes data in innovative ways will be imperative as the policy culture of assessment and accountability continues to build momentum.
Footnotes
Declaration of Conflicting Interests
The author(s) declared no potential conflicts of interest with respect to the research, authorship, and/or publication of this article.
Funding
The author(s) disclosed receipt of the following financial support for the research, authorship, and/or publication of this article: This material is based upon work supported by the National Science Foundation under Grant No. EEC-0550608.
Author
DAVID B. KNIGHT is an assistant professor of engineering education at Virginia Tech (