
Abstract
This study examines public school characteristics, and public and private school market characteristics, associated with participation among elementary-aged students in a means-tested school voucher program in Florida. Participants are more likely than eligible nonparticipants to come from disadvantaged public schools on multiple dimensions. On average, participants’ public schools have lower aggregate student achievement, and higher rates of disciplinary incidents. Participants’ schools receive less positive ratings on various measures from principals and teachers. Participants face more competitive private school markets, and less competitive public school markets, than do nonparticipants. When these factors are considered together, the mean achievement and disciplinary incident rate of students’ own public schools, as well as public and private school market variables, independently predict voucher use.
Keywords
S
Proponents of such programs argue that in addition to indirectly improving educational experiences for all public school students by exerting competitive pressure on public schools, vouchers should directly help the most disadvantaged children, allowing them the opportunity to exit unsafe and underperforming schools. Opponents posit that families may be motivated more by considerations about the demographic characteristics of the student body in available public schools than poor school quality. These are fundamentally arguments about how school contexts will affect the decision to use vouchers. Yet, while a healthy body of research has examined the individual characteristics of voucher users, past work has primarily been conducted on city- or district-wide rather than state-wide voucher programs. Because there is less variation in school contexts within districts than there is within states, there has been relatively little detailed work to date on the contextual characteristics of students’ public and private school options that predict whether students use vouchers.
Employing richer data than has been used in past observational research on voucher use, this article provides a detailed examination of characteristics of students’ own public schools, and characteristics of both public and private school markets, that predict student participation in the means-tested Florida Tax Credit (FTC) Scholarship Program. It addresses three policy questions: (a) Are program participants disproportionately likely to hail from the types of troubled schools that voucher proponents argue they would otherwise attend? (b) What factors of children’s own public schools and the school choice markets they face best explain participation in the program? (c) To what extent does the demographic composition of schools predict participation? Does this differ based on children’s own demographic characteristics?
I find that voucher program participants are more likely than are eligible nonparticipants to come from public schools that are troubled along a number of dimensions. Compared with the schools of eligible nonparticipants, participants’ sending public schools have worse aggregate academic performance; higher rates of violent incidents, nonviolent disciplinary incidents, and out-of-school suspensions; and more negative school climates according to both teacher and principal ratings. When all of these factors are used to predict program participation, school academic quality and disciplinary incidents have the strongest independent predictive power.
Private school and public school markets differ too. Participants face more convenient and more varied private school options than do eligible students who do not participate. On the public school market side, students are less likely to participate when they have access to robust public school choice. Students with limited options for open enrollment and who have limited access to charter schools are more likely to participate in the voucher program. Both public and private markets continue to be predictive of program participation when other factors are controlled. Overall, these results suggest that students consider both the quality of their current public schools and the full range of choices available to them among both public and private options in deciding whether to participate in the FTC Scholarship Program.
Finally, the results on demographic composition suggest that students are more likely to leave schools with high concentrations of African American students or low concentrations of White or Hispanic students, and less likely to leave schools with high concentrations of subsidized lunch-using students, when other factors are controlled. Somewhat surprisingly, these results vary little based on students’ own demographic characteristics.
This research represents the most detailed quantitative observational analysis to date on the public and private school contexts that predict who decides to participate in means-tested school voucher programs, and one of the only analyses to date of the increasingly popular tuition tax-credit model of voucher program. As such, this study provides valuable new information to the debate over who benefits from school vouchers and what factors promote their use.
Background and Prior Literature
Advocates of voucher and school choice programs claim that vouchers will help students escape underperforming and unsafe schools. 2 They argue that affluent students have always exercised choice over their schools; because students are served by neighborhood schools, wealthier parents are able to choose their children’s school in connection with their residential decisions. Voucher programs, according to this line of argument, should particularly benefit poorer children by extending to them the access to choice always enjoyed by affluent students (Gill, Timpane, Ross, Brewer, & Booker, 2007; Goldhaber & Eide, 2002; Hoxby, 2003). By improving poor children’s access to private schools, school choice proponents argue, vouchers will open the opportunity for them to find their best educational match and attend safer schools.
Voucher critics argue that rather than helping disadvantaged children, choice programs will most benefit students with informed parents and the means to supplement vouchers with their own funds to afford private school tuition and related costs like transportation (Gill et al., 2007). Moreover, they argue that vouchers will not necessarily help students in failing schools, because parents will apply not out of a desire to avoid poor-quality public schools, but due to considerations such as religion or racial mix of students (Carnegie Foundation for the Advancement of Teaching, 1992; Lacireno-Paquet & Brantley, 2008).
Two threads of research have informed the debate about who selects into school choice programs and why. The first strand derives information on parents’ motivations in applying for school choice programs from interviews, focus groups and surveys. The second compares applicants to nonapplicants (or voucher users to those who are offered vouchers but decline them) on observable qualities to determine the factors that predict selection into programs.
Studies of parents’ stated preferences find that parents generally cite academic concerns as their primary consideration in deciding whether to use vouchers (Beales & Wahl, 1995; Greene, Howell, & Peterson, 1997; Teske & Schneider, 2001; Witte, 2000). Studies of two Milwaukee voucher programs found that parents most often rated education quality as an important factor in their decision to participate (Beales & Wahl, 1995; Witte, 2000). These results were echoed in a survey of participants in the Cleveland Scholarship and Tutoring Program. The vast majority of parents in that survey (85%) identified academic quality as a motivator in their decision to apply to the program (Greene et al., 1997).
Parents citing academic quality as a motivation for voucher use can be read in two ways. First, it may be that private schools offer very high quality education, and parents are drawn to private schools despite having satisfactory public options. Alternatively, parents may opt into voucher use because their public options are very poor, and even mediocre private schools shine in comparison. Survey evidence of voucher users in Florida (Forster & D’Andrea, 2009) and Milwaukee (Beales & Wahl, 1995; Witte, 2000) suggests that the second explanation holds for many parents. Many parents also report dissatisfaction with public schools on other grounds, such as safety, as factors prompting their voucher use (Greene et al., 1997).
In addition, religion is named as an important consideration by many parents in programs that allow matriculation in nonsecular schools. Approximately one third of parents named this as an important consideration in the Cleveland scholarship program (Greene et al., 1997). Surveys of parents also indicate that values, broadly defined, are an important consideration, particularly for high-SES parents (Schneider, Marschall, Teske, & Roch, 1998).
Finally, parents consider location when deciding where to send their children. Roughly 60% of parents participating in choice programs in Milwaukee report that the location of private schools was an important consideration for them in deciding to participate (Beales & Wahl, 1995). Location was also ranked as an important consideration for parents in the Cleveland Scholarship and Tutoring Program, and among parents who declined voucher offers, difficulty securing transportation was identified as a major impediment (Greene et al., 1997). Inconvenient locations were also identified as a barrier to take-up by parents who declined vouchers in New York, Dayton, Ohio, and Washington, D.C. (Howell & Peterson, 2006).
While the interview-based literature suggests that parents’ decisions to seek vouchers are influenced by contextual characteristics—such as the safety, academic performance, and overall environment of the public schools or the convenience and quality of private school options—observational studies have, with a few exceptions, focused primarily on the family or child characteristics that distinguish applicants from nonapplicants (Beales & Wahl, 1995; Belfield, 2005; Campbell, West, & Peterson, 2005; Chakrabarti, 2005; Howell, 2004; Howell & Peterson, 2006; Witte, 2000). Only a handful of studies have also matched students to the public schools that they previously attended and examined how public school characteristics are associated with application (Belfield, 2005; Campbell et al., 2005; Figlio, Hart, & Metzger, 2010; Howell, 2004). Findings regarding school quality are mixed; Belfield (2005) finds no difference between the public school quality of applicants and nonapplicants, while Howell (2004) and Figlio et al. (2010) find that applicants come from schools that have poorer academic performance than schools of eligible nonapplicants. Campbell et al. (2005) find that participation in voucher programs is negatively related to school expenditures, and unrelated to student–teacher ratios and demographic characteristics of schools. Unstudied by observational research to date is the role that school climate (including factors like school violence, disruptive behavior from students, and teacher expectations) may play in parents’ decisions to seek vouchers for their children.
The racial composition of the schools that students leave, and the composition of the district at large, have received only slightly more attention from researchers. Campbell et al. (2005) find that students are less likely both to apply for, and to accept, vouchers when there are higher shares of minorities in their school district; they explore if these effects operate differently for Whites, and find no evidence of White flight. Howell and Peterson (2006) find mixed evidence on descriptive comparisons of segregation for schools attended by voucher students versus traditional public schools in three cities, and Figlio et al. (2010) find that White and Black (but not Hispanic) voucher users tend to transfer to schools where their own race is more heavily represented than in the school that they leave. A broader literature on choice through charter schools has likewise come to mixed conclusions. Some studies have found positive results on segregation (i.e., that charters tend to be less hyper-segregated than traditional schools; Ritter, Jensen, Kisida, & Bowen, 2012), while others find that charter schools are more segregated than their traditional counterparts and that students’ moves tend to be toward more segregated settings than they leave (Bifulco & Ladd, 2006; Garcia, 2008).
Finally, few studies have considered how the likelihood of voucher use is associated with characteristics of the markets for private and public schools that students face. The few studies that examine private school markets find that private school proximity (Goldhaber, Brewer, Eide, & Rees, 1999) and market penetration (Campbell et al., 2005) positively predict voucher use. The association between access to public school choice programs and voucher uptake has been addressed in only one prior study, which found that admission to preferred charter options was a popular reason for students to decline voucher offers (Wolf et al., 2010).
This article contributes to this literature by considering a dramatically expanded set of public school, private school market, and public school market characteristics to determine the contextual factors associated with participation in one of the largest voucher programs in the country—the FTC Scholarship Program.
FTC Scholarship Program
The FTC Scholarship Program, inaugurated in the 2002–2003 school year, offers dollar-for-dollar tax credits to corporations for donations to Scholarship Funding Organizations. These organizations, in turn, award scholarships for private school tuition for eligible students. To be eligible, students must qualify for subsidized meals (i.e., have family income less than or equal to 185% of the federal poverty line). As of 2007–2008, eligibility was further restricted to students who either attended Florida public schools in the prior year or were entering schools for the first time as K–1 students. Participants remained eligible in subsequent years as long as their family income did not exceed 200% of the federal poverty line (Statute 220.187, 2006).
By the 2007–2008 school year, the FTC program enrolled nearly 21,500 students. This represented about 1% of the public school population of Florida and approximately 2% of the low-income population. Students applying for the program for the first time in 2007–2008 (to enter in the 2008–2009 school year) were eligible to receive up to US$3,950 in funds to be used for tuition and other school-related expenses such as books and transportation costs (Florida Department of Education [DOE], 2013). Vouchers need not cover the full amount of private school tuition; families are allowed to supplement the scholarship as necessary to meet tuition bills. However, the voucher covered about 90% of a typical religious elementary school tuition in Florida, leaving families with relatively modest out-of-pocket expenses (Figlio & Hart, in press).
The application process poses nontrivial costs to applicants. Applicants must fill out a lengthy application and pay a modest fee. They must also submit tax returns to verify income eligibility. These time and financial costs suggest that parents likely do not apply on a whim. Rather, specific considerations likely impel them to apply. For example, they may consider their public school to be of low quality (either in terms of academics or safety), they may see their own child flailing in the public school (regardless of overall school quality), or they may value some quality that a private school is uniquely able to provide (such as a religious orientation or convenient location). On the other hand, since private school enrollment may entail extra costs to applicants over the scholarship provided, parents are likely to take full stock of their options before committing to a potentially costly private school, including their options to attend other public schools. I consider how these factors play into the decision to use vouchers.
Method
Sample
To fully exploit the detail provided by the microdata on public school students, my primary analysis focuses on students who were observed in public schools in 2007–2008 and distinguishes those who participated in the FTC program in the following year from those who did not participate. The Scholarship Funding Organizations that disburse the scholarships provided me with microdata on all 34,953 students who applied in 2007–2008 for admission in the 2008–2009 school year. To make a clean comparison with nonparticipants who are income-eligible for the program, the sample is restricted to those who used free and reduced-price lunch in 2007–2008; since the program eligibility threshold is identical to the threshold for reduced-price lunch qualification, this should not force me to exclude any income-eligible participants.
Because most participants are in elementary school and because elementary schools differ in significant ways from middle and high schools, the comparisons further focus on elementary-aged students (n = 18,012). Finally, because I have the richest data on students observed in public schools prior to applying, this analysis focuses primarily on this group of students. These students, the “potential switchers,” are restricted to the nondisabled population, since disabled students are eligible for the more generous McKay Scholarship Program and are therefore underrepresented in the applicant population. This yields a sample of 2,764 new “participants,” who are compared with 555,271 nondisabled, elementary-aged subsidized lunch-using “nonparticipants,” who were eligible but chose not to participate in the FTC program.
Analytic Plan
To determine which factors independently contribute to students’ participation in the program, I use a linear probability model to relate the likelihood of a student applying to the school contexts they face, controlling for individual factors. The main model I use is:
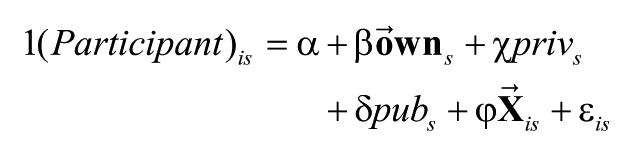
where the left-hand side of the equation expresses the probability of program participation in the 2008–2009 school year for student i in school s,
Additional regressions test the interaction of several individual and contextual characteristics with these scales. Finally, I conduct several sensitivity checks.
Measures and Data
Data identifying applicants is drawn from records provided by the Scholarship Funding Organizations on applicants during the 2007–2008 school year. Data on individual student characteristics for the full universe of 2007–2008 public school students is drawn from the Florida DOE Data Warehouse, which provides microdata on student demographic characteristics and test scores for all students in the public school system. I draw on a number of different data sources to characterize different elements of students’ own public school, private school, and public school market contexts. The regression analyses aggregate some of these measures into scales to reduce the dimensionality of the data; I first present the measures that underlie these scales before discussing the scale creation.
Own public school
I characterize five domains of the climate of the public schools that students would attend absent program application: school demographics, school performance, staffing, school climate as reported by principals, and school climate as reported by teachers. School demographics are drawn from Florida School Indicator Reports and include the share of students on subsidized lunch as well of the shares of students reported to be of White, Black, or Hispanic ethnicity in school records.
School performance is characterized in two ways. Lagged school grades assigned by the DOE are provided through Florida School Indicator Reports. Data on average test scores in schools are created by averaging the test scores of individual students in the school, standardized by grade level. Staffing indicators, including the share of teachers with advanced degrees, average years of teacher experience, and student–teacher ratios, are drawn from the Florida School Indicator Reports. I also examine whether charter students are differentially likely to use vouchers; charters are identified in the Florida DOE Master School Identification Data file.
To further characterize public school contexts, I used three sources of data on school climate. Reports on incidents of student disruption and suspension rates in schools were taken from the Florida School Indicator Reports. I classify four types of incidents: violent incidents; drug/alcohol, and tobacco offenses; bullying; and other nonviolent offenses. 3 I report the number of each type of offense per 100 students in the school. The other two sources of data on school climate comprise surveys of principals and teachers collected by researchers at the University of Florida, the Urban Institute, and Princeton University (Rouse, Hannaway, Goldhaber, & Figlio, 2013). Principal surveys were administered to all principals in the state in 2004. The response rate was 72.5%. Teacher surveys were administered in 2005 to a subset of teachers in 275 elementary schools. Although these surveys were administered a few years before students began applying for vouchers, they should provide a proxy for school climates as of 2007–2008.
Respondents rated their agreement with statements such as “staff morale is low” and “parents worry about violence in this school” on Likert-type scales ranging from 1 to 5 (for principals) and 1 to 4 (for teachers). Because scores are skewed, with few respondents ranking their schools very pessimistically, results are reported according to whether respondents ranked their school in the most optimistic two categories. Measures in the principal scales include rankings of staff morale, whether teachers with three or fewer years of experience (“new” teachers) were excellent, whether teachers with more than 10 years of experience (“experienced teachers”) were excellent, whether student disruption interfered with learning, whether parents worry about violence at the school, and whether parents monitor children’s academic progress. Measures from the teacher surveys include ratings of whether teachers spend less time on nontested materials to boost scores on the Florida Comprehensive Assessment Test (FCAT), the state’s standardized test; whether respondents spend less time with low performers due to Florida’s A+ accountability program; whether they spend less time with higher performers due to the accountability program; whether parents monitor instruction, whether teachers at the school in general have low expectations of children; and whether parents help children with their homework. Teachers also estimated the percent of their time spent on discipline problems.
Private school markets
To characterize the degree of access students have to private schools, I examine several geospatial variables: the distance between the child’s public school and the nearest private school, the number of private schools within a five-mile radius of the public school, the percentage of children who had any private schools within a five-mile radius of the public school, and the number of “types” of private schools within a five-mile radius. Schools are categorized as one of nine “types”: Baptist, Catholic, Evangelical, Islamic, Jewish, Protestant, “Other Christian,” nondenominational, and secular. This measure is intended to capture the variety of options that families have; a greater variety of options should increase the likelihood that families of different religious backgrounds will have access to a school that satisfies their religious tastes. Private schools are restricted to those that serve elementary-aged children (who make up the analytic sample), and to schools that accept the FTC scholarship. The child’s public school is used as the focal point for geospatial measurement because I do not have home addresses for nonapplicants.
Public school markets
Access to public choice is operationalized as the extent to which students have access to open enrollment and charter options. Open enrollment access is characterized based on district-level uptake in open enrollment (Florida DOE, 2008). In the 2007–2008 school year, 12.42% of public school students state-wide were enrolled in nonzoned schools under Florida’s controlled open enrollment program. However, there was significant variation in the extent of open enrollment among districts. Approximately half of students were enrolled in districts with more than 5% of students using controlled open enrollment; these students are characterized as residing in “high open enrollment” districts. Moreover, 17 of Florida’s 67 districts had fewer than five students in the entire district using open enrollment (15 had no students in the program and 2 districts had one student each). I therefore create a second measure based on whether students are in one of these 17 “no open enrollment” districts.
The second form of public school choice that I study is access to charter schools. The Florida DOE Master School Identification Data file identifies which schools are charters, so I geocode access to charter schools in much the same way that access to private schools is geocoded. I create three main measures of access to charter schools: whether students attended public schools with a charter option within a five-mile radius, the number of charter schools within five miles of a student’s public school, and the ratio of charter to private schools within a five-mile radius. The last measure gives a rough sense of how readily accessible public alternatives are in relation to private options. It also controls for the density of the population within five miles. For instance, if there are relatively few charter schools within five miles, it could be because there is little taste for public alternatives in that radius or because there are not enough people in that radius to support many other schools. Comparing the ratio of charter with private schools allows me to distinguish areas of low density from those with enough density to support alternatives, that simply lack charters.
Scales
To reduce the dimensionality of the data, I created scales for each of seven broad domains: academic performance of own school, own-school staffing characteristics, own-school disciplinary incident rates, principal reports of own-school climate, teacher reports of own-school climate, private school competition, and public school competition. The latter six scales were composed based on the items listed under their respective headings in Tables 2 and 3. For instance, the school staffing scale was composed by transforming each school’s score on the each of the three measures in that domain—share of teachers with advanced degrees, average years of teacher experience, and average student–teacher ratio—into z-scores. The z-scores of the component measures were then averaged, and the resulting scale was standardized to have a mean of 0 and a standard deviation of one. Where appropriate, as for student–teacher ratios, z-scores were reverse-coded so that a higher z-score represented a “better” score. Since school grades (aside from “A”s or “F”s) lack a clear directionality, the school performance scale was measured by taking the mean of the school’s average standardized score on the 2007–2008 FCAT reading and math tests. School grades were included as separate controls. Because some schools lacked data on various domains (particularly the teacher report domain), missing dummy variables were included to ensure that all observations were analyzed.
Results
Individual characteristics of participants and nonparticipants are presented in Table 1. Participants are more likely than nonparticipants to be Black (and less likely to be White or Hispanic) and are more likely to be using free (rather than reduced-price) lunch. Participants are also lower achieving compared with their nonparticipating peers.
Individual Characteristics of Sample Students: By Participation

Note. Standard deviations are in parentheses. Data from FTC program applications and Florida Education Data Warehouse. Sample includes nonexceptional students enrolled in free or reduced-price lunch observed in Florida public elementary schools in 2007–2008. Sample sizes for scores: n ~ 242,150 for nonparticipants, n = 931 for participants. Individual scores are expressed in standard deviation terms relative to all same-grade peers (including nonsubsidized lunch users) in Florida in 2007–2008. Race categories are mutually exclusive. FCAT = Florida Comprehensive Assessment Test; FTC = Florida Tax Credit.
p < .10. *p < .05. **p < .01. ***p < .001.
Characteristics of Students’ Own Public Schools
Table 2 presents differences between groups in terms of characteristics of their own public schools, along a variety of dimensions. While many of the differences are easily interpretable in their native metric, I also convert differences on each measure into standardized effect sizes by dividing the differences between the two groups by the pooled standard deviation of the measure; these are reported in column 3. On average, participants hail from schools with larger shares of students using subsidized lunch (Table 2). Lower proportions of students in participants’ schools were White or Hispanic, and higher shares were Black, than in nonparticipants’ schools. These results are consistent with past literature comparing voucher users and comparable public school students.
Characteristics of Own Public School Attended in 2007–2008: By Participation

Note. Standard deviations below group means are in parentheses. Effect sizes below indicators for significant differences in group differences column (difference divided by pooled standard deviation). Data from FTC program applications and Florida School Indicator Reports. Sample includes nonexceptional students enrolled in free or reduced-price lunch observed in Florida public elementary schools in 2007–2008. ES = effect size; DOE = Department of Education; FCAT = Florida Comprehensive Assessment Test; FTC = Florida Tax Credit; A+ = A+ Accountability Plan.
p < .10. *p < .05. **p < .01. ***p < .001.
Students who participate in the program are significantly more likely to come from low-performing schools (Table 2). Participants were significantly less likely to attend schools that received grades of “A” from the DOE in 2006–2007, and were significantly more likely to attend schools that had received a grade of “C,” “D,” or “F.” Given these results, it is unsurprising that participants’ schools had significantly lower average math and reading standardized test scores.
While the share of teachers with advanced degrees was marginally lower in participants’ schools, other differences in staffing characteristics, including average teacher experience and student–teacher ratios, were not significant.
The results under the school incidents heading in Table 2 indicate that schools attended by participants were, on average, more troubled than schools attended by nonparticipants. Participants’ schools reported significantly higher rates of violent incidents and other nonviolent incidents than did nonparticipants’ schools; differences between participants’ and nonparticipants’ schools on the rate of drug, alcohol, and tobacco incidents and on the rate of bullying incidents were not significant. Participants also attended schools with significantly higher rates of out-of-school suspensions. There was no statistically significant difference between the groups on the rates of in-school suspensions.
Likewise, participants’ schools were assessed somewhat more pessimistically by their principals than were nonparticipants’ schools. While the trends were consistently in favor of nonparticipants’ schools, however, only two comparisons were significantly different between the two groups. Participants were significantly more likely to come from schools where principals reported that student disruptions interfered with learning and significantly less likely to come from schools where principals rated new teachers in their school as “excellent.” There was no significant difference in the extent to which they reported low staff morale, rated their more experienced teachers as excellent, reported parent concerns of violence, or reported parents monitoring academic progress of students.
Teachers in participants’ schools were also less sanguine than in nonparticipants’ schools. Teachers in participants’ schools reported spending a significantly higher share of time on discipline, and they were more likely than in nonparticipants’ schools to report spending less time with the lowest performers due to pressure from Florida’s A+ accountability program. Teachers in participants’ schools were also significantly more likely to agree that teachers in their school had low expectations for students generally. There was no significant difference in the likelihood of focusing on the FCAT at the expense of other skills, the likelihood of ignoring strong students due to FCAT pressures, reports of parental monitoring of instruction, or the likelihood that teachers reported parents helping with homework.
This set of results suggests that the students’ own public school characteristics are related to voucher program participation. In addition to establishing that these factors are significantly associated with program participation, it is also important to consider the magnitude of the effect size differences between groups in Table 2. These effect sizes are generally small to moderate, representing differences of roughly 0.10 to 0.30 standard deviation across a variety of measures. This suggests that while the differences between participants’ and nonparticipants’ schools are not tremendous, they are still meaningful, and consistently in a direction that does suggest that students who use the program come from less advantaged schools on average.
These forces may be expected to “push” students toward application. However, the decision of whether to leave one’s public school likely depends not just on the qualities of the public school itself but also the availability of other alternatives. In particular, in deciding whether to participate in a voucher program, students are likely to consider both the availability of acceptable private school options and whether they can meet their needs by exercising choice among different public schools. I consider each of these factors in turn.
School Choice Markets: Private Schools
Private school markets may induce or discourage participation in the program in several ways. Specifically, students who face a more competitive private school market—with private options nearby, a variety of types of schools to choose from, and better-reputed private schools—may be more likely to apply to the program.
Participants face more competitive private school markets than do nonparticipants on a number of measures (Table 3, Panel A). Public schools attended by participants are located nearly a mile closer to their nearest private competitor compared to nonparticipants’ schools. A greater proportion of participants have competitors within a five-mile radius of their public schools, and participants also see a greater average number of competitors within five miles. Furthermore, participants faced more diverse private school markets; on average, participants had access to significantly more types of private schools within five miles of their public schools. The latter three measures were robust to the use of a two-mile radius. These analyses indicate that participants face more competitive private school markets from the perspective of available competitors, and of the likelihood of finding a school that matches the family’s religious tastes.
Private and Public School Markets Faced by Students’ Public Schools: By Participation

Note. Standard deviations are in parentheses. t tests conducted using robust standard errors clustered at the school level. Sample includes nonexceptional students enrolled in free or reduced-price lunch observed in Florida public elementary schools in 2007–2008. Author’s calculations using Florida Private School Directory, 2008–2009 Controlled Open Enrollment report data, and Florida Master School Identification Data merged with application data. Competitors include private schools that serve elementary grades and accept the Florida Tax Credit Scholarship.
p < .10. *p < .05. **p < .01. ***p < .001.
School Choice Markets: Public Schools
Obviously, private schools are not the only option for students who are disgruntled in their current public school. Students may prefer to exercise school choice within the public school system, either through attending a charter school or by pursuing open enrollment options. These may be especially attractive because they potentially pose fewer costs than a private school. While the FTC scholarship covers approximately 90% of the tuition of an average religious elementary school in Florida, even a relatively small amount of remaining tuition may pose a hardship to the low-income families targeted by the program. Moreover, there are application costs associated with the FTC program, and students may incur additional costs for books, transportation, and uniforms. By contrast, enrolling in charter schools, or in nonzoned public schools through open enrollment programs, does not impose tuition costs on students, although they may have to pay some portion of transportation costs (Florida DOE, 2008). Some parents may also prefer to remain in the public school system rather than sending their children to private schools, for instance, if their only options are religious schools and they prefer secular schooling. I look both at students’ access to open enrollment programs and to charter options to assess whether the degree of public school choice is associated with students’ use of vouchers.
In Table 3, Panel B indicates that participants have poorer access to public school choice than do nonparticipants. They are less likely to be in high open enrollment districts; only 46% of participants versus 52% of nonparticipants were in districts in which more than 5% of the public school student body participated in the controlled open enrollment plan. The differences were even more marked when the measure of open enrollment is whether students are in districts with effectively no participation in controlled open enrollment. While about 34% of participants came from such districts, the share of nonparticipants who came from “no open enrollment” districts was about half that figure. This suggests that students with more limited access to public choice options are more likely to participate in voucher programs.
Charter access differed less between participants and nonparticipants on most measures. While participants were somewhat less likely to have access to any charter within five miles, and had access to a marginally smaller number of charter options within five miles compared with nonparticipants, these differences were nonsignificant. However, there are significantly fewer charters per private school within a five-mile radius of participants’ schools compared with nonparticipants’. This suggests that more limited access to public school choice options relative to private school options is associated with participation in the program.
Relationships Between Variables
The results so far suggest that the contexts of students’ own public schools, their private school options and their public school options are all related to participation in the voucher program. However, several logical follow-on questions remain, including whether these factors contribute independently to program participation, whether the relationships between student contexts and voucher program participation are modified by other contextual factors, and what role school and student demographics play. I address each of these questions in turn.
Relative Importance of Different Contexts
Many of the contextual factors that I explore are correlated with each other; for instance, schools with poorer academic performance tend to have more disciplinary incidents and to be located in areas with greater private school competition. One may therefore be concerned that while factors like private school competition may be associated with program participation, that relationship may actually be driven by the correlation of both variables with lower quality public schools. I therefore ran a full linear probability model to examine the extent to which voucher use was independently associated with the various contextual characteristics, controlling for all other factors. Coefficients are multiplied by 100. Note that because the scales are standardized, the coefficients can therefore be interpreted as the expected increase of the likelihood of program participation, in percentage point terms, associated with a one-standard-deviation increase on the school-context scale in question. As a point of reference, recall that overall participation in the program among elementary-aged children in the time frame studied amounted to roughly 2% of the income-eligible, nondisabled elementary-age population in public schools, and that approximately 0.5% of public elementary students were observed to actually switch into the program between 2007–2008 and 2008–2009.
The results (Table 4) are intuitive given the descriptive results. Each of the domains is independently associated with voucher use in the expected directions in a bivariate specification (column 1), and, with the exception of school staffing, remain significant even when individual controls are added (column 2). Moreover, the domains most consistently associated with uptake in the descriptive results—school performance, disciplinary climate, private competition, and public competition—all remain useful independent predictors of voucher uptake when all scales are included simultaneously, along with a full set of individual controls and controls for DOE school grades (column 3). Students who attend schools that produce higher mean scores on the FCAT and who live in areas that offer more robust public competition are less likely to use the FTC voucher program, while students in schools with more disciplinary incidents and with more robust private competition are more likely to use the program. However, once the other factors are controlled for, school staffing patterns, principal reports of school climate, and teacher reports of school climate are not independently predictive of who will use the voucher program.
Linear Probability Models: FTC Scholarship Use Predicted by Domains of Own-School, Private School Market, and Public School Market Characteristics
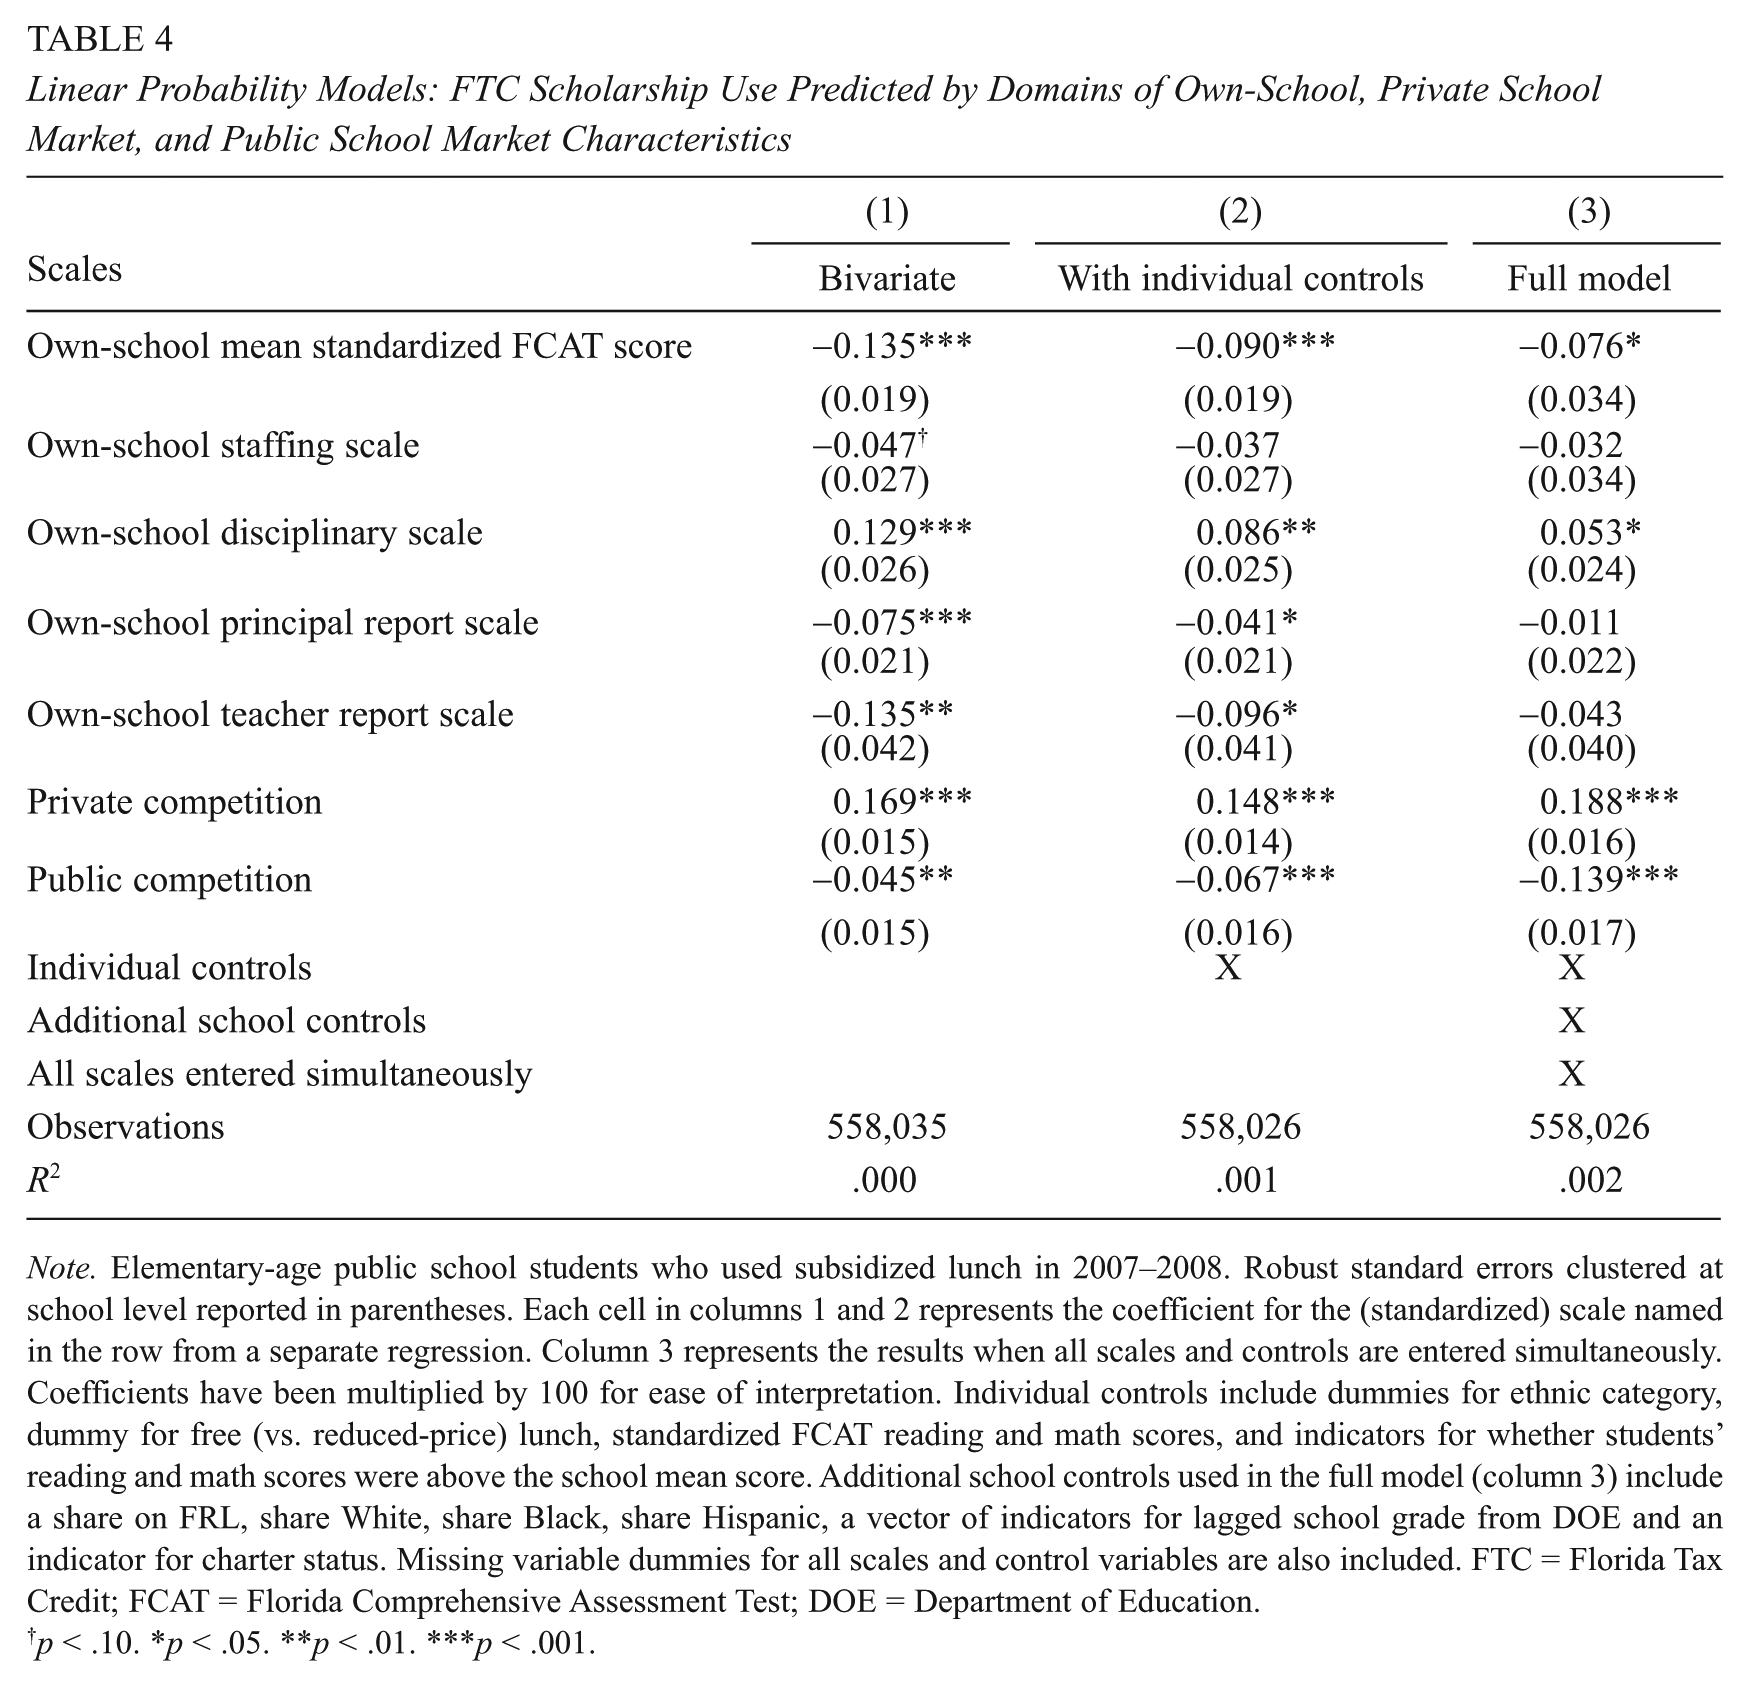
Note. Elementary-age public school students who used subsidized lunch in 2007–2008. Robust standard errors clustered at school level reported in parentheses. Each cell in columns 1 and 2 represents the coefficient for the (standardized) scale named in the row from a separate regression. Column 3 represents the results when all scales and controls are entered simultaneously. Coefficients have been multiplied by 100 for ease of interpretation. Individual controls include dummies for ethnic category, dummy for free (vs. reduced-price) lunch, standardized FCAT reading and math scores, and indicators for whether students’ reading and math scores were above the school mean score. Additional school controls used in the full model (column 3) include a share on FRL, share White, share Black, share Hispanic, a vector of indicators for lagged school grade from DOE and an indicator for charter status. Missing variable dummies for all scales and control variables are also included. FTC = Florida Tax Credit; FCAT = Florida Comprehensive Assessment Test; DOE = Department of Education.
p < .10. *p < .05. **p < .01. ***p < .001.
The coefficients are precisely measured but relatively modest in magnitude. For instance, a one-standard deviation in the private competition scale only increases the likelihood of program participation by .188 percentage points. This is a nonnegligible association given the low mean likelihood of switching from the public to the private sector in the full sample; nonetheless, it is still notable that the model’s overall explanatory power is relatively low.
Interaction Between Contexts
While own-school measures, public school competition measures, and private school market measures are all independently related to the likelihood of voucher program participation, one might imagine that interactions between the contexts could exist. For instance, perhaps being enrolled in a low-scoring school is a particularly strong inducement to apply to the program where private school competition is rampant (or where public school alternatives are sparse).
To check this possibility, I modified the regression in Table 4 to examine interaction effects with three market contexts: whether students were located in “high private school competition” areas, whether there was at least one charter within five miles, and whether they were enrolled in “no open enrollment” districts. Each interaction effect was examined in a separate regression. Schools are coded as having “high private school competition” if they had an above-median score on the private market scale constructed in the previous section. Each of these indicators was interacted with each of the domain scales created in the previous section (own-school scores, staffing, disciplinary rates, principal ratings, and teacher ratings; private school markets; and public school markets). The private school market main effect and interaction term were omitted when the “high private school competition” stratifier was used; the public school market main effect and interaction term were omitted when the charter and open enrollment availability indicators were used. Regressions included the full set of individual and school controls from the fully saturated models in Table 4. Coefficients are again multiplied by 100.
The results (Table 5) suggest that there are interactive effects of competition as defined by private school competition or access to open enrollment. However, there is little evidence that access to a charter alternative within five miles modifies the main effects (column 2). Column 1 gives the results for the interaction with private school competition. The results suggest that the negative relationship between school average FCAT scores and program participation is marginally more exaggerated when students are in high private competition areas. Moreover, the positive relationship between a school’s score on the disciplinary incident scale and program participation seems to be driven by schools with access to a greater number of private competitors. This suggests that access to private alternatives may make students more likely to “shop around” when their own public schools are low-performing or disruptive. In addition, there is a negative interaction between being in a high private competition zone and the public competition scale, suggesting that having more robust public competition blunts the “effect” of being in an area with more extensive private competition. Similar inferences can be drawn from column 3. Specifically, the positive coefficient on the Disciplinary Scale × Competition interaction suggests that attending a school with greater disciplinary difficulties, or attending a school with a greater degree of private competition, is more strongly associated with program participation where open enrollment options are limited.
Interaction Between Contexts: Linear Probability Models Predicting FTC Scholarship Use
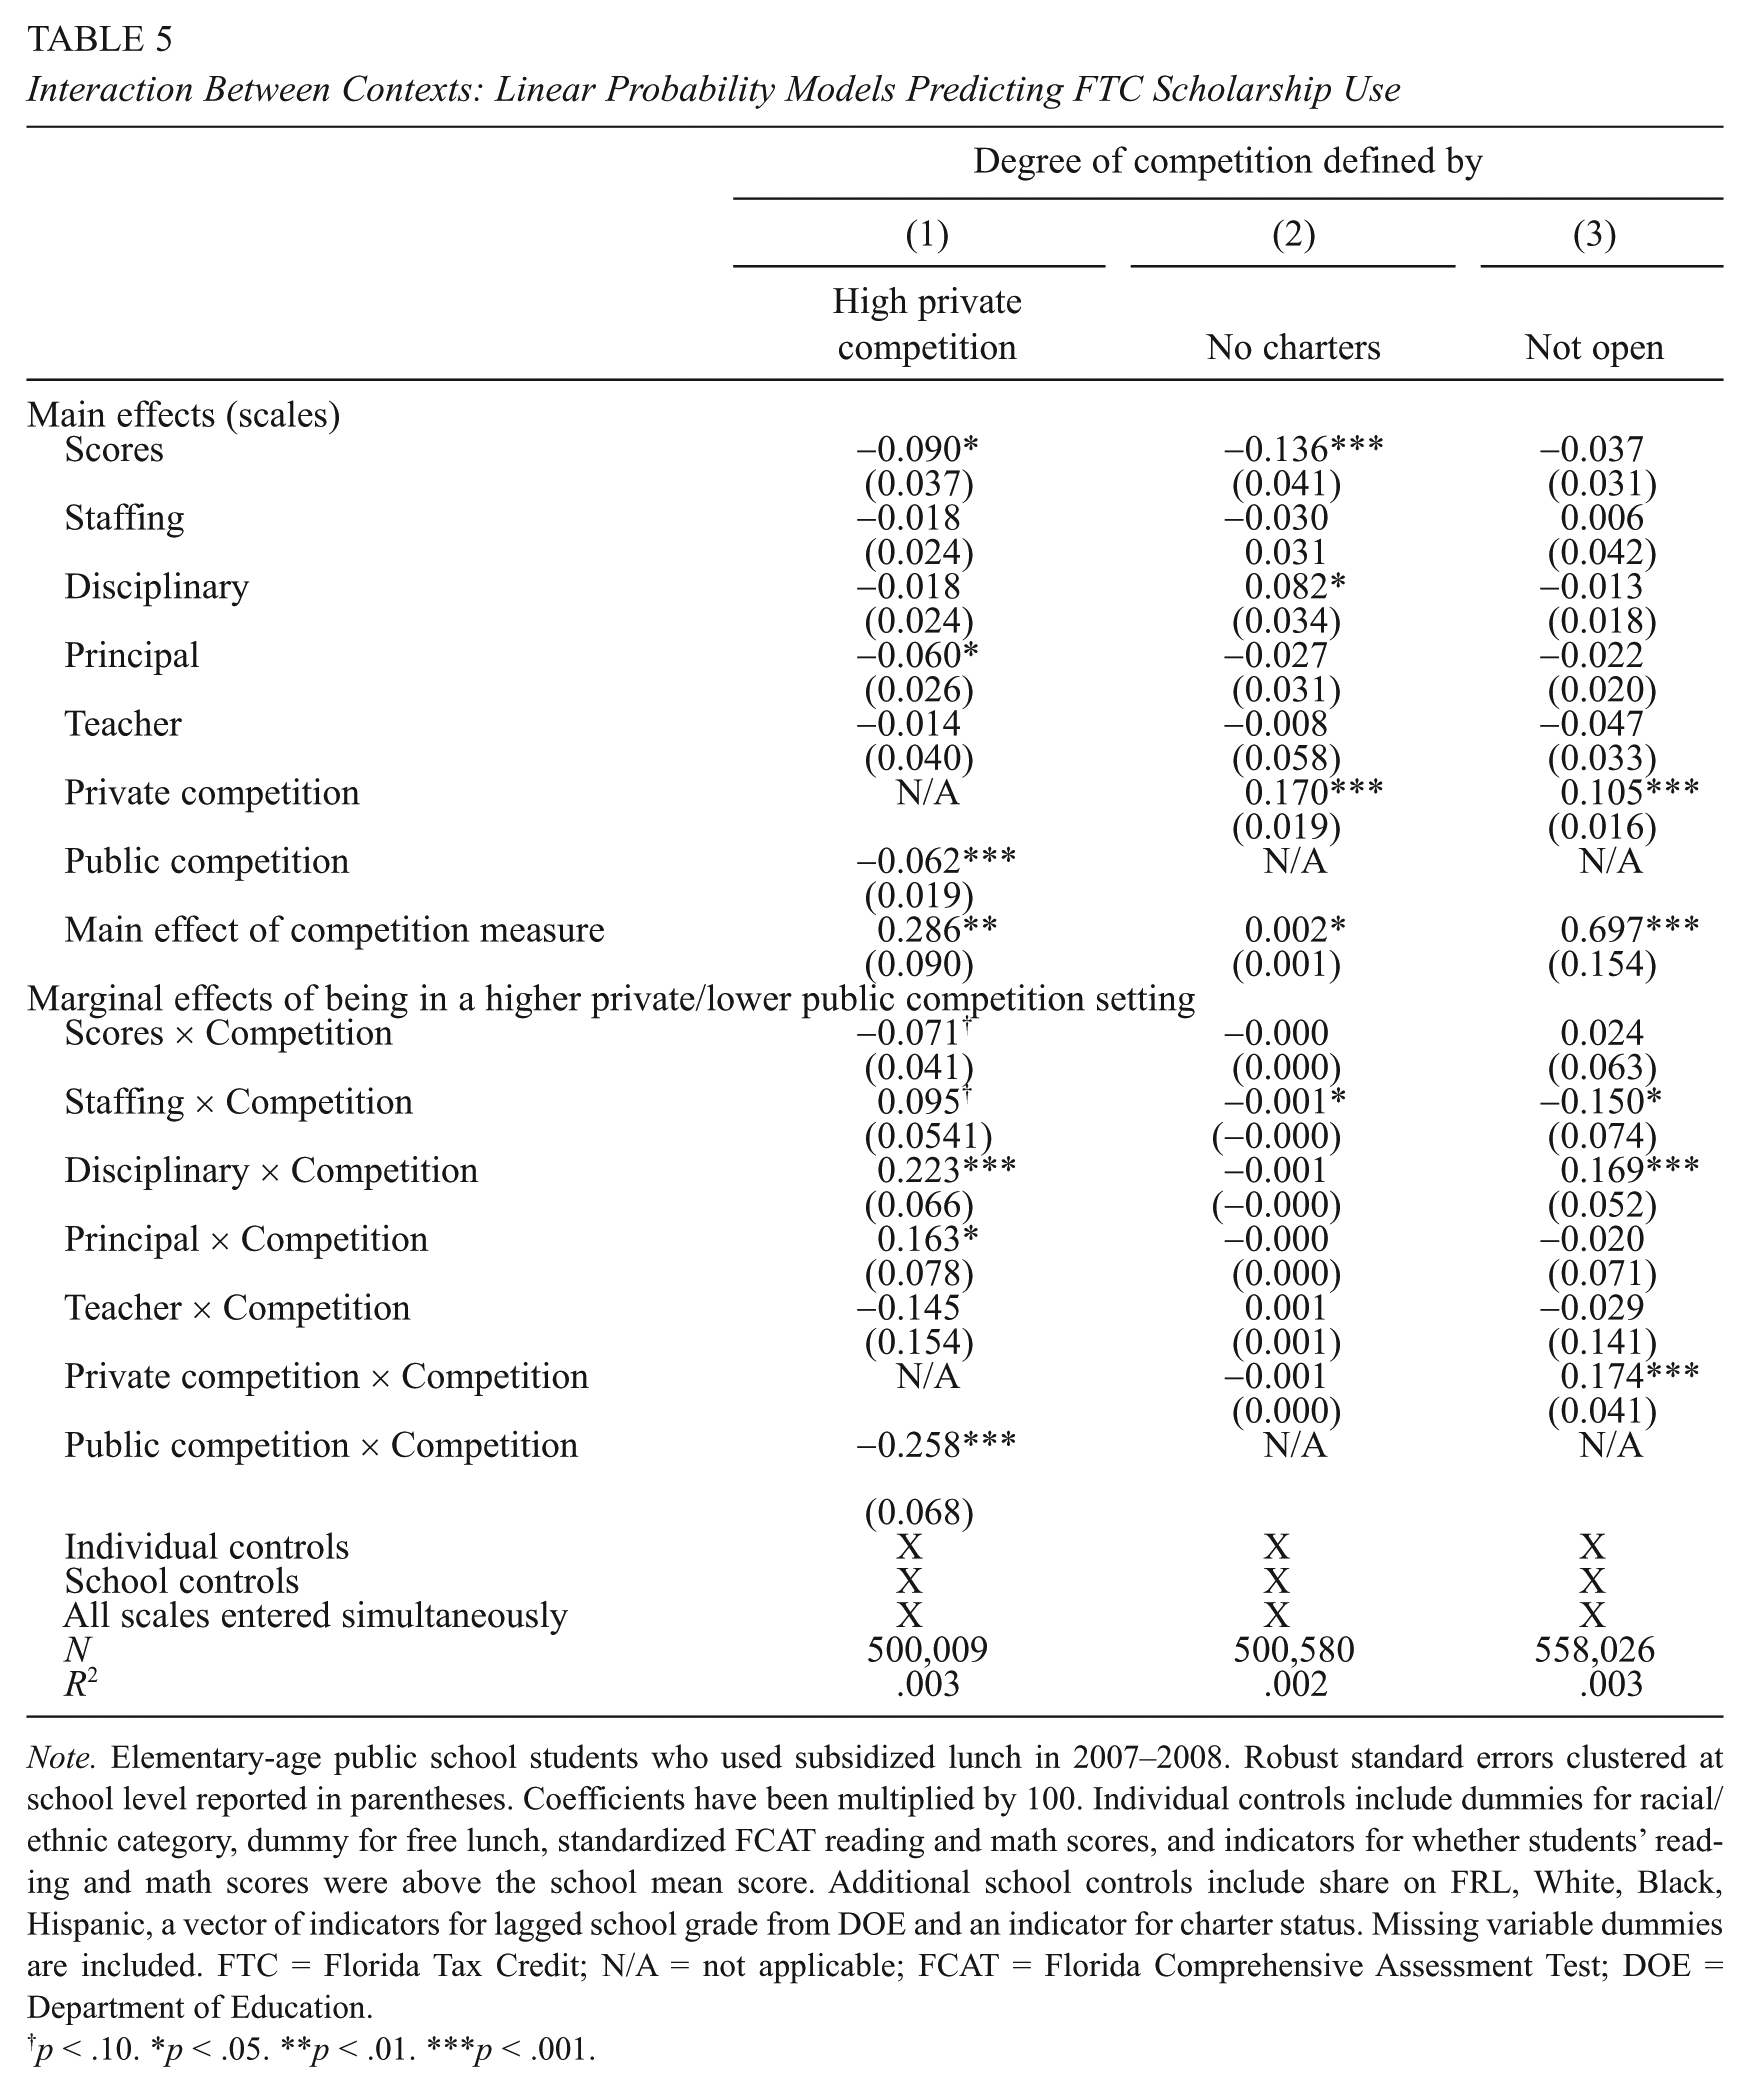
Note. Elementary-age public school students who used subsidized lunch in 2007–2008. Robust standard errors clustered at school level reported in parentheses. Coefficients have been multiplied by 100. Individual controls include dummies for racial/ethnic category, dummy for free lunch, standardized FCAT reading and math scores, and indicators for whether students’ reading and math scores were above the school mean score. Additional school controls include share on FRL, White, Black, Hispanic, a vector of indicators for lagged school grade from DOE and an indicator for charter status. Missing variable dummies are included. FTC = Florida Tax Credit; N/A = not applicable; FCAT = Florida Comprehensive Assessment Test; DOE = Department of Education.
p < .10. *p < .05. **p < .01. ***p < .001.
Demographic Composition
Two aspects of the relationship between the demographic composition of the schoolchildren attend and their propensity to participate in the voucher program deserve further consideration. First, it is possible that there may be nonlinear relationships between demographic composition and program participation. Second, it is possible that the demographic composition of a school is differentially salient based on the child’s own demographic characteristics. I take up both of these questions in this section.
To determine whether there were nonlinearities in the relationship between the demographic composition variables and program participation I divided schools into quartiles on each demographic composition measure included as controls in Table 4 (percent free or reduced-price lunch (FRL), percent White, percent Black, percent Hispanic). The second quartile is the excluded category. For the FRL specification, the share of student body categorized as White, Black, and Hispanic are included as controls; for each racial composition specification, percent FRL is included as a control. The location of each of the “joints” that separate the quartiles are given at the bottom of the table. All other controls included in Table 5 are also included here.
Results are presented in Table 6. The results suggest that once other factors are controlled, participation is significantly less likely for schools in the highest two quartiles of FRL concentration (percent FRL > 66.7%) compared with school in the lower half of the distribution (column 1). Program use is most likely in schools in the lowest quartile of White student concentration (percent White < 7.1%; column 2). With respect to the concentration of Black students, participation is significantly more likely for students attending schools in the top quartile (percent Black > 42%) compared with all other quartiles. Consistent with the results presented in Table 2, the likelihood of participation is higher when students attend schools in the lowest quartile of Hispanic student concentration (percent Hispanic < 8.3%) compared with the other quartiles; participation is also significantly more likely when students are in the second quartile compared to the third. While the results for White, Black and Hispanic student concentrations are unsurprising given the results presented in Table 2, the negative relationship between higher FRL student concentrations and program participation suggests that the positive bivariate association may be driven by other factors such as school quality associated (in opposite directions) with FRL concentration and program participation.
Linear Probability Models: FTC Scholarship Use Predicted by Domains of Own-School, Private School Market, and Public School Market Characteristics
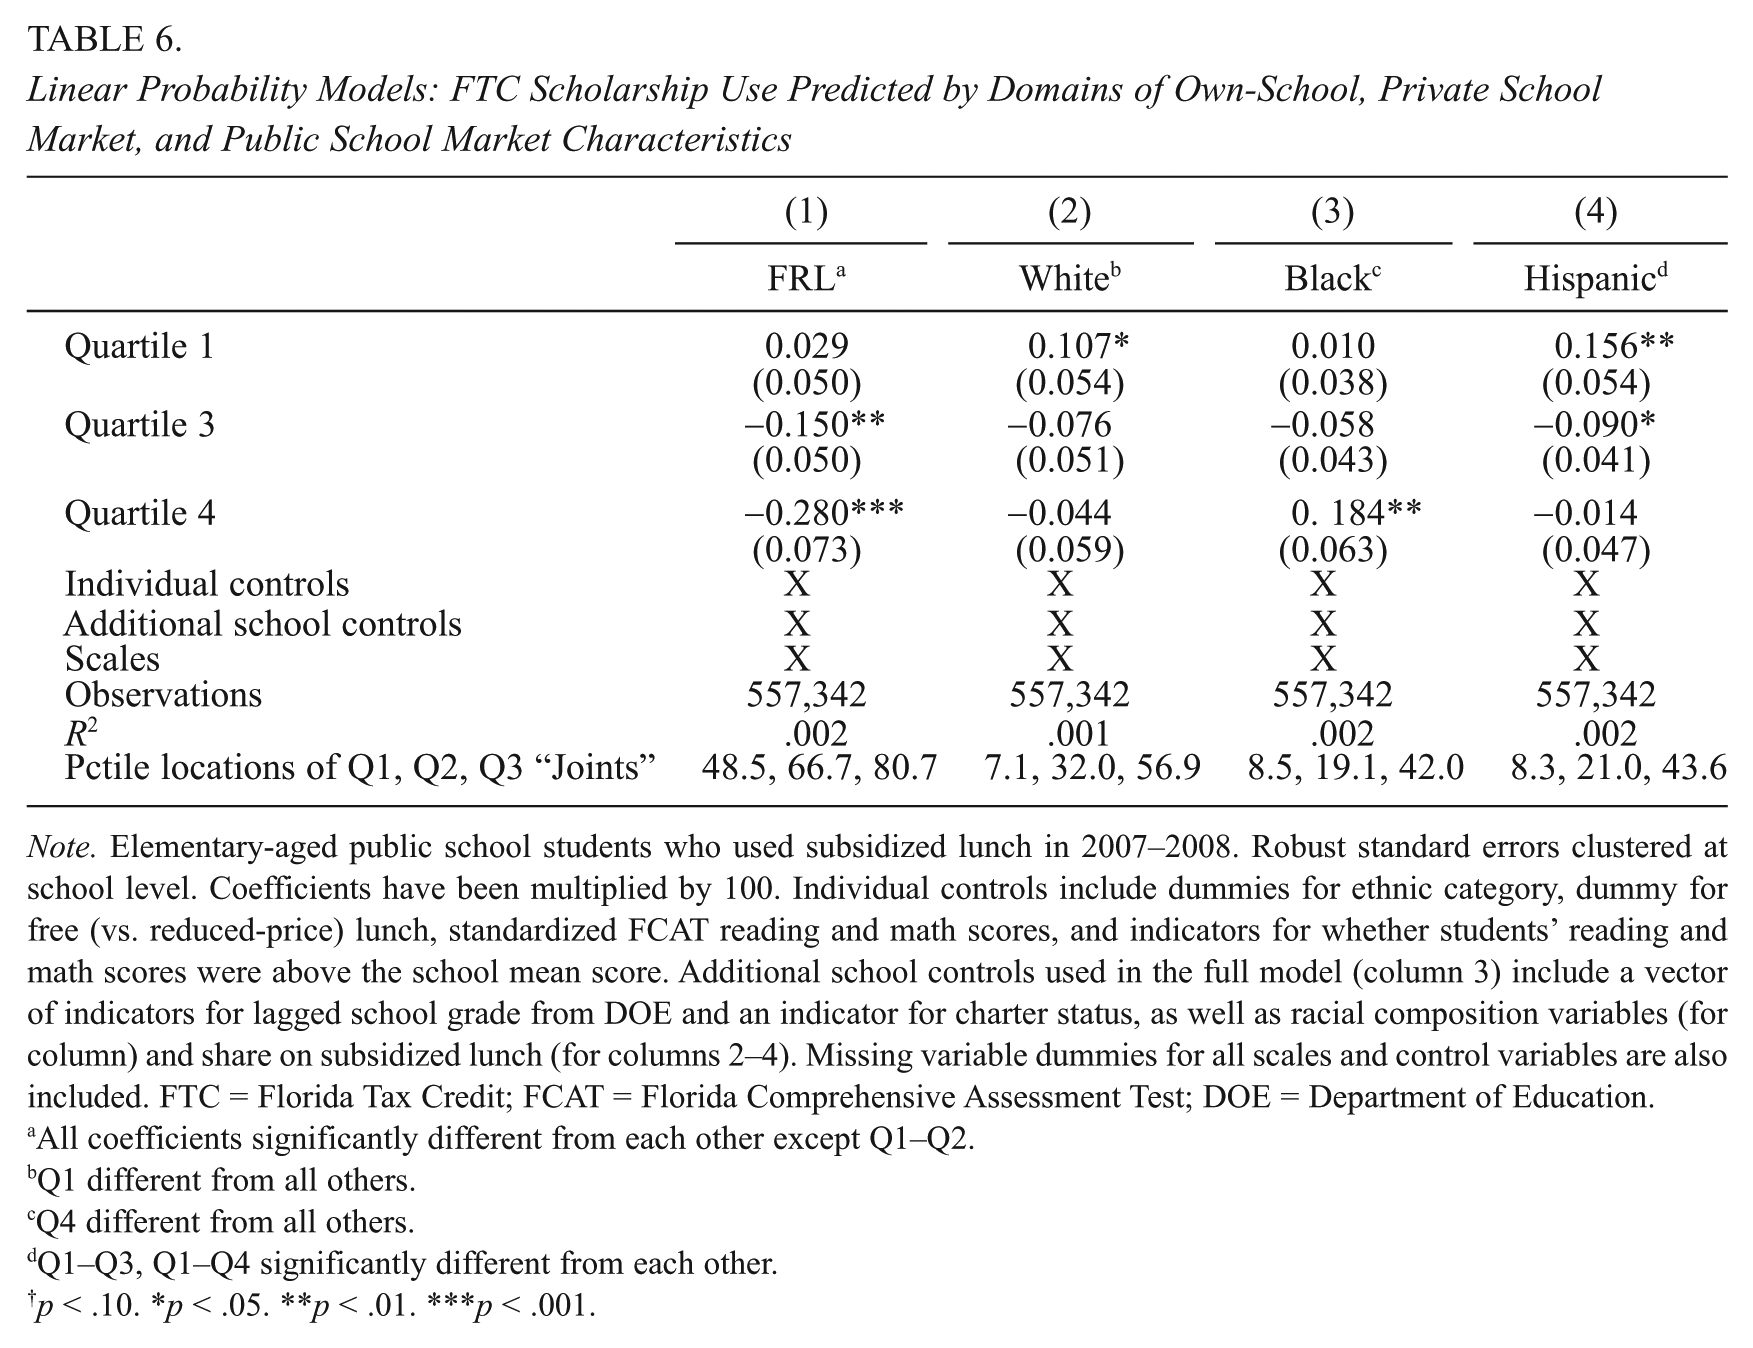
Note. Elementary-aged public school students who used subsidized lunch in 2007–2008. Robust standard errors clustered at school level. Coefficients have been multiplied by 100. Individual controls include dummies for ethnic category, dummy for free (vs. reduced-price) lunch, standardized FCAT reading and math scores, and indicators for whether students’ reading and math scores were above the school mean score. Additional school controls used in the full model (column 3) include a vector of indicators for lagged school grade from DOE and an indicator for charter status, as well as racial composition variables (for column) and share on subsidized lunch (for columns 2–4). Missing variable dummies for all scales and control variables are also included. FTC = Florida Tax Credit; FCAT = Florida Comprehensive Assessment Test; DOE = Department of Education.
All coefficients significantly different from each other except Q1–Q2.
Q1 different from all others.
Q4 different from all others.
Q1–Q3, Q1–Q4 significantly different from each other.
p < .10. *p < .05. **p < .01. ***p < .001.
I further examine whether these nonlinear relationships matter differentially based on students’ own demographic characteristics. Specifically, I explore whether the race/ethnicity composition variables matter differently based on students’ race and whether the income composition variable matters differently based on whether eligible students are on free versus reduced-price lunch. Here, unlike in the past regressions, the main question of interest is not only about a school contextual variable that is invariant among all students in the school, but about the way that a school contextual matter varies for different types of students within the school. Since there is variation within schools on the student characteristics I examine, I can use school fixed effects and Quartile × Student characteristic interactions to identify whether, for example, being in a school that is among the lowest quartile in terms of Hispanic student concentration matters differently for Hispanic students, comparing students to their classmates in the same school.
Somewhat surprisingly, there is little evidence of interactions between a student’s own demographic characteristics and the demographic characteristics of their school. Among racial groups, the only interactive effect is a negative coefficient on Hispanic × Q4 Black. Thus, unlike other groups, Hispanics in highly Black schools are no more leave those schools to use vouchers than are their Hispanic peers in schools with relatively modest concentrations of Black students. I conduct a similar analysis using an interaction term between a Reduced indicator and the quartile bins for the share of students on subsidized lunch and find no significant interactions.
Robustness Checks
There are two clear concerns that arise from restricting the sample to currently enrolled elementary school students. The first is that children who switch into the program after first attending public schools may be very different than students who enter the program in Kindergarten and never actually attend public schools, which is a popular route into the program. Perhaps children are most likely to enter directly into the program instead of their public kindergarten if their zoned public schools are particularly bad. In that case, I might be underestimating the extent to which participants are able to use the program to avoid “bad” schools. Alternatively, perhaps there are families with a taste for qualities that only private schools can provide—such as religious education. Because these families are insensitive to the characteristics of the public schools, excluding these families may overestimate the extent to which the program diverts students from facing poor public schools.
To address these concerns, I reestimated the results presented in Table 4 (excluding individual characteristics that were not available for students not previously observed in public schools) using imputed schools for those who were not observed in public schools in the prior year. I imputed school attendance by geocoding applicant home addresses and public school latitudes and longitudes using ArcGIS. I assigned children who did not attend a public school in 2007–2008 to the nearest public school that served their grade, excluding some irregular types of schools (e.g., vocational schools, technical schools, and schools serving delinquent or homebound students). The relationships between participation status and contextual school characteristics (not shown) are strikingly similar to the results for would-be switchers.
A second concern is that including fifth graders may downward bias results. Since most fifth graders move to a middle school in sixth grade, they may make application decisions with an eye to the quality of their prospective middle school rather than their current elementary school. I therefore ran the main analyses excluding fifth graders. The pattern of results was essentially unchanged when fifth graders were excluded. In general, results become somewhat stronger in these specifications, suggesting that the main results presented here are conservative.
In addition, one might be concerned that the large sample sizes may make small differences excessively easy to detect. An alternative way to consider these comparisons is to use the share of students in a school who leave the school using a scholarship as the dependent variable, and contextual characteristics as the independent variables. This lowers the sample size to somewhat less than 2,000 schools. Again, the main pattern of results holds, although the coefficient on the disciplinary rate index drops to marginal significance in this specification.
Discussion
I find that participants in the FTC Scholarship Program disproportionately come from lower quality public schools than do eligible nonparticipants. Participants are more likely to be in schools that have poor academic performance, and in schools that have greater reported rates of disruption from violent and nonviolent incidents. These administrative reports dovetail with reports from principals and teachers, who also rate the schools that participants come from as more disruptive and less positive along several other dimensions; however, principal and teacher reports are not independently associated with participation once school average academic performance and disciplinary incidents are controlled for.
Public and private school markets are also associated with participation. Relative to nonparticipants, participants disproportionately attended school in markets with more convenient and diverse private school options and with more limited access to open enrollment and charter options; these factors remained independently predictive of voucher use when all factors were considered together. One read on the public school market results is that they emphasize the importance of “push” factors. If one concern of voucher opponents is that parents will use vouchers specifically to seek out religious education that voucher opponents are uninterested in funding, the fact that voucher participation is sensitive to the availability of other options suggests that this is not the only motivating factor at work. Instead, it suggests that there may be some population of potential participants who are looking for alternatives to their zoned school broadly defined, and that they will accept alternatives in the public realm.
Finally, I find evidence that demographic composition of sending schools is independently associated with program participation. In particular, controlling for other elements of school quality, students are most likely to use vouchers if they come from a school in the top quartile of concentration of Black students and in the lowest quartiles of concentration of White and Hispanic students; they are less likely to participate, controlling for school quality and racial make-up, if they come from schools with above-median poverty. There is little evidence that there are race-specific differences in these responses.
This article raises several important questions that future work should address. For instance, given that about a third of applicants observed in public schools do not take up a voucher when they are offered one, and students with better access to public choice options are more likely to decline vouchers, another question might be what happens to students after they apply to the program? Do students who decline vouchers end up in charter schools or using open enrollment programs? While such questions are beyond the scope of this paper, they present important avenues for future work in this area.
There are several limitations to this study. First, Florida presents a unique context; while there are rural areas in the state, the vast majority of the population lives near major urban areas. Thus, these results may not generalize to programs in other states. Second, I lack data on one individual characteristic that may substantially affect program participation: family religiosity. While my data suggests that contextual characteristics of school options play a role in families’ decisions to participate in the program, many interview-based studies have found that religiosity is also an important determinant of participation, and I cannot speak to its effect in this article. Third, the main analysis was conducted on a sample of children who attended public schools prior to program application. While the robustness checks indicate that participants who are not previously observed in public schools would likely be zoned to more disadvantaged schools than the average eligible nonparticipant, my method of matching students is imperfect. These analyses therefore may not fully accurately capture the public school options that these children face. While these results shed some light on contextual factors that such families are likely considering while applying to the program, they can speak more confidently to the association between contextual factors and program application for the group of potential switchers on which the main analysis was conducted. Finally, I employ use of subsidized lunch as a way to define the comparison group. However, while the FTC program requires verification of income to participate, the school lunch program does not. It is therefore possible that the voucher participant sample is more disadvantaged than their subsidized lunch-using, nonparticipant peers. Since I lack income data for nonparticipants, I cannot test this possibility.
Despite these limitations, this study makes an important contribution. By examining a richer set of public school quality and private school market measures, it provides a fuller picture of the contextual factors associated with student participation in the program. From a policy perspective, examining public school contexts is important because voucher programs are often justified as a way to help students exit underperforming, unsafe schools. Knowing that these programs do in fact attract applicants in poor schools is useful in gauging the success of the voucher policies in opening up choices to families in low-quality schools. Likewise, the results on the private school market front have implications for the characteristics that make program use attractive to students. Unsurprisingly, they suggest that students are most likely to make use of the program when private school options are convenient and varied; lack of convenient private school options may be a barrier to participation in some parts of the state. The public school market findings, while intuitively sensible, present perhaps the most novel contribution of this paper. They suggest that students with better access to public options are less likely to participate in voucher programs. While further research in this domain is warranted, this study considerably deepens the literature on the contextual factors associated with participation in means-tested school voucher programs.
Footnotes
Acknowledgements
I am grateful to the Florida Department of Education and Step Up for Students for access to the data used in this article. I appreciate helpful comments from David Figlio, Greg Duncan, Larry Hedges, Tom Cook, Doug Harris, Steve Raudenbush, Amy Ellen Schwartz, Joshua Goodman, David Mustard, and two anonymous reviewers, as well as participants at the annual meetings of the Association for Public Policy Analysis and Management, the Association for Education Finance and Policy, the American Education Research Association, and student participants in the Spencer Dissertation Fellowship Program. Thanks also to seminar participants at Brown University, Florida State University, Harvard University, Northwestern University, Southern Methodist University, the University of Arkansas, and the University of California, Davis. I am grateful to Sarah Cannon and Chieko Maene for research assistance.
Author’s Note
The opinions expressed are those of the author and do not represent views of the Institute or the U.S. Department of Education, or of any other entity mentioned here. All errors are my own.
Declaration of Conflicting Interests
The author declared no potential conflicts of interest with respect to the research, authorship, and/or publication of this article.
Funding
The author disclosed receipt of the following financial support for the research, authorship, and/or publication of this article: I would like to acknowledge generous financial support from a Spencer Foundation Dissertation Fellowship and from the Institute of Education Sciences, U.S. Department of Education, through Grant R305B080027 to Northwestern University.
Notes
Author
CASSANDRA M. D. HART is an assistant professor in the School of Education at the University of California, Davis. Her recent research has focused on evaluating the effects of school choice and accountability policies.