
Abstract
Measures of classroom and school environments are central to policy efforts that assess school and teacher quality. These measures are often formed by aggregating individual survey responses to form group-level measures, and assume an invariant measurement model holds across the individual and group levels. This article explores the tenability of this assumption by applying multilevel factor analysis to two well-known surveys: the Working Conditions Survey, which assesses school environments, and the Tripod Classroom Environment Survey. The examples illustrate the consequences of using common factor analytic methods that assume cross-level invariance, and demonstrate how distorted perceptions of factorial structure can influence inferences about the relationship between working conditions and teacher mobility.
Keywords
As school districts strive to create comprehensive programs to appraise teaching quality and teacher performance, measures of school and classroom environments have become increasingly important. Information about classroom and school environments is used in a variety of policy contexts and for a variety of purposes. First, it is used for teacher and school evaluation. Mihaly, McCaffrey, Staiger, and Lockwood (2013) described how such measures can be used to “support decisions for tenure, retention, and compensation” (p. 5). Memphis bases 5% of a teacher evaluation on student surveys. By the fall of 2013, 10% of teacher evaluation in Chicago public schools will be based on student surveys (Butrymowicz, 2012). In New York City, teacher and parent surveys about the school environment can account for up to 15% of a school’s score on its annual Progress Report (New York City School Survey, n.d.). Schools with low progress report scores risk being closed.
Second, information about school and classroom environments is often used to predict important outcomes, such as student achievement and teacher retention. A report from the Measuring Effective Teaching (MET) project showed that classroom environment data predict teacher’s value added (VAM) scores (Bill & Melinda Gates Foundation, 2010). Loeb, Darling-Hammond, and Luczak (2005) discussed how separating the effects of student demographic factors from the effects of working conditions is an important step in developing policy interventions to improve teacher retention. Better understanding how targeted improvements in working conditions may improve retention is particularly critical for schools serving high-poverty, low-achieving student populations, where teacher turnover rates may be as high as 50% (Ingersoll, 2001).
Data about school and classroom environments are often collected by administering surveys to teachers and students who function as “raters” of the environments in which they work and study. Individual ratings are aggregated to form group-level variables, and inferences are then made about group qualities (Bliese, 2000; Chan, 1998).
While the use of this type of aggregated group-level variable is intuitive and appealing, the validity of inferences based on these aggregated variables entails a complex and nuanced set of assumptions. Substantively, it is assumed that the aggregates refer to the same constructs as the individual responses. Statistically, it is assumed that there is cross-level invariance in the measurement model (e.g., Bliese, 2000); that is, there is invariance in the measurement structure across the individual (within-group) level and the between-group level.
Cross-level measurement invariance imposes strict constraints on the measurement model that may not be met in empirical data (Zyphur, Kaplan, & Christian, 2008). There is a long history of methodological research on this issue (e.g., Cronbach, 1976; Harnqvist, 1978; Longford & Muthén, 1992; Reise, Ventura, Nuechterlein, & Kim, 2005). In much of the applied education research and policy literature, however, cross-level invariance is assumed, rather than explored. This article aims to make two distinct contributions to the education policy literature: (a) provide two clear, policy-relevant illustrations of the importance of correctly modeling between-classroom and between-school variables, and (b) demonstrate how inferences about the impact of school working conditions on a teacher’s planned movement may differ depending on whether or how cross-level noninvariance is modeled. In doing so, this article expands on recent work (D’Haenens, Van Damme, & Onghena, 2010; Marsh et al., 2012; Marsh et al., 2009; Zyphur et al., 2008) that calls attention to the importance of finding empirical evidence to support the cross-level invariance assumption.
Theoretical Framework
Many surveys of school and classroom environments assume a specific measurement model. At the within-group level, there is assumed to be measurement error among the survey items, so that variance among the items is caused by unobserved (latent) differences among individual students or teachers.
At the between-group level, it is assumed that students or teachers are objective raters of the environments in which they study or work, and that variance between raters within the same classroom or school is attributable to sampling error and represents “noise.” However, averaging over individual raters, variance between schools represents actual variance in the quality of working conditions, or variance between classrooms represents true variance in the quality of classrooms.
Under these assumptions, it is appropriate to use a latent trait model where the group qualities themselves are conceived of as effects-indicated latent variables (Bollen & Lennox, 1991; Marsh et al., 2009). In an effects-indicated model, it is assumed that a latent variable causes variance in the indicators. In the case of school or classroom environment surveys, it is assumed that unobserved, latent aspects of the school or classroom environment cause variance between individual schools or classrooms. This is sometimes referred to as reflective aggregation (e.g., Marsh et al., 2009).
It is important to distinguish an effects-indicated model from another possible model, a so-called composite model where indicators are formed by making linear combinations of indicator variables (e.g., Bollen & Bauldry, 2011). An example of this sort of composite indicator would be socioeconomic status (SES). A set of indicators of SES can be used as a weighted combination to describe an individual student’s SES. It is not a claim that an individual student has a latent SES that causes variance among the indicators. Individual student SES indices can then be aggregated to form a school-level variable (e.g., Raudenbush & Bryk, 2002). Composite variables of this type implicitly impose cross-level measurement invariance, because there is only a single indicator for each individual (Marsh et al., 2009). Survey-based indicators of school and classroom environments are rarely conceived of as composite variables in this way, and so this type of model and this type of cross-level measurement invariance are not the focus of this article.
Statistical Background
In the reflective aggregation model typically underlying school and classroom environment surveys, the assumption that group means refer to the same constructs as individual responses implies a two-level measurement model with cross-level factorial invariance (Marsh et al., 2009). Specifically, the factor structure is assumed to be configurally and metrically invariant (Meredith, 1993)—meaning that at both levels the same number of factors are found, the same items load onto the same factors, and the strength of association between these items and the underlying factors is the same. The basic factor model (e.g., Bollen, 1989) can be expressed as

where
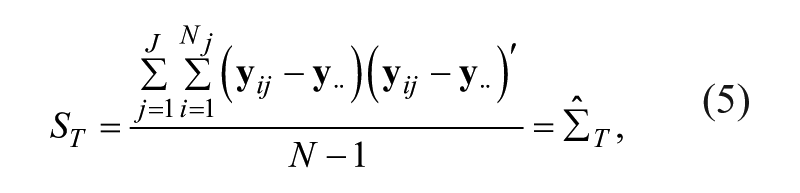
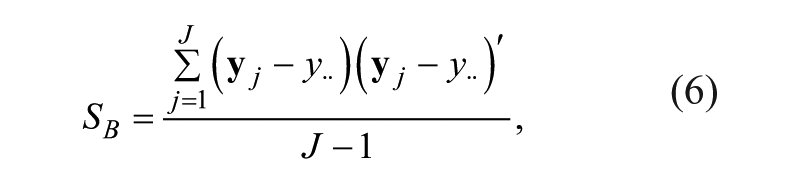
Factor analytic procedures based on this model assume that the observations are independent. When individuals are associated with groups (teachers with schools, students with classrooms), this independence assumption is likely to be violated. There are several models that account for the fact that observations are nested in groups (e.g., Lee, 1990; McDonald & Goldstein, 1989; Muthén, 1991, 1994; Rabe-Hesketh, Skrondal, & Zheng, 2007). Several of these formulations are based on a score decomposition model articulated by Cronbach and Webb (1975):

where y ij is a p-variate vector of observed scores for individual i in group j. yij can be decomposed into independent between-groups (yj) and within-groups (yij – yj ) components. Using this decomposition, a multilevel factor model can be expressed:

There are two random effects here—a between-group random effect uj and a within-group random effect ε
ij
. There are also two sets of factor loadings (
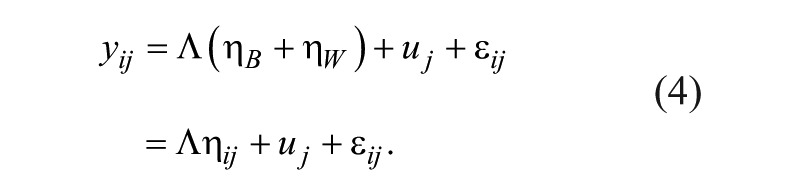
In this way, the latent trait of individual i in group j can be expressed as a sum of independent between- and within-latent components:
The Assumption of Cross-Level Invariancein Education Policy Literature
Methodological research on cross-level measurement invariance has a long tradition. Cronbach (1976) and Harnqvist (1978) showed that factorial structures could vary across levels. Cronbach (1976) cautioned that a researcher might need,
one set of factors for his between-groups theory and another set of factors for his within-groups theory. To be sure, he may find that the two sets of constructs coincide, but that is a possibility to be evaluated, not assumed. (p. 203)
Longford and Muthén (1992) stated that, “the focus of a substantive analysis may be on the within-group, the between-group factor structure, on the structure at both levels, or on the comparison of the factor structures” (p. 582). Longford and Muthén also noted that between-groups phenomenon may be completely unrelated to within-groups phenomenon. Other more recent methodologically focused work (e.g., Reise et al., 2005; Zyphur et al., 2008) has shown that even if the number of factors is the same across levels, item loadings may not be the same across levels, and items may load on different factors across levels of analysis.
There are far fewer examples in the applied education and education policy literature that explicitly investigate the assumption of cross-level measurement invariance (notable exceptions include D’Haenens et al., 2010; Holfve-Sabel & Gustafsson, 2005; Toland & De Ayala, 2005). As testament to the fact that this gap between theory and practice persists, Marsh et al. (2012) noted that, “despite the clear resolution of this methodological issue for more than a quarter of a century, it is still an area of ongoing confusion in the educational literature” (p. 111). D’Haenens et al. (2010) claimed that they were “unaware of any educational effectiveness studies applying [multilevel exploratory factor analysis]” (p. 212) to investigate potential differences in factorial structure across levels of analysis.
In fact, it is still far more common to find researchers using methods that assume cross-level invariance than it is to find researchers using modeling approaches that are appropriate for the data and research questions at hand. This is particularly true for the analysis of school and classroom environment variables that are constructed by aggregating survey responses. Two of these methods, (a) factor analysis on the disaggregated covariance matrix and (b) factor analysis on the unweighted group means are discussed in more detail in the following section, and several policy-relevant recent examples are provided.
Cross-Level Invariance Implied by Single-Level Factor Analyses
Single-level factor analyses that do not model the between- and within-factor structures of hierarchically structured data de facto impose invariance constraints on the factor structure (Zyphur et al., 2008). This is because when a single-level factor analysis is conducted, either on the disaggregated responses or on the group means, only one
Perhaps the most common single-level approach used in school climate research is the factor analysis of the total disaggregated covariance or disaggregated correlation matrix. Validation studies of the South Carolina School Climate survey (DiStefano et al., 2008), the Working Conditions Survey (WCS; Moir, 2009), and the student survey of the classroom environment included as part of Georgia’s Race to the Top grant application (Balch, 2012) all find validity evidence for inferences regarding aggregated school and classroom environment variables based on the results of exploratory factor analysis (EFA) conducted on the disaggregated covariance or correlation matrices. There are also many examples from the policy literature on school and classroom environments. Ladd (2011) examined the relationship between teacher working conditions and teacher retention with working conditions variables that were derived from an EFA on the disaggregated correlation matrix. Ryan and Patrick (2001) used a similar approach to investigate the relationship between classroom environment and student motivation and engagement. For situations where individuals are nested in groups, conducting factor analyses on this matrix conflates within and between sources of variance, can bias parameter estimates (Preacher, Zyphur, & Zhang, 2010), and can lead to substantively misleading inferences about relationships between indicators, or about relationships with external variables (Reise et al., 2005).
Another commonly used single-level approach is to conduct a single-level factor analysis on the covariance or correlation matrix of the unweighted group means. Hoy and Clover (1986) used this approach to develop a measure of elementary school climate. There are two issues with factor analyses based on this matrix. First, each group is given the same weight, regardless of the number of individuals in that group. Second, the elements of this matrix also reflect between- and within-variance sources (Muthén, 1994) and can lead to misleading inferences about relationships between indicators, or about relationships with external variables.
Implications for Assuming Cross-Level Invariance in Policy and Practice
One of the most pervasive uses of factor analysis in policy research is to justify the formation of linear composites. This practice is sometimes called rank reduction, and is described in many sources (e.g., Alwin, 1973; Bollen & Lennox, 1991; Cronbach, 1976). Note that the linear composite that results from rank reduction is distinct from a composite of the sort described in Bollen and Bauldry (2011) and referenced above. In the case of rank reduction, a linear composite is used as a proxy for a latent variable. It is still an underlying assumption that the composite has “conceptual unity” (Bollen & Bauldry, 2011, p. 4), and that variance in the indicators is caused by a common underlying latent variable.
In studies of school and classroom environments, the rank reduction process often takes one of two forms: (a) Unit-weighted linear composites are formed based on the results of a factor analysis, and these individual scores are then averaged together to form a school- or classroom-level variable (e.g., Balch, 2012; Ladd, 2011); and (b) factor scores are formed based on the factor analysis, and these factor scores are aggregated to the group level (e.g., DiStefano et al., 2008). In each of these examples, rank reduction is justified based on the results of factor analyses conducted on the disaggregated covariance or correlation matrix.
However, by assuming cross-level measurement invariance in this way, there is a strong possibility that the approach used in these studies could result in the formation of unsupported linear composites, and could result in obscured or spurious information about prediction and correlation among policy-relevant constructs.
For example, this approach could result in identifying the wrong number of factors, or in associating items with the wrong factors altogether. It may be, for example, that items in a survey of the classroom environment distinguish two within-class latent variables, such as student engagement and instructional rigor. But it is also conceivable that at the classroom level, classrooms that are engaging are also rigorous, and that classrooms vary in these two traits fairly equally (Muthén & Asparouhov, 2011). Thus, at the classroom level, there is only one broadly defined academic factor. Researchers and policy makers who assume cross-level invariance risk assuming they are working with two distinct dimensions of classroom quality, when in fact, they are not.
One gap in the literature is a clear illustration of how violations of the assumption of cross-level measurement invariance would influence policy conclusions. This changes the issue of invariance from one of methodological interest to one of policy importance. Although Marsh et al. (2009) called attention to the importance of testing the cross-level invariance assumption, the empirical example used throughout the article does not illustrate the consequences that may arise from assuming cross-level invariance. And, while Zyphur et al. (2008) presented a case where there is evidence for factorial noninvariance (different patterns of loadings), that study did not present any cases where the number of factors differs across levels, and it did not illustrate how differences in the number of factors across levels may influence policy-relevant considerations, such as the determination of relationships with external variables.
The purpose of the present study is (a) to illustrate cross-level measurement noninvariance using two empirical examples, and (b) to demonstrate the possible consequences that may arise for policy and practice when invariance is assumed. The first example comes from the WCS (Moir, 2009), which is a survey administered to measure aspects of school working conditions. The second comes from the Tripod Classroom Environment Survey (Ferguson, 2010), which is administered to measure aspects of classroom environment. These two surveys provide particularly salient examples for several reasons. First, both surveys are widely used to inform school policy decisions in the United States. Second, both surveys have an aggregated unit-of-analysis. For the WCS, the unit-of-analysis is the school; for the Tripod, the unit-of-analysis is the classroom. Finally, in both surveys, it is an explicit measurement claim that variance between raters (teachers or students, respectively) constitutes error variance, and that variance between schools or classrooms represents true variance in environmental qualities. Using these two surveys, the following research questions were addressed:
Method
Sample and Data Sources
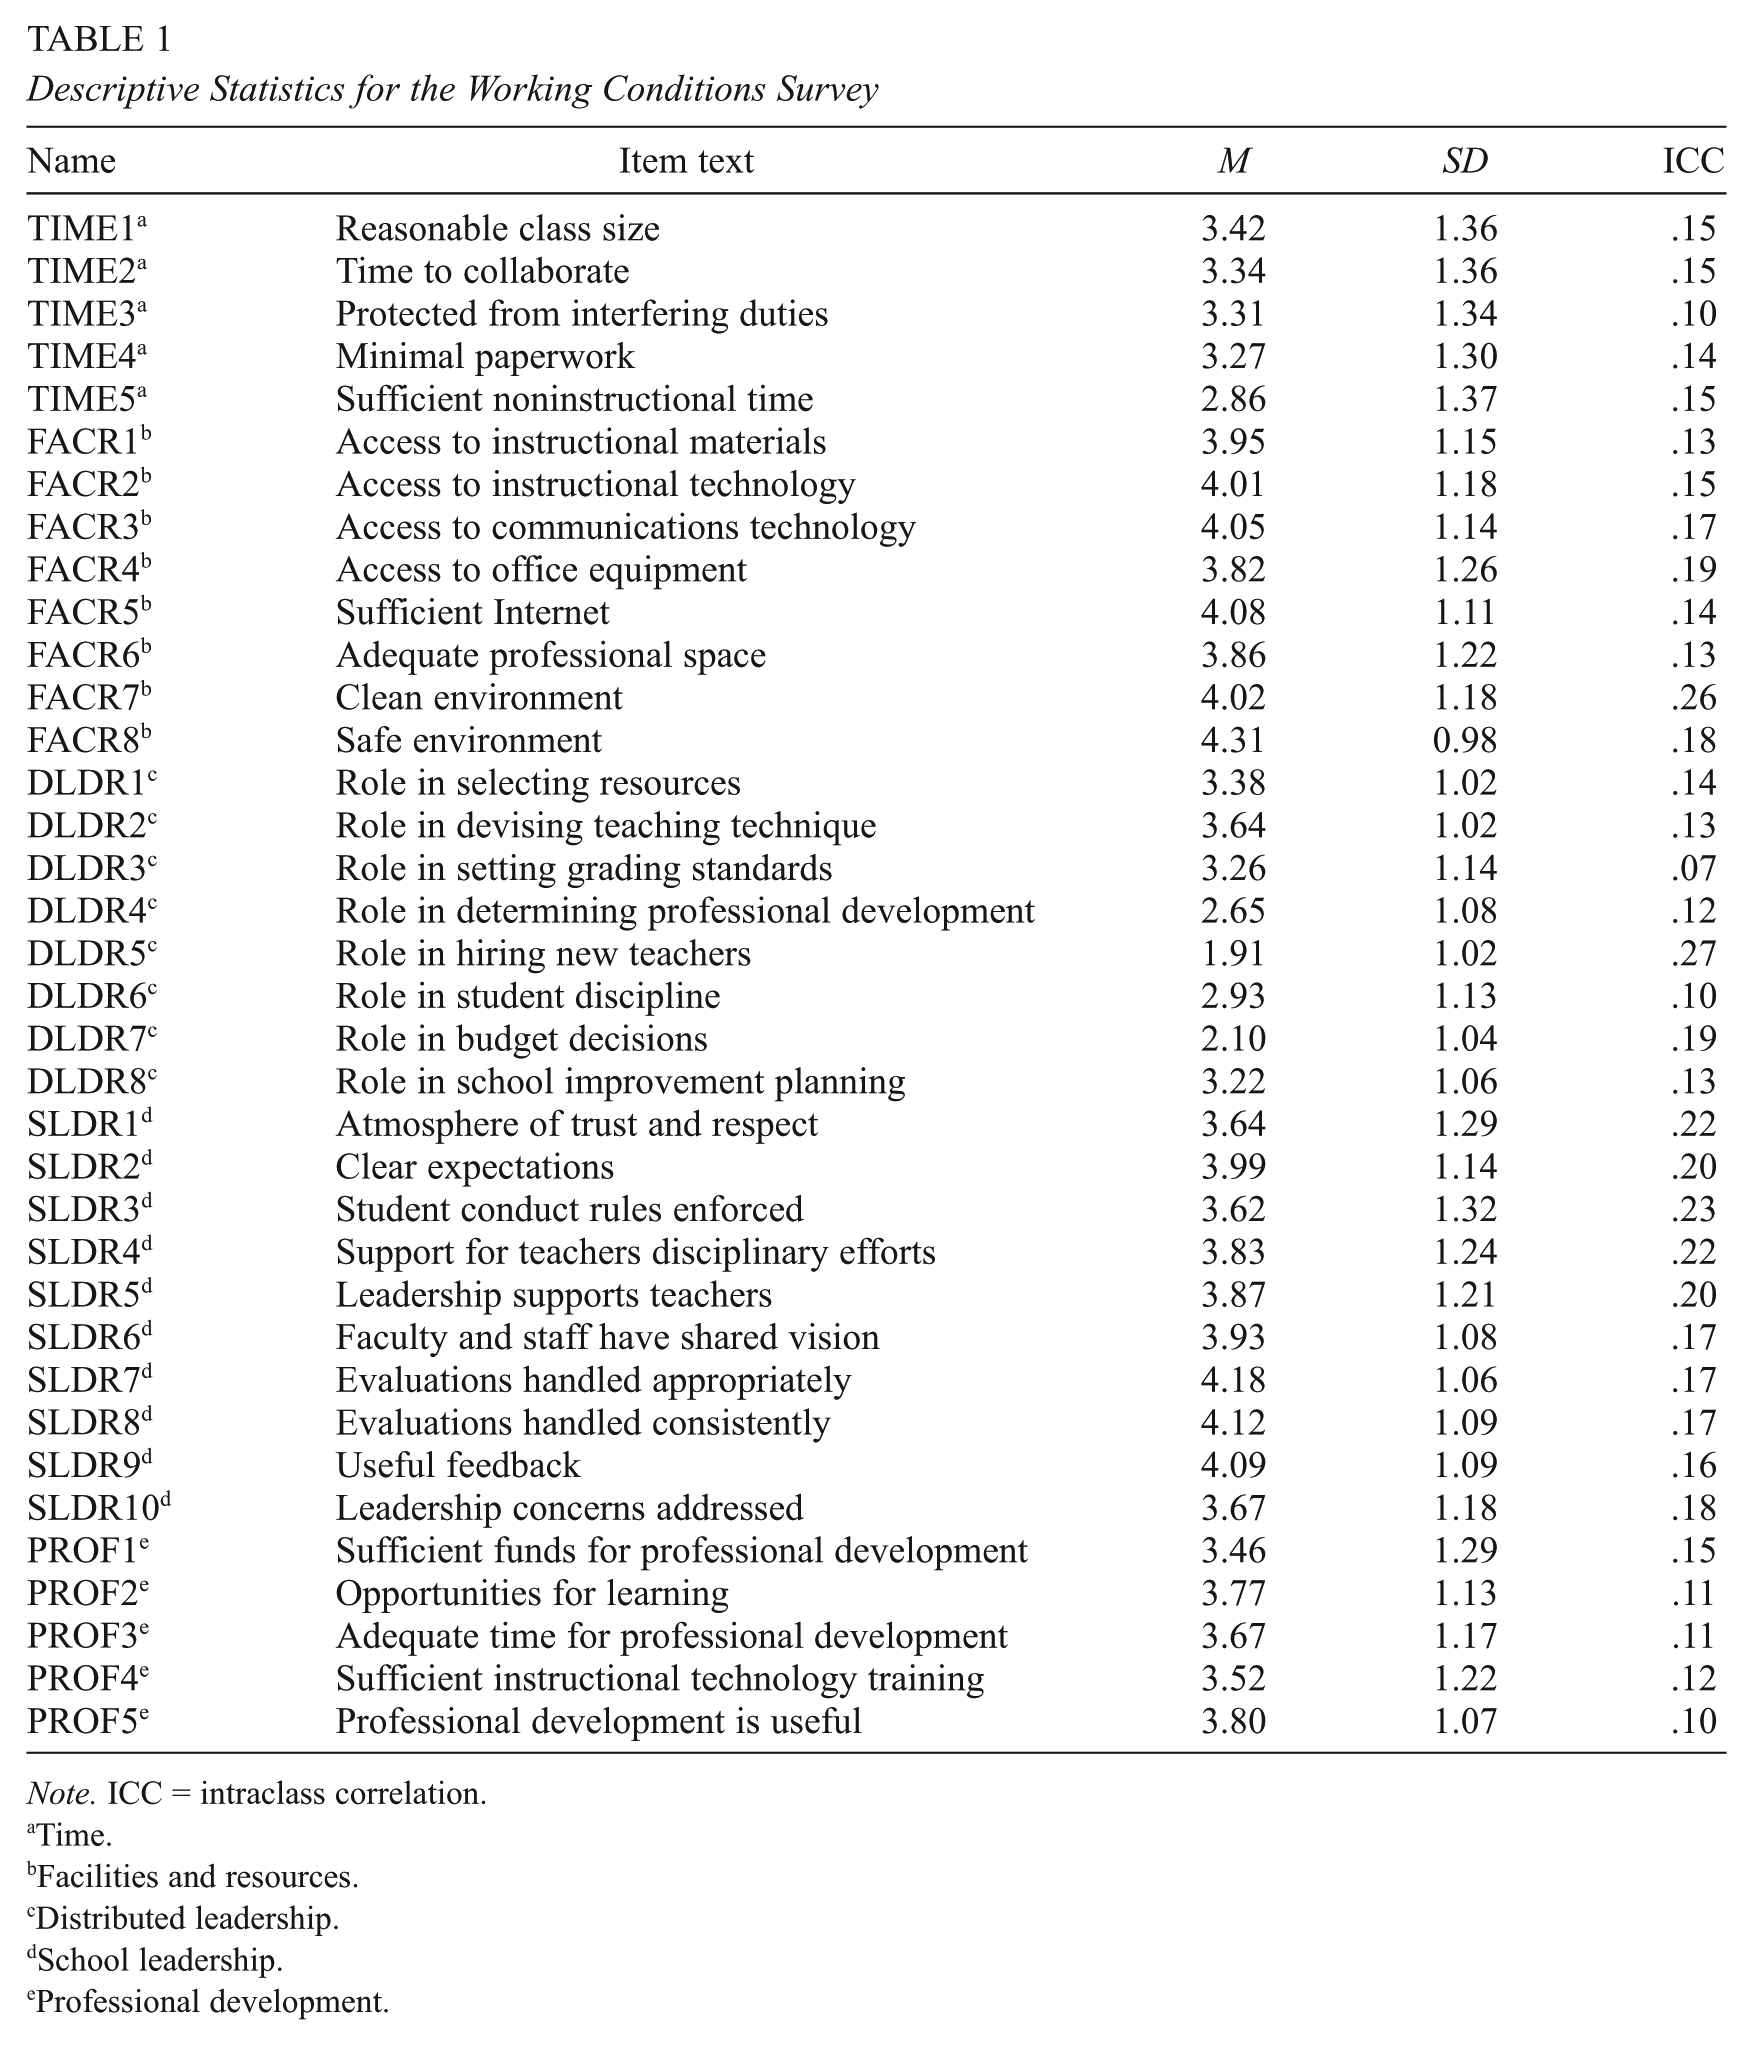
The WCS
This survey was designed to assess teaching conditions at the school level. The sample data comes from the 2008 survey, administered to teachers and principals at schools in K–12 public and charter schools across the state of North Carolina. For this analysis, only surveys completed by teachers were considered, and because of some evidence that factorial structure may differ across levels of schooling (Ladd, 2011), only elementary schools were used in this analysis. This resulted in a data set with 42,155 individual teacher cases in 1,267 schools. Although the average school size is approximately 33 teachers, schools in this analysis range from 6 teachers to 75 teachers. This analysis focuses on a set of 36 survey items (Table 1) that were designed to measure five theoretical dimensions of the school environment: Time (adequacy of time for planning and teaching), Distributed Leadership (similar to the “Expanded Roles” factor defined by Ladd (2011), this factor includes teacher involvement in setting school and classroom-level policy, including involvement in decisions about curriculum, instruction, professional development, and other school policies), School Leadership (includes support for teachers, shared vision, and a trusting environment), Professional Development (sufficiency of funds and resources to support professional development), and Facilities and Resources (availability of resources, safety and cleanliness of facilities). There are two scales used in the survey. One has 5 points (1 = strongly disagree and 5 = strongly agree) and is used for every item in the Time, Leadership, Professional Development, and Facilities and Resources dimensions. The other scale also has 5 points (1 = no role at all and 5 = the primary role) and is used in the Distributed Leadership items.
Descriptive Statistics for the Working Conditions Survey
Note. ICC = intraclass correlation.
Time.
Facilities and resources.
Distributed leadership.
School leadership.
Professional development.
A large set of teacher-level covariates were derived from this survey, and were used in the analysis of intended teacher departure. These include indicators of a teacher’s race, gender teaching experience, education (i.e., whether a teacher has an advanced degree), whether a teacher was trained through an alternative certification pathway, and whether the teacher is certified by the National Board for Professional Teaching Standards. In addition, the outcome variable, indicating a teacher’s intent to leave a school, was constructed from this survey. The item reads, “Which best describes your professional intentions in the next 2 years?” and the answer options are (1 = continue teaching at my current school, 2 = continue teaching in my current district, 3 = continue teaching in this state, 4 = leave teaching for another position in education, 5 = leave teaching for personal reasons, 6 = retire from teaching, and 7 = leave teaching for another reason). The item was recoded into a binary variable, with Option 1 recoded as 0, and Options 2 to 7 recoded as 1. Thus, the outcome variable indicated whether a teacher intended to leave a school in the next 2 years.
Several school-level variables were constructed from statewide administrative data. These include an indicator of whether a school was in one of the four largest metropolitan areas in the state, indicators of school demographics (percentage of students who are Black, percentage of students who are Hispanic, percentage of students on free or reduced lunch, school-mean teacher experience, student teacher ratio, and an indicator of whether a school hit its target for expected academic growth). A full list of covariates used in the analysis (and descriptive statistics) is available in Table 2.
Descriptive Statistics for the Tripod Survey
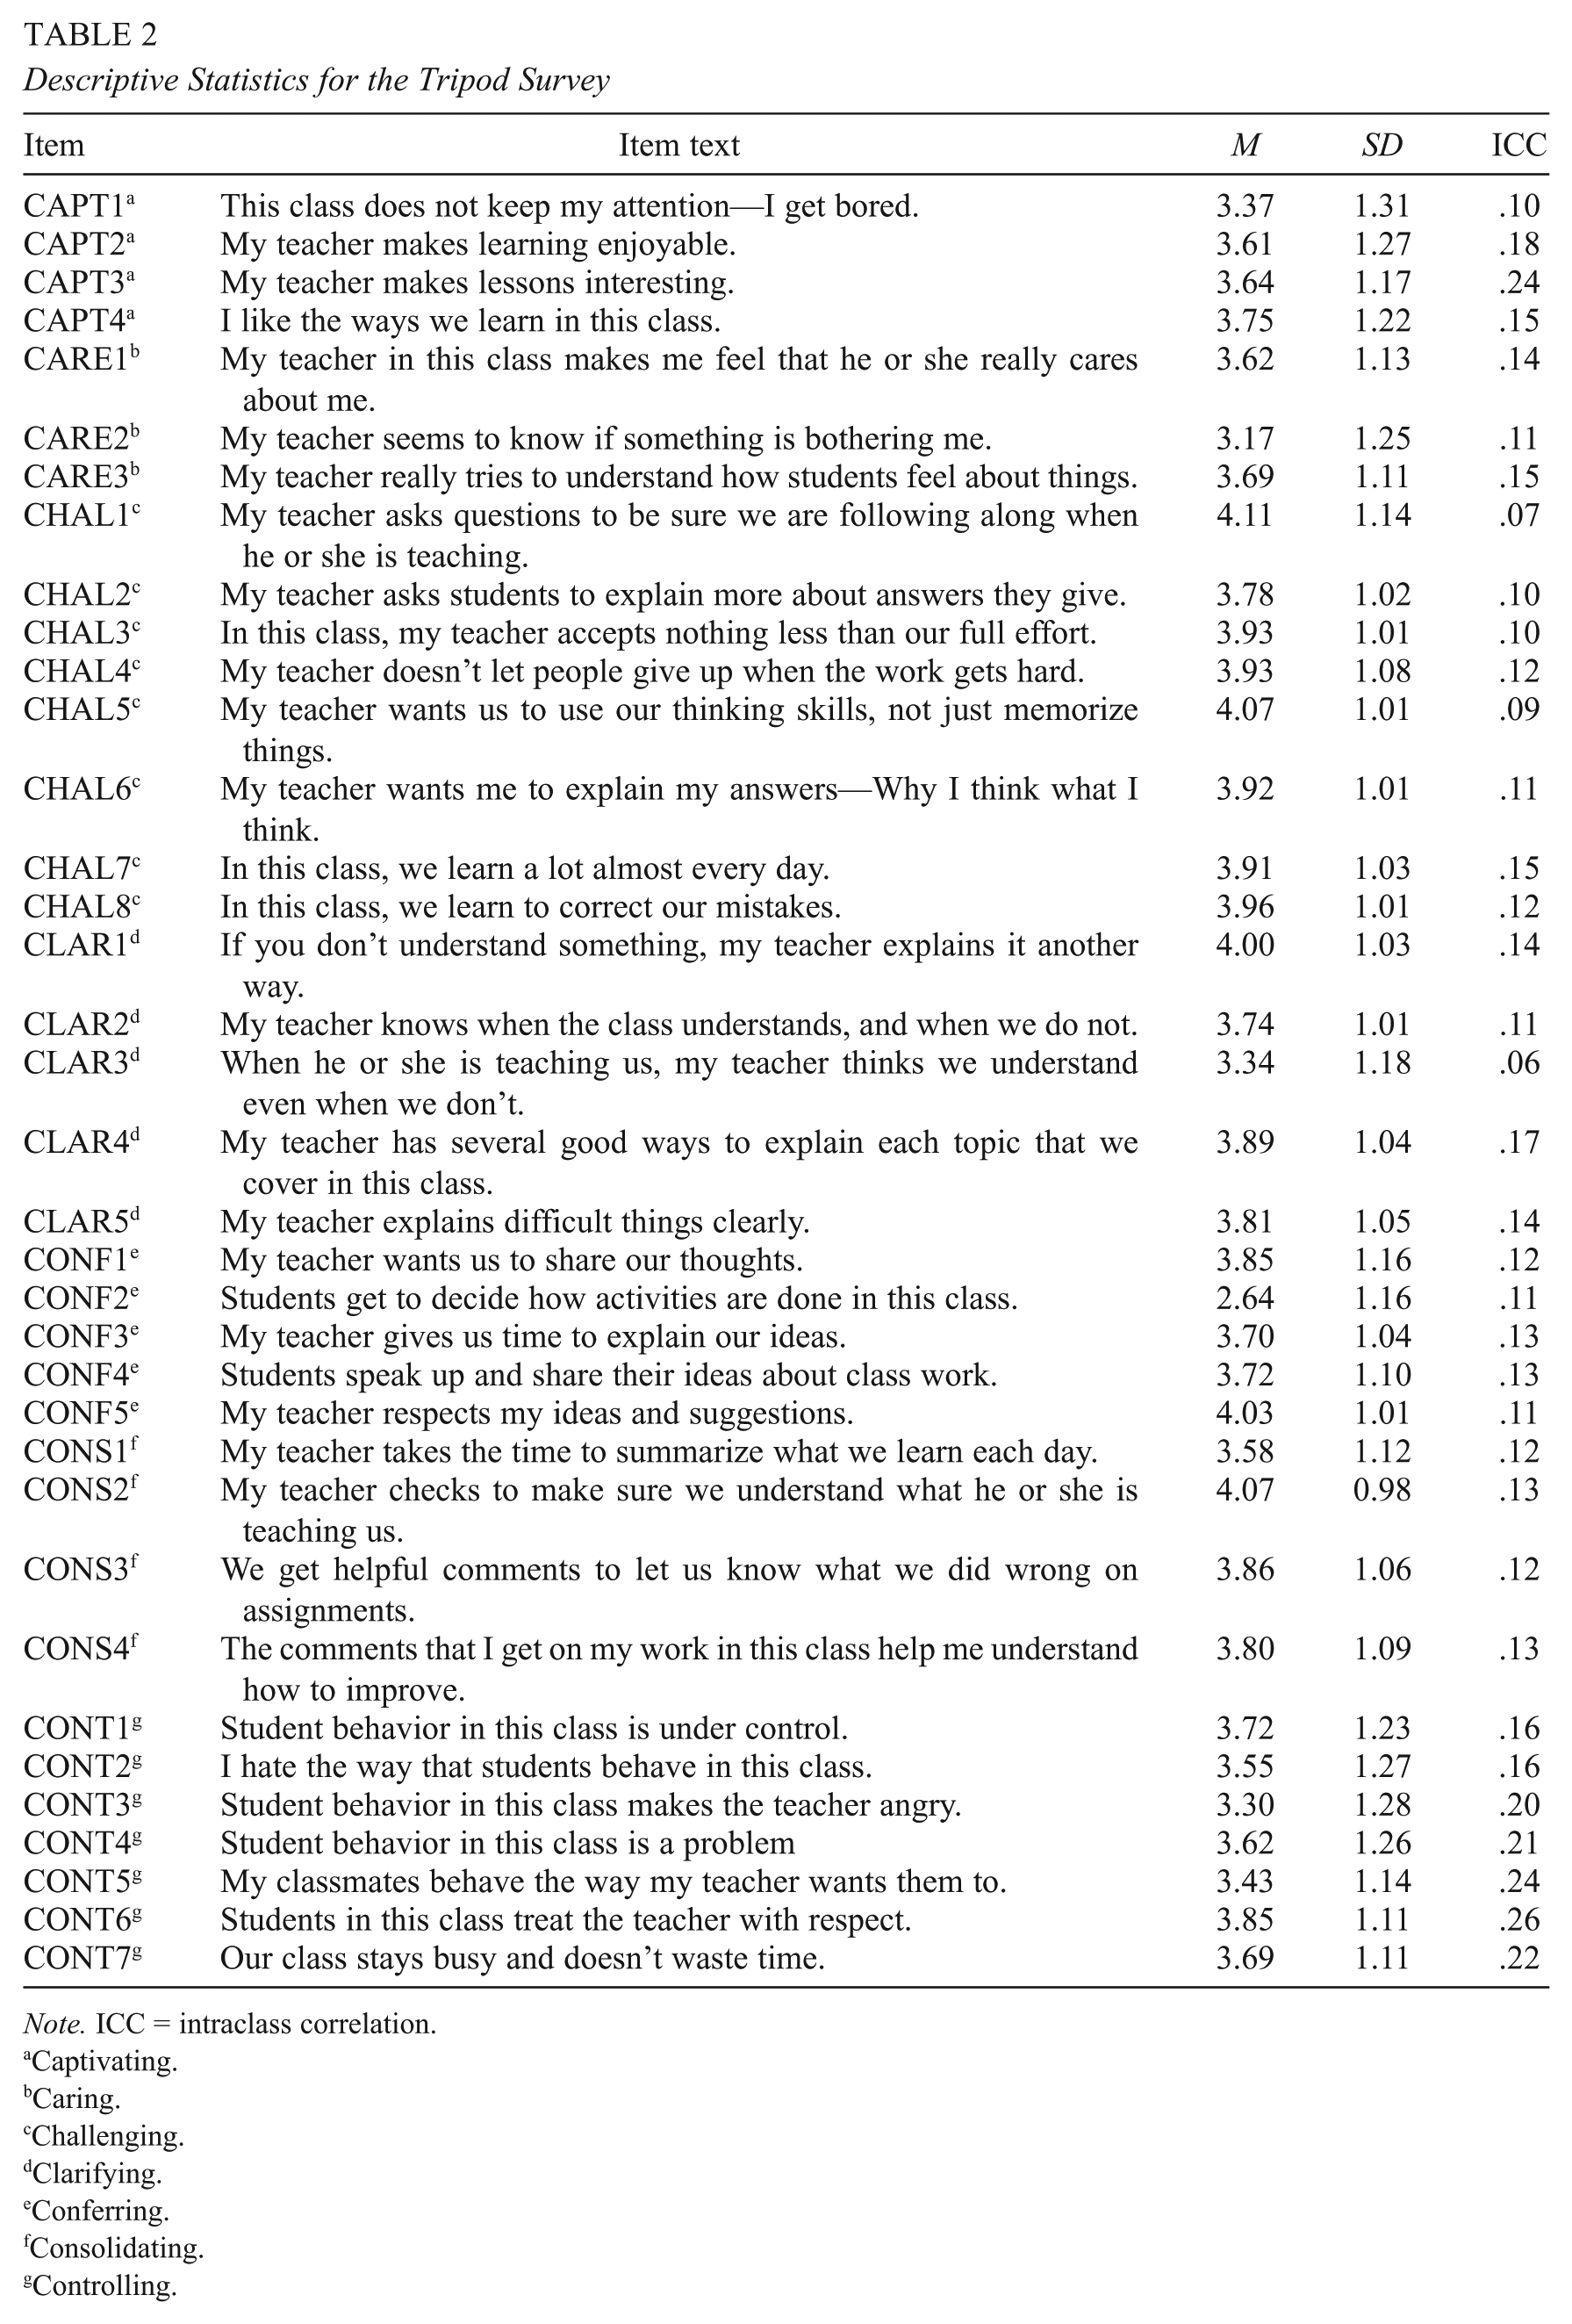
Note. ICC = intraclass correlation.
Captivating.
Caring.
Challenging.
Clarifying.
Conferring.
Consolidating.
Controlling.
The Tripod Classroom Environment Survey
The Tripod Survey assessment is designed to assess seven dimensions of teaching practice, often referred to as the “Seven C’s”: Caring, Captivating, Conferring, Clarifying, Challenging, Controlling, Consolidating. This version of the Tripod Survey contains 36 items (Table 3) and was administered in an urban school district in California in 2010. All items have 5-point scales (1 = totally untrue and 5 = totally true). The sample used in this analysis contained 6,386 students in 349 classrooms. The average classroom size was approximately 18 students, and the range was from 5 to 33 students. For illustrative purposes, the Tripod Survey is treated as a two-level survey in this analysis, and independence between classrooms within the same school is assumed. In actuality, however, classrooms are clustered within schools, and ignoring this clustering may also influence the inferences about the measurement model.
Covariates Used in Regression Analysis: Working Conditions Survey
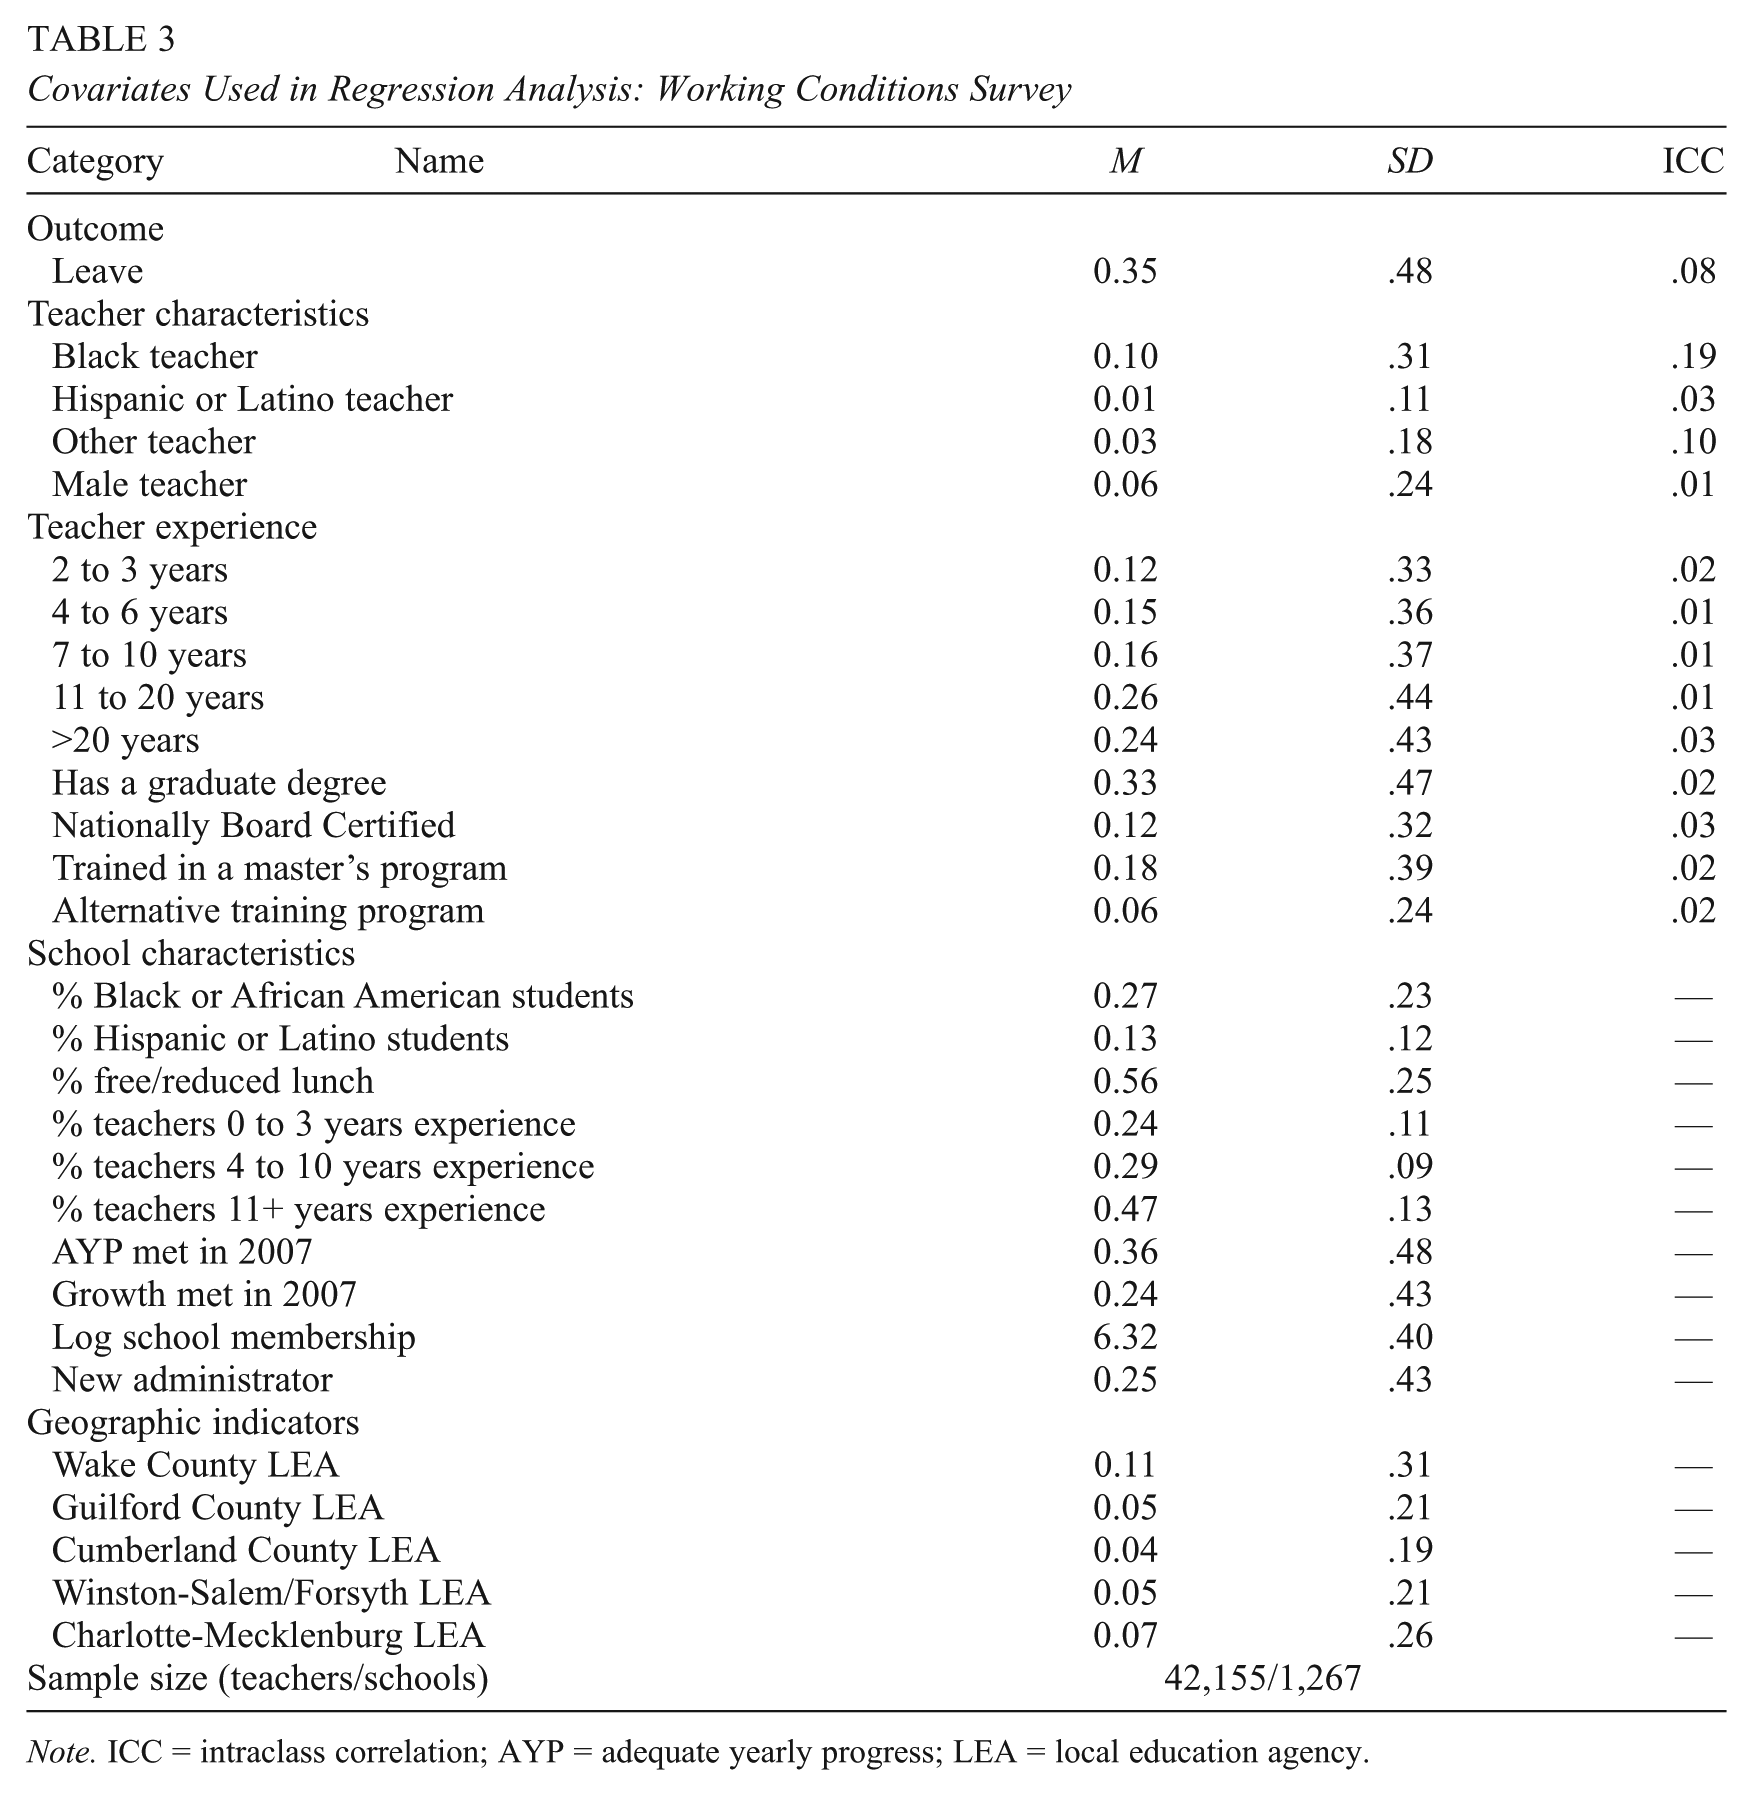
Note. ICC = intraclass correlation; AYP = adequate yearly progress; LEA = local education agency.
Analytic Approach
Multilevel exploratory factor analysis (MEFA)
To address the first research question, this article follows the MEFA procedure described by Van de Vijver and Poortinga (2002) and Reise et al. (2005), which is based on a procedure first outlined by Muthén (1994). (a) The item intraclass correlations (ICCs) are inspected to determine the amount of variance at the between-group level to assess whether a multilevel factor analysis is warranted. Muthén noted that if all ICCs are close to zero, a multilevel factor analysis may not be warranted. (b) Maximum likelihood estimates of the within-group correlation matrix and between-group level correlation matrix were obtained using Mplus version 6.11 (Muthén & Muthén, 2010). (c) EFA was then conducted on these two matrices separately. Factors were extracted using minres factor analysis. Oblique (oblimin) rotation was used so that the factors were free to correlate. 1
In conventional EFA, there is a long and rich literature on methods for determining the number of factors to retain (e.g., Fabrigar, Wegener, MacCallum, & Strahan, 1999; Floyd & Widaman, 1995; Ford, MacCallum, & Tait, 1986). There is relatively little research on factor retention issues in MEFA. Some studies, however, have suggested that features of the between-group correlation matrix may result in the extraction of too many factors if maximum likelihood–based approaches to factor selection are used (e.g., Briggs & MacCallum, 2003; Browne, MacCallum, Kim, Andersen, & Glaser, 2002; Schmitt, 2011). Thus, this article uses parallel analysis (Horn, 1965) to determine the number of factors to retain. Parallel analysis is a simulation-based approach. It compares the eigenvalues of the collected data with eigenvalues of data with the same structure that is generated as random “noise.” The basic logic is that eigenvalues associated with substantive factors should be larger than the eigenvalues extracted from randomly generated data (Hayton, Allen, & Scarpello, 2004). Studies (e.g., Crawford & Koopman, 1973; Humphreys & Montanelli, 1975; Schmitt, 2011) have consistently shown that parallel analysis provides trustworthy estimates of the number of factors to retain in EFA. D’Haenens et al. (2010) used parallel analysis on the within- and between-groups correlation matrices. All parallel analyses were conducted using the paran package in R (Dinno, 2012).
To address the second and third research questions, two additional EFAs were conducted. The first was based on the total (disaggregated) covariance matrix:
where
where
To address the fourth research question, a linear probability ordinary least squares (OLS) regression model was used, similar to that used in previous research (Ladd, 2011). In that model, the predicted outcome for teacher i in school j can be expressed as
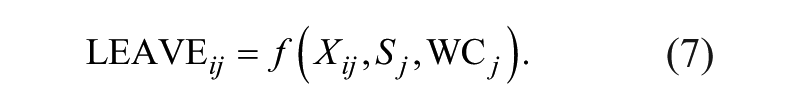
That is, an individual’s intended departure is modeled as a function of characteristics of the individual teacher, Xij; characteristics of the school, Sj; and school-level working conditions variables, WC j . All regressions were weighted by the number of responses in each school, and standard errors were clustered at the school level. Factor scores were used to represent working conditions variables. Factor scores were estimated from a factor model using all loadings greater in magnitude than .3, and all cross-loadings were modeled explicitly. For the model assuming cross-level measurement invariance, school-level scores were formed by averaging over individual factor scores. For the model incorporating noninvariance, school scores were formed by using between-level factor scores from a multilevel factor analysis.
Other approaches for modeling this relationship include hierarchical linear models, hierarchical generalized linear models (e.g., Raudenbush & Bryk, 2002), and multilevel latent variable models (e.g., Marsh et al., 2009). These models can potentially result in different inferences about the relationship between school working conditions and intended teacher departure. For simplicity we use OLS in this study, as the focus is not on differences across statistical models, but on how inferences may differ depending on whether or how cross-level noninvariance is modeled.
Using linear composites as proxies for latent variables may also have consequences on the inferences that are made and may bias parameter estimates. The extent of this bias is a function of measurement error and sampling error (e.g., Lüdtke, Marsh, Robitzsch, & Trautwein, 2011; Marsh et al., 2009; Preacher et al., 2010; Raudenbush & Sadoff, 2008). Although factor scores (or other error-corrected variables) are often used in regression analyses to address the issue of measurement error, procedures in this vein (e.g., Croon & van Veldhoven, 2007; Raudenbush & Sadoff, 2008) are less efficient than multilevel structural equation models (Lüdtke et al., 2011). Under general conditions, the use of factor scores will also yield biased parameter estimates (Skrondal & Laake, 2001). A thorough investigation of these issues is beyond the scope of the current study.
Results
What Is the Multilevel Factorial Structure of These Two Surveys? Is There Empirical Evidence to Support the Assumption of Cross-Level Measurement Invariance in Either Case?
ICCs range from around .07 to around .27 for the WCS (Table 2), and from around .06 to .26 for the Tripod Survey (Table 3). Although this shows that individual responses within clusters share a nontrivial amount of similarity, there is also variability in terms of how much variance of each item is accounted for at the group level. Some items function better as indicators of group-level phenomenon than others. Overall, in both surveys, ICCs of this size provide sufficient evidence that a MEFA is warranted. In fact, this range of ICCs is consistent with past research (Marsh et al., 2012).
For the WCS, parallel analysis suggested the extraction of six factors at the within level and five factors at the between level. Within schools, the factor structure includes a Time factor, a Facilities and Resources factor, a School Leadership factor, a Teacher Evaluation factor, a Distributed Leadership factor, and a Professional Development factor. There are no significant cross-loadings. The Teacher Evaluation factor consists of three items—SLDR7, SLDR8, and SLDR9—inquiring about the handling of performance evaluation. The two strongest loading items in the School Leadership factor focus on aspects of student discipline (SLDR3: “The school leadership consistently enforces rules for student conduct”; SLDR4: “The school leadership support teachers’ efforts to maintain discipline in the classroom”). The Distributed Leadership factor identified in the within-level analysis contains items about the roles teachers play in establishing classroom, curricular, and administrative policy.
The between-school structure of the WCS differs from the within-school (teacher-level) structure (Table 4). There is considerably more cross-loading. In total, there are seven items that load onto more than one factor. This indicates that the factor structure may be less well defined at the school level than at the teacher level. MEFA results in D’Haenens et al. (2010) also show more significant cross-loading at the group level. The Time factor and the Teacher Evaluation factors are similarly constituted at the school level as they are at the teacher level. However, the Professional Development items no longer load onto a distinguishable factor. These items now load with seven of the Facilities and Resources items. This suggests that schools that provide adequate facilities and resources also provide adequate professional development (Muthén & Asparouhov, 2011). Thus, at the school level, there is a broadly defined resources factor, where quality professional development is conceived of as a school-wide resource. This is reasonable, as PROF1 reads “Sufficient funds and resources are available to allow teachers to take advantage of professional development activities.”
Rotated Factor Loadings for the Working Conditions Survey: Multilevel Analysis
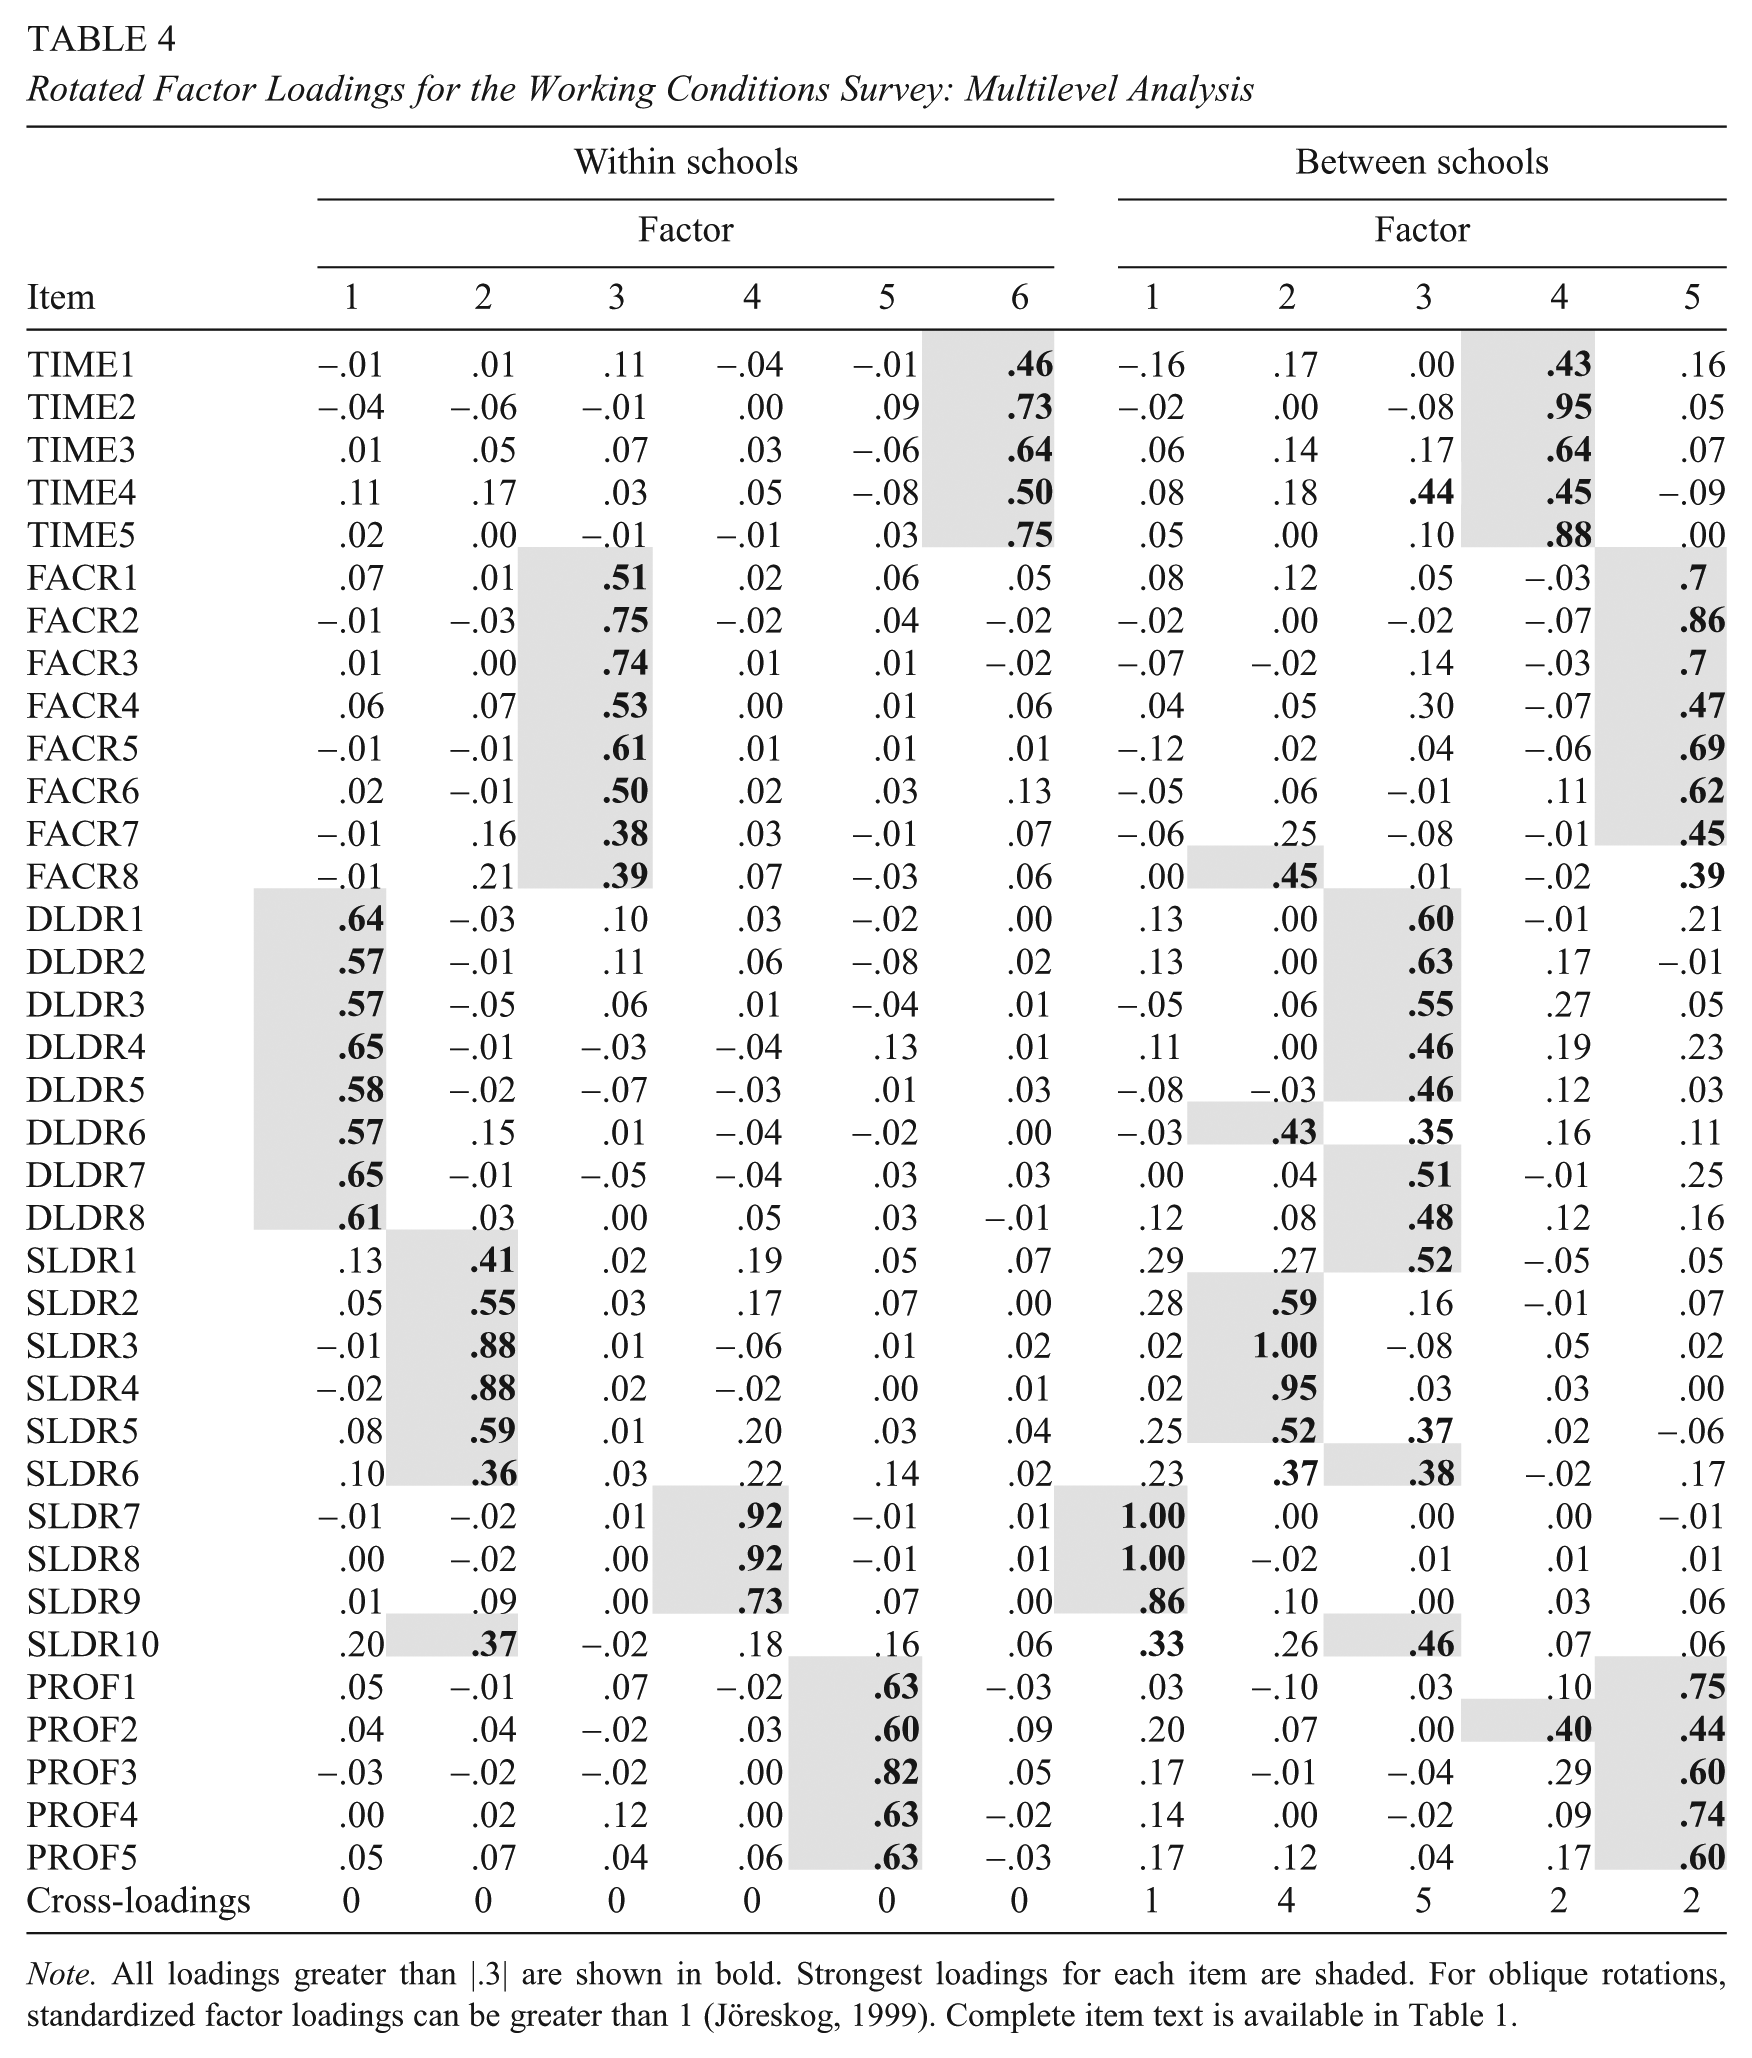
Note. All loadings greater than |.3| are shown in bold. Strongest loadings for each item are shaded. For oblique rotations, standardized factor loadings can be greater than 1 (Jöreskog, 1999). Complete item text is available in Table 1.
The most interesting differences concern the School Leadership and Distributed Leadership factors from the teacher-level analysis. These factors are differently constituted at the school level. While at the teacher level the School Leadership and Distributed Leadership factors were clearly distinguished, with no cross-loading items, at the school level this is not true. The strongly loading items about discipline in the School Leadership factor associate with other items about school safety, including FACR8 (“Teachers and staff work in a school environment that is safe”) and discipline policy (DLDR6 asks about the role teachers play in “Establishing and implementing policies and student discipline”). There are also items from the School Leadership factor concerning trust and mutual respect that associate closely with the Distributed Leadership items at the school level (SLDR1: “There is an atmosphere of trust and mutual respect within the school”; SLDR6: “The faculty and staff have a shared vision”; SLDR10: “The school leadership makes a sustained effort to address teacher concerns about leadership issues;”). This makes for a broader conceptualization of Distributed Leadership at the school level, and this pattern of loadings makes sense, as Harris (2004) noted that, “collaboration and collegiality are at the core of distributed leadership” (p. 15). Harris (2003) noted that for distributed or dispersed leadership to work, a high degree of trust is essential. The cross-loaded items suggest that there is some conceptual overlap between the Distributed Leadership items and other aspects of School Leadership. These two factors correlate approximately .61.
For the Tripod Survey, parallel analysis suggests five factors at the within level, and two factors at the between level. For the within-classroom factorial structure, 21 of the first 29 items load onto a single factor (Table 5). These items deal with a broad range of the academic and emotional dimensions of classroom environment, but the strongest loading items are about understanding: CARE3, “My teacher really tries to understand how students feel about things”; CONS2, “My teacher checks to make sure we understand what he or she is teaching us”; and CLAR1, “If you don’t understand something, my teacher explains it another way.”
Rotated Factor Loadings for the Tripod Survey: Multilevel Analysis
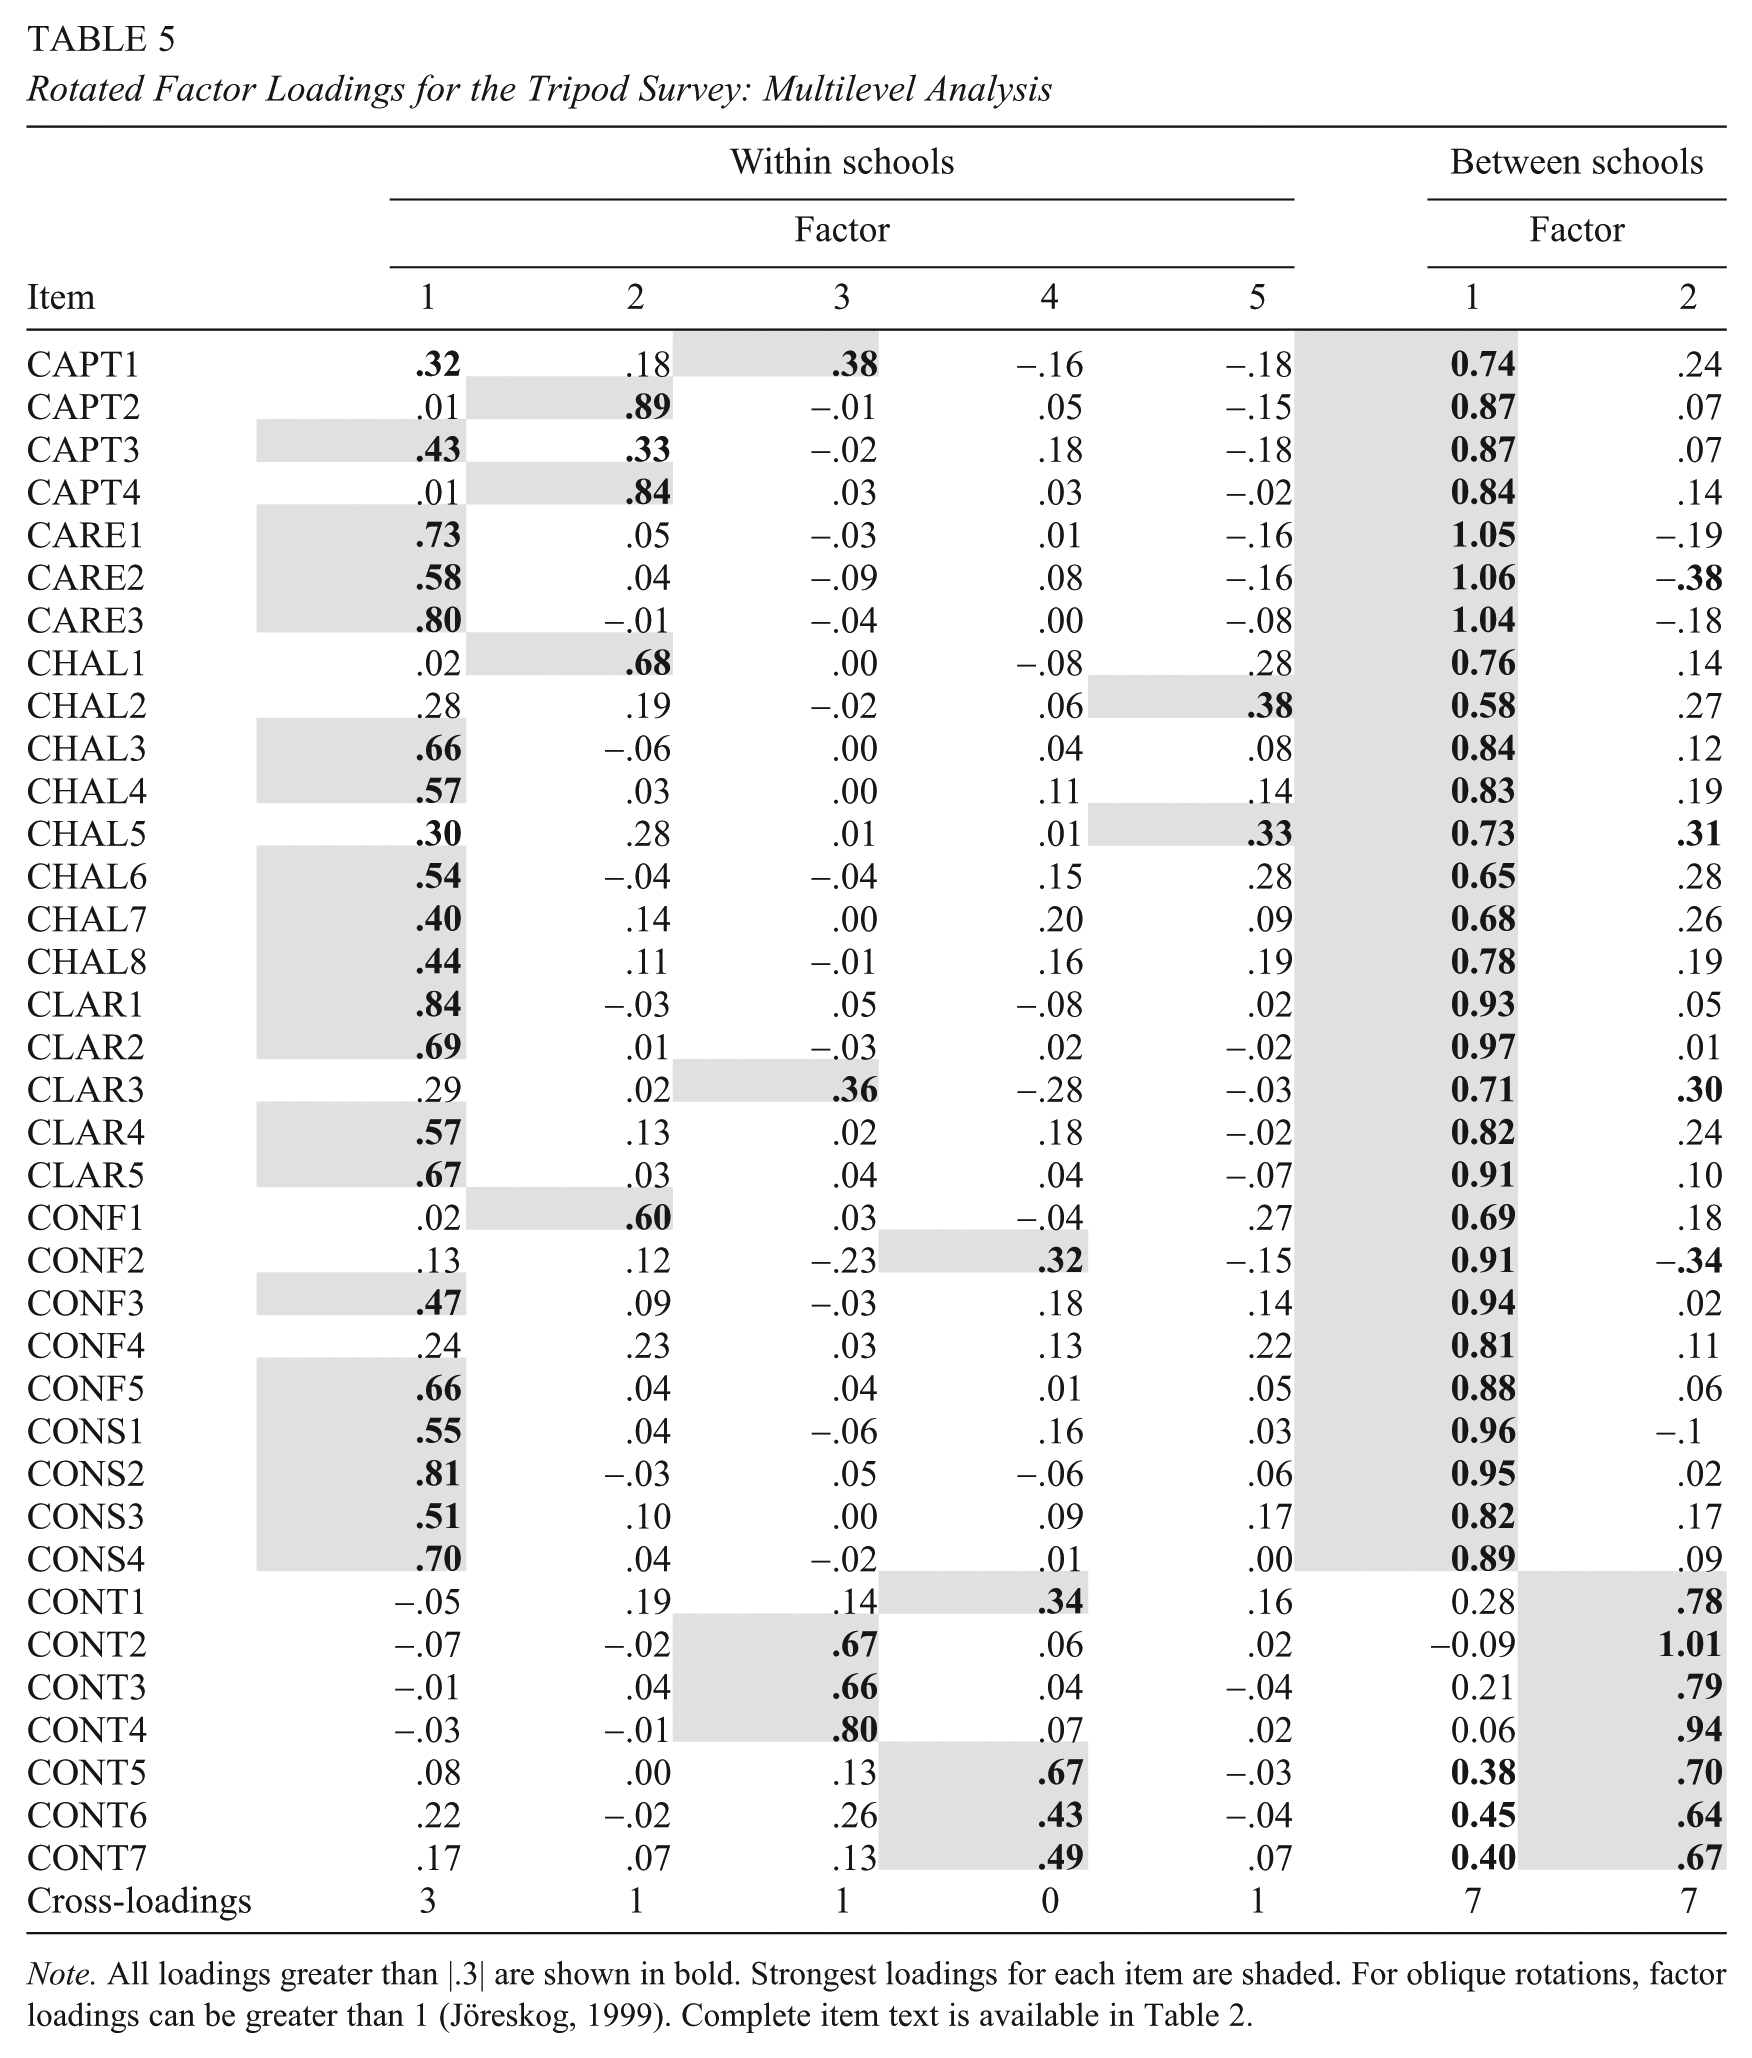
Note. All loadings greater than |.3| are shown in bold. Strongest loadings for each item are shaded. For oblique rotations, factor loadings can be greater than 1 (Jöreskog, 1999). Complete item text is available in Table 2.
The Controlling items load distinctly onto two separate factors at the within-classroom level. One of those factors deals with positive aspects of classroom discipline “Students in this class treat the teacher with respect” (CONT6). The other, with negative aspects: “Student behavior in this class is a problem” (CONT4). Two other items load onto the factor dealing with negative aspects. CAPT1: “This class does not keep my attention—I get bored.” And CLAR3: “When he or she is teaching us, my teacher thinks we understand even when we don’t.” These items also deal with negative dimensions of the classroom environment.
The between-classroom-level analysis (Table 5) shows two factors—one of which is dominated by items relating to the academic and emotional support of a classroom, and one of which is dominated by items related to classroom management (the Control items). This suggests that at a classroom level, teachers vary in their ability to provide academic and emotional support and to manage behavior in the classroom. Some teachers are adept at providing academic support, but less adept at managing the classroom, and vice versa (Muthén & Asparouhov, 2011). There is substantial cross-loading at the between level, with seven items loading onto both factors.
What Are the Consequences of Ignoring the Multilevel Structure and Conducting a Factor Analysis on the Disaggregated Data?
For the WCS, parallel analysis suggested extracting six factors from the total, disaggregated correlation matrix. The pattern of factor loadings, and their relative magnitude, is consistent with the within-school factor structure that was suggested by the multilevel factor analysis (Table 6).
Rotated Factor Loadings: Disaggregated Analysis
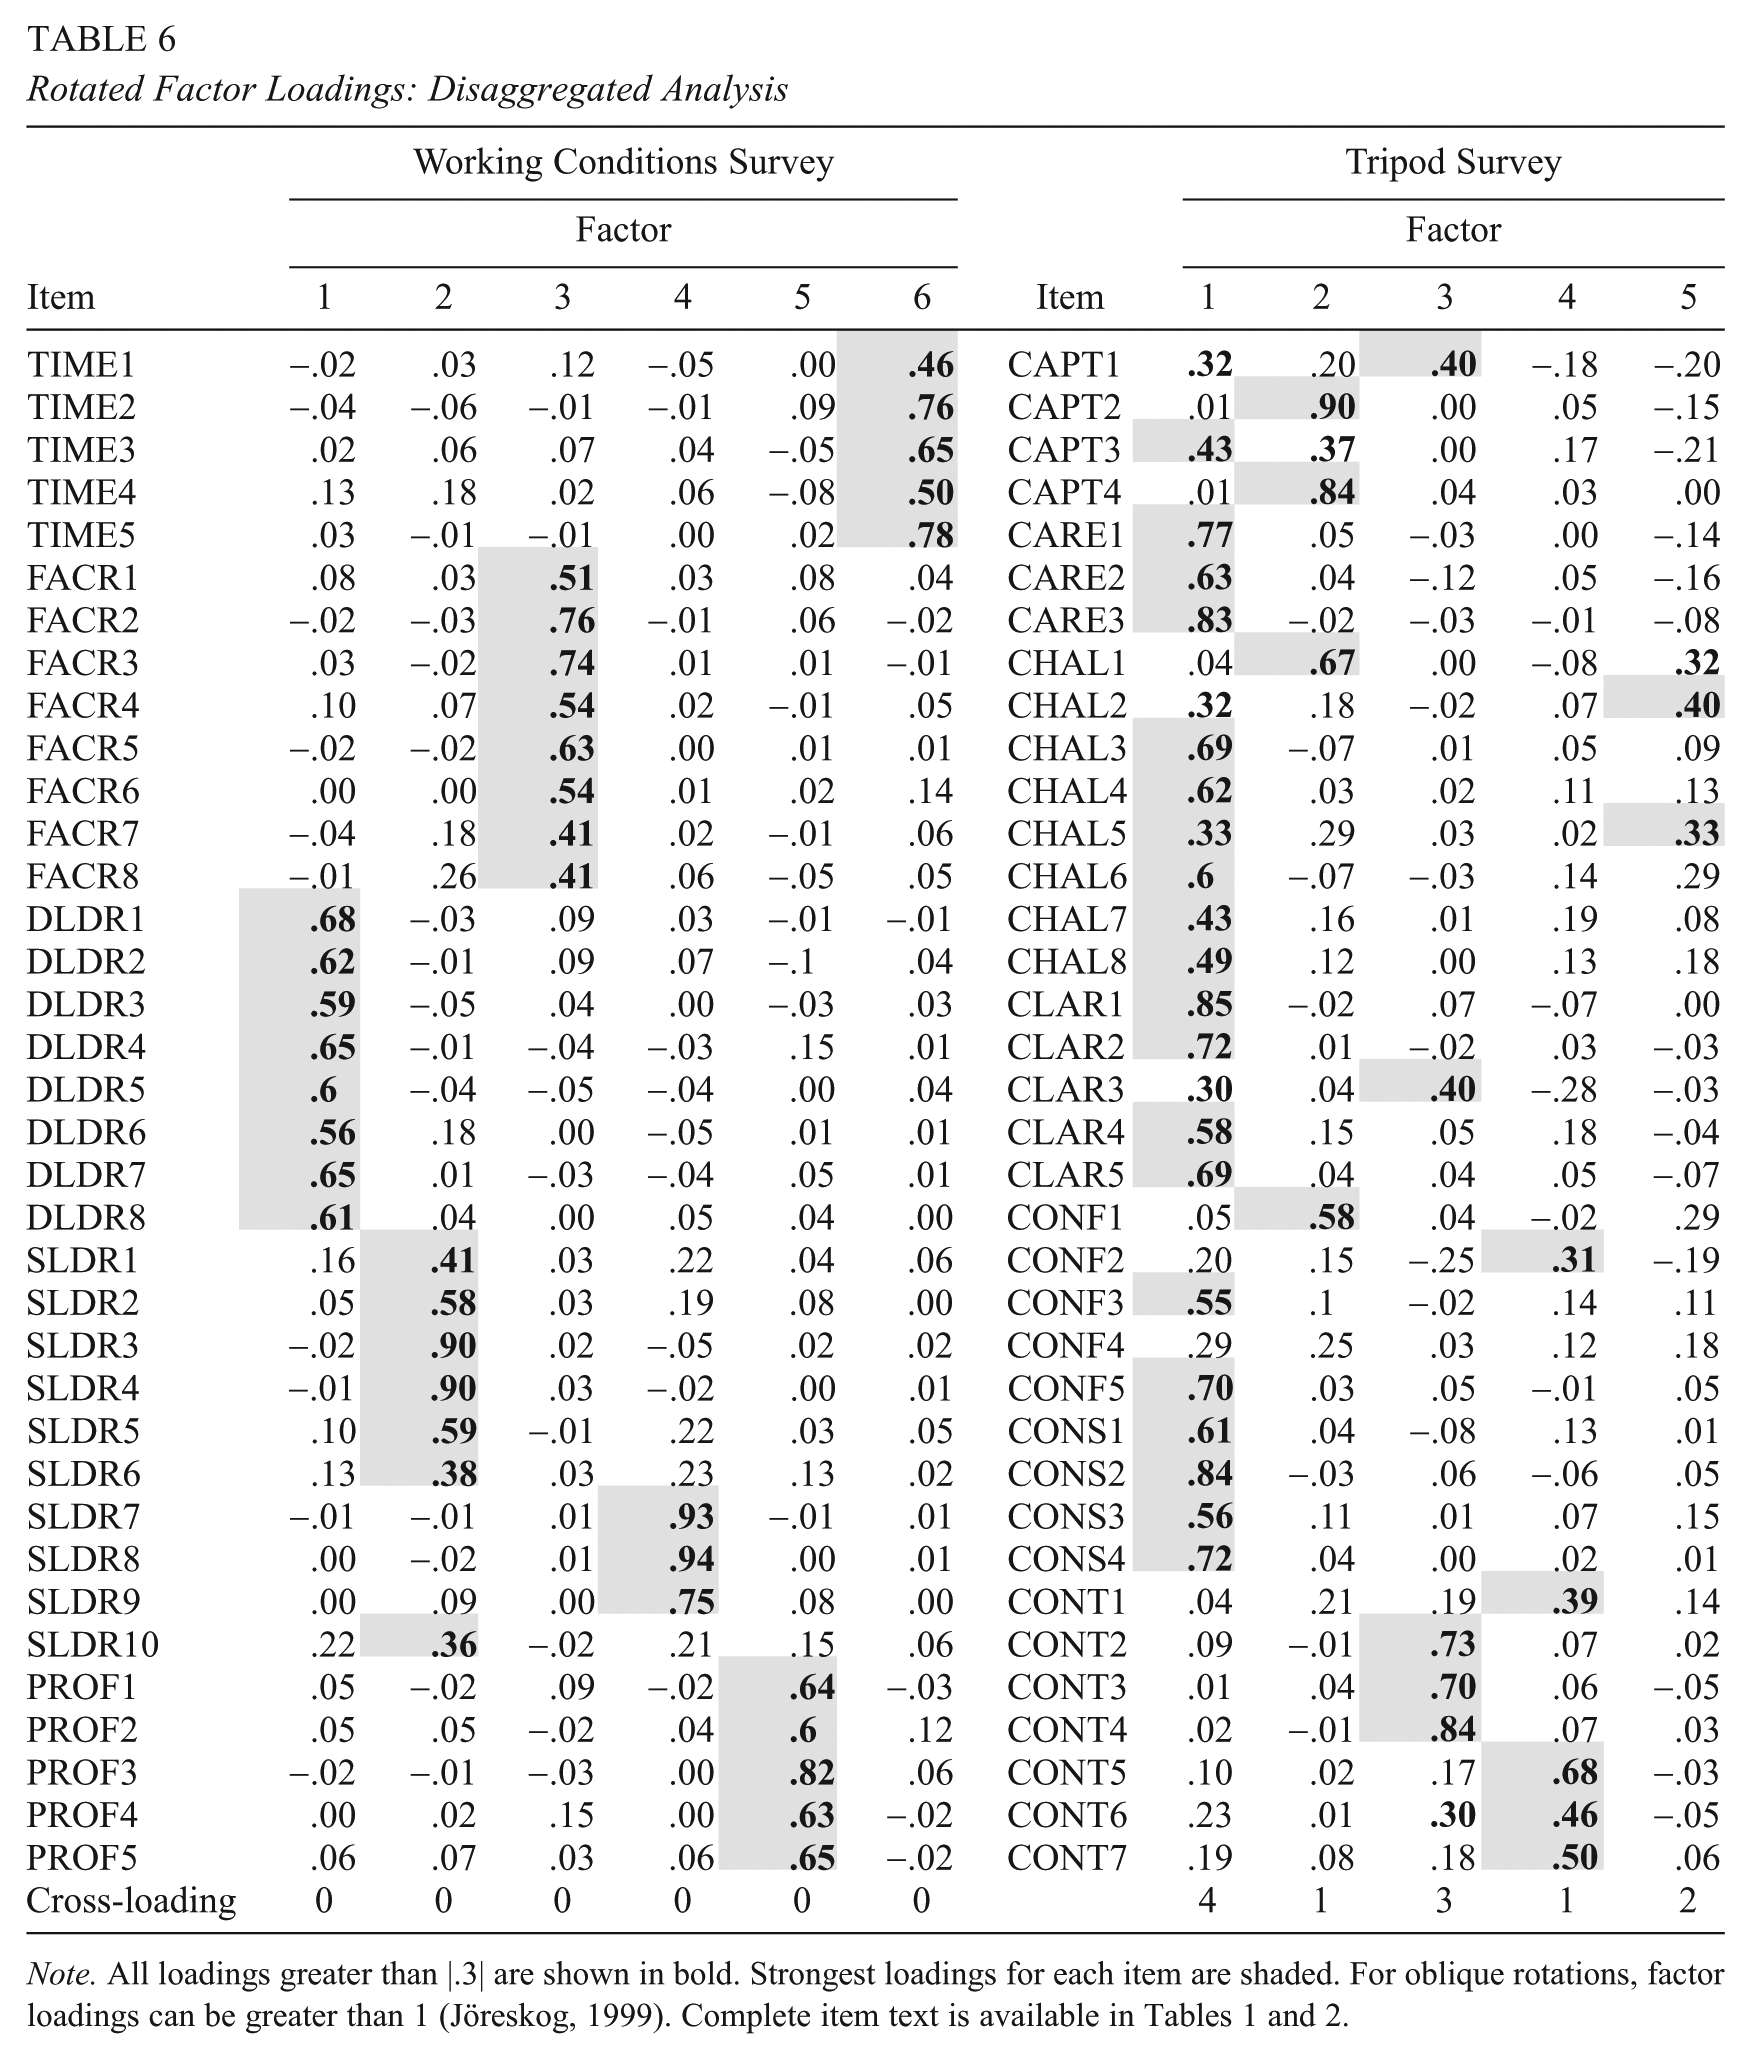
Note. All loadings greater than |.3| are shown in bold. Strongest loadings for each item are shaded. For oblique rotations, factor loadings can be greater than 1 (Jöreskog, 1999). Complete item text is available in Tables 1 and 2.
For the Tripod Survey, parallel analysis suggested extracting five factors (Table 6). The factor structure is also similar to the within-structure in the multilevel analysis, both in terms of the pattern of loadings and their relative magnitude.
Importantly, in both the WCS and the Tripod Survey, analysis of ST results in a factorial structure that is inconsistent with either the between-classroom level or the between-school level of the corresponding multilevel analysis. This is consistent with other findings (e.g., D’Haenens et al., 2010; Holfve-Sabel & Gustafsson, 2005; Reise et al., 2005) and provides a clear illustration of the methodological consequences of assuming cross-level invariance (e.g., Julian, 2001; Marsh et al., 2012).
What Are the Consequences of Ignoring the Multilevel Structure and Conducting a Factor Analysis on the Unweighted Group Means?
For the WCS, parallel analysis suggested five factors. The patterns of association (Table 7) between the items are different from at the between level of the multilevel analysis (Table 4). In particular, some Professional Development items associate more strongly with Time items, and some associate more strongly with Facilities and Resources items. In addition, the Teacher Evaluation factor is slightly less distinct. Overall, there is far more cross-loading than in the between level of the multilevel analysis, showing that an analysis of the unweighted group means distorts the factor structure and makes it more difficult to identify.
Rotated Factor Loadings: Group-Means Analysis
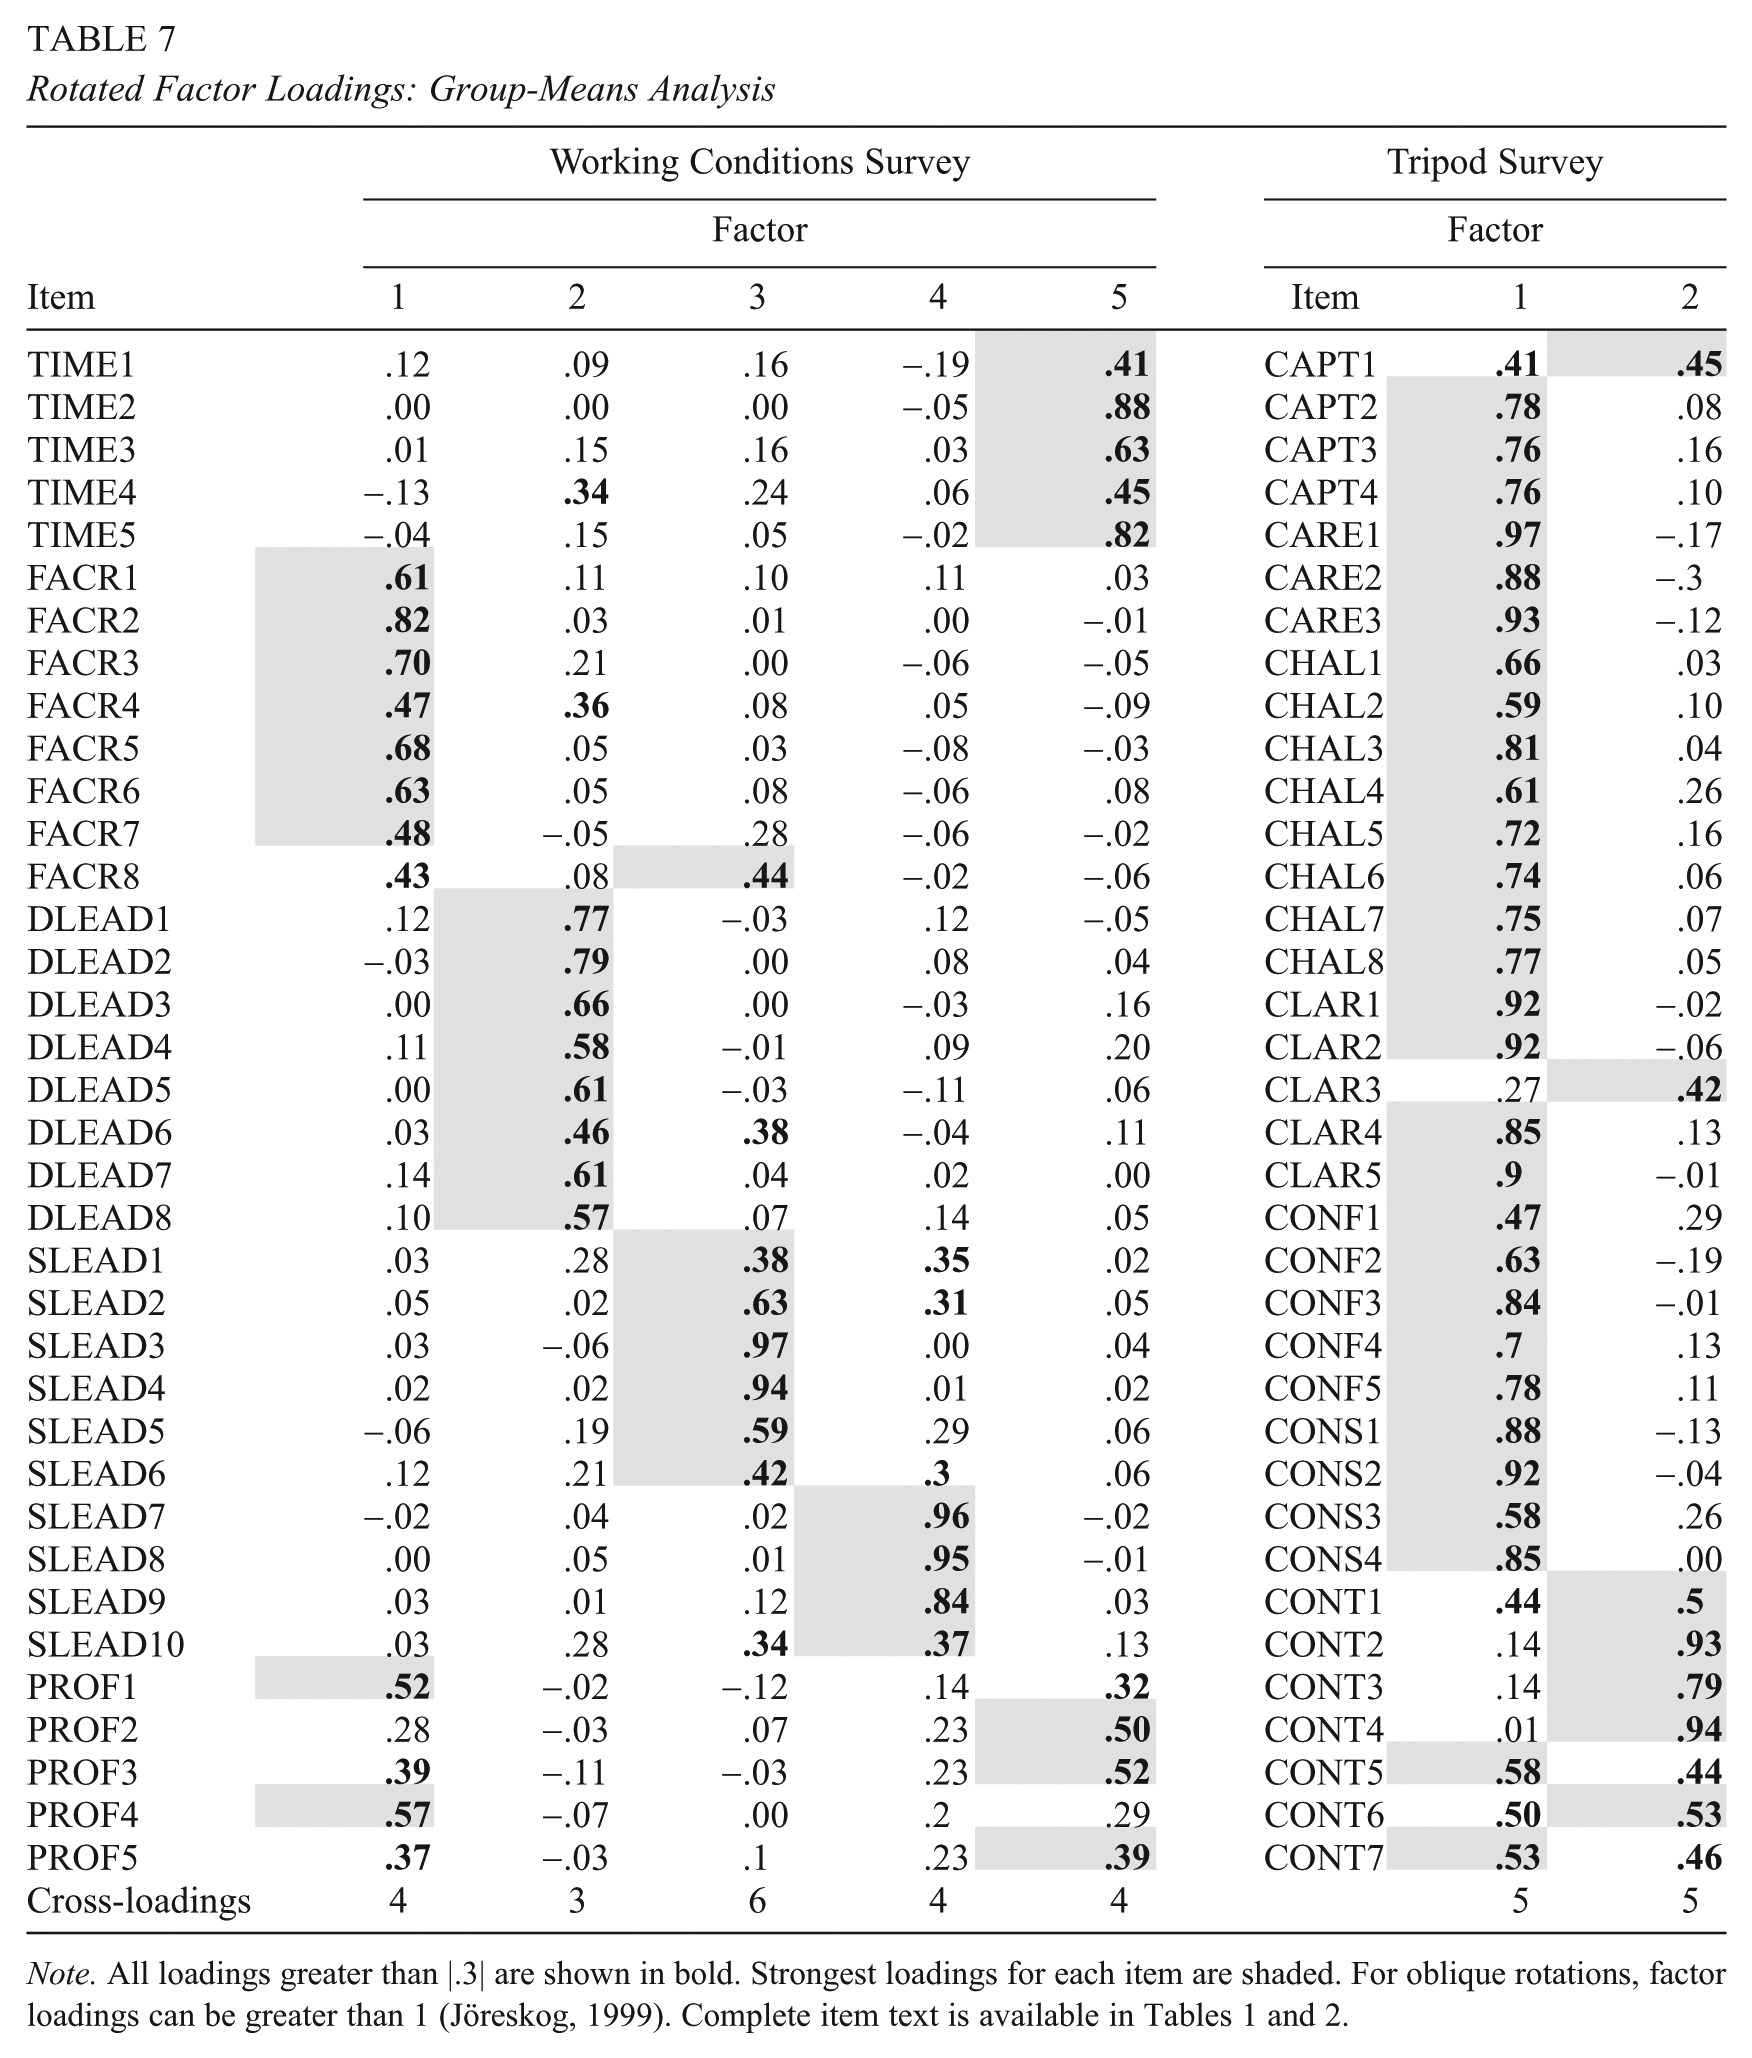
Note. All loadings greater than |.3| are shown in bold. Strongest loadings for each item are shaded. For oblique rotations, factor loadings can be greater than 1 (Jöreskog, 1999). Complete item text is available in Tables 1 and 2.
For the Tripod Survey, parallel analysis suggests the extraction of two factors (Table 7). The structure suggested by the analysis of the group-mean correlation matrix is fairly similar to that of the between level of the multilevel analysis. There is still one large factor; however, the control items no longer load as distinctively onto a separate factor.
In summary, in the WCS and Tripod Surveys, analysis of the unweighted group means has the effect of distorting the perceived factorial structure, and leads to inferences that are not consistent with either the within or between level of analysis. This is consistent with theoretical results discussed elsewhere (Preacher et al., 2010). Conceptually, this distortion makes sense. There are at least two distinct sources of bias that are present in this group-means analysis. First, differences in group size are not accounted for, and this may distort the correlation matrix. Second, the correlation matrix of group means contains between and within sources of variance (Muthén, 1994), and to the extent that the between- and within-correlation matrices have different structures, this will also have the effect of distorting inferences about the factorial configuration.
How Would a Multilevel Factor Analysis Alter the Policy Conclusions About the Importance of School Leadership in the Intended Departure of Teachers?
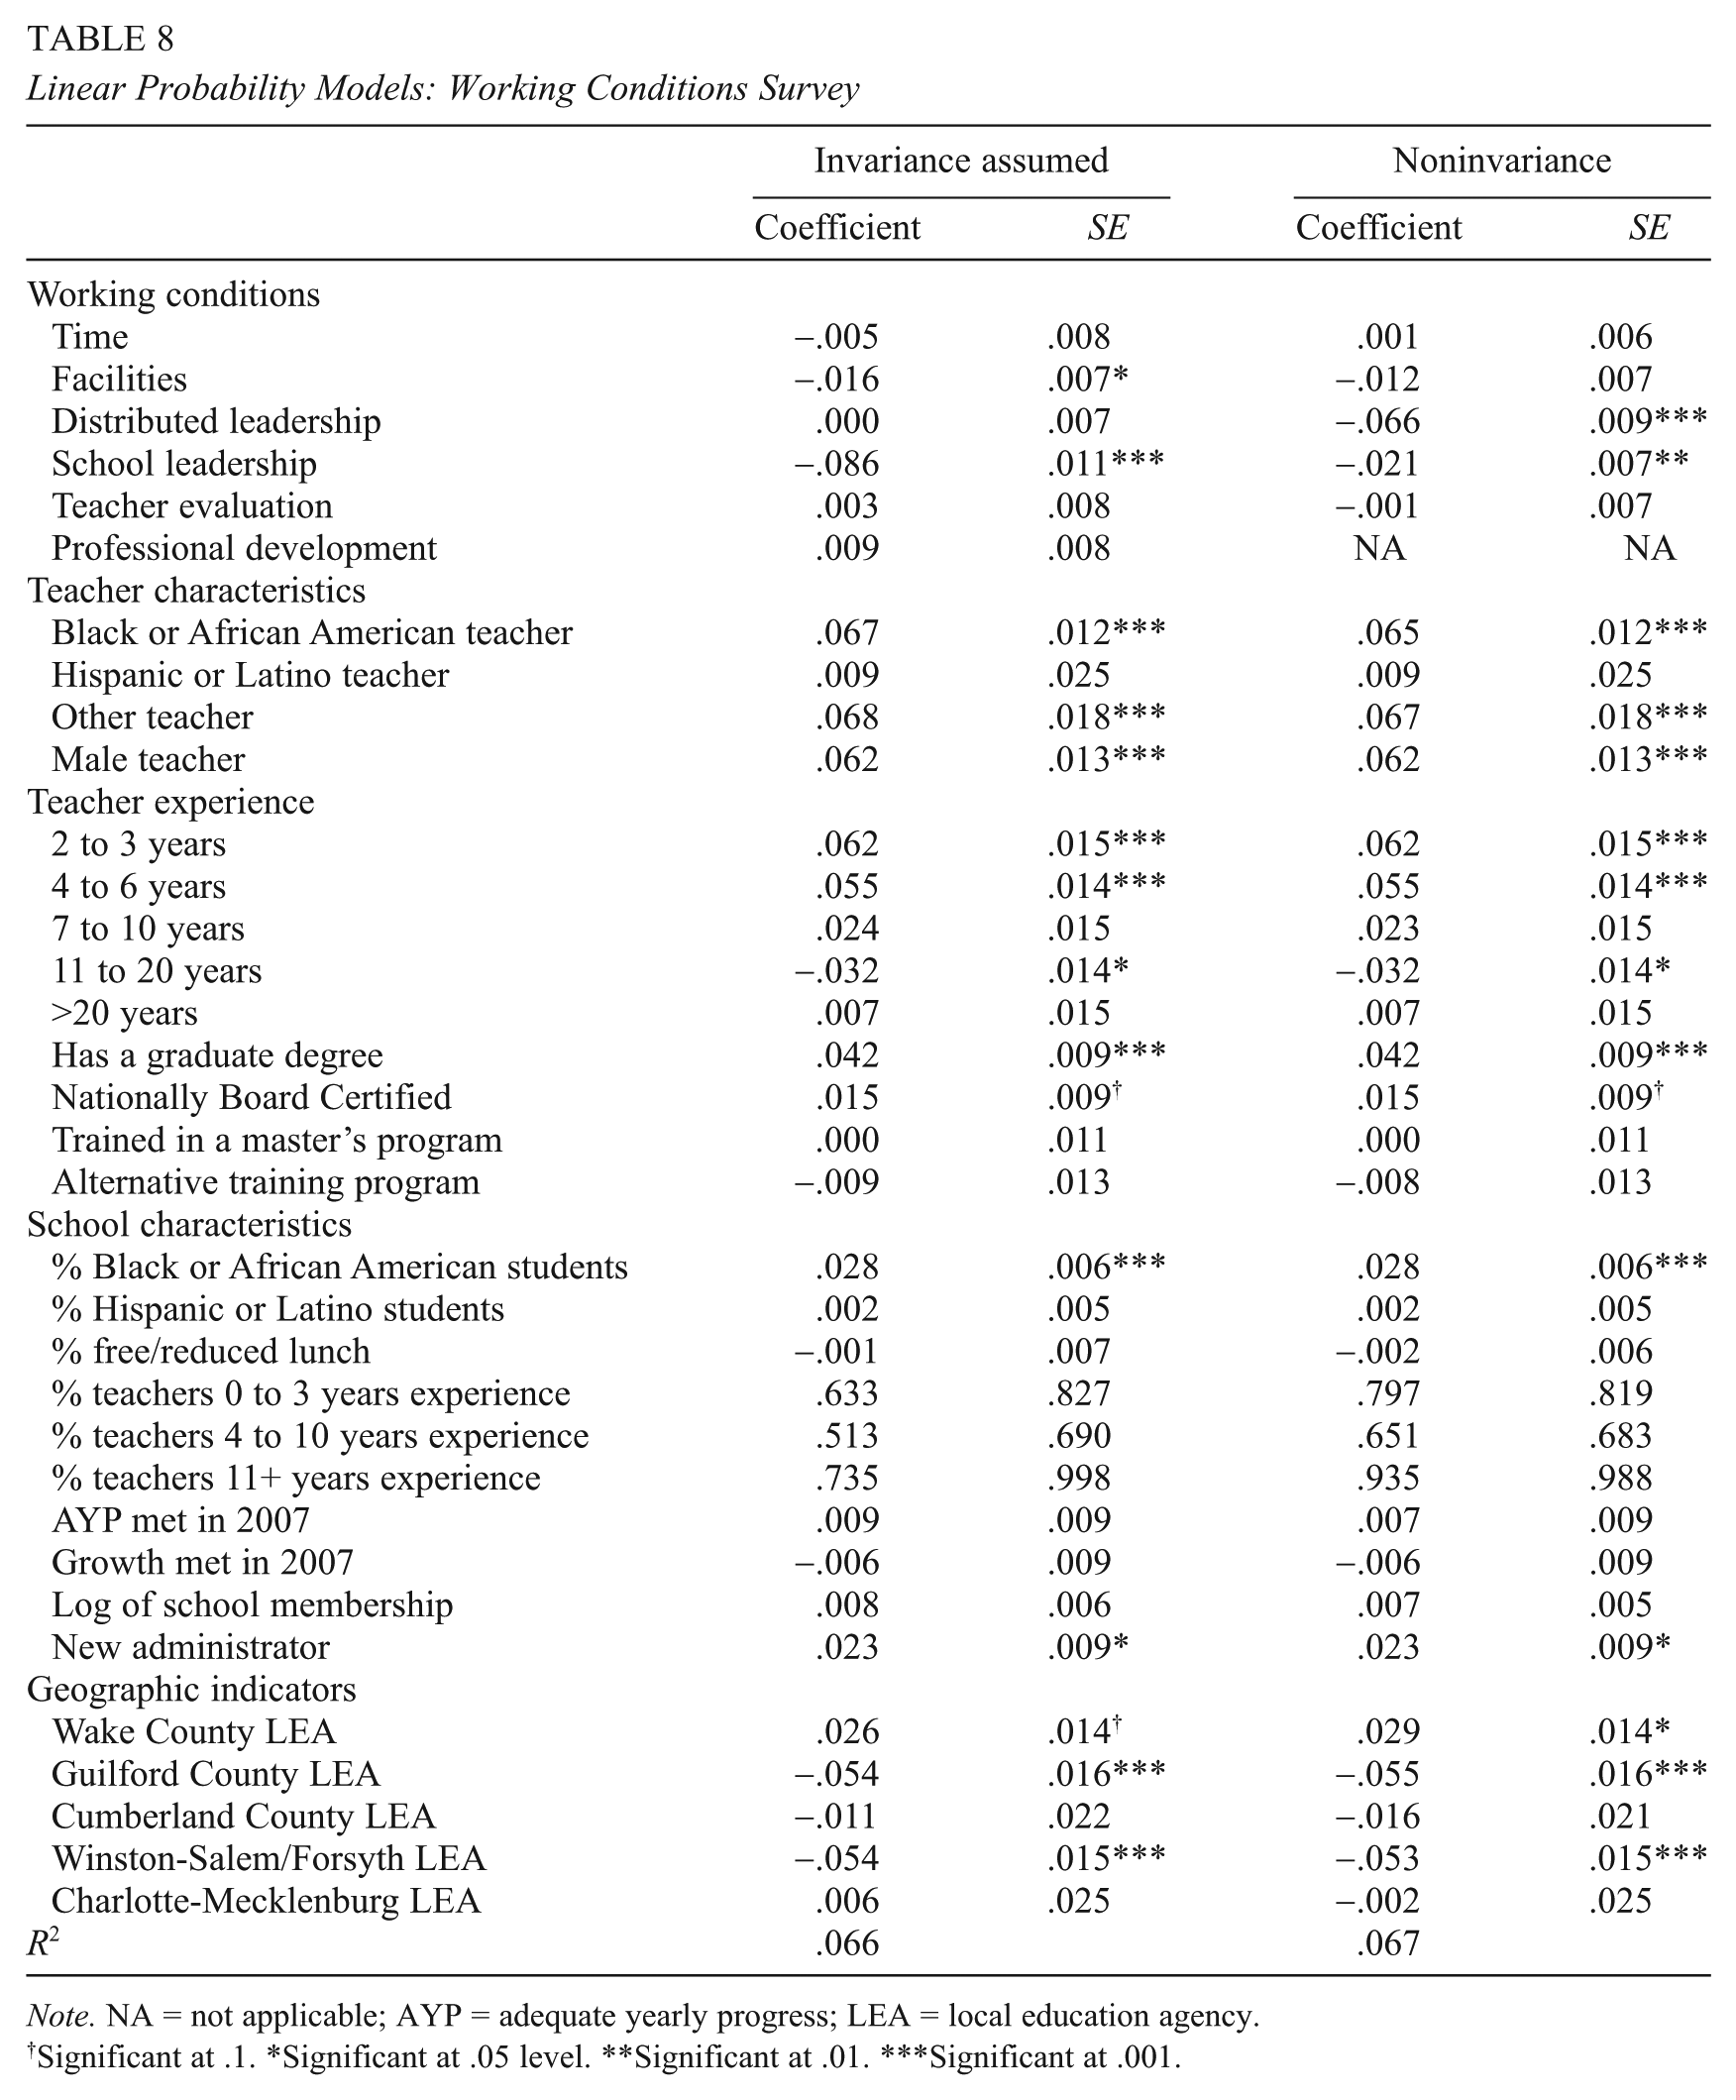
The previous analyses provide clear, policy-relevant illustrations of how the assumption of cross-level invariance may be unjustified in empirical data sets. In addition, the previous analyses suggest that in many studies that assume cross-level measurement invariance, inferences about relationships with external variables may be distorted. In other words, evidence of cross-level measurement invariance may lead to different substantive inferences and policy conclusions. For example, Ladd (2011) concluded, “Among the working conditions factors, the dominant factor, by far, is the quality of leadership” (p. 256). This conclusion was based on an analysis that assumes cross-level measurement invariance. Would conclusions similar to Ladd’s hold if the cross-level noninvariance found in the MEFA were explicitly modeled?
Based on the 2008 WCS data, when cross-level measurement invariance is assumed, and the group means of the factors found by analyzing the disaggregated correlation matrix ST are used as predictors, School Leadership still emerges as the dominant working conditions factor (Table 8). Even with a large number of conditioning covariates, the coefficient of School Leadership suggests that the quality of leadership “protects against intended teacher departures” (Ladd, 2011, p. 248). Thus, when assuming cross-level measurement invariance, the substantive inferences and policy conclusions are consistent with those found by Ladd (2011).
Linear Probability Models: Working Conditions Survey
Note. NA = not applicable; AYP = adequate yearly progress; LEA = local education agency.
Significant at .1. *Significant at .05 level. **Significant at .01. ***Significant at .001.
However, using the same linear probability model with the factors that emerge from the model incorporates cross-level measurement invariance, a different set of conclusions are reached. Importantly, the Distributed Leadership factor emerges as the dominant factor in “protecting against intended departures” (Table 8).
This is consistent with existing research that shows that teacher reports of job satisfaction are positively related to shared responsibility and collaboration in schools (The MetLife Survey of the American Teacher, 2009) and that distributed leadership is positively related to school improvement (e.g., Muijs & Harris, 2003). This finding also marks a critical difference from the analysis based on the assumption of cross-level invariance. In that analysis, the coefficient of the Distributed Leadership factor is not statistically significant.
The factor-score correlations offer further evidence of how multilevel factor analysis can alter policy conclusions (Table 9). First, factor-score correlation patterns can differ; for example, the associations between a school’s Time score and the other working conditions dimensions are systematically weaker for the model that incorporates cross-level measurement invariance compared with a model that assumes cross-level measurement invariance. Second, there is some variation in the strength of association between factor-scores across the two methods (i.e., the relationship between a factor derived from the MEFA and the corresponding factor derived from the single-level EFA). The weakest correlation (.87) is for a school’s Distributed Leadership score. While this is still a substantial relationship, it is also sufficiently low to yield different substantive conclusions about the importance of Distributed Leadership in “protecting against intended teacher departures,” depending on which analytical approach is used.
Factor-Score Correlations: Multilevel and Disaggregated Analyses
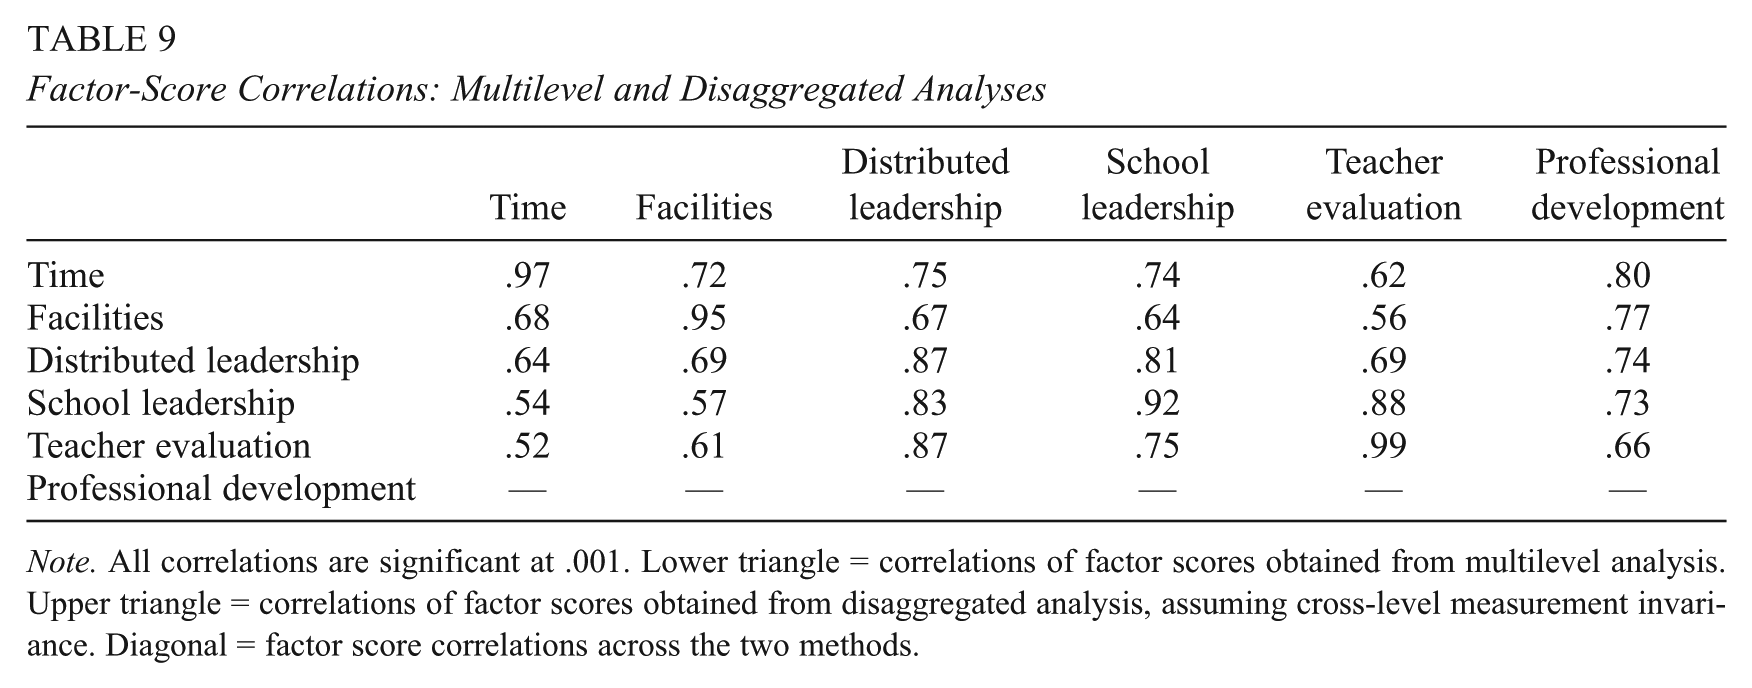
Note. All correlations are significant at .001. Lower triangle = correlations of factor scores obtained from multilevel analysis. Upper triangle = correlations of factor scores obtained from disaggregated analysis, assuming cross-level measurement invariance. Diagonal = factor score correlations across the two methods.
Overall, the fact that the analysis based on an assumption of invariance suggests that Distributed Leadership is not an important predictor of planned teacher departure, and the analysis that incorporates cross-level noninvariance suggests that Distributed Leadership is an important consideration, and illustrates the potential inferential consequences of assuming noninvariance.
Summary
Although awareness of the importance of testing cross-level measurement invariance has been well known in methodological research for nearly a quarter century, analytic methods that assume cross-level invariance are still widely used in the educational policy literature, particularly with regard to school and classroom climate variables that are based on aggregated survey responses. It is common to find studies that make policy recommendations based on single-level factor analyses that ignore the clustered, hierarchical structure of the data, and use linear composites to create individual scores. This article used two examples to investigate whether there is empirical evidence to support the assumption of cross-level measurement invariance, and whether using factor analytic techniques that assume cross-level invariance would influence the analysis of empirical data. The results reflect some general patterns that are worth noting here.
There Can Be Significant Differences in Factorial Structure Across Levels
In these two empirical examples, fewer factors were found at the between-group level than the within-group level of analysis. In the case of the WCS, the multilevel analysis suggested six within-school factors and five between-school factors. In the case of the Tripod Survey, the differences in factorial structure are even greater. While there is support for five factors at the within-classroom level, there is only support for two factors at the between-classroom level.
This exploratory analysis may, as Cronbach (1976) suggested, lead to the articulation of a specific (and independent) theory for constructs that exist and are distinguishable between groups (school or classroom). For example, in the WCS, there are five dimensions of school climate that are distinguishable based on aggregated survey responses. For the Tripod Survey, there are two dimensions of classroom environment that are distinguishable based on aggregated survey responses. This, in fact, is consistent with other factor analyses conducted on the Tripod data, which found that the items from the “Five Support C’s” (Conferring, Consolidating, Captivating, Caring, Clarifying) and Challenge load onto one factor as an “amorphous group” (Ferguson, 2010, p. 6).
Analysis of the Total Correlation Matrix Can Distort Perception of the Between-Level Factorial Structure
The results of the factor analyses on the total correlation matrix did not predictably show concordance with the between-level structure for either survey. In both cases, the structure that was identified bore a strong resemblance to the within structure identified in the multilevel analysis. As there were fewer factors identified at the between level, this can lead to an individualistic fallacy (Alker, 1969), where phenomenon that occurs between individuals are assumed to occur between groups.
Analysis of the Group-Mean Correlation Matrix Can Distort Perception of the Between-Level and Within-Level Factorial Structures
The factor analysis on the unweighted group-mean correlation matrix yielded results that were not consistent in factorial structure with any of the other analyses. While this analysis did suggest five factors for the WCS, the patterns of loadings were different from in either the disaggregated analysis or the multilevel analysis. In the case of Tripod, two factors were identified, but again the patterns of association were not consistent with the between level of the multilevel analysis.
Inferences About Relationships Between School or Classroom Climate and Policy-Relevant Variables May Differ Under the Assumption of Cross-Level Invariance
Linear probability models based on invariance yielded substantively different inferences than those based on noninvariance. Specifically, Distributed Leadership, which did not emerge as an important factor in “protecting against intended departure” in the model assuming cross-level invariance, was the most important factor in the model based on cross-level noninvariance. The identification of shared leadership as an important working conditions factor potentially led to a different set of policy recommendations and could potentially inform a different set of interventions.
Conclusion
The results of this study have direct implications and raise important questions for applied research and policy. Factor analysis is commonly used for rank reduction. Based on the results of a factor analysis, linear composites are created that act as proxies for factors and that may be interpreted directly or included in a range of predictive or inferential statistical analyses. In this kind of analysis, depending on which correlation matrix was analyzed, there may be evidence for completely different linear composites. These composites differ not only in the number of included items but also in the way they would be defined and articulated. This means that, depending on which factor analysis was conducted, different qualities of school or classroom environment would be defined, and entirely different sets of relationships would be explored.
Improperly constructed linear composites make appropriate theory testing difficult if not impossible, with important implications that are not only methodological but also eminently practical. If an intervention targeted at improving retention is found not to have the desired effects, for example, it would be impossible to disentangle “theory failure” from “implementation failure” (Raudenbush & Sadoff, 2008). In other words, it would be impossible to determine if an intervention designed to improve teacher retention failed because it was ill-conceived and based on a faulty model of teacher mobility, or if it failed because the theory was sound but the intervention was implemented poorly. In the first case, policy should address the articulation of a better theory of teacher mobility. In the second case, policy should address mechanisms to support proper implementation.
Footnotes
Acknowledgements
The author is grateful to Joan Herman, Jia Wang, and Noelle Griffin for their support; and to José-Felipe Martinez, Li Cai, and Peter Bentler for their valuable advice and feedback. The author is also grateful to the North Carolina Education Research Data Center for part of the data used in this research.
Author’s Note
The findings and opinions expressed in this report are those of the author and do not necessarily reflect the positions or policies of the Bill and Melinda Gates Foundation or the U.S. Department of Education.
Declaration of Conflicting Interests
The author(s) declared no potential conflicts of interest with respect to the research, authorship, and/or publication of this article.
Funding
The author(s) disclosed receipt of the following financial support for the research, authorship, and/or publication of this article: The research for this article was supported in part by Grant 52306 from the Bill and Melinda Gates Foundation with funding to the National Center for Research on Evaluation, Standards, and Student Testing (CRESST). Part of this research was made possible by a predoctoral advanced quantitative methodology training Grant (#R305B080016) awarded to University of California, Los Angeles (UCLA) by the Institute of Education Sciences of the U.S. Department of Education.
Notes
Author
JONATHAN SCHWEIG is a doctoral student at the University of California, Los Angeles. His research focuses on multilevel modeling, teacher evaluation, and the measurement of classroom environments and processes.