




Abstract
One of the enduring problems in education is the persistence of achievement gaps between White, wealthy, native English-speaking students and their counterparts who are minority, lower-income, or English language learners. This study shows that one intensive technical assistance (TA) intervention—California’s District Assistance and Intervention Teams (DAITs)—implemented in conjunction with a high-stakes accountability policy improves the math and English performance of traditionally underserved students. Using a 6-year panel of student-level data from California, we find that the DAIT intervention significantly reduces achievement gaps between Black, Hispanic, and poor students and their White and wealthier peers. These results indicate that capacity-building TA helps to close achievement gaps in California’s lowest performing districts.
Introduction
A great deal of attention is being paid to disparities in the achievement outcomes between different groups of students and to the closing of these “achievement gaps” in schools and districts across the country (Rebelen, 2011; Tavernise, 2012). Few debate that such achievement gaps, whether between students of different races and ethnicities or of different income levels, exist (Clotfelter, Ladd, & Vigdor, 2009; Fryer & Levitt, 2004, 2006; Reardon, 2011; Reardon & Galindo, 2009; Reardon & Robinson, 2007). High-stakes accountability policies of the sort implemented by states and the federal government over the past two decades focus in large part on closing these achievement gaps by holding schools and districts responsible for all students’ performance on standardized tests. The No Child Left Behind Act (NCLB), for example, requires that all students, regardless of race, ethnicity, or other distinction, score at the proficient level or above on standardized achievement tests. Similarly, federal flexibility waivers to the Elementary and Secondary Education Act (ESEA) allow states greater flexibility in developing accountability systems, but still require state education agencies (SEAs) to provide plans for diminishing performance disparities between subgroups of students.
The theory of action underpinning high-stakes accountability policies holds that by providing clear performance goals and threatening school and district actors with increasingly harsh sanctions for the failure to achieve those targets, these actors will align their incentives with those of the federal and state governments and thus improve student achievement and close achievement gaps between students from different subgroups (Clotfelter & Ladd, 1996; Figlio & Ladd, 2007; O’Day & Smith, 1993). Many assumptions undergird this theory of action, the most important of which may be the assumption that schools and districts have sufficient capacity to not only improve student performance for all students but also to narrow achievement gaps between students of different races and ethnicities and/or income levels by improving the performance of students belonging to particular subgroups.
Although early discussions of educational accountability policies highlighted capacity-building mechanisms as central to their design (Elmore & Fuhrman, 1994; O’Day & Smith, 1993; Smith & O’Day, 1991), capacity-building mechanisms such as the provision of technical assistance (TA) are largely left out of discussions about and implementation of accountability policies. However, a little-discussed and often-overlooked aspect of NCLB, and now of the federal flexibility waivers, mandates that, in addition to sanctions, states must provide TA to build the capacity of struggling schools and districts to help them improve student achievement (NCLB, 2001; U.S. Department of Education, 2012). Under both NCLB and the ESEA flexibility waivers, states are permitted to determine their own TA programs, and accordingly, the content and focus of TA and capacity-building programs vary widely across states (Gottfried, Stecher, Hoover, & Cross, 2011; Weinstein, 2011).
Given the difficulties states, districts, and schools have faced in meeting the achievement goals for all subsets of students under NCLB, this capacity-building TA may be critical to helping states, districts, and schools meet their performance goals and close achievement gaps (Balfanz, Legters, West, & Weber, 2007; Center on Education Policy, 2011). However, most of the accountability research focuses on the impact that the policies’ sanctions for low-performing schools and districts has on student outcomes overall and for students from different subgroups, and few scholars have explored the impact of TA on student achievement (Figlio & Loeb, 2011). Consequently, we know surprisingly little about the efficacy of these interventions in building district capacity to improve student performance and close achievement gaps. Given the expense and the ubiquity of these programs, as well as the current administration’s intent to include TA in the reauthorization of the ESEA, this lack of research is alarming.
In this article, we examine whether the TA and support provided in accordance with NCLB in one state—California—between the 2008–2009 and 2010–2011 school years worked to close the achievement gaps between White students and minority students from different subgroups (Hispanic, Black, and Asian Students), between English language learners (ELLs) and non-ELLs, and between students in poverty (who qualify for federally provided free- or reduced-price lunches [FRLs]) and those who were not. California, like many other states, responded to the NCLB statute that required the provision of capacity-building TA by implementing TA policies that aimed to build district-level capacity in the state’s worst-performing districts—those in Program Improvement Year 3 (PI3) and beyond (Gottfried et al., 2011; Weinstein, 2011). The state gave the lowest performing PI3 districts substantial amounts of funding and required them to contract with state-approved external experts, called District Assistance and Intervention Teams (DAITs), to help them build district capacity to improve student performance. The DAITs worked closely with district administrators to assess why the district was failing to increase student achievement and to develop and implement targeted reforms to improve student outcomes. The state gave the remaining PI3 districts a lesser amount of funding and required them to access TA from more traditional providers who were not required to provide the same level of support to districts and were not as highly regulated by the California Department of Education (CDE). The state did not give districts in PI2 and below any additional funding or require them to access any external TA. Although DAITs and non-DAIT TA providers understood that to meet NCLB Adequate Yearly Progress (AYP) goals they must close achievement gaps and show improvement for students from all subgroups, the state did not instruct them specifically to focus their work on these goals.
Specifically, in this article, we ask, “Did DAITs help low-performing school districts to close achievement gaps by improving the achievement of NCLB-relevant subgroups?” Our work focuses on the impact of DAITs on reducing achievement gaps during the intervention and in the first year after the intervention for the first cohort of DAIT district. Given NCLB’s and the current administration’s focus on ensuring improvements for all students, and the importance of closing achievement gaps for underserved students’ future success (Figlio & Loeb, 2011; O’Day & Smith, 1993), this question is particularly salient. To evaluate the efficacy of DAITs in closing student achievement gaps, we use a 6-year panel of data from California’s student-level administrative data set (from 2005–2006 to 2010–2011) that tracks approximately 29.1 million student-year observations across approximately 9,000 schools and 1,000 districts, including the 95 districts that are designated as PI3 and received some form of TA. We use a panel difference-in-difference regression design, estimating the impact of DAITs on various subgroups’ performance on the math and English language arts (ELA) California Standards Tests (CSTs) relative to non-DAIT TA in the first 3 years of program implementation. We find that minority and poor students performed particularly well in DAIT districts, and that the DAIT intervention appeared to diminish existing achievement gaps by approximately 8% to 13% over the course of 3 years. We do not find differential improvement for ELL students compared with non-ELL students in DAIT districts, although both experienced a positive response to the intervention. These findings suggest that the TA and supports provided by the intensive DAIT intervention not only increase average student performance in the receiving districts (Strunk, McEachin, & Westover, 2012) but also help to improve the performance of the relevant subgroups tracked by NCLB to a greater extent than for White and higher-income students, thus reducing existing achievement gaps.
This article proceeds as follows: The section “Background and Brief Literature Review” briefly reviews the limited literature on both accountability policies’ and district-level capacity-building reforms’ attention to distinct subgroups of students and provides background on the provision of TA associated with NCLB. The section “California’s Provision of TA to Low-Performing Districts” reviews the TA provided to California PI3 districts and focuses in greater detail on the DAIT intervention. The section “Do DAITs Diminish Achievement Gaps in Low-Performing Districts?” then outlines the data and methods used to assess the differential effects of DAITs relative to non-DAIT TA on the achievement of subgroups of students, and provides results. The “Discussion and Conclusion” concludes by discussing the implications of our findings as well as opportunities for future research.
Background and Brief Literature Review
One of the primary goals of education policy interventions over the last five decades has been to close persistent achievement gaps between Hispanic and Black and White students, and to a lesser extent between students of low and high socioeconomic status (SES). It appears that the Black–White math and ELA achievement gap has narrowed since the 1970s, but the gaps remain quite large (approximately 0.6 to 0.7 standard deviations [SDs]; Reardon & Robinson, 2007). However, it appears that while the Hispanic–White gap is smaller than the Black–White gap, it has not narrowed over the same time period (Reardon & Galindo, 2009; Reardon & Robinson, 2007). Less is known about the achievement gap between low- and high-SES students, but the current research indicates that this achievement gap has actually widened in recent years (Reardon, 2011). Furthermore, research is as yet unclear about the causes of the achievement gap, and the proportion of the gaps that can be attributed to between-school factors, within-school factors, and to nonschool factors (Clotfelter et al., 2009; Fryer & Levitt, 2004, 2006; Hanushek & Rivkin, 2009; Reardon & Robinson, 2007).
This uncertainty regarding the specific causes of these persistent achievement gaps may explain why the gaps remain large and the difficulties policymakers and educators face in successfully implementing educational interventions to close the achievement gap. Accountability policies, such as NCLB, are one such example of policymakers attempting to close persistent achievement gaps through the use of incentives and sanctions (O’Day & Smith, 1993). These policies explicitly require schools and districts not only to improve overall student achievement but also to improve the performance of underserved subgroups of students. Although an increasing amount of research examines the efficacy of these high-stakes accountability policies in improving overall student performance, little work examines the impact of such policies on students from various backgrounds and the closing of achievement gaps. The research that studies the efficacy of accountability policies as a whole largely finds that NCLB and similar state-specific high-stakes accountability reforms lead to increases in average student achievement, especially in math (Carnoy & Loeb, 2002; Chiang, 2009; Dee & Jacob, 2011; Figlio & Rouse, 2006; Hanushek & Raymond, 2005; Ladd & Lauen, 2010; Rockoff & Turner, 2010; Rouse, Hannaway, Goldhaber, & Figlio, 2007). However, the few studies that do examine the impact of high-stakes accountability policies on the performance of subgroups of students paint a less clear picture.
Early work that explores this issue generally finds that pre-NCLB accountability policies led to the narrowing of the achievement gap between Hispanic and/or Black and White students (Carnoy & Loeb, 2002; Hanushek & Raymond, 2005). More recent quasi-experimental studies that evaluate the effect of NCLB on subgroups’ math and ELA achievement provide mixed evidence regarding the efficacy of NCLB for subgroup performance and the closing of achievement gaps (Dee & Jacob, 2011; Figlio, Rouse, & Schlosser, 2009; Gaddis & Lauen, 2012; Hemelt, 2011; Lauen & Gaddis, 2012; Wei, 2012; Wong, Cook, & Steiner, 2009). For instance, in an evaluation of the effect of NCLB on student achievement across all 50 states, Dee and Jacob (2011) find that the overall effect of NCLB is larger for Hispanic, Black, and poor students than it is for White and higher-income students. However, in a specific study of NCLB’s impact on achievement gaps, Reardon, Greenberg, Kalogrides, Shores, and Valentino (2013) find little evidence that the policy has meaningfully narrowed achievement gaps over the past decade. Studies using data from a single state find that the accountability pressure from failing to meet a subgroup’s Annual Measurable Objectives (AMOs) leads to improvements in that subgroup’s achievement, especially in math (Hemelt, 2011; Lauen & Gaddis, 2012). For example, Lauen and Gaddis (2012) found that after North Carolina’s implementation of NCLB’s subgroup provisions, Hispanic, Black, and poor students who attended schools that failed their specific subgroup AMOs experienced significant increases in math and ELA achievement relative to Hispanic, Black, and poor students who attended schools that met their specific subgroup AMOs. More recent work by the same authors suggests that NCLB accountability also reduced Black–White achievement gaps in North Carolina, although gaps between other subgroups are not explored (Gaddis & Lauen, 2012). Studies in other states have found that the subgroup provisions in NCLB neither lead to improvements in subgroup achievement nor significantly narrow the achievement gap (Figlio et al., 2009; Lee, 2006; Lee & Reeves, 2012; Wei, 2012).
For schools and districts to parlay high-stakes accountability policies into improvements in student performance that diminish achievement gaps, states must assist in building the capacity of school and district actors (Hamilton, Berends, & Stecher, 2005; Opper, Henry, & Mashburn, 2008; Stecher et al., 2008). However, SEAs may not have the requisite skills or capacity to help districts and schools implement instructional reforms. SEAs generally have little experience with direct interventions into schools or with the local organizational networks that can help districts work with schools and other local education actors (Slotnick, 2010; Sunderman & Orfield, 2007). Because of this, many states are working with independent TA providers or intermediary organizations to help them assist districts in building their capacity for reform. Twelve states including California have made contracting with an intermediary organization (such as a DAIT) a mainstay of their plans to help school districts make instructional reforms (Weinstein, 2011). Although the details of these plans differ by state, the main idea is that the SEAs require or encourage districts in need of improvement to contract with an intermediary organization that will help the district assess their needs, generate improvement plans, and implement improvement strategies. A key element of these state plans is their focus on working with intermediary organizations to build district-level capacity to address problems and issues, not just to assist in solving a specific problem or problems.
Although these intermediary organizations are becoming important actors in the provision of TA and capacity-building services for states and districts failing to meet targets set under high-stakes accountability policies, little research examines the efficacy of these external service providers in improving student achievement. Moreover, few studies address the impact of intermediary organizations—or any TA at all—on diminishing achievement gaps by improving the performance of students from important traditionally underserved groups, such as minorities, ELLs, and students in poverty. The limited research on the impacts of TA in general on subgroup performance finds that states and districts have focused their energies on improving instructional practices for low-performing subgroups, but little is known about the impact of such changes (Stecher et al., 2008). Given the growing prevalence of such capacity-building interventions, the lack of attention to the efficacy of these TA providers in improving student performance and closing achievement gaps is alarming. We attempt to address this gap in the research by examining the impact of external intermediary organizations in improving the achievement of NCLB-relevant subgroups and closing achievement gaps in one state—California—relative to the impact of more traditional TA.
California’s Provision of TA to Low-Performing Districts
By the start of the 2008–2009 school year, California had 248 districts in Program Improvement, and of these, 95 (approximately 10% of all California school districts) were classified as PI3 or higher—signifying districts that had failed to make AYP for at least 4 years. 1 All PI3 districts received the same overall sanction (Corrective Action Six, which required them to “institute and fully implement a new curriculum that is based on state academic content and achievement standards”; California State Senate, 2004). In addition, the California Legislature passed Assembly Bill 519 in 2008, which supplied funding to allow districts to access TA based on the severity of the districts’ achievement problems. Since districts in PI1 and PI2 were not required to access TA, no funding was provided to help them to do so. Districts in PI3 received funding, which was to be used to pay for TA (or part of the costs of TA), based on the number of schools in PI3 or higher in the district. Reports from our qualitative work with districts and providers indicate that the funding was often insufficient to cover the total expense of the TA (Westover & Strunk, 2010). The state disbursed funding for DAITs and non-DAIT TA in one lump sum at the beginning of the 2-year intervention and instructed districts to use it all within that time frame to pay for the DAIT or non-DAIT TA.
Within the PI3 category, the CDE classified districts as in need of “intensive,” “moderate,” or “light” assistance. These distinctions were based on an algorithm that took into account the districts’ Academic Performance Index (API) score and relative growth over time, AYP indicators (levels), and the number of PI schools in the district, based on district aggregate data. The CDE labeled the lowest performing districts based on the performance algorithm as in “intensive” need of assistance, and deemed the midranking PI3 districts in “moderate” need of assistance. The CDE required both Intensive and Moderate PI3 districts to work with DAITs and provided them with $150,000 and $100,000 per PI3+ school, respectively. The CDE provided the highest ranking PI3 districts (light districts) with only $50,000 per PI3+ school and required them to contract with their choice of non-DAIT TA provider. In the first year of implementation of the TA intervention (2008–2009), the CDE classified 43 PI3 districts as in “intensive” or “moderate” need of assistance based on their 2007–2008 performance and required them to work with DAIT providers. The remaining 52 PI3 districts received non-DAIT TA.2,3
DAITs are state-approved intermediary organizations that work to provide support to help build the capacity of low-performing PI3 districts while providing the state with informal formative feedback and recommendations. The role of the DAITs during the intervention under study was to provide TA to build districts’ capacity to assess and solve their own problems, not just to provide TA for specific district problems. To be placed on the state-approved list of providers, DAITs must have demonstrated expertise in leadership, academic subject areas, meeting the needs of ELLs and students with disabilities (SWDs), and building district capacity. The list of approved DAIT providers available during the first cohort of the intervention included Government agencies, primarily County Offices of Education (COEs), as well as for-profit and nonprofit organizations. These entities participated in state training events designed to facilitate and inform their work with districts. In the first years of the intervention, 24 districts worked with COEs and 19 worked with private organizations.
The CDE expected the DAITs to assess district needs in nine “essential program components” as well as eight overarching areas relating to district governance, operations, instruction, and culture. DAITs were to first engage with their district to diagnose district needs, usually using assessment instruments provided by CDE, and then write up their findings in a capacity study. Districts then submitted these capacity studies to CDE and were required to write their Local Education Agency (LEA) plan (or plan addendum) to incorporate the recommendations provided in the capacity studies. Next, the CDE expected DAITs to support districts in preparing their plans, and to provide specific support for implementing the recommendations they had provided with the goal of accelerating and increasing student achievement (California County Superintendents Educational Services Association, 2008; Westover & Strunk, 2012).
In essence, DAITs were expected to provide human capital to the districts in the form of additional knowledge to implement reforms, political and social ties to other organizations and networks, and assistance with shaping the administrative infrastructures of the districts to leverage reforms. Surveys of the DAITs and their districts addressed the extent to which DAITs provided several different types of services to serve these purposes. 4 As shown in Online Appendix Table A1 (available at http://epa.sagepub.com/supplemental), a strong majority of DAIT/district teams reported that the DAIT supported the revision of LEA (District) plans/addendums (91%), collaborated with the district to create a comprehensive needs assessment (83%), effectively diagnosed district needs and priorities (91%), and had direct and open communication concerning DAIT recommendations with the district cabinet (92%) and school board (85%). In addition, approximately three quarters of survey respondents reported that the DAIT supported the alignment of the districts’ single plans for student achievement (SPSA) with the LEA plan, had regular and open communication concerning DAIT recommendations with noncabinet and board stakeholders, and assisted in developing positive, trusting working relationships throughout the district.
Surveys and interviews indicate that DAITs focused to a great extent on building district capacity in governance and professional development for teachers and principals; improving district interactions with and support of school sites to ensure consistent instructional practice; and providing additional or improved instructional interventions, particularly in math. Although the DAITs performed these common activities, results from surveys of DAIT providers and district administrators in treated districts indicate that the specific activities and reforms implemented by districts with DAITs varied substantially across districts, according to DAIT-identified district needs (Strunk et al., 2012; Westover & Strunk, 2012). In addition to the activities listed above, DAITs and district leaders reported that they also worked during the intervention to address deficiencies in the following areas: data systems and monitoring; curriculum, instruction, and assessment; governance; English Language Development; students with disabilities; parent and community involvement; professional development; and fiscal operations and human resources. No DAITs specifically noted that they worked with districts to close achievement gaps between White and minority subgroups, ELLs and non-ELLs, or low-income and wealthier students.
The other set of PI3 districts, those classified as in need of “light” assistance, received a narrower form of TA. Specifically, these districts were given less funding per PI3 or higher school and were required to use the funds to work with one or more TA providers of their choosing. The tasks expected of the non-DAIT TA providers were much less clear than those set forth for DAITs, and districts were able to hire TA providers to address district-identified issues. The state exerted less oversight over these non-DAIT TA providers than over TA providers. Because of this reduced oversight and because of funding constraints in our study, we know far less about the qualifications and actions of non-DAIT TA providers than we do about DAIT providers. From limited survey responses from non-DAIT TA providers, it appears that they were most likely to provide professional development for teachers and training to increase the use of student data to improve instructional practices. 5 In all, the main difference between the DAIT and the non-DAIT TA was that the former was charged with building districts’ capacity for future reforms and interventions, whereas the latter was charged with solving districts’ immediate and specific problems with less emphasis on building districts strengths for the future.
The TA (DAIT or non-DAIT) intervention was only intended to last for 2 years. The first cohort of 43 DAIT and 52 non-DAIT TA districts received the intervention in the 2008–2009 and 2009–2010 school years. Because the districts were instructed to begin working with DAITs or other TA providers immediately during the 2008–2009 school year, the impact of the intervention should theoretically have been seen as early as the 2008–2009 end-of-year achievement tests. This study follows the first cohort of PI3+ districts through the 2-year intervention and the first year of outcomes after the intervention ended. This allows us to assess the DAIT impact both during the intervention and once the DAITs have left the districts, after the intervention and the funds associated with it are removed.
Do DAITs Diminish Achievement Gaps in Low-Performing Districts?
The main intent of this study is to determine the impact of the DAIT intervention on the achievement outcomes of students in various traditionally underserved subgroups: Black students, Hispanic students, students who qualify for the federal FRL program (an indicator for poverty), and ELLs. In this section, we first discuss the data used in these analyses. We next outline the panel differences-in-differences estimation strategy employed to answer our questions regarding the efficacy of the DAITs in improving math and ELA achievement for students in various subgroups. We then discuss the results of these analyses and limitations with our estimation strategy. Finally, we show how DAITs, by improving ELA and math achievement for students in traditionally underserved subgroups, help to close achievement gaps in California’s lowest performing districts.
Data
We begin with data on all students in California public schools in Grades 2 to 11 from 2005–2006 through 2010–2011 school years for whom test scores are available in either math or ELA. These data include approximately 29.1 million student-year observations. Of these students, approximately 4% are dropped from our data set because they have missing or duplicate IDs. We are forced to drop approximately an additional 6% of students from the data set because they either (a) only appear in our data set for 1 year (2%) or (b) they showed abnormal patterns of grade progression between years (4%). Once we have excluded students based on these reasons, we are left with approximately 26.3 million total student-year observations in our full 6-year sample (from the 2005–2006 school year to the 2010–2011 school year). 6
To ensure that we are not systematically missing student data from specific districts, we examine missing observations across district types. Specifically of interest to our article is whether or not districts with DAITs are missing more or fewer students than districts with non-DAIT TA, or than districts that are in PI2, PI1, or non-PI status. We find that there do not appear to be wide discrepancies in the proportion of students who are missing across district PI status types. Specifically, we are missing 14% of students from Intensive DAIT districts, 13% of students from Moderate DAIT districts, and 11% of students from non-DAIT TA districts. We then narrow our sample to the 95 districts identified as in Program Improvement 3 or higher status in 2008–2009 that received TA in Cohort 1 of the intervention. Our final data set consists of 8.2 million student-year observations across the 6-year panel of data.
We take our student outcome data (Math and ELA scores on the CSTs) and student characteristics (race/ethnicity, poverty status, ELL status) from this student-level California data set, along with information on the specific district in which students are enrolled. Throughout the analyses, we complement the CDE’s student-level data set with public school- and district-level data available from the CDE’s website. Variables used from the public data set include school level (elementary, middle, or high school), the proportion of minority students enrolled in a school, the proportion of ELL and special education students enrolled in a district, school size (enrollment), schools and district PI status, and the number of AYP criteria to which districts are held under NCLB. The latter serves as an indicator of district diversity. 7
Estimation Strategy
The intent of our analysis is to assess the possibility of differential treatment effects for specific student populations. We are specifically interested in the impact of the DAIT intervention on the Hispanic–White, Black–White, ELL–non-ELL, and low-income–non-low-income achievement gaps. 8 To do this, we want to compare student achievement outcomes in districts that received the DAIT intervention to a proper counterfactual. One way to do this would be to compare the performance of districts that received the DAIT intervention with the same districts’ performance before they were assigned the intervention. However, it is possible and even likely that some common factor impacted all California districts, or all California districts in PI3, over that period of time. If this is the case, then a simple interrupted time-series analysis could attribute some positive or negative trend in student performance over the time period to the intervention, rather than to the secular California-wide trend. Because of this, we would also like to compare students in districts that received DAITs with students who were likely similar to these students but were enrolled in districts that did not receive the intervention. To do this, we utilize a difference-in-difference methodology that compares students in treated (DAIT districts) to students in untreated districts (non-DAIT TA districts) both before the onset of the intervention and after. Because the non-DAIT TA districts were also in PI3 at the start of the intervention, they faced the same accountability threat and sanctions as the DAIT districts. This makes them a particularly appropriate comparison group to enable us to determine how students in DAIT districts would have performed without the intervention, as essentially the only policy difference between these two groups is the provision of the additional funding and support from DAIT versus non-DAIT TA.
We use a set of panel difference-in-difference regressions with controls for student, school, and districts characteristics, and district and time fixed-effects to isolate the differential effect of the DAIT intervention on students’ math and ELA achievement (Angrist & Krueger, 1999; Angrist & Pischke, 2009; Ashenfelter & Card, 1985; Imbens & Wooldridge, 2009; Reback, 2010; Strunk et al., 2012). An examination of simple descriptive statistics confirms that districts that were required to contract with DAITs have lower-performing students, on average, in both math and ELA, than do districts that contracted with non-DAIT TA providers. To account for this in our models, we include students’ lagged ELA or math achievement 9 and district fixed-effects so that we are effectively predicting the difference in the average within-district achievement growth for students in DAIT versus non-DAIT TA districts, controlling for differences in students’ prior achievement and time-invariant observed and unobserved differences between the districts. 10 These difference-in-difference estimates should provide unbiased estimates of the effect of the DAIT intervention if students’ lagged achievement and district fixed-effects account for the nonrandom sorting of students to DAIT and non-DAIT TA districts.
We take advantage of the variation in students’ pre- and postintervention achievement, controlling for students’ prior achievement and district and year fixed-effects to find the differential treatment effect estimates. The coefficient on the interaction term between the DAIT treatment indicator and the student subgroup indicator variables (β2) provide the estimate of the differential impact of DAITs on students belonging to the traditionally lower-performing subgroups:

where Yisdt is the standardized ELA or Math CST test score for student i in school s in district d in year t. 11 DAITdt is the time-varying treatment indicator for districts that receive the DAIT intervention. The DAIT indicator takes a 1 in 2008–2009, 2009–2010, and 2010–2011 for districts that received the DAIT intervention, and it takes a zero otherwise. Subisdt is an indicator that takes a 1 for the subgroup of interest (e.g., Hispanic, Black, ELL, or low-income students), and a 0 for the reference group (e.g., White, non-ELL, or non-low-income students). To make direct comparisons of the achievement gaps of interest, we run four separate models that include only those students specific to the achievement gaps: Hispanic–White, Black–White, ELL–non-ELL, and low-income and non–low-income. For instance, in our first comparison, we are interested in the effect of the DAIT intervention on the Hispanic–White achievement gap. Accordingly, we run Model 1 only for Hispanic and White students, and interact the DAIT treatment indicators with an indicator for Hispanic students, allowing White students to serve as the reference group. We follow the same procedure for the three other gaps. In this analysis, we are most concerned with the coefficient β2. A positive and significant β2 indicates that there is a differential positive impact of the DAIT intervention on the subgroup’s achievement relative to the reference group, and, in turn, indicates that the DAIT intervention is closing the achievement gap. It is important to remember that the identification strategy we use inherently compares students in districts with DAITs to students in districts with non-DAIT TA. As such, our interaction terms can be interpreted as the additional positive benefit (or negative consequence) of being situated in a DAIT district for students in the given subgroup relative to the majority group.
Xisdt is a vector of student characteristics including indicators for students’ ELL or FRL status and students’ disability status and students prior achievement Yisd,t−1. Due to multicollinearity concerns, we can only include two of the three indicators for students’ race, FRL, and ELL status in the same model. For the Hispanic–White, Black–White, and ELL–non-ELL achievement gap models, we include indicators for students’ race (or ELL status) and FRL status. In the FRL–non-FRL achievement gap model, we include indicators for students FRL and ELL status. The results are the same if we use the omitted indicator. Ssdt is a vector of school controls, including the natural log of school enrollment, the percent of minorities within the school, and indicators for high and middle schools (elementary schools are the reference category). Z dt is a vector of district control variables, including measures of the percent of ELL students enrolled in districts, the percent of special education students within the district, and the number of AYP criteria for the district. We do not include district-level measures of student minority or poverty status, as they are highly correlated with students’ race/ethnicity at the school level (with correlation coefficients of approximately .70). δ d and τ t are district and time fixed-effects, respectively. ε isdt is an idiosyncratic error term. All standard errors are clustered to the district level.
The specification of the difference-in-difference Model 1 makes two important assumptions. First, it aggregates the impact of the DAIT relative to non-DAIT TA across all three postintervention years—the two treatment years (2008–2009 and 2009–2010) and the third year (2010–2011), after DAITs and non-DAIT TA providers were no longer contracted to be working with the districts. As a result, important variation across treated years may be hidden by the estimation of an “average treatment effect.” Second, Model 1 assumes that the secular trend (the time fixed-effects) for the reference and subgroup of interest is the same regardless of treatment status. This second assumption may cause our results from Equation 1 to be biased if achievement gaps in districts working with DAITs were starting to close during the pretreatment period, or if the subgroup of interest in DAIT districts had positively and statistically significantly differing trends than students in the same subgroup in the non-DAIT TA districts. To investigate the potential for our results from Model 1 to hide variation over treatment time and/or to be biased by the existence of different pretreatment trends among the students in the reference group and subgroup of interest in the DAIT and non-DAIT TA districts, we estimate a more flexible difference-in-difference specification:

Equation 2 contains the same dependent variable (Yisdt), control vectors (Xisdt,Ssdt,Zdt) as the first specification, and district and time fixed-effects δ d and τt. However, in Equation 2, we replace the time-varying treatment indicator, DAITdt, with a time-invariant indicator, DAITd. This new indicator takes a value of 1 in all years for districts that would receive the DAIT treatment, and a 0 in all years for districts that would receive non-DAIT TA. τ t is a vector of time fixed-effects for the school years 2007–2008 through 2010–2011 with 2006–2007 as the reference year. As in Equation 1, the time fixed-effects estimate the secular trend in Math and ELA achievement for all students, regardless of treatment status. The interaction between the student subgroup indicator and the time fixed-effects (Subisdt*τ t ) allows the secular trend to differ for the subgroup of interest. The main coefficient of interest is the vector which provides the difference-in-difference estimate for the additional impact of the intervention on the subgroup relative to the reference group in each year t. 12 Again, the preintervention time period is 2006–2007 (reference year) and 2008–2009. The postintervention time period spans 2008–2009 through 2010–2011. Each year is modeled separately in Equation 2. A statistically significant positive in the pretreatment years would indicate that the achievement gap between the reference group and the subgroup of interest was already closing in DAIT districts relative to the same gap in non-DAIT TA districts. A statistically significant positive in the posttreatment years, as with Model 1, indicates that the DAIT intervention had an additional effect on the subgroup of interest, and the intervention was closing the achievement gap between the two groups of students in the DAIT districts. We are also interested in the vector of coefficients, which represent the average achievement differences for the reference students (White, non-ELL, and noneligible for FRLs) in DAIT districts relative to the reference students in the non-DAIT TA districts in both pre- and posttreatment years. If these coefficients are significant and positive in the pretreatment period, it may indicate that the students in the reference group were already experiencing improvements in achievement relative to the reference students in the non-DAIT TA districts.
Results
We first sketch simple line graphs of the achievement gaps in DAIT and non-DAIT districts for all four of our comparison groups. Figures 1 through 4 show the average standardized Math CSTs for DAIT and non-DAIT TA districts for students in the four achievement gaps of interest. In all figures, the subgroups are plotted in dashed lines, whereas the reference groups are shown as solid lines. Subgroup-reference pairs in DAIT districts are shown in black lines with circle markers, and pairs in non-DAIT TA districts are shown in grey lines with triangle markers. We see that in all four figures, Hispanic, Black, ELL, and low-income students had significantly lower standardized math CST scores than their White, non-ELL, and non-FRL eligible peers in both DAIT and non-DAIT TA districts across all 6 years of data. The figures also show a general narrowing of the achievement gap between these subgroups and their White, non-ELL, and non-FRL counterparts. In addition, these simple line graphs also show that the Hispanic, Black, ELL, and low-income students in DAIT districts had larger positive gains in the treatment years 2009 and 2010 than the same subgroups in the non-DAIT TA districts. This suggestive evidence implies that the DAIT intervention may have reduced the achievement gaps for these subgroups. Figures 5 through 8 display a similar, but smaller, pattern for standardized ELA achievement.
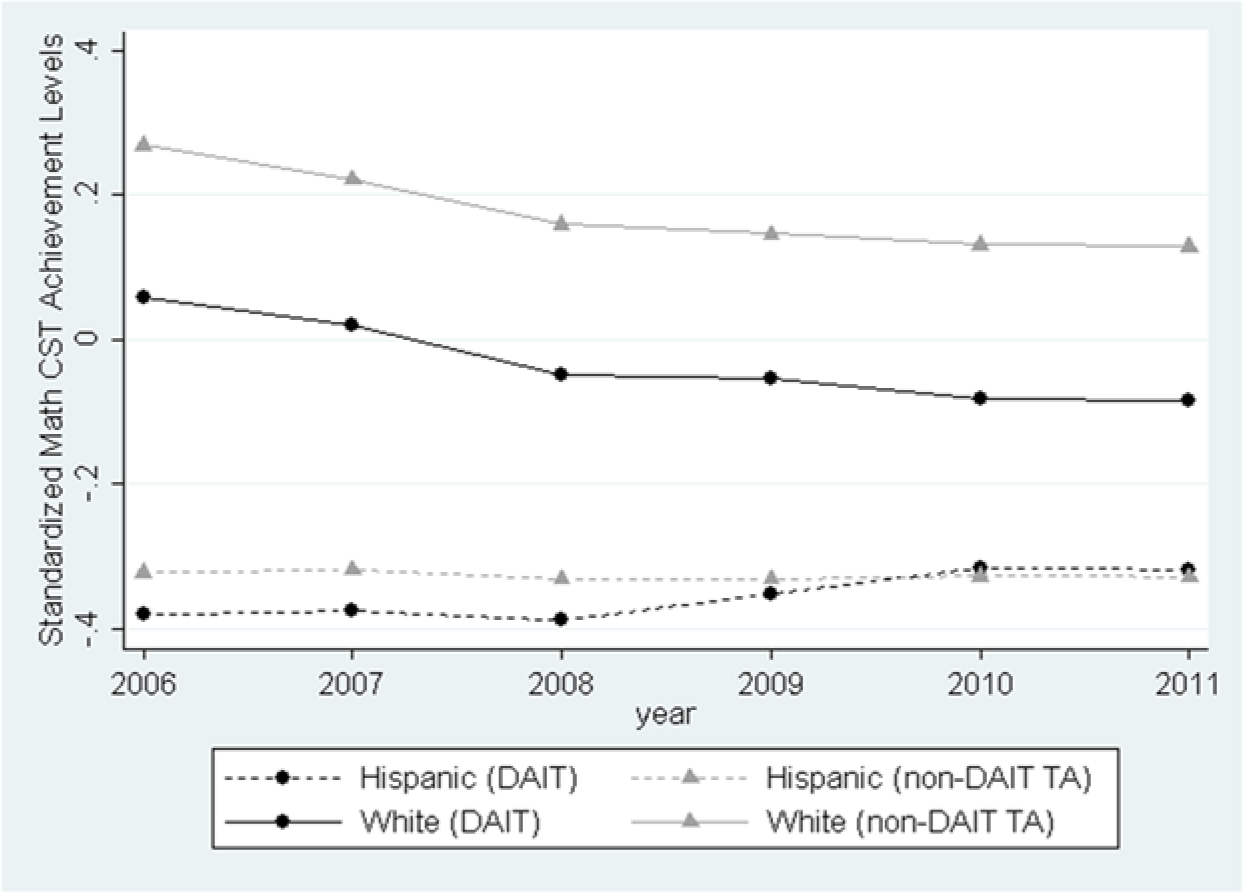
Hispanic and White math achievement, 2006 to 2011.
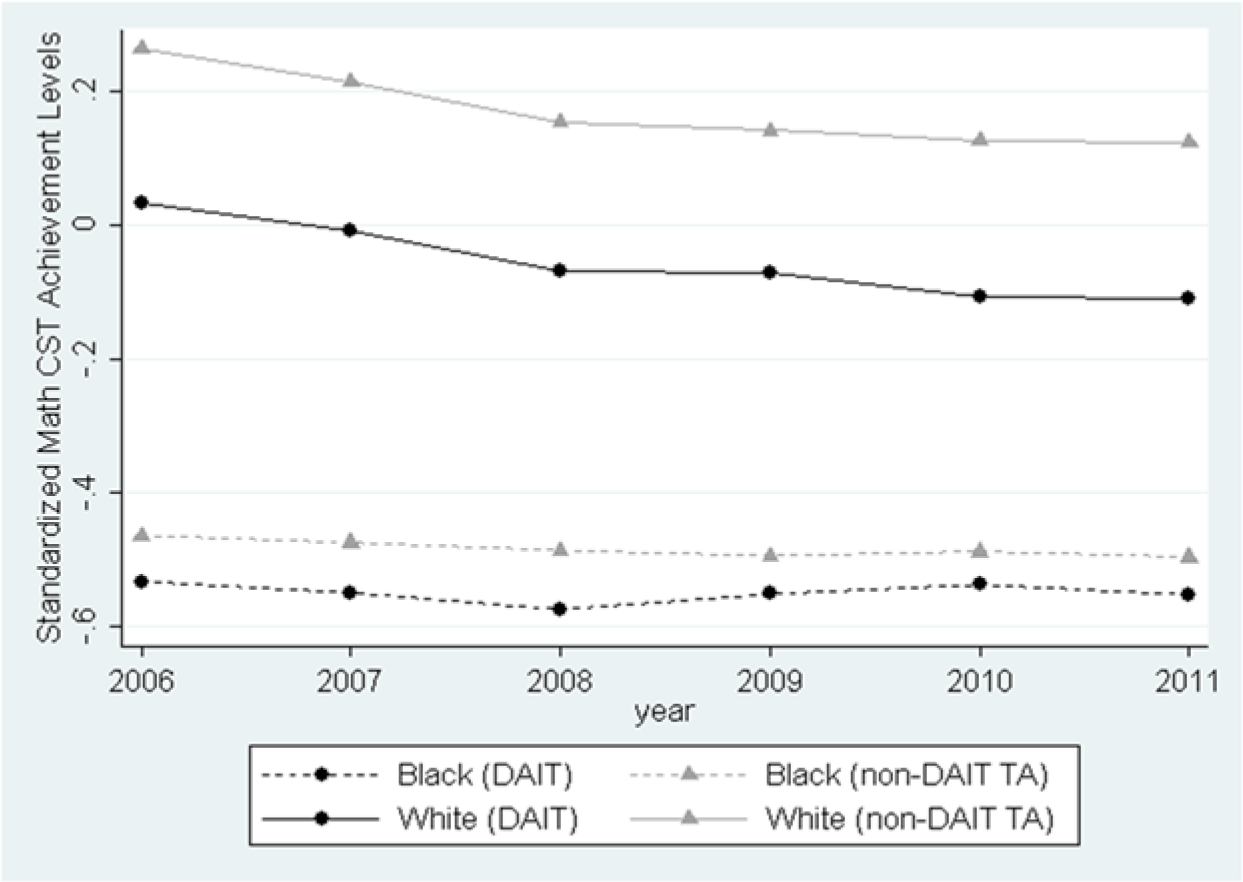
Black and White math achievement, 2006 to 2011.
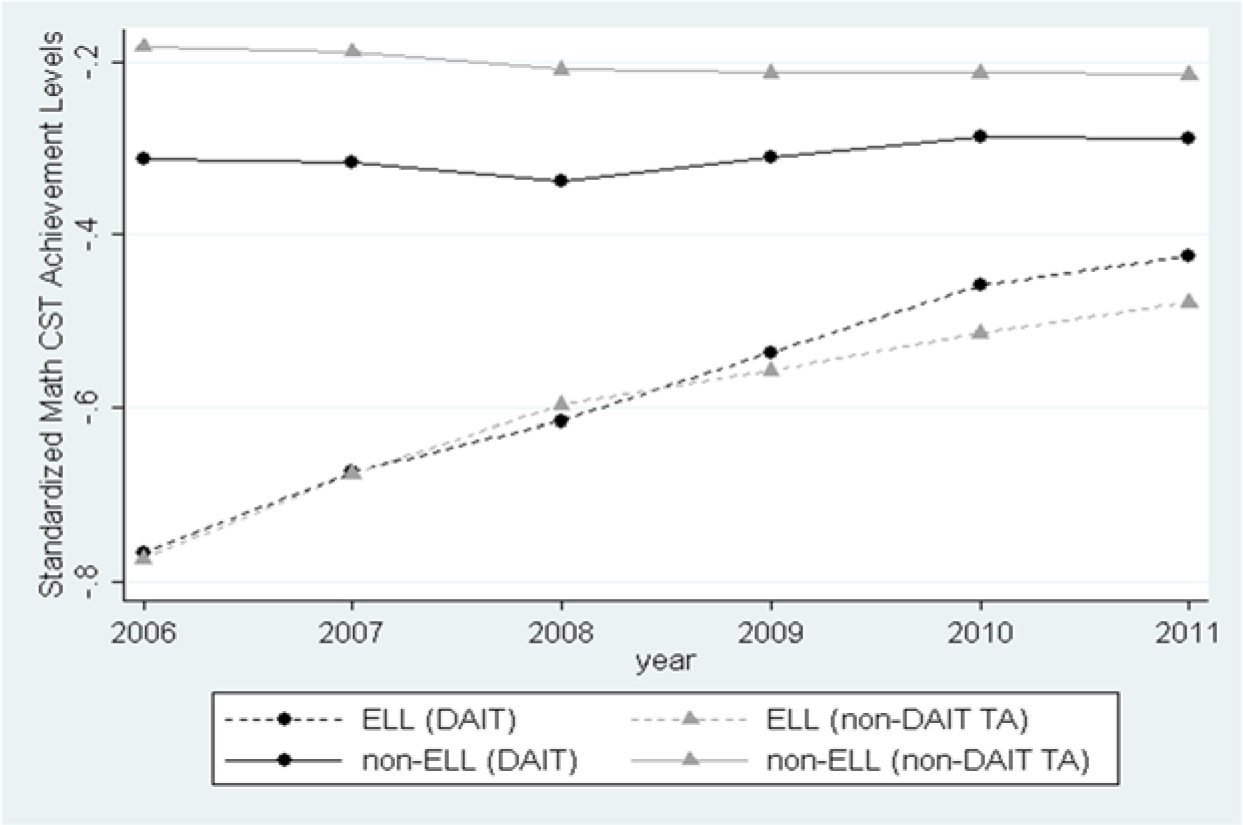
ELL and non-ELL Math Achievement, 2006 to 2011.
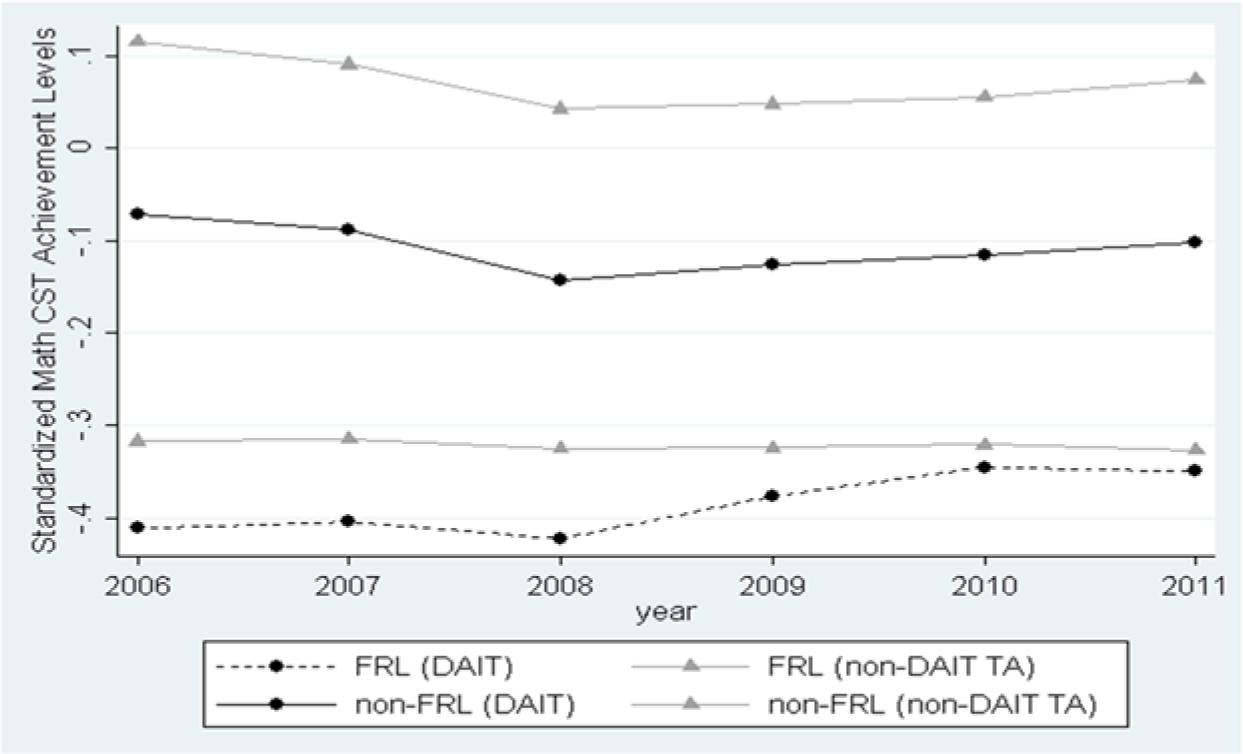
FRL and non-FRL Math Achievement, 2006 to 2011.
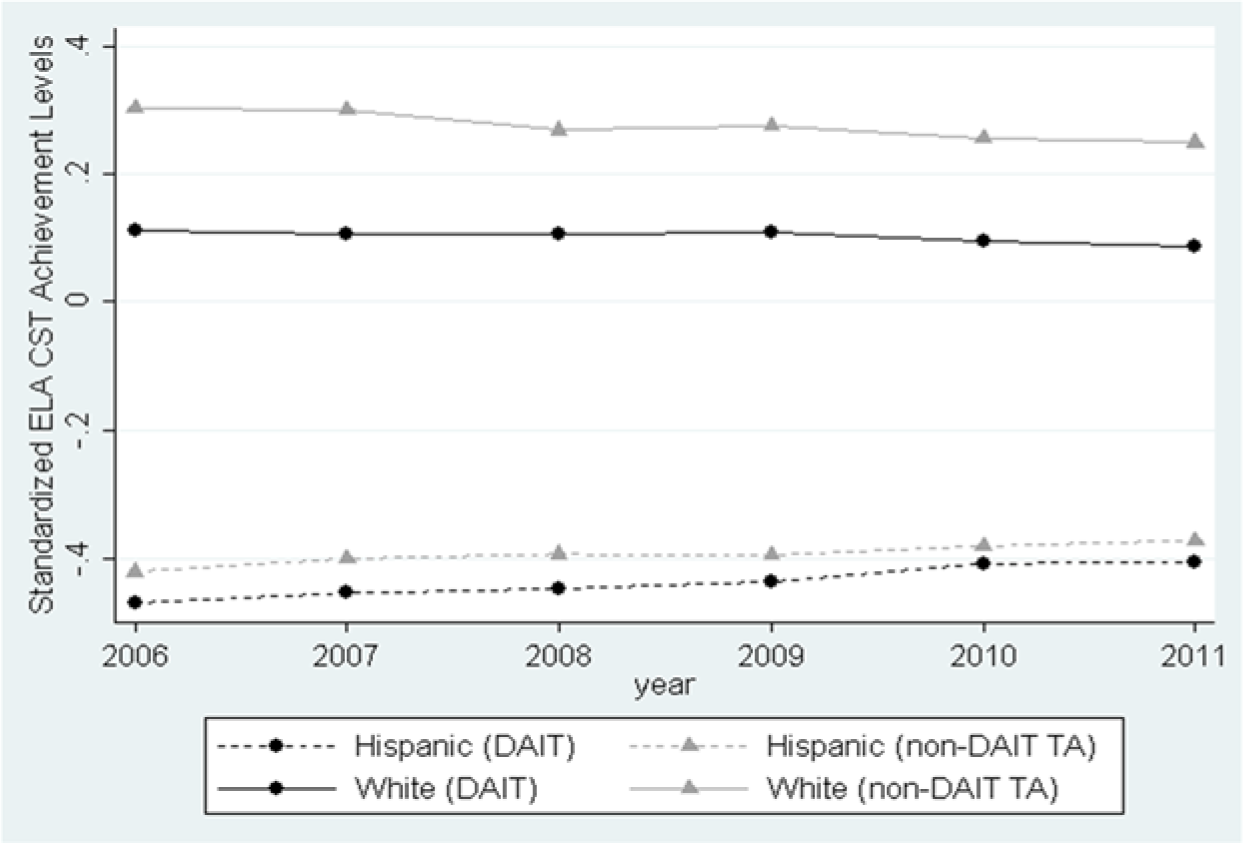
Hispanic and White ELA Achievement, 2006 to 2011.

Black and White ELA Achievement, 2006 to 2011.
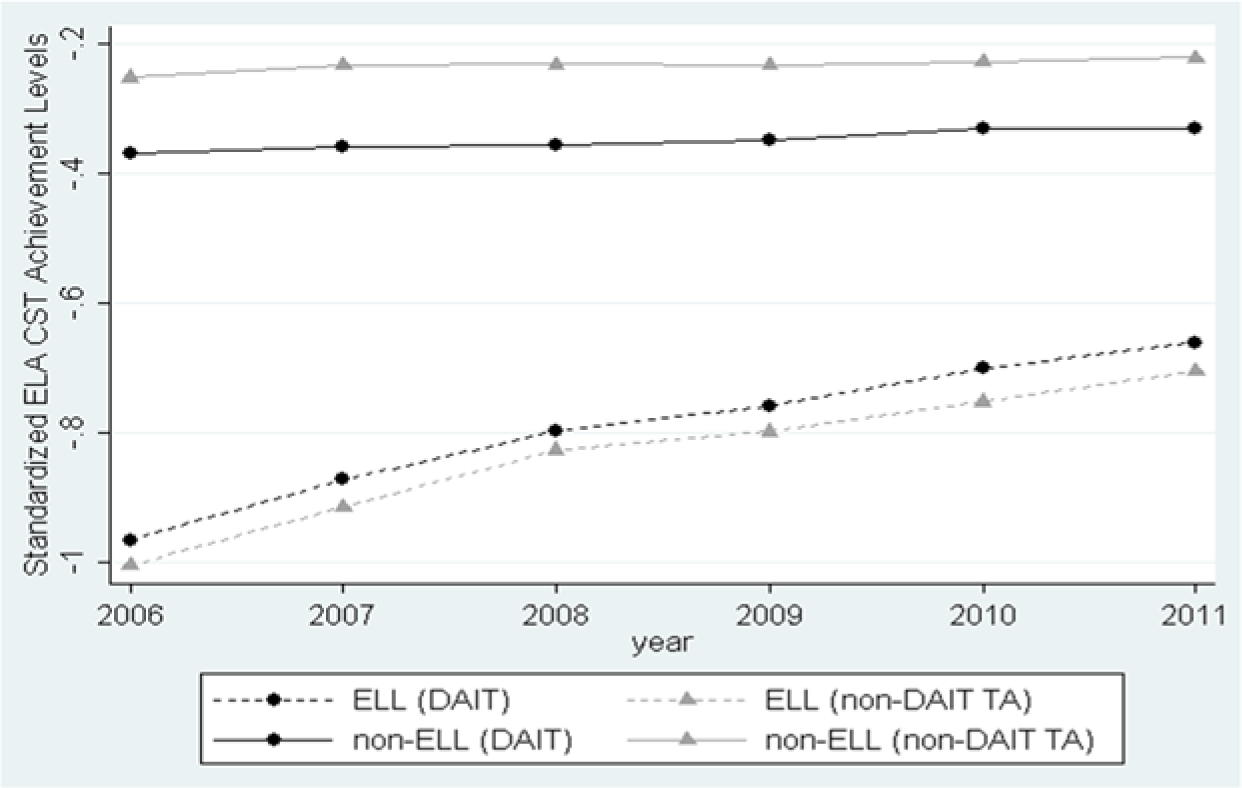
ELL and non-ELL ELA Achievement, 2006 to 2011.
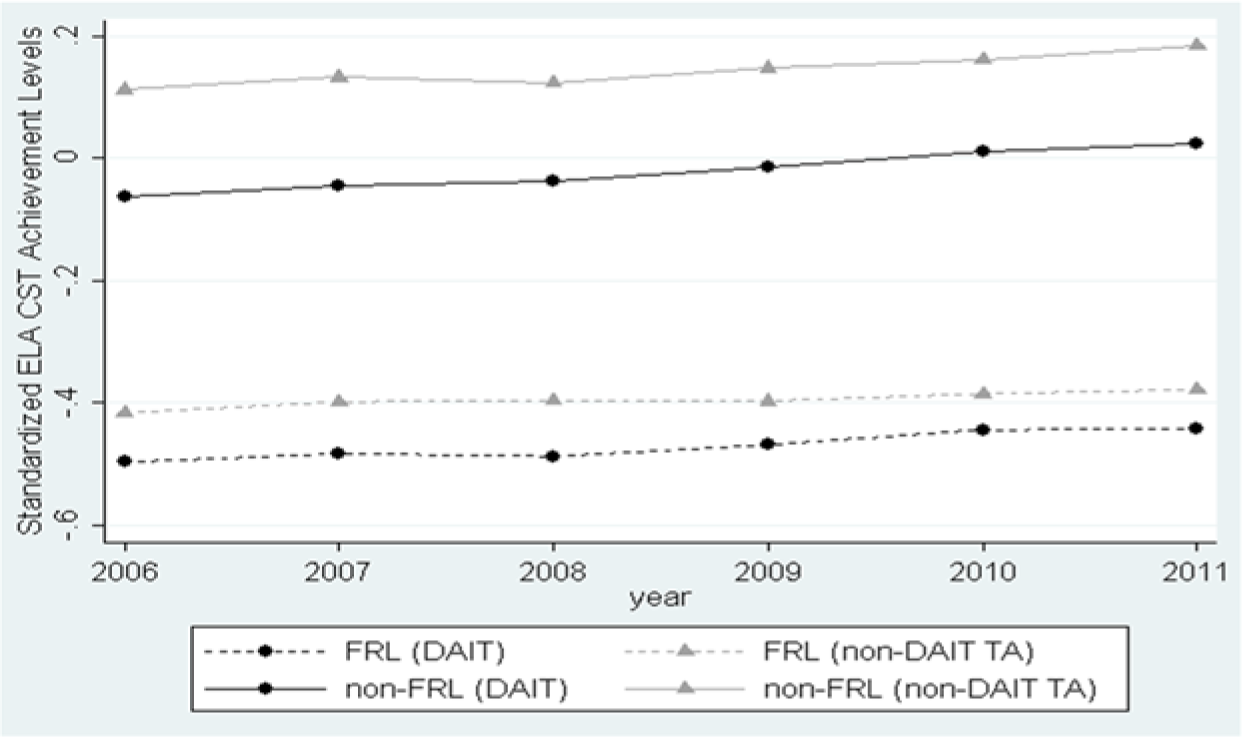
FRL and non-FRL ELA Achievement, 2006 to 2011.
Although the descriptive information indicates a possible impact of the DAIT intervention on the achievement gaps of interest, the results may be driven by differences between the DAIT and non-DAIT districts not accounted for in the descriptive analysis. The differences-in-differences estimation strategy outlined above should account for such trends and provide unbiased estimates of the effect of the DAIT intervention on closing achievement gaps, relative to districts with non-DAIT TA. Table 1 shows estimates from Model 1 of the overall 3-year average effect of DAIT support on the math and ELA achievement of students from different minority subgroups, relative to White non-ELL, and non-FRL students (who serve as the reference categories). The coefficients on the DAIT indicator for the 3-year average effect (β1 in Model 1) are mostly insignificant for math and ELA, indicating that the DAIT intervention does not have a significant impact on White non-ELL and non-FRL student achievement in both math and ELA. However, it appears that Hispanic, Black, ELL, and FRL students in DAIT districts perform better in math over the three postintervention years on average, shown by the β2 coefficient in Model 1.
Differential Impact of the DAIT Intervention on Standardized Math and ELA CST Scores (2006–2007 to 2010–2011)
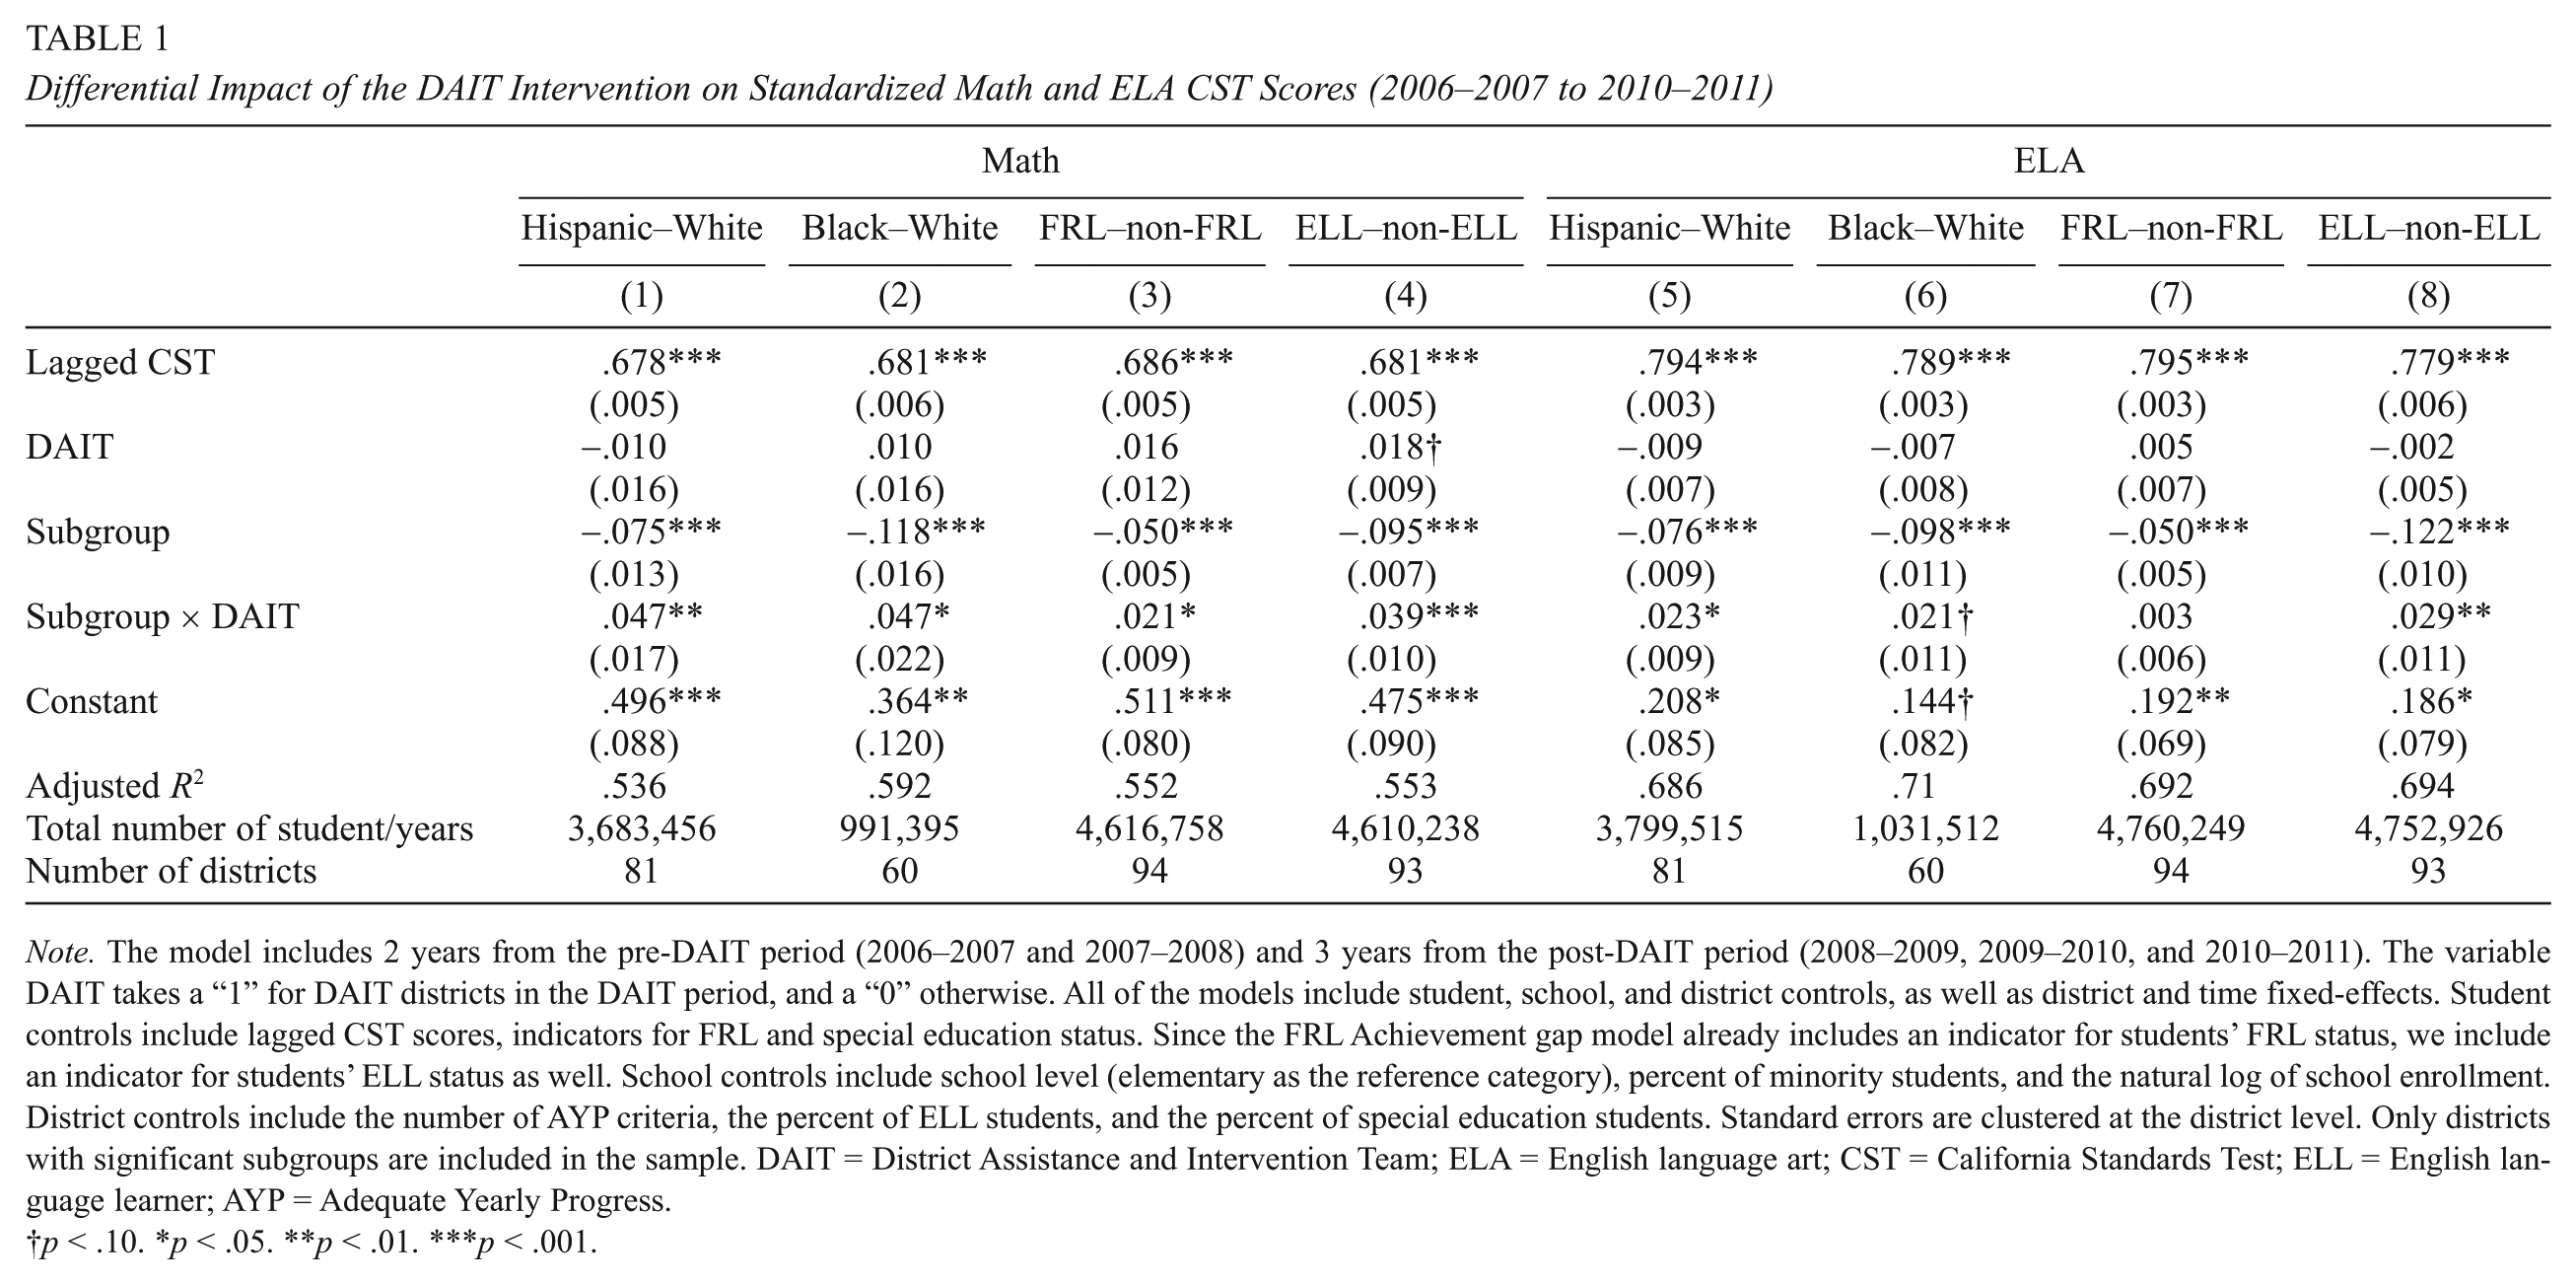
Note. The model includes 2 years from the pre-DAIT period (2006–2007 and 2007–2008) and 3 years from the post-DAIT period (2008–2009, 2009–2010, and 2010–2011). The variable DAIT takes a “1” for DAIT districts in the DAIT period, and a “0” otherwise. All of the models include student, school, and district controls, as well as district and time fixed-effects. Student controls include lagged CST scores, indicators for FRL and special education status. Since the FRL Achievement gap model already includes an indicator for students’ FRL status, we include an indicator for students’ ELL status as well. School controls include school level (elementary as the reference category), percent of minority students, and the natural log of school enrollment. District controls include the number of AYP criteria, the percent of ELL students, and the percent of special education students. Standard errors are clustered at the district level. Only districts with significant subgroups are included in the sample. DAIT = District Assistance and Intervention Team; ELA = English language art; CST = California Standards Test; ELL = English language learner; AYP = Adequate Yearly Progress.
p < .10. *p < .05. **p < .01. ***p < .001.
Column 1 of Table 1 shows that DAITs improve Hispanic students’ achievement by 4.7% of an SD increase in math relative to White students. In the 2007–2008 school year, the average Hispanic–White math achievement gap in DAIT districts was −0.324 SDs on average, indicating that the DAIT intervention reduced the achievement gap by 14% for math over the 2 years of the intervention and the year after. This finding is particularly important from a policy perspective in California, where Hispanic students are the largest minority subgroup, and often the most disadvantaged. 13 Column 2 shows that DAITs also improve Black students’ math achievement scores by approximately 4.7% of an SD over the 3 years of data relative to White students. Using the average 2007–2008 Black–White math achievement gap in DAIT districts of −0.427 SDs, we find that the DAIT intervention reduced the math achievement gap by 11%. That the overarching positive DAIT impact on district math scores is due to increases in Hispanic and Black students’ performance rather than by increases just in White students’ performance may indicate that the TA is helping districts to close achievement gaps between minority and White students.
Table 1 also shows results for the impact of DAITs on low-income and ELL students’ math achievement (columns 3 and 4). Column 3 shows that DAITs increase the math achievement of low-income students. Students who qualify for the federal FRL program see a 2.1% SD increase in their math achievement relative to students not in poverty. Given that the 2007–2008 math achievement gap between students who did and did not qualify for the federal lunch program was −0.169 SDs, on average, the DAIT intervention reduced the FRL–non-FRL achievement gap by 12% in math. These results indicate that the DAITs may help districts to improve the achievement of their more disadvantaged students rather than focusing on students from wealthier homes. Column 4 shows that there is a slight positive impact (at the .10 level) of DAITs on students who are not ELLs, and a larger and more significant positive effect for ELL students. ELL students in DAIT districts perform approximately 3.9% of an SD better in math achievement over the 3 years than do non-ELL students. With an average 2007–2008 ELL–non-ELL achievement gap of −0.271 SDs, it appears that the DAIT intervention reduced the ELL–non-ELL achievement gap by 14% in math. These results are particularly important in states like California, in which schools and districts are struggling to face the unique needs of their growing ELL populations.
The right panel of Table 1 presents our results from the same analyses, this time using student ELA achievement as the outcome of interest. We find similar results for the impact of DAITs on diminishing achievement gaps in ELA and in math, although the ELA results are often of lesser magnitude. Specifically, column 5 shows that DAITs improve Hispanic students’ ELA achievement by 2.3% of an SD relative to White students over the 3 years of the study, which translates into a 5% reduction of the Hispanic–White ELA achievement gap (which was −0.545 SDs, on average, in 2007–2008). Similarly, DAITs improve Black students’ ELA performance on the CSTs by 2.1% of an SD over the 3 years, thereby reducing the average achievement gap (−0.479 SDs in 2007–2008) by 4%. This average impact is only significant at the .10 level. Column 7 shows that there is no significant impact of DAITs on the ELA achievement gap between low-income and non–low-income students, relative to the gap found in non-DAIT TA districts. However, column 8 shows that the achievement gap between ELL and non-ELL students decreases in DAIT districts. Specifically, we see that the ELA achievement of ELL students in DAIT districts increases by 2.9% of an SD over the 3 years of the study.
It is encouraging that DAITs appear to diminish important achievement gaps in low-performing California school districts. It is possible, however, that these average decreases in the gaps are driven by one or another treatment year. If this is the case, then valuable lessons may be learned about the intervention and its efficacy that may be useful for future iterations of the DAIT or similar reforms. In addition, pretreatment changes in instruction or other practices within the districts that worked with DAITs may have started narrowing the achievement gaps before the start of the intervention. If this is true, then our results would attribute the positive impact of the DAIT intervention on the achievement gaps of interest to factors unrelated to the intervention.
To examine variation in impact over treatment years and to assess the possibility of nontreatment factors impacting the validity of our treatment effect estimates, we estimate Model 2 with separate year effects for DAIT districts, subgroups of interest, and the three-way interaction among DAIT districts, year effects, and the subgroup of interest. The results are presented in Tables 2 and 3. For the most part, the results from Model 2 uphold the average treatment results presented in Table 1 (Model 1). However, three interesting patterns emerge from this analysis. We first start with pretreatment trends. We see that the Black–White, FRL–non-FRL, and ELL–non-ELL achievement gaps were not closing in low-performing PI3 districts in the 2007–2008 school year (shown in Tables 2 and 3, titled “Subgroup × DAIT × (2008)”). In addition, the Hispanic–White achievement gap in ELA was not closing in the 2007–2008 school year. However, there is some evidence that the Hispanic–White math achievement gap was lessening before the onset of the DAIT intervention. However, this relationship is only significant at the p < .10 level. 14
Fully Specified Difference-in-Difference Estimate of the DAIT intervention on Standardized Math CST Scores (2007–2006 to 2010–2011)
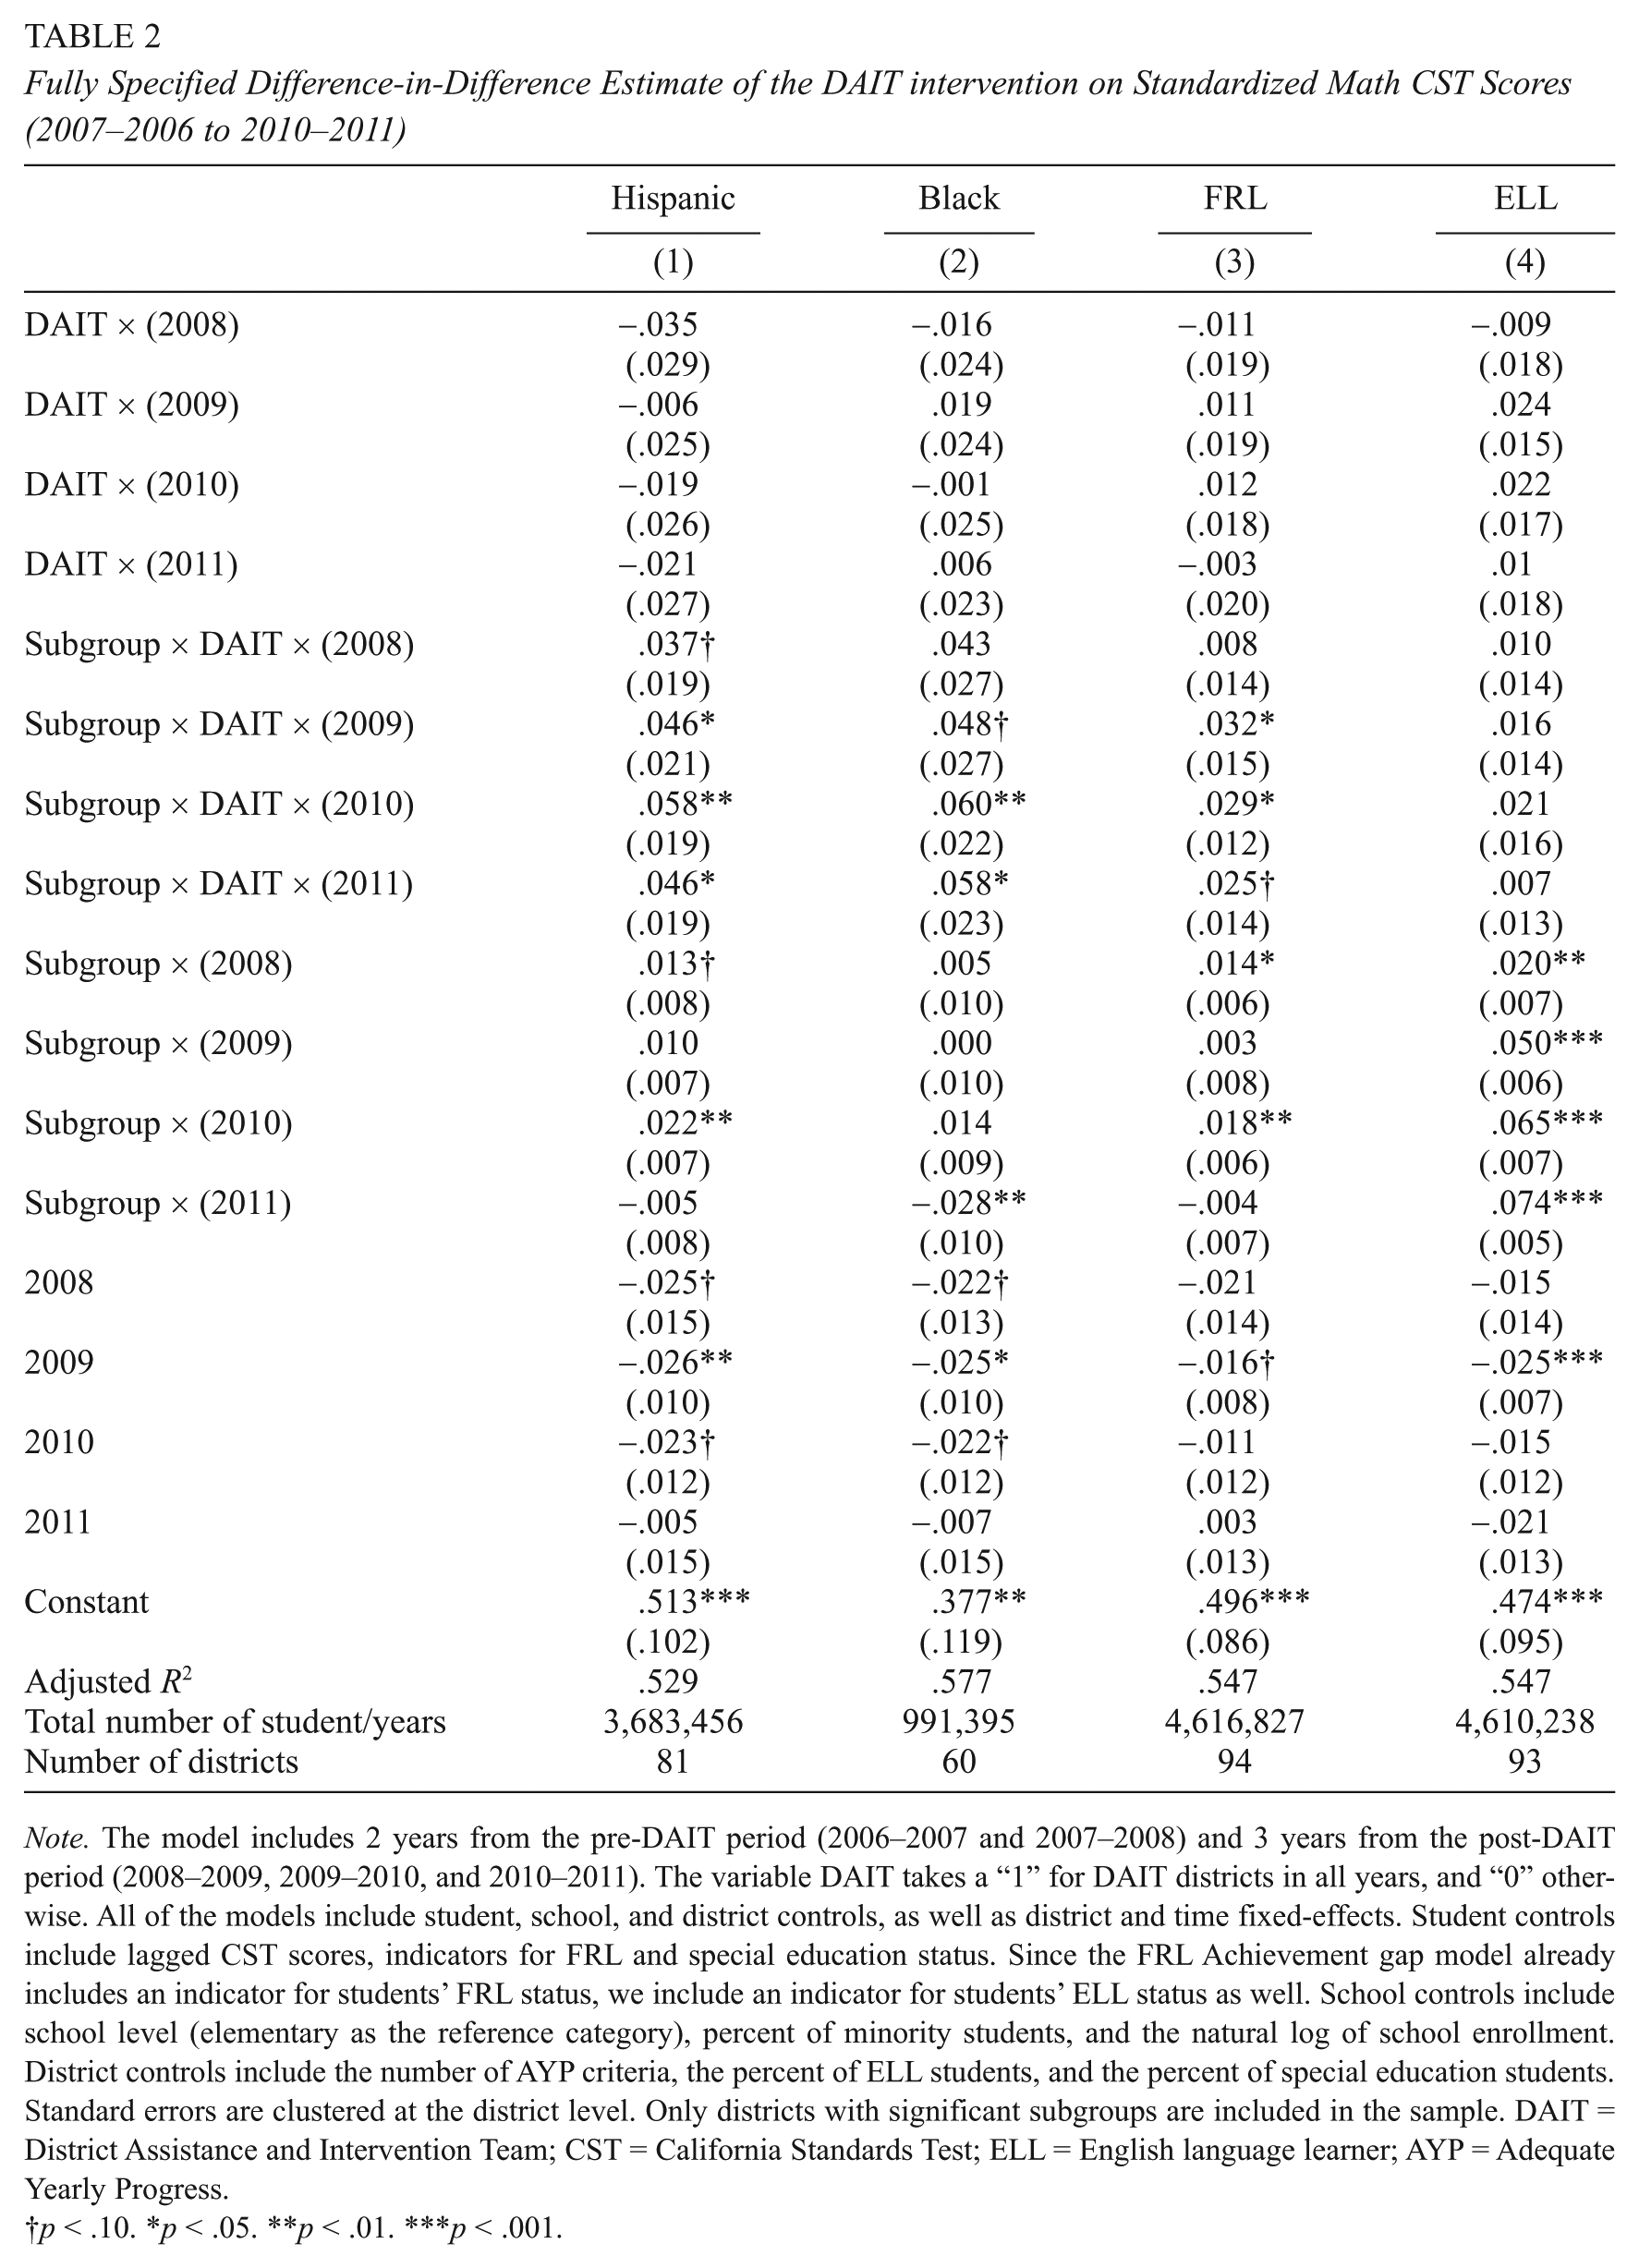
Note. The model includes 2 years from the pre-DAIT period (2006–2007 and 2007–2008) and 3 years from the post-DAIT period (2008–2009, 2009–2010, and 2010–2011). The variable DAIT takes a “1” for DAIT districts in all years, and “0” otherwise. All of the models include student, school, and district controls, as well as district and time fixed-effects. Student controls include lagged CST scores, indicators for FRL and special education status. Since the FRL Achievement gap model already includes an indicator for students’ FRL status, we include an indicator for students’ ELL status as well. School controls include school level (elementary as the reference category), percent of minority students, and the natural log of school enrollment. District controls include the number of AYP criteria, the percent of ELL students, and the percent of special education students. Standard errors are clustered at the district level. Only districts with significant subgroups are included in the sample. DAIT = District Assistance and Intervention Team; CST = California Standards Test; ELL = English language learner; AYP = Adequate Yearly Progress.
p < .10. *p < .05. **p < .01. ***p < .001.
Fully Specified Difference-in-Difference Estimate of the DAIT Intervention on Standardized ELA CST Scores (2006–2007 to 2010–2011)
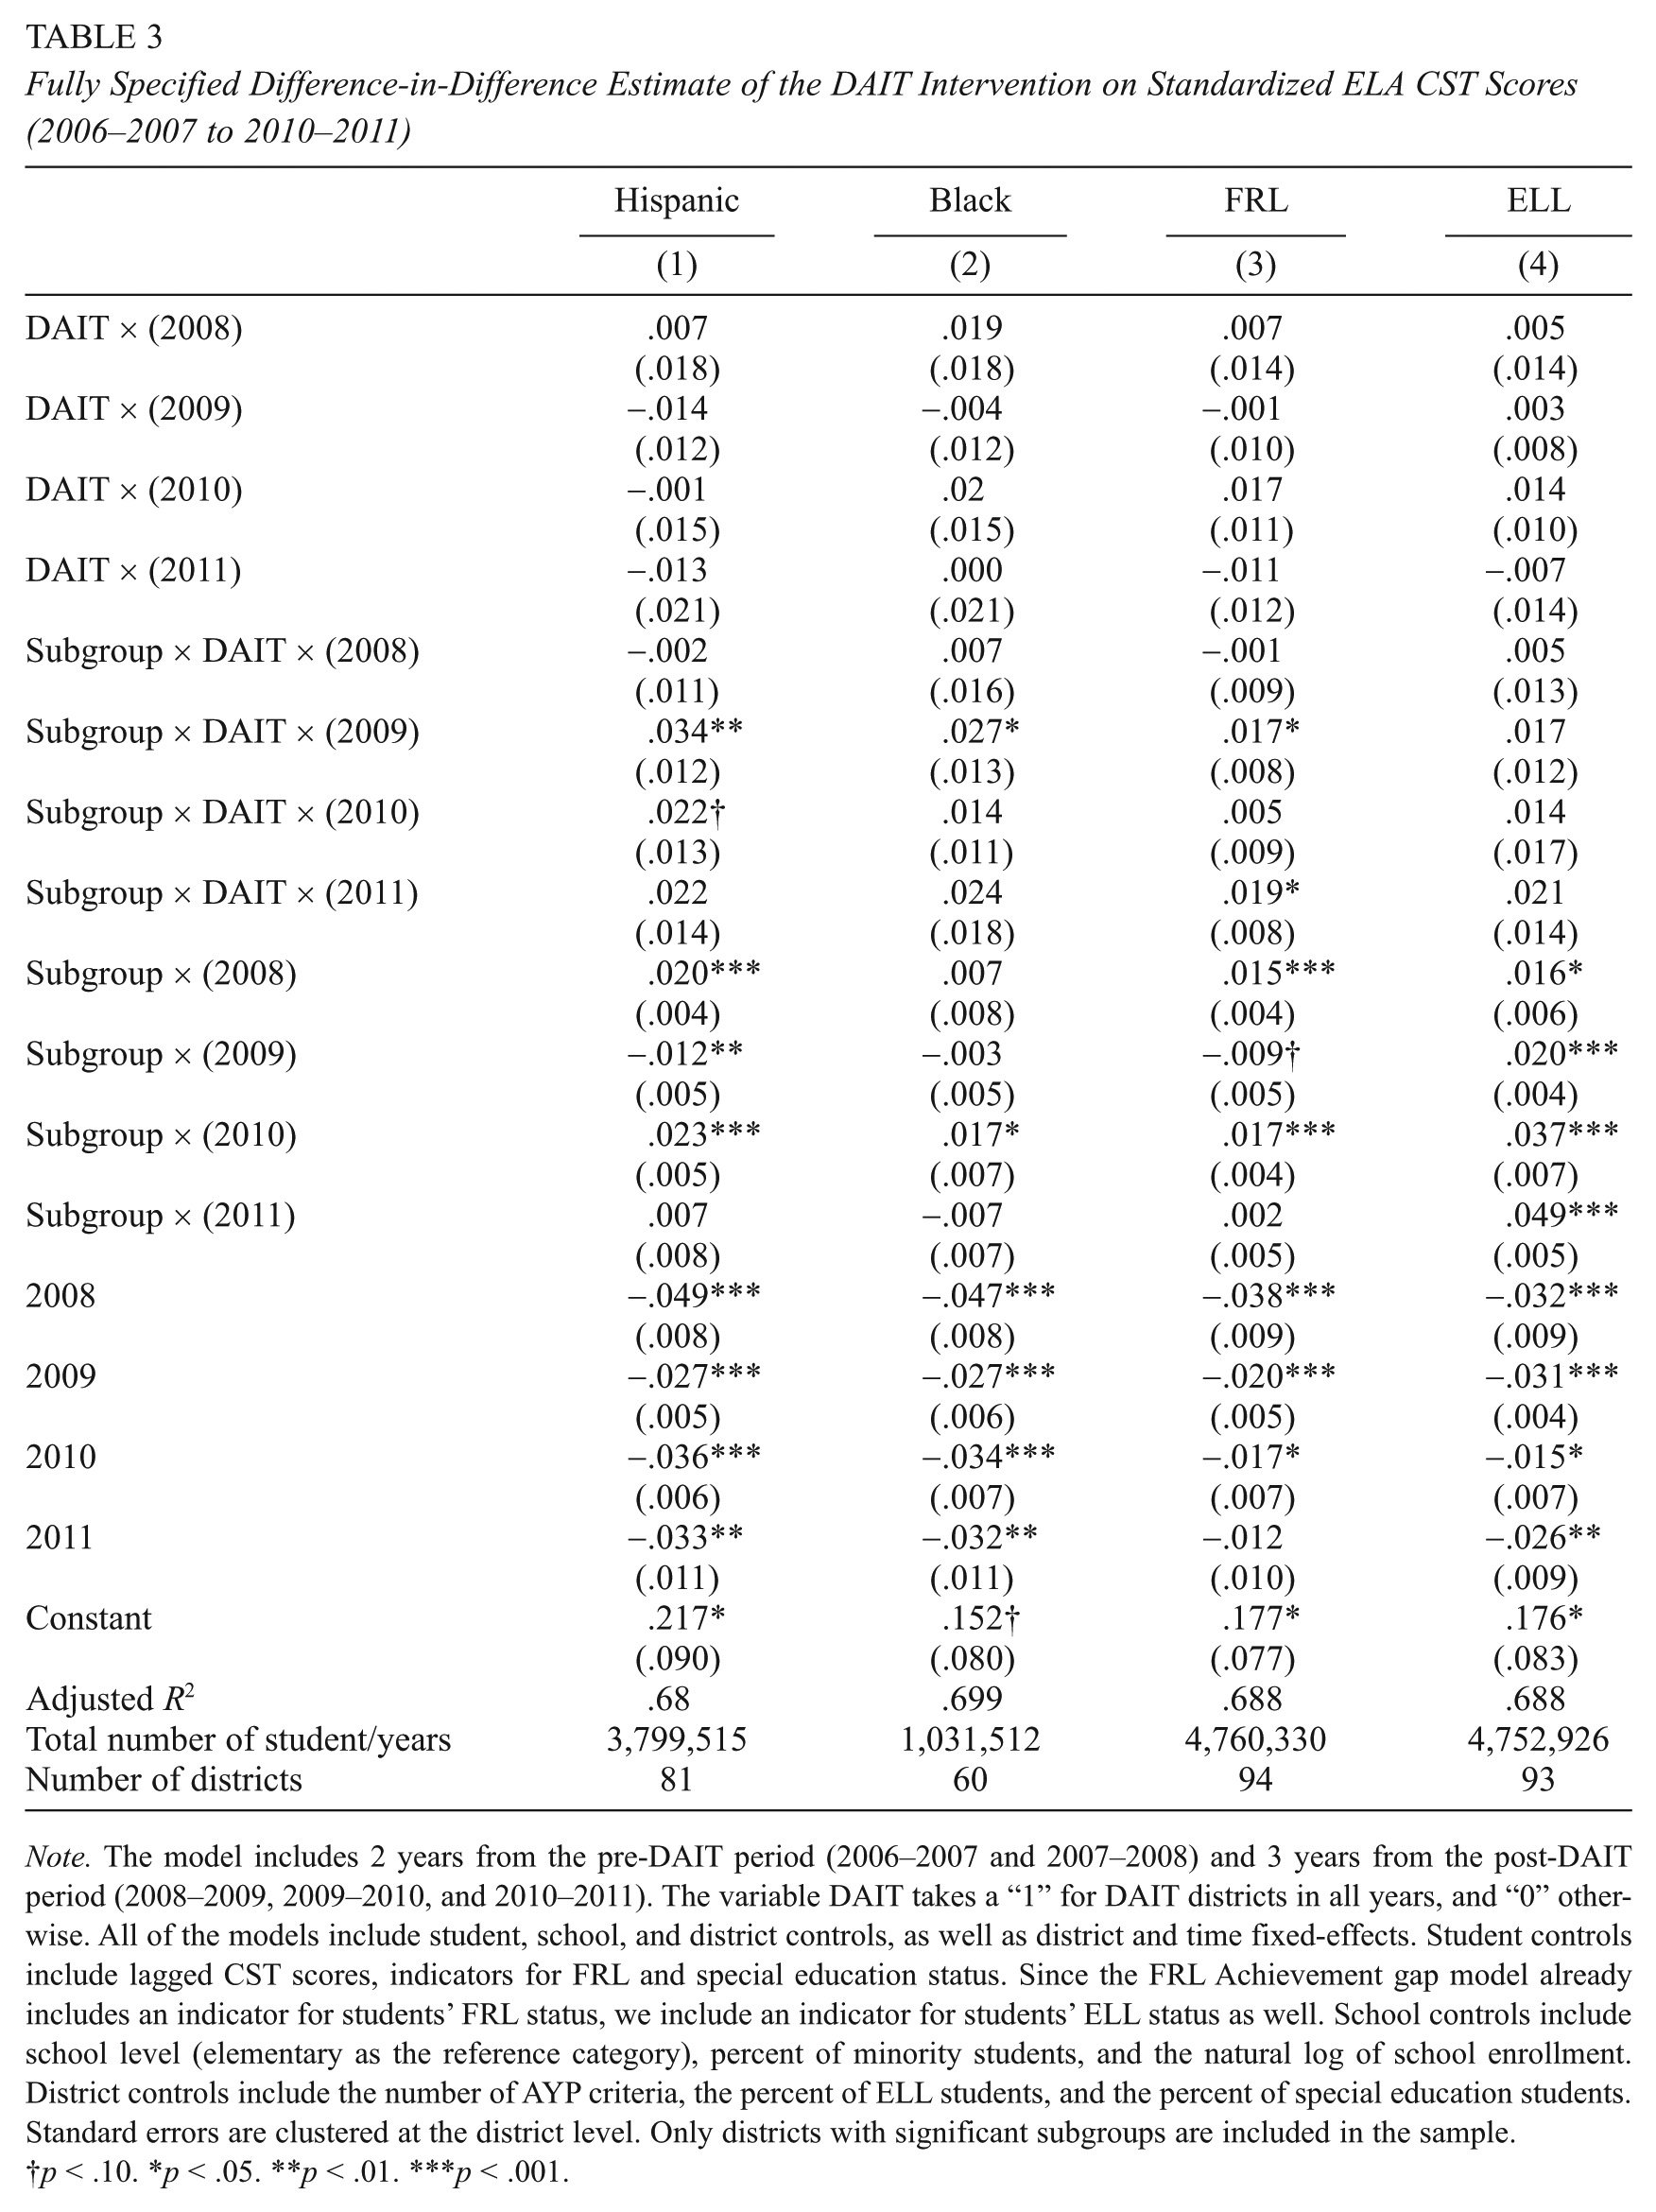
Note. The model includes 2 years from the pre-DAIT period (2006–2007 and 2007–2008) and 3 years from the post-DAIT period (2008–2009, 2009–2010, and 2010–2011). The variable DAIT takes a “1” for DAIT districts in all years, and “0” otherwise. All of the models include student, school, and district controls, as well as district and time fixed-effects. Student controls include lagged CST scores, indicators for FRL and special education status. Since the FRL Achievement gap model already includes an indicator for students’ FRL status, we include an indicator for students’ ELL status as well. School controls include school level (elementary as the reference category), percent of minority students, and the natural log of school enrollment. District controls include the number of AYP criteria, the percent of ELL students, and the percent of special education students. Standard errors are clustered at the district level. Only districts with significant subgroups are included in the sample.
p < .10. *p < .05. **p < .01. ***p < .001.
To further explore why we might see this occurring, we first examine Figure 1. We see that this descriptive picture indicates that Hispanic students in districts with DAITs saw greater achievement gains post-treatment than did Hispanic students in districts with non-DAIT TA. White students in these districts all saw slight declines in achievement, with slightly greater decreases in math achievement post-treatment for White students in DAIT districts. However, in the year leading up to the intervention (2007–2008), White students in districts that would be selected to work with DAITs saw a slightly steeper decline in math achievement than did White students in districts that were selected to work with non-DAIT TA providers, while Hispanic students in both sets of districts experienced similar, and very slight decreases in achievement. These trends are echoed in Table 2, column 1. This indicates that the performance of White students in DAIT versus non-DAIT TA districts drove the small suggested closure in achievement gaps in the year before the intervention, as opposed to Hispanic students.
Next, we run an F-test on estimates from Model 2 to test whether Hispanic students in DAIT districts had significantly different achievement than their Hispanic counterparts in the non-DAIT TA districts (DAIT × τ t + DAIT × Hispanic × τ t = 0) separately for all years τ t . The results from this F-test indicate that the Hispanic students in the DAIT districts significantly outperformed Hispanic students in the non-DAIT TA districts in the treatment years (2008–2009 and 2009–2010), but not so in the pretreatment year (2007–2008), suggesting that the performance of White students drives the possible reduction in the achievement gap in the 2007–2008 school year.
We next examine the separate postintervention year effects, shown in Tables 2 and 3. In math, we find consistent impacts of DAITs on the closing of subgroup achievement gaps in all 3 years post-intervention for the Hispanic–White, Black–White, and FRL–non-FRL gaps. However, we now find no significant impacts of the DAITs on closing the ELL–non-ELL achievement gap in any of the 3 years post-intervention. Similarly, Table 3 shows that we see no evidence of a diminishment in the ELA achievement gap between ELL and non-ELL students in DAIT versus non-DAIT TA districts, as well. These results are surprising given the effect of the DAIT intervention on the ELL–non-ELL achievement gap found in estimates from Model 1.
To explore this further, we again turn to our descriptive graphs shown in Figures 3 and 7. Figure 3, which depicts the math achievement gaps, shows clearly that the ELL–non-ELL achievement gap in DAIT districts is closing after the intervention (indicated by the black lines with circle markers) at a rate faster than the reduction in the achievement gap in non-DAIT TA districts (shown by the grey lines with triangle markers). However, after the intervention, Figure 3 shows that non-ELL students in DAIT districts experienced increases in their math achievement, on average, whereas non-ELL students in non-DAIT TA districts experienced slight declines. This suggests that while the relative gap may have closed on average after the intervention, both ELL and non-ELL students in DAIT districts saw improvements in math achievement. Figure 7 (ELA achievement) also shows that the ELL–non ELL achievement gap closed in DAIT districts post-intervention, but that the difference in rates of closure between DAIT and non-DAIT TA districts may have been quite small, on average. These findings are echoed in the fully specified model (Model 2), which makes clear that the cause of the discrepancy between results from Models 1 and 2 is due to the fact that while the ELL students in DAIT districts outperform their counterparts in non-DAIT TA districts, ELL and non-ELL students in DAIT districts experience a similar gain in achievement in the postintervention years. Therefore, the DAIT intervention leads to an average shift in achievement for ELL and non-ELL students in DAIT districts, but does not close the gap between these two groups.
We delve deeper into this pattern by running a set of conditional models that examine the different achievement trends separately for ELL and non-ELL students. These results can be found in Online Appendix Table A2 (available at http://epa.sagepub.com/supplemental). These results tell the same story as above. We find that ELL students in districts with DAITs saw significant achievement gains in both math and ELA of approximately the same magnitude as gains for non-ELL students in districts with DAITs. Moreover, ELL students in districts with non-DAIT TA also saw achievement gains in both Math and ELA, whereas non-ELL students experienced decreased achievement in the postintervention time period. In other words, the DAIT intervention had an equal effect on the Math and ELA achievement for ELL and non-ELL students in DAIT districts relative to their counterparts in the non-DAIT TA districts, but the intervention did not close the achievement gap between ELL and non-ELL students in DAIT districts. 15
Third, Table 3 shows that the achievement gap closures in ELA achievement attributed to the DAIT intervention in Table 1 were driven primarily by reductions in the achievement gap in Year 1 of the treatment, whereas the math achievement gap continued to close consistently across both years of the intervention as well as in the year after. This pattern is particularly important for policymakers. It may indicate that the ability of the intensive TA model used by DAITs is more effective at continuously reducing math achievement gaps than ELA achievement gaps in the longer term. 16
Together, our results indicate that the DAIT intervention resulted in substantial reductions in the Hispanic–White, Black–White, and low-income–non-low-income math achievement gaps, as well as in the minority–White ELA achievement gaps. However, while there were reductions in the ELL–non-ELL achievement gaps in both math and ELA post-treatment, our results do not provide definitive evidence that these diminished gaps were due to the DAIT intervention itself (relative to non-DAIT TA).
Limitations
The analyses described in this section may suffer from a number of limitations. We attempt to address the most critical potential limitation, that achievement gaps were already diminishing previous to the intervention in DAIT districts, through the use of Model 2, described above. However, we are unable to conclusively address one possibility—that our results are not due to the DAIT intervention, but rather to an accountability threat brought on by simply being labeled in need of a DAIT (and therefore one of the lowest performing districts in California). We are not particularly concerned a district’s status as requiring assistance from a DAIT as opposed to a non-DAIT TA provider caused increased accountability threat because a district’s DAIT status is not highly public. Anecdotal evidence suggests that the public was unaware of districts’ DAIT delegation. Moreover, all districts in this study are in PI3 or higher, which is a highly publicized label, indicating that PI3+ districts with both DAIT and non-DAIT TA should all face the same accountability threat. Nonetheless, to test the plausible hypothesis that simply being at a higher level of accountability (moderate or severe PI3+ districts) drives the reported impact of the DAIT intervention itself, we consider that other districts that are at a higher accountability level (those in Program Improvement Year 1 or 2) should also see improvements in student achievement if the reported effects are due solely to accountability threat and not to the DAIT intervention itself. To that end, we run a series of models that replicate our main specification, this time adding in the three-way interactions between year, subgroup, and treatment status for districts required to contract with state-specified DAITs, those required to contract with a DAIT of their choosing, those required to access non-DAIT TA, and districts in PI1 or PI2, with the comparison group being districts that are not in Program Improvement at all.
Tables reporting these results are too long to show here, but the full tables are available upon request from the authors. Wald tests do not indicate that the students in the reference group and the subgroups of interest in PI1 or PI2 districts experience an average increase in Math or ELA achievement relative to students in non-PI (lower accountability) districts. Furthermore, F-tests indicate that students in the subgroup of interest in DAIT districts experience statistically significant positive achievement gains relative to students in the same subgroup in PI1 or PI2 districts. In other words, these results suggest that the level of accountability threat faced by districts with DAITs is likely no greater than that faced by other PI3 districts with non-DAIT TA, and that the achievement differences between students in DAIT and non-DAIT TA districts is driven by the DAIT intervention not an accountability threat. These findings echo similar analyses shown in Strunk et al. (2012) that show that this type of accountability threat does not drive the main overall impact of DAITs on math or ELA student achievement. As such, although we cannot rule out this possibility, we are not particularly concerned that some additional threat of being required to work with a DAIT above and beyond being a PI3 district required to work with a different kind of TA provider drives our results. 17
A third possible limitation to our work is that we are able to examine only 3 years of outcomes data for the first cohort of treated districts. Although this third year of data is important because it allows us to explore the sustainability of the reform after the intervention is over (and indicates that, in fact, the impact of DAITs on closing achievement gaps generally is sustained after the intervention is over for math, but not for ELA gaps), more years of data will eventually allow us to better understand the longer term impacts of DAITs on relevant achievement gaps. In addition, further exploration of the impacts of DAITs on later cohorts of treated districts will allow us to ascertain if the “DAIT effect” is sustainable in a different set of districts. Both of these limitations imply that more research is necessary to understand the true long run and cohort-specific impacts of DAITs on student achievement.
Finally, the outcome measures we use are not intended for longitudinal assessments of achievement growth. Specifically, the CSTs are not norm-referenced or vertically aligned. Given this fact, it is difficult to compare student achievement on the CSTs over time. As discussed, we attempt to address this issue by standardizing the outcome variables by year and grade/subject. However, we recognize that this is an imperfect measure of student achievement change over time.
Discussion and Conclusion
One of the enduring problems in education has been the inability of educators to close the various achievement gaps between White, wealthy, and native English speaking students and their counterparts who are minority, lower-income, and/or ELLs. Accountability policies like NCLB and the current flexibility waivers offered by the Department of Education aim to address this problem by incentivizing districts and schools to improve all students’ performance. In the case of NCLB, districts and schools are specifically required to close achievement gaps between subgroups of students as every student must reach the proficient level or above. Although capacity-building mechanisms are generally limited aspects of high-stakes accountability reforms, NCLB and the flexibility waivers mandate the use of TA providers to assist districts and schools to improve student outcomes, and it appears that any reauthorization of the law will likely retain provisions requiring TA from states for low-performing districts and schools. Our results from both this work and an earlier study indicate that the DAIT model used by California for its lowest performing districts may be more useful than other, less-structured TA of the sort found in the districts that worked with non-DAIT TA providers. Moreover, we show that this form of TA helps improve the performance of the most traditionally underserved students—those who are Black, Hispanic, and in poverty, thus helping to close the persistent achievement gaps that plague our nation’s school systems.
However, some concerns do exist about the DAIT intervention that should be addressed before taking definitive policy action. First, our results show that DAITs are more effective at diminishing the math achievement gaps in low-performing districts than ELA achievement gaps, overall. It is not clear why this is the case. However, this result is not uncommon. Much of the literature that studies the impacts of interventions or education policies on student outcomes find larger and more significant results for math than for ELA performance on standardized tests (for discussion of this trend, see Figlio & Loeb, 2011; McCaffrey, Sass, Lockwood, & Mihaly, 2009). Nonetheless, this is still worthy of further exploration.
Perhaps more importantly, this study cannot answer questions regarding the long-term sustainability of the DAIT effects. Our results indicate that the impact of DAITs on closing math achievement gaps is sustained in both years of the treatment, as well as in the first year after treatment. However, in most cases, the positive impacts of DAITs on reducing ELA achievement gaps are no longer significant in the second year of the intervention or in the year after the intervention. These disappointing second and third year ELA results may suggest that DAITs are not successful in reducing ELA achievement gaps after the initial DAIT assessment and assistance year, or after DAITs exit the districts. This may indicate that closing ELA achievement gaps is difficult work, and DAITs may need a longer intervention time period in order to see sustainable gains in this area. However, our qualitative study showed that there were already concerns about the scalability of the DAIT reform beyond the early cohorts given the scarcity of organizations with sufficient capacity to provide DAIT services (Strunk et al., 2012). SEAs will need to weigh the benefits of providing for longer intervention periods versus reaching more districts for a shorter time period.
There is much work left to be done on the analysis of the DAIT intervention. First, we can draw conclusions about the effect of DAITs on student achievement only for 3 years (2 years of implementation and a year following) for a single cohort of treated districts. It will be important to continue to follow the result of the intervention to determine whether math achievement gaps continue to close over time, or at least do not reexpand after the intervention has passed. Similarly, given the noted difficulty in improving ELA achievement and diminishing ELA achievement gaps, a longer study period might provide some insight into whether and how DAITs continue to impact ELA performance, especially for students in relevant subgroups. In addition, now that we have seen that positive outcomes are possible, it will be important to study similar interventions in other states to determine whether the DAIT effect is replicable or whether there is something specific about the California context that fosters this success. To this end, further research is also needed to determine what, specifically, about the DAIT intervention improves student outcomes.
Footnotes
Acknowledgements
The authors wish to thank Dr. Theresa Westover, who was the co-principal investigator on this study. In addition, we are grateful to Amy Smith, Mary Stump, Shani Keller, and Stephanie Au for their excellent research assistance. We also appreciate constructive comments made by session participants at the Annual Conference of the Society for Research on Evaluation in Education and the Association for Education Finance and Policy, as well as the helpful suggestions of three anonymous reviewers. All results reported in this study reflect the authors’ work and not necessarily the beliefs or opinions of any other organizations. All errors are our own.
Declaration of Conflicting Interests
The author(s) declared no potential conflicts of interest with respect to the research, authorship, and/or publication of this article.
Funding
The author(s) disclosed receipt of the following financial support for the research, authorship, and/or publication of this article: Funding for this study was provided by the California Department of Education Contract CN088622.
Notes
Authors
KATHARINE O. STRUNK is an assistant professor of education and policy at the University of Southern California. Her research focuses on teachers unions and the collective bargaining agreements they negotiate with school districts, teacher labor markets, and accountability policies.
ANDREW MCEACHIN is an assistant professor of education at the North Carolina State University College of Education. His research focuses on the design and impact of school accountability systems on student outcomes and achievement gaps, economics of education, and math policy.
References
Supplementary Material
Please find the following supplemental material available below.
For Open Access articles published under a Creative Commons License, all supplemental material carries the same license as the article it is associated with.
For non-Open Access articles published, all supplemental material carries a non-exclusive license, and permission requests for re-use of supplemental material or any part of supplemental material shall be sent directly to the copyright owner as specified in the copyright notice associated with the article.
