
Abstract
In this article, we perform cost-effectiveness analysis on interventions that improve the rate of high school completion. Using the What Works Clearinghouse to select effective interventions, we calculate cost-effectiveness ratios for five youth interventions. We document wide variation in cost-effectiveness ratios between programs and between sites within multisite programs, reflecting differences in resource use, program implementation, and target population characteristics. We offer suggestions as to how cost-effectiveness data can be used to inform policymaking, with the goal of improving the efficiency with which public and private resources are employed in education.
Introduction
Almost one trillion dollars of public funding is spent on education in the United States (U.S. Government, 2012). Education costs have risen historically at a much faster rate than the consumer price index (CPI) even as state education budgets have been falling (Center on Budget and Policy Priorities, 2012). Yet, little attention has been focused on issues of cost and productivity of education and how we can increase efficiency. In education policy and research, much more attention has been given to the effectiveness of educational alternatives than to their costs. Strong arguments have been made that costs also need to be taken into account (Harris, 2009), but the criterion of cost-effectiveness is rarely used and is largely unknown among evaluation specialists (Clune, 2002; Hummel-Rossi & Ashdown, 2002; Levin, 2002). This situation exists despite the development of methods for applying cost-effectiveness analysis to education almost four decades ago (Levin, 1975; Levin & McEwan, 2001; Tsang, 1997).
The omission of cost analysis has serious implications for using research evidence to improve education policymaking. In a fundamental sense, research evidence that omits cost analysis promotes educational interventions that have the largest effects regardless of the resources required to implement them (see Levin, 1970; Levin, Glass, & Meister, 1987). It can also lead to policy implementation without sufficient resources to ensure that gains found in research settings can be realized in the field, as occurred with class size reduction in California. The value of cost-effectiveness analysis in enhancing the policy decision-making process has been largely neglected. By forcing consideration of resource use and the idea that all reforms have opportunity costs, economic analysis clarifies what evidence is needed for making efficient policy decisions. This clarification is especially important when, as is increasingly the case, policies are expressed in terms of explicit goals for which policymakers are held accountable.
One important educational goal that has become a national priority is increasing the high school graduation rate (Rumberger, 2011a). The high school graduation rate in the United States has stagnated since the 1970s, such that the United States ranks 22nd among 27 countries in a recent report by the Organisation for Economic Co-operation and Development (OECD; 2012). More than 12%, or 28 million, of American citizens aged 18 or over are high school dropouts, and there are large racial, ethnic, and gender gaps in graduation, with many dropouts clustered in “dropout factories” (Duncan & Murnane, 2011; Rumberger, 2011b). The economic consequences of dropping out of school are substantial, with estimates exceeding $250,000 in taxpayer losses and over $750,000 in total social burden per dropout (Levin & Belfield, 2007). Reducing the dropout rate makes economic sense, but education budgets are limited. Rather than simply asking how to reduce the dropout rate, policymakers might justifiably seek the most efficient ways to obtain maximum results from available resources.
Over the past few decades, federal, state, and local governments have attempted to raise graduation rates via targeted programmatic interventions that provide additional support to at-risk students, institutional interventions to strengthen schools and communities, and broad-based efforts to increase instructional effectiveness and raise academic achievement. These efforts have yielded mixed results, in part because they tend to be modest in scope (Rumberger, 2011a). In addition, many initiatives are implemented in ways that do not allow for rigorous evaluation, either because they are part of a suite of reforms or because they do not allow for students to be followed over a long enough time horizon (Duncan & Murnane, 2011). Even when existing studies have examined the effectiveness of the interventions, very few have incorporated cost-effectiveness analysis.
The What Works Clearinghouse (WWC) has performed an extensive review of interventions that address the problem of high school dropouts. The WWC is a national database of research reviews on the effectiveness of rigorously evaluated interventions addressing various topics, including “Dropout Prevention.” The WWC has established a protocol for evaluating research and it summarizes the evidence from studies that meet its methodological standards of validity (WWC, 2011). Our research drew upon this evidence on effectiveness and combined it with cost data to demonstrate how cost-effectiveness analysis can be used to answer the policy-relevant question: What are the most efficient ways to improve the high school completion rate?
We focused on the five educational interventions within the Dropout Prevention topic area that the WWC identified as effective at improving high school completion. We exploited existing data on costs and effectiveness to derive cost-effectiveness ratios for four of the interventions. Full details of our cost-effectiveness analyses are provided in Levin et al. (2012). For one program, Talent Search, no cost analysis existed, so we collected direct information on the ingredients needed for this program, assigned costs based on national prices, and related these to the preexisting effectiveness evidence. In presenting these results, our purpose is to demonstrate the application and value of cost-effectiveness analysis and to encourage the research community to include such analyses when evaluating educational programs.
Method and Practice
Cost-Effectiveness Analysis
The goals of cost-effectiveness analysis are to encourage policymakers to consider productivity as well as effectiveness of alternative educational interventions and to improve the efficiency with which public and private resources are employed in education. Ideally, both cost analyses and effectiveness analyses would be conducted contemporaneously at the sites where each alternative intervention is being implemented, and the data would be combined in a comparison of cost-effectiveness among alternatives. Such a comparison only makes sense if the programs all address a common outcome, for example, raising the high school completion rate. In situations where effectiveness data have been collected without costs, a retrospective cost analysis may be feasible.
Cost analysis should follow the “ingredients method” (Levin, 1975; Levin, 1983; Levin & McEwan, 2001) or its equivalent, the “resource cost model” (Chambers & Parrish, 1994). The purpose behind the ingredients approach is to account for the costs of all of the resources required to implement the intervention being evaluated, regardless of the source or the funding agency. By focusing on ingredients, this approach begins not with a budget but with the details of the intervention and its resource requirements. After establishing a systematic specification of the ingredients that are used to produce a particular educational outcome of interest, a price is assigned to each ingredient in order to determine the costs of the intervention. In general, market values are used to assess opportunity cost of resources, although other methods may also be necessary to estimate “shadow” prices. Common methods of estimating costs across different interventions and use of standard national prices, as opposed to local prices, allow for a neutral comparison of multiple interventions addressing a single outcome in cost-effectiveness analysis. Costs should be calculated as incremental costs, that is, taking into account resources utilized by the intervention beyond those employed for “business-as-usual.”
Once the costs of a program have been calculated, a cost-effectiveness ratio is derived by dividing total program costs by a measure of program effectiveness for the population being served. Alternatives with lower cost-effectiveness ratios are preferable to those with higher ones. The ratio can be easily related to the value of the program—specifically, whether it is worth spending this dollar amount to “buy” an additional unit of effectiveness. Alternatively, a “yield” metric may be presented by dividing the measure of effectiveness by the cost figure to provide a gain in effectiveness per dollar spent.
While the method of cost-effectiveness analysis is straightforward, the practical application may be considerably more challenging. For example, when trying to assign costs to an intervention evaluated in the past, an accurate reconstruction of the ingredients required may be difficult unless detailed records of resource utilization are available. Furthermore, interventions may only be compared in a cost-effectiveness analysis if they measure at least one outcome in common, and this outcome is measured on a common scale. Interventions must also be comparable from a policy perspective: They should serve similar populations of students in similar settings, be delivered at similar scale, and be funded at similar levels.
There are also challenges in interpreting the effectiveness of a program and linking available effectiveness measures to the appropriate costs. Evaluation studies often report on multiple sites implementing the same program. In these cases, some sites may appear to be effective while others are ineffective. The question arises as to which sites best represent the impact of the program for a cost-effectiveness analysis, and how to account for the range of cost-effectiveness across sites. Given the high variability we have observed in resource use across sites ostensibly implementing the same program (see Levin, Catlin, & Elson’s, 2007, cost analysis of READ 180 and examples in this article), we recommend that, whenever possible, costs should be estimated at the site level and combined with effectiveness data for the corresponding site.
In addition, effectiveness research typically distinguishes between study participants who are assigned to the intervention, the intent-to-treat population, and those who actually participate in the intervention, the treatment-on-the-treated population. Although interventions are typically allocated resources based on the former, these resources are spent on the latter, so that adjustments to reported costs may be necessary.
In practice, most educational programs assign resources to an intervention above and beyond some amount already being spent on the target population, often within a school setting. Therefore, the program costs and effects are incremental to the costs and effects of schooling. However, if the program is out-of-school, it is not always clear whether other resources are simultaneously being accessed that might contribute to the outcomes being measured and attributed to the program. In addition, the comparison group participants may have access to some resources that are similar to those offered to the treatment group. The costs of these services should be determined and compared with the costs of the program being evaluated to provide an estimate of the cost differential between them. In most studies, the resource use of the comparison group is not documented and, in the absence of these data, the costs are usually assumed to be zero. This assumption may lead to the underestimation of the relative cost-effectiveness of the intervention being evaluated. When cost data for the comparison group are unavailable, a breakeven analysis can be conducted to determine at what point cost-effectiveness rankings might change depending on the costs of resources utilized by the comparison group.
While there is no equivalent to statistical significance testing for cost-effectiveness results, it is critical to perform sensitivity analyses in which modeling assumptions are varied to test robustness of the results (Boardman, Greenberg, Vining, & Weimer, 2011). In evaluations where cost and effectiveness data are pooled across multiple sites, these pooled estimates often mask significant variation in site-level costs and effectiveness. Wherever possible, site-level cost-effectiveness ratios should be calculated and compared with the overall program results. If cost and effectiveness data are disaggregated by subgroup, differences in cost-effectiveness for the various racial and gender groups may help explain site-level variation. Additional sensitivity tests could include the variation of prices assigned to key ingredients, the distribution of ingredients across program participants, the discount rate used to calculate net present value, the estimated life of facilities and equipment, and the interest rate used to amortize their annual costs.
Application of Cost-Effectiveness Analysis to Dropout Prevention
The WWC identifies three different outcomes within the Dropout Prevention topic area: completing school, which constitutes graduating from high school or earning a high school equivalency credential (“GED”); progressing in school, which means moving up a grade; and staying in school. We focused on the first of these three outcomes, completing school, as it is the strongest outcome in terms of educational attainment and accords with a general understanding of what dropout prevention programs should accomplish. The WWC has identified five interventions with positive or potentially positive effects on high school completion: Talent Search, JOBSTART, New Chance, National Guard Youth ChalleNGe (NGYC), and Job Corps. We supplemented the effectiveness findings for these five interventions with cost data to perform a cost-effectiveness analysis. We presumed the effectiveness of the interventions at improving high school completion to be already established using satisfactory research methods, and that the interest of policymakers would be to identify which of them is the most cost-effective.
The five programs differ in many ways such as scale, target population, duration, nature and intensity of services provided, nature and timing of outcomes sought, and definition of high school completion, as summarized in Table 1. These differences limit to some extent the comparability of the programs both in terms of effectiveness and cost-effectiveness. In addition to considering cost-effectiveness ratios, policymakers should also consider the relevance of these factors to their implementation context and to the intended target population. Talent Search is a longstanding, national, supplementary program that targets low-income, middle, and high school students whose parents have not attended college. The program supports participants in completing high school and attending college. The other four programs all serve (or served) youth who have (or had) already dropped out of school. Job Corps is a mostly residential program providing education, job training, and other life skills. JOBSTART was a demonstration program, very similar to Job Corps but nonresidential. New Chance was also a demonstration program but served new mothers, providing intensive services including education, job training, parenting skills, and child-care services. NGYC is an ongoing program that involves residency in military barracks, military-style discipline, education and job training services, and a year of follow-up contact with a mentor. Given the populations served, we refer to the five programs collectively as high school completion programs, as opposed to dropout prevention programs.
Summary Program Characteristics for Five High School Completion Programs
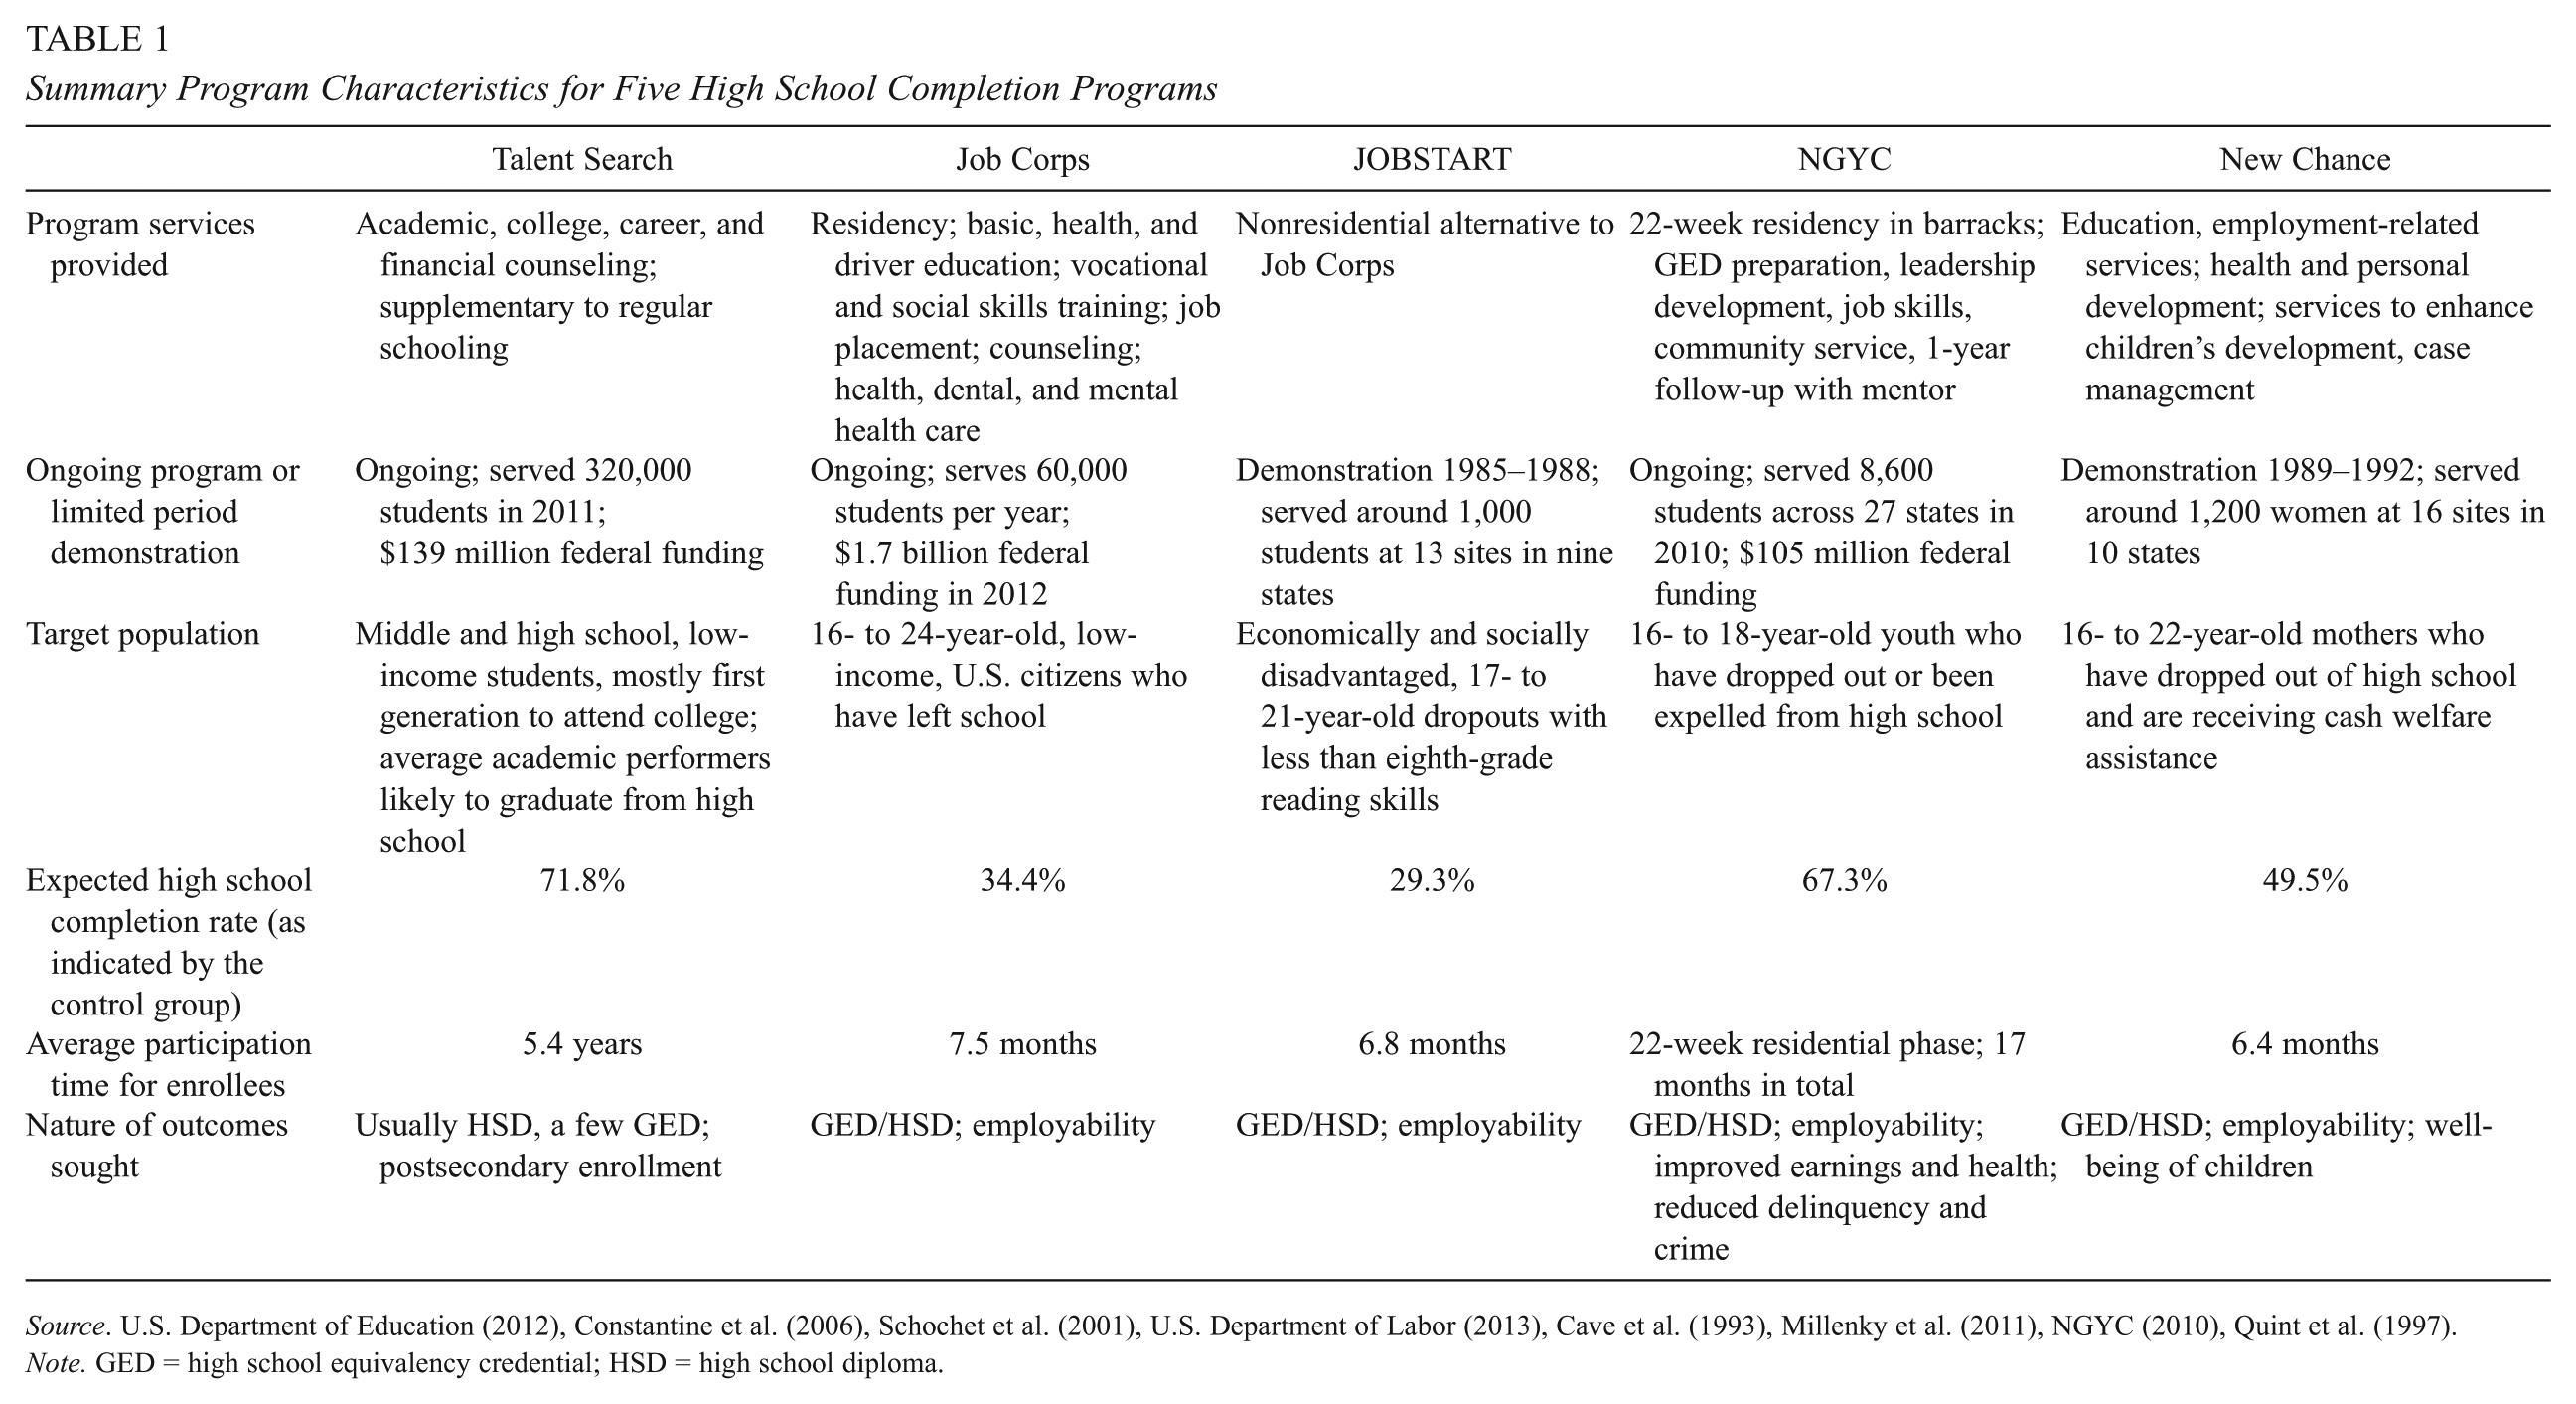
Source. U.S. Department of Education (2012), Constantine et al. (2006), Schochet et al. (2001), U.S. Department of Labor (2013), Cave et al. (1993), Millenky et al. (2011), NGYC (2010), Quint et al. (1997).
Note. GED = high school equivalency credential; HSD = high school diploma.
The definition of high school completion was not uniform across the five programs in the evaluations listed by WWC. While Talent Search students mostly earned a high school diploma, participants in the other programs were far more likely to have earned a GED. The program evaluations did not present the GED versus high school diploma achievement data in a manner that permitted separate analysis of the two outcomes. Consequently, we combined the two outcomes while recognizing that treating GED receipt as equivalent to high school completion with a diploma is problematic because there is substantial evidence that the economic benefits from possessing a high school diploma far exceed those from possessing a GED (Heckman, Humphries, & Mader, 2010; Tyler & Lofstrom, 2009). We refer to all individuals who either received a GED or completed high school with a diploma as high school graduates.
Each of the five programs, as evaluated, addressed multiple goals beyond high school completion, for example, increasing postsecondary enrollment, or increasing employability and earnings. The implication is that resources expended on these programs were probably significantly greater than for a program aimed solely at improving high school completion. The five programs also targeted different student groups. Talent Search is the only program that targeted students who were still in school, appeared to be on track to graduate, and expressed an interest in attending college. The other four programs all targeted dropouts, with New Chance more narrowly targeting young mothers. The expected high school completion rate for these youth varied from as low as 29% for JOBSTART participants to as high as 67% for NGYC participants. Talent Search differs significantly from the other four interventions both in target population and in being supplementary to school rather than a stand-alone program.
Costs of High School Completion Interventions
Cost data for the five programs also lack consistency. We found no preexisting cost analysis for Talent Search, so we applied the ingredients method to collect these data retrospectively and matched them with effectiveness data from an evaluation published in 2006. For Job Corps, JOBSTART, NGYC, and New Chance, we relied on existing cost data that were collected using a variety of methods described in each program section below. While the availability of any cost data is in itself laudable and atypical, none of the existing cost studies used the approach we recommend, the ingredients method. Since these program costs were generally presented by activity or by category of budgetary expenditure, rather than by specific ingredient, we were not able to determine comparability of all costing assumptions, for example, how facilities were priced and whether capital goods were depreciated. While the cost analyses of JOBSTART and New Chance differentiated between “fixed” and “variable” activities, none of the four existing costs analyses indicated whether the cost of each resource was fixed or variable.
Costs in the existing cost analyses appeared, in most instances, to be presented using local prices rather than national prices, which further limits their comparability. The JOBSTART and New Chance programs took place exclusively in urban areas across several states, making it likely that their measured costs were somewhat higher than the national average, whereas NGYC took place at a mix of urban and rural sites in numerous states and likely has costs that are similar to or slightly lower than the national average. The National Job Corps cost study (McConnell & Glazerman, 2001) aggregated local prices across centers and added estimates of central administration costs to estimate a rough national average. Wherever possible, we made adjustments to the items included in the cost estimations to improve comparability of results, for example, excluding transfers such as stipends and housing allowances unless they could not be disaggregated from other costs that were clearly program costs. If certain transfers could not be removed for one program due to such bundling, we did not exclude them from cost estimates of the other programs. For example, food and clothing costs were reported as part of “Support Services” for JOBSTART and could not be disaggregated so we also kept these two transfer payments in the Job Corps cost estimate, accounting for about 5.5% of total costs (see McConnell & Glazerman, 2001).
We reported all monetary values in 2010 dollars and rounded to the nearest 10 dollars. Where adjustments for inflation were necessary, we applied the average of the relevant CPI–All Urban Consumers and CPI for Urban Wage Earners and Clerical Workers. Alternative indices for education prices, such as the Teacher Wage Index, the Higher Education Price Index, and the Higher Education Cost Adjustment, yielded very similar rates of inflation: Over the period since 1986 when the earliest cost data for any of the five programs were collected, these indices have not diverged by more than 5%. Costs for JOBSTART, New Chance, Job Corps, and NGYC were not discounted to reflect the time of investment because the average durations of the evaluated implementations were less than 1 year, and high school completion occurred for most participants within 1 year of program enrollment. Duration of Talent Search services ranged from 1 to 7 years, starting as early as Grade 6, so we discounted costs to age 18 using a 3% discount rate to allow comparability with the other interventions.
We presented costs and effects for the students who received services, the treatment-on-the-treated population, as opposed to the intent-to-treat population, using participation rates where necessary to make this adjustment. We did not attribute any cost to participants’ time in each program because participants were unlikely to have substantial income-earning opportunities given their young age or lack of education credentials. We reported cost-effectiveness from the social perspective, that is, accounting for all resources utilized regardless of who provided or funded the resource. Alternative stakeholder perspectives may also be useful: For example, districts or schools may wish to consider only the resources for which they must pay and taxpayers may wish to take into account transfer payments.
Cost-Effectiveness of High School Completion Interventions
Despite the differences noted in program characteristics and evaluation data, we made adjustments to improve the comparability of the data within a cost-effectiveness framework and proceeded to demonstrate a cost-effectiveness analysis and report cost-effectiveness ratios for each of the five interventions, summarized in Table 2. We subjected our cost-effectiveness results to a number of sensitivity analyses to test the impact of varying a number of our assumptions. Our main concern for these programs was the pooling of results across multiple sites. Wherever possible, we investigated site-level cost-effectiveness ratios and compared these with the overall program results.
Cost-Effectiveness Results for Programs That Improve the Rate of High School Completion
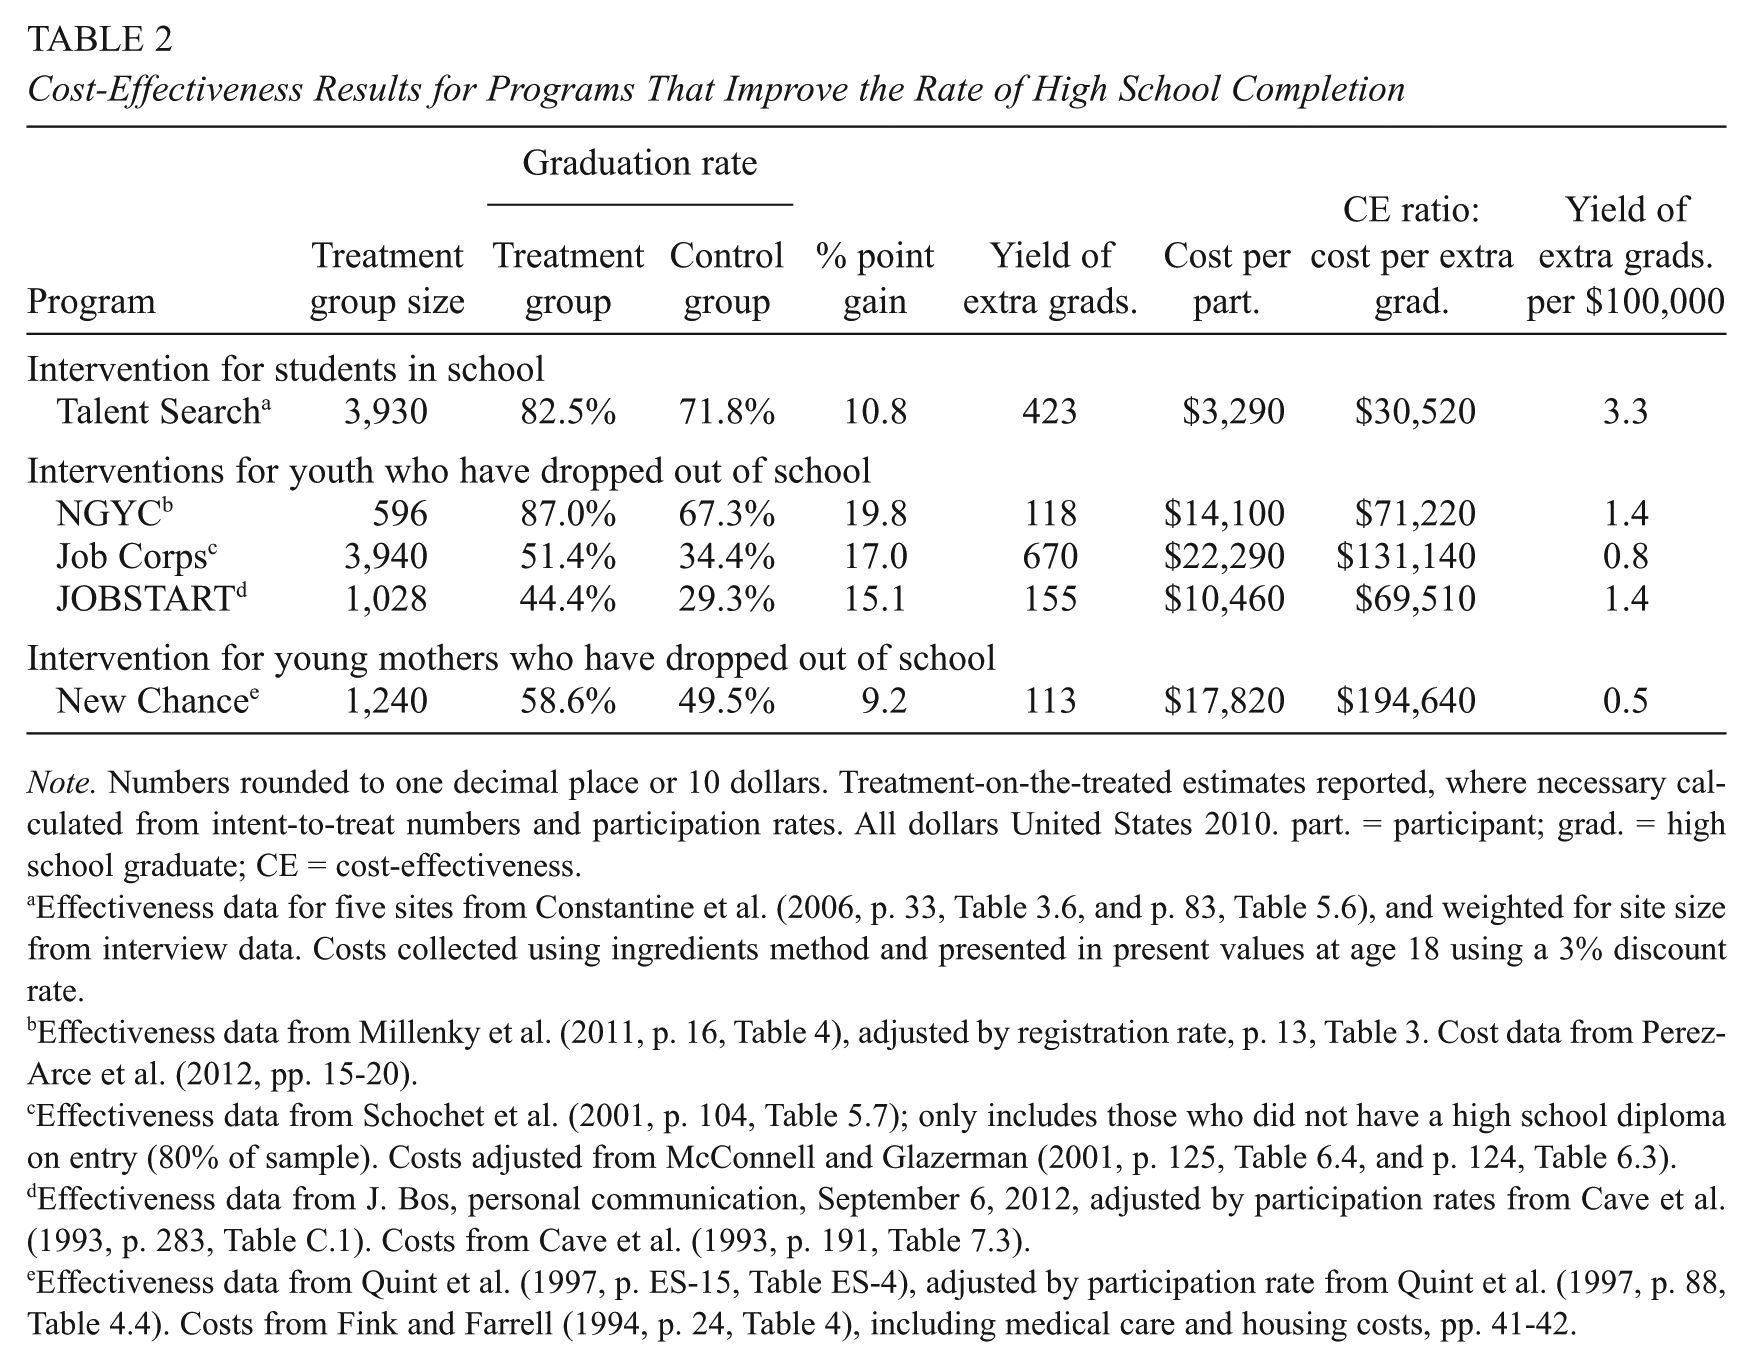
Note. Numbers rounded to one decimal place or 10 dollars. Treatment-on-the-treated estimates reported, where necessary calculated from intent-to-treat numbers and participation rates. All dollars United States 2010. part. = participant; grad. = high school graduate; CE = cost-effectiveness.
Effectiveness data for five sites from Constantine et al. (2006, p. 33, Table 3.6, and p. 83, Table 5.6), and weighted for site size from interview data. Costs collected using ingredients method and presented in present values at age 18 using a 3% discount rate.
Effectiveness data from Millenky et al. (2011, p. 16, Table 4), adjusted by registration rate, p. 13, Table 3. Cost data from Perez-Arce et al. (2012, pp. 15-20).
Effectiveness data from Schochet et al. (2001, p. 104, Table 5.7); only includes those who did not have a high school diploma on entry (80% of sample). Costs adjusted from McConnell and Glazerman (2001, p. 125, Table 6.4, and p. 124, Table 6.3).
Effectiveness data from J. Bos, personal communication, September 6, 2012, adjusted by participation rates from Cave et al. (1993, p. 283, Table C.1). Costs from Cave et al. (1993, p. 191, Table 7.3).
Effectiveness data from Quint et al. (1997, p. ES-15, Table ES-4), adjusted by participation rate from Quint et al. (1997, p. 88, Table 4.4). Costs from Fink and Farrell (1994, p. 24, Table 4), including medical care and housing costs, pp. 41-42.
Intervention Targeting Students in School: Talent Search
Talent Search is one of the original TRIO programs established and funded by the 1965 Higher Education Act. Universities, community organizations, and secondary schools are eligible to provide Talent Search services including tutoring, financial awareness and career selection training, college tours, and assistance with all aspects of applying to and enrolling in college. Constantine, Seftor, Martin, Silva, and Myers (2006) evaluated the effectiveness of Talent Search at raising high school completion rates in Texas and Florida using longitudinal data for cohorts of students who were in Grade 9 in 1995. Using a propensity score matching model to estimate effectiveness, Constantine et al. found gains in high school completion rates for Talent Search participants of 9% in Texas and 14% in Florida. In both states, this overall effect masked considerable heterogeneity in effectiveness across sites and cohorts within sites. Site- and cohort-specific differences in effectiveness ranged from −9.2 to +18.9 percentage points in Texas and from −5.9 to +27.3 percentage points in Florida, indicating that in some cases Talent Search students fared worse than the comparison group students at their site, while in others they graduated from high school at much higher rates.
While Talent Search sites receive approximately $400 per student annually in federal funds (U.S. Department of Education, 2012), budgetary information is a poor proxy for actual resource use because a significant component of the intervention takes place at school sites, with input and effort from school personnel, and use of some school facilities. In cases where Talent Search sites are located on college campuses, they may use facilities that they are not required to pay for directly. Some sites also rely on in-kind resources from their local communities.
We used the ingredients method (Levin & McEwan, 2001) to conduct a cost analysis of Talent Search at five of the sites evaluated by Constantine et al. (2006) where we were able to conduct detailed interviews with an administrator to determine program resource requirements. 1 Table 3 lists the ingredients and their costs for each of these sites. Use of national average prices allowed for a comparison of costs across sites. To price the Talent Search staff labor costs, we used the closest personnel match from the annual College and University Professional Association survey for Human Resources to pair each staff member’s position with a national salary, and we added 32.3% for benefits (Bureau of Labor Statistics 2010 National Compensation Survey). Labor costs accounted for between 67% and 80% of total costs. We obtained facilities prices from the College Planning and Management Magazine and the School Planning and Management Magazine and amortized these costs over 30 years. In situations where the space allocated to Talent Search activities was also used for other activities, for example, a hallway, cafeteria, or auditorium at a school site, we calculated an hourly rate. We counted as a cost the overhead fee for maintenance and services that each site paid the host institution. As it was not clear whether these fees included the costs of facilities used at the host institution, we conducted a sensitivity test to eliminate the costs we assigned to the host facilities, which accounted for 2% to 5% of total costs at each site. This did not result in any change to the cost-effectiveness rankings among sites. Most of the costs of Talent Search were variable, that is, depended on the number of students served at each site. However, each site needed a site director and some office space at the host college so that between 16% and 25% of costs may be considered fixed.
Talent Search (TS) Ingredients and Costs Across Five Sites
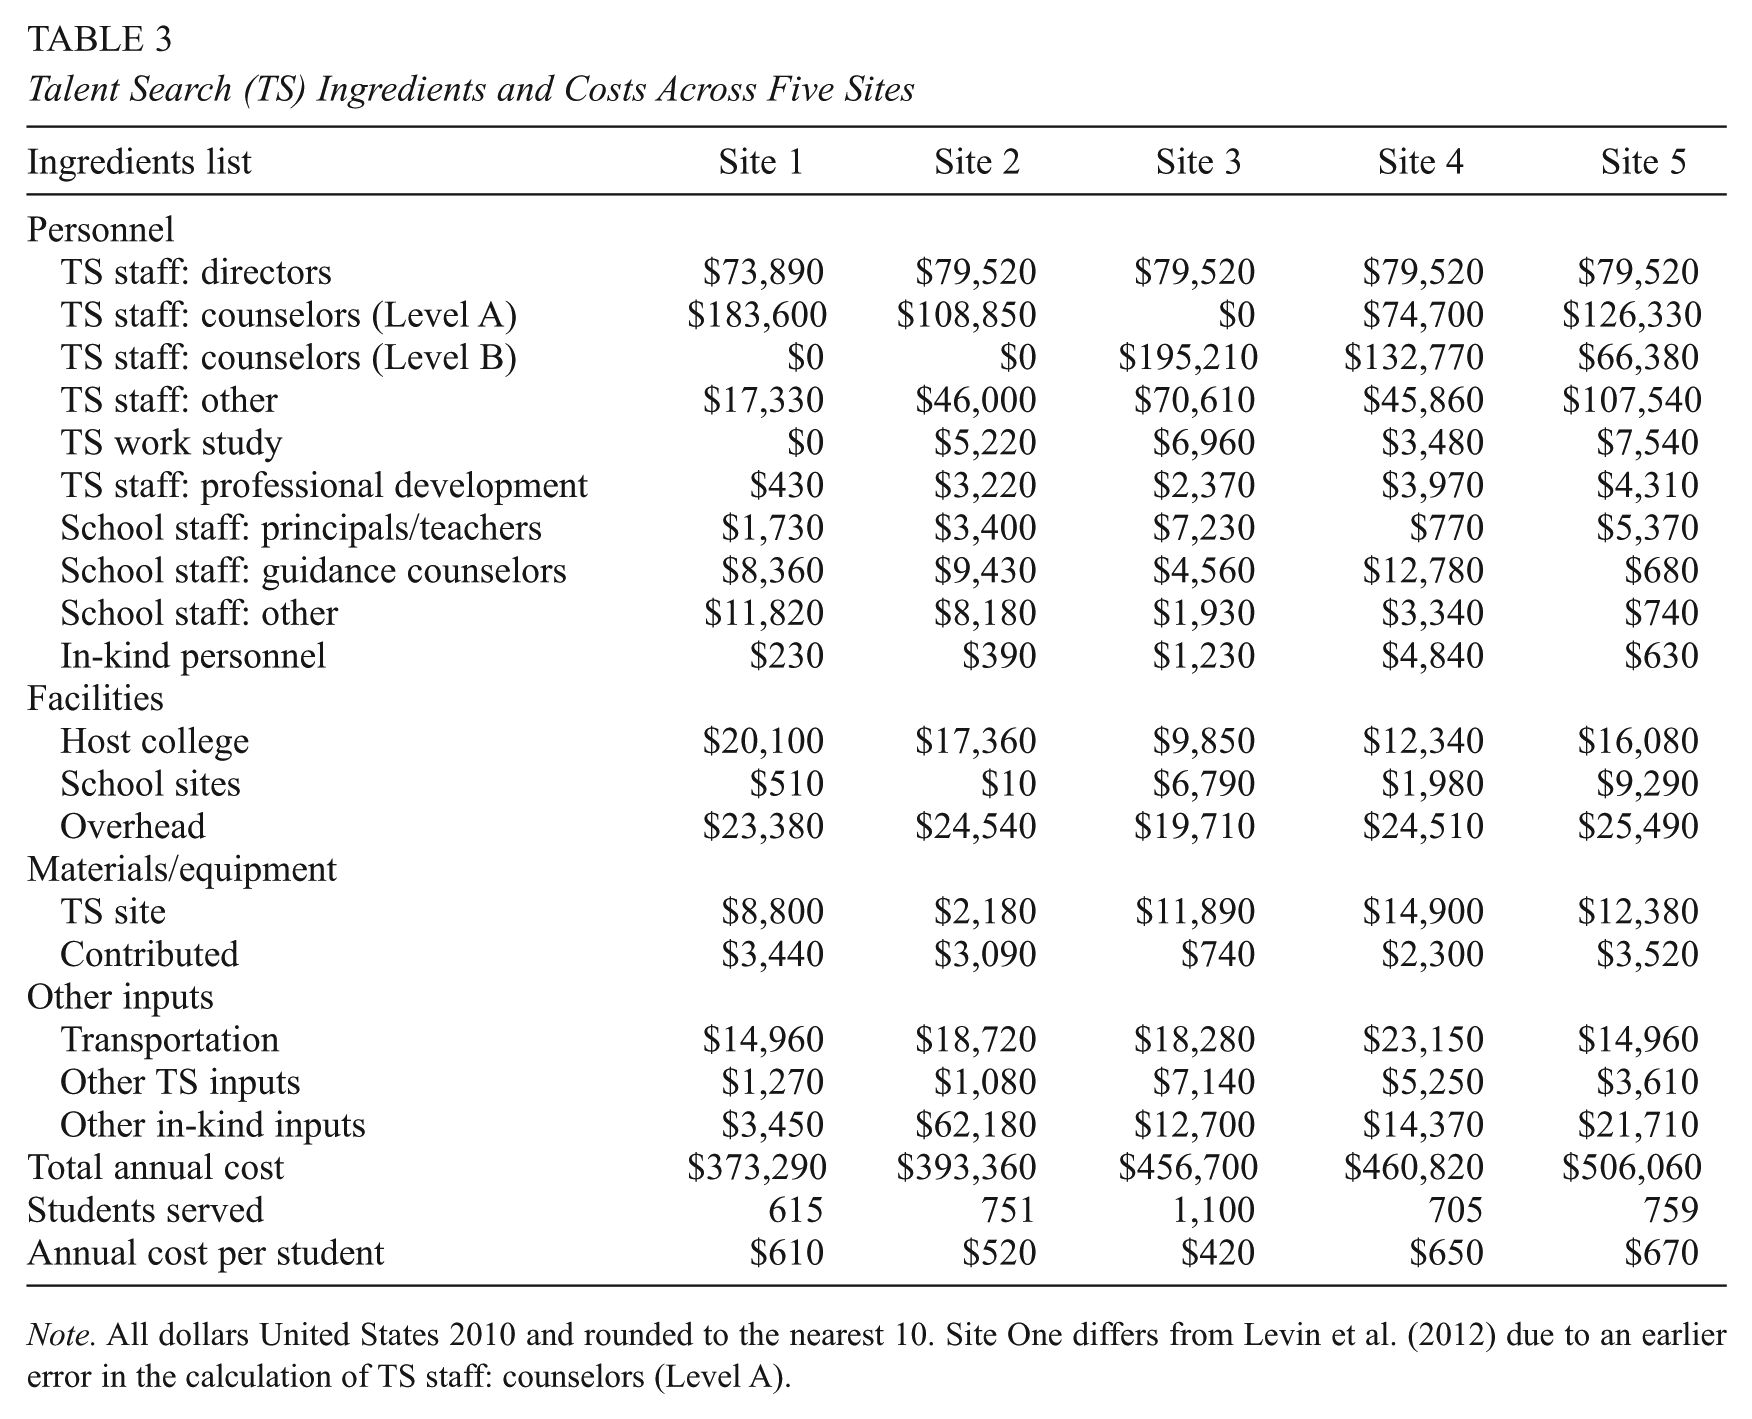
Note. All dollars United States 2010 and rounded to the nearest 10. Site One differs from Levin et al. (2012) due to an earlier error in the calculation of TS staff: counselors (Level A).
After attributing an appropriate price to each ingredient, we calculated site-level costs per student based on the reported average number of years that students participated in the program at each site. Subsequently, we linked this cost information to the site-level effectiveness data obtained from Constantine et al. (2006) to calculate cost-effectiveness ratios for each of the five Talent Search sites. No information was provided in the Constantine et al. evaluation regarding resources available to the comparison group, such as other TRIO programs, so we were unable to account for any alternative services received by the comparison group. Our analysis is also limited by the fact that the impact evaluation was performed years before our cost analysis. However, most site interviewees indicated that Talent Search has been fairly stable over time and that resource use patterns have not differed substantially year-to-year.
The pooled cost estimate across the five sites, weighted by site size, indicated that, on average, it cost $3,290 in present value at age 18 to provide Talent Search services to students over the middle and high school years. Given substantial variability in services provided and effectiveness documented across sites, we also performed our analysis at the site level. As shown in Table 4, the average present value cost per student varied across sites from $2,770 to $4,800.
Talent Search Site-Level Cost-Effectiveness Results for High School (HS) Completion
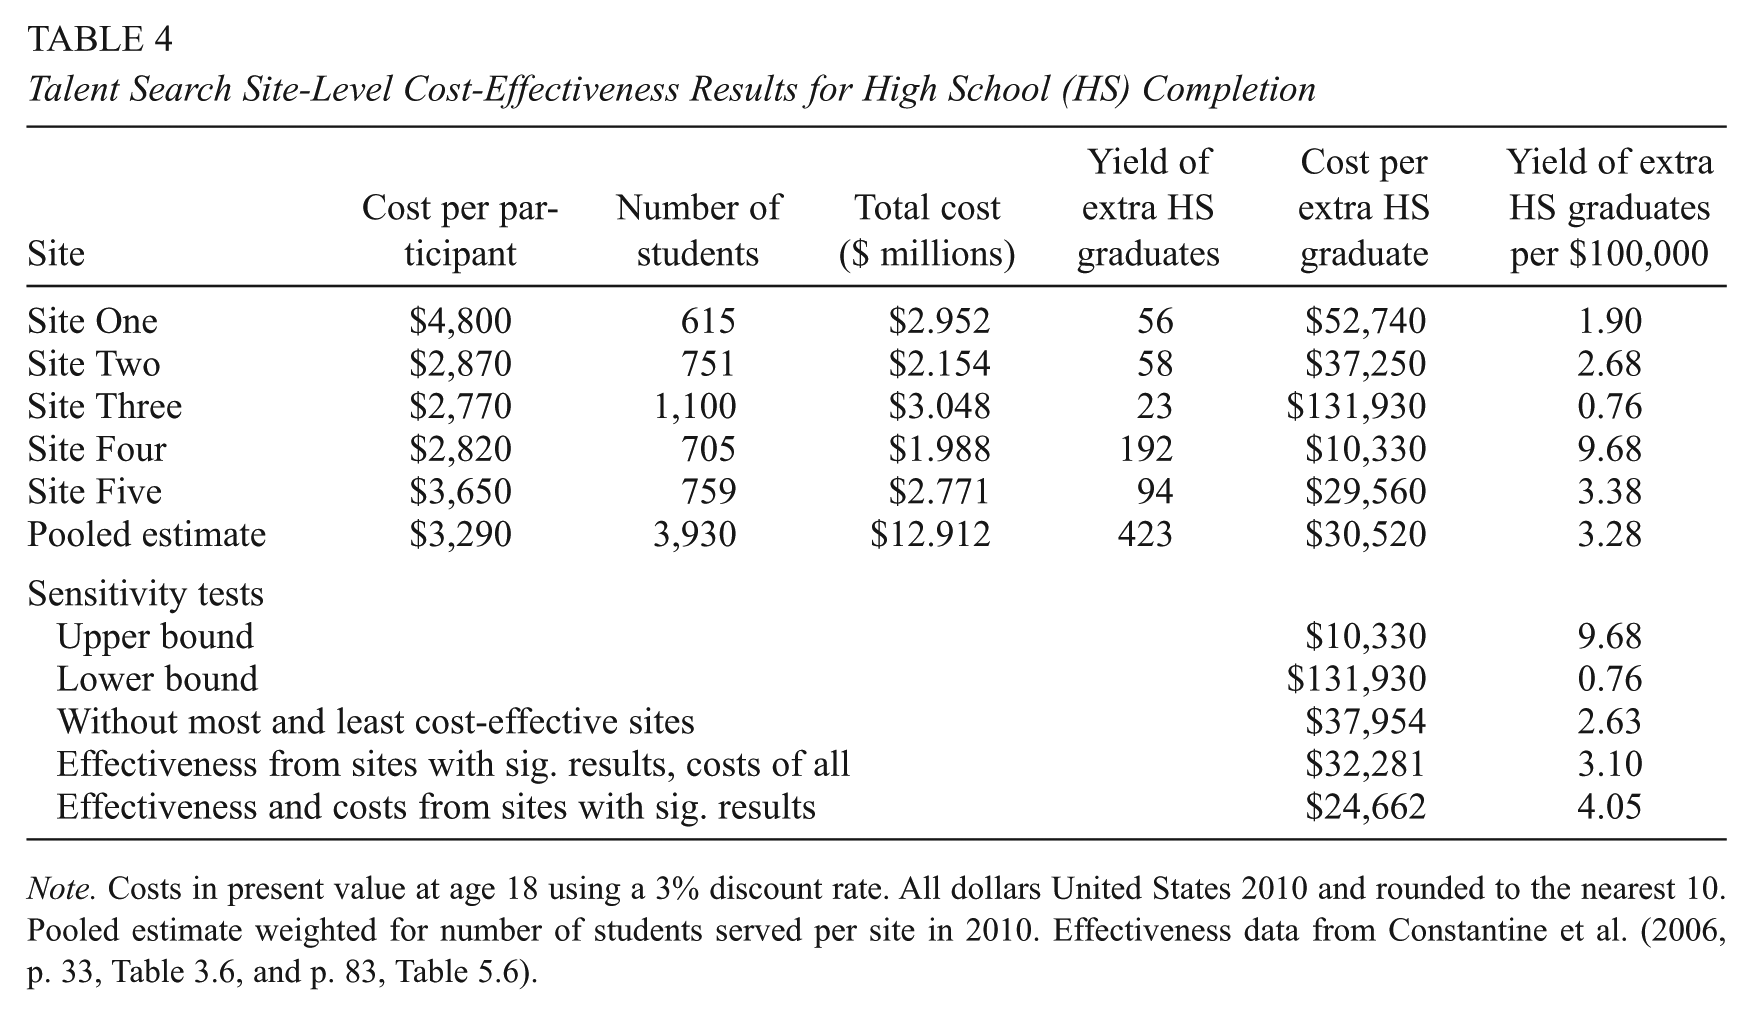
Note. Costs in present value at age 18 using a 3% discount rate. All dollars United States 2010 and rounded to the nearest 10. Pooled estimate weighted for number of students served per site in 2010. Effectiveness data from Constantine et al. (2006, p. 33, Table 3.6, and p. 83, Table 5.6).
Some of the variability in site costs was due to differences in the average number of years of participation in the program and some was due to variability in resource use. Four of the sites begin providing services in Grade 6 and one site begins when students enter Grade 8. The reported average length of participation ranged from 4 years to 7 years. Site-level cost-effectiveness rankings did not change when we varied the number of years of participation in sensitivity tests to 3 years or to 1 year. Site-level utilization of specific ingredients varied substantially across sites, as shown in Table 3. For example, two sites only employed counselors with master’s degrees, one site only employed those with bachelor’s degrees, and two sites employed a mix of both. The use of guidance counselors at the target schools also varied substantially, with resulting costs ranging from about $7,000 to almost $13,000. The sites also varied in size, ranging from 615 to 1,100 students served in 2010, but there was no clear relationship between site size and annual costs per participant, effects, or cost-effectiveness.
To provide an easily interpretable cost-effectiveness metric, we used the percentage difference in graduation rates between Talent Search participants and the comparison group at each site to calculate the number of graduates produced by Talent Search above and beyond the number expected to graduate without the program. The cost per such “extra” graduate is the metric we present as a cost-effectiveness ratio. For each site, this metric ranged widely from $10,330 to $131,930 per extra high school graduate. This may also be presented as a yield of 1 to 10 extra graduates per $100,000 spent on Talent Search. The pooled cost-effectiveness ratio for Talent Search is $30,520 per extra high school graduate. This translates to a pooled yield of about 3 extra high school graduates for every $100,000 spent.
Table 4 also reports cost-effectiveness ratios and yields from a number of sensitivity tests we performed using site-level data. These included results for the most and least cost-effective sites to represent upper and lower bounds. As these may be outliers, we also performed a third analysis that omitted the most and least cost-effective sites. For one site, the average effect reported was based on positive results for one student cohort and negative results for a second cohort, so in a fourth sensitivity test, we attributed all costs only to the four sites with statistically significant positive results. Therefore, the total costs of the program were divided by the number of youth receiving the intervention only at the “effective” sites. At the other site, where the difference in number of graduates between treatment and control groups was not statistically significant, we could not reject the hypothesis that the mean differences were a result of sampling error. So for this site, we assumed that the program had no impact but it still expended resources. If, ex ante, it is not possible to predict the effective sites, then the resources required for ineffective sites must also be included in the cost-effectiveness analysis. As an alternative, the fifth sensitivity test considered only the costs and only the extra high school graduates from the four effective sites. This test is more generous in that it implies that decision makers can identify effective sites ex ante and will invest only in those sites. Six estimates in the table showed yields of approximately two to three extra graduates per $100,000 spent.
In an additional sensitivity test, we increased the discount rate used to compound program costs to age 18 from 3% to 5%. This led to costs that were around 5% higher for the site with the shortest average program duration and almost 9% higher for the site with the longest average duration. However, the cost-effectiveness rankings among sites did not change.
Within the context of a policy imperative to improve high school completion, Talent Search may be a cost-effective option for increasing the number of students who complete high school. Given that Talent Search serves students who are in school rather than youth who have dropped out, and is a supplementary rather than stand-alone program, it is not directly comparable with the other programs discussed in this article.
Interventions Targeting Youth Who Have Dropped Out of School
Job Corps
Job Corps is a longstanding, mostly residential program for 16- to 24-year-old, low-income dropouts. Services are tailored to the needs of each participant and include basic education, vocational training, job placement assistance, social skills training, health education, health care, counseling, and driver education. The overarching goal of the program is to help students obtain employment and live independently. Effectiveness data on Job Corps were available from the National Job Corps Study conducted by Schochet, Burghardt, and Glazerman (2001). This evaluation was based on random assignment of all youths eligible for Job Corps throughout the United States between November 1994 and February 1996. We used the effectiveness data presented for the treatment-on-the-treated population. As shown in Table 2, Job Corps participants who did not already have a high school credential at program entry were 17 percentage points more likely than the control group to earn a GED or high school diploma within 48 months. However, this effect was driven by GED receipt; control group members were in fact slightly more likely than program participants to earn a high school diploma. This is not unexpected as participation in a residential program precludes regular school attendance.
We used cost data collected by McConnell and Glazerman (2001) in the year following random assignment (1996–1997). Their estimates were based on budgeted expenditures supplemented with an analysis of the costs of national and regional offices performed by an independent auditor, as well as paper and in-person surveys of a stratified random sample of 23 Job Corps centers, which inquired about grants and in-kind or donated goods and services. The evaluators aimed to capture reported operating costs, unreported operating costs, and capital costs. They included fringe benefits for employees, overhead for administration of regional and national offices, and depreciation of physical capital.
We started with McConnell and Glazerman’s (2001) estimated per participant cost to taxpayers of $16,489. We adjusted this to exclude cash transfers of $1,427 to obtain a social perspective on costs: $15,062 per participant in 1995 dollars. We included costs of food and clothing ($934), which are usually considered transfers, to allow comparability with other programs presented as it was not possible to disaggregate these costs for all programs. Adjusting for inflation, we estimated the 2010 cost per Job Corps participant at $22,290. The total program costs for 3,940 participants receiving services were almost $88 million. With a yield of 670 extra high school graduates compared with the control group, the cost-effectiveness ratio for Job Corps was $131,140 per extra high school graduate. This equated to 0.76 extra high school graduates per $100,000 spent on the program. Relative to other interventions presented, Job Corps appeared to be among the least cost-effective at improving high school completion. However, the high school completion rate for the target population, as represented by the control group, was low, at 34%, compared with 67% for the target population of NGYC. Furthermore, the main objective of Job Corps is to improve employment outcomes, not high school completion.
JOBSTART
JOBSTART was a demonstration program operating from 1985 to 1988 at 13 sites in nine states. It was a nonresidential alternative to Job Corps targeting economically and socially disadvantaged 17- to 21-year-old dropouts with reading skills below the eighth-grade level. JOBSTART services included instruction in basic academic skills, vocational education, training-related support services, and job placement assistance. Cave, Bos, Doolittle, and Toussaint (1993) evaluated the overall effectiveness of the JOBSTART program using a random assignment design. We obtained site-level effectiveness data from J. Bos (personal communication, September 6, 2012). 2 By the 48-month follow-up survey, 39.2% of those assigned to the treatment group had received a GED or high school diploma, compared with 25.9% of the control group, a statistically significant difference of 13.3 percentage points. Adjusted for the reported participation rate at each site, we obtained treatment-on-the-treated effectiveness estimates indicating a difference of 15.1 percentage points. JOBSTART participants, like those in Job Corps, were more likely to earn a GED than a high school diploma.
Site-level cost data for JOBSTART were reported by Cave et al. (1993). Information was collected on both direct and indirect costs using salary and site expenditure reports, staff interviews, and participation data. Costs were reported by activity with no information on specific ingredient requirements, the assumptions made with respect to salaries or facilities, or any adjustments made for local and regional price differences. A per-person cost was calculated for each program activity and applied to participation rates. For activities that incurred mostly fixed costs, the relevant participation rate was the percentage of students who ever participated in an activity. For activities incurring mostly variable costs, the average number of months of participation was applied to the average monthly cost per participant. In our analysis, we used the site-by-site treatment-on-the-treated cost per participant from Cave et al. (1993, p. 191, Table 7.3). The weighted average cost we calculated per participant across all sites was $10,460 in 2010 dollars. Cave et al. reported JOBSTART costs to be incremental beyond services already available in the community. While costs of these other services were not provided, survey data indicated that treatment and control groups used these services to an equal extent.
Across the full sample of youths assigned to treatment, the total cost of JOBSTART amounted to almost $10.8 million. Compared with the control group, the program yielded 155 extra high school graduates. Therefore, the cost-effectiveness ratio was $69,510 per extra high school graduate. The yield of extra high school graduates per $100,000 expenditure was 1.44.
Among the five programs we studied, the cost data for JOBSTART were collected earliest, in 1986, and therefore required the most adjustment for price-level changes. While our base-case analysis used CPI, we conducted a sensitivity test using the Employment Cost Index (ECI) to investigate how much the cost-effectiveness ratio would change, assuming that 80% of the program costs could be attributed to labor. Because the ECI increased more than CPI between 1986 and 2010, the cost-effectiveness ratio rose to $85,860 per extra high school graduate. Regardless of the choice of inflation adjustment, the JOBSTART program appeared almost twice as cost-effective as the residential Job Corps program, despite targeting a population with the lowest expected high school graduation rate among the programs we studied.
JOBSTART, like Talent Search, showed high variability of site-level costs and effects (see Tables 4.5 and 4.6 in Levin et al., 2012). Average costs per participant ranged from a low of $4,340 at 1 site to a high of $20,190 at another. Cave et al. (1993) attributed cost variations to differences in enrollment levels, scale, program design, implementation, and regional costs. On the effectiveness side, only 4 sites showed a statistically significant gain in high school completion, while 2 sites showed the counterintuitive result of lower high school completion for participants compared with the control group. Consequently, the cost-effectiveness ratios varied substantially across JOBSTART sites with the yield of extra high school graduates per $100,000 spent on the program ranging from 6.44 at the most effective of the 13 sites to −0.35 at the least effective site, that is, this site reported fewer high school graduates than the control group per $100,000 spent. A sensitivity test that included costs of all 13 sites but only the extra high school graduates from the 4 sites showing statistically significant positive effects resulted in a yield of 0.88 high school graduates per $100,000 spent. Under a more generous assumption of perfect targeting to effective sites, an additional sensitivity test included only costs and extra high school graduates from the 4 effective sites and yielded 2.12 extra high school graduates per $100,000 spent.
The four JOBSTART sites that were most effective were also the most cost-effective. However, none were among the top three sites in terms of participant cost, indicating that magnitude of investment alone cannot explain their success. Quality of implementation may have been a key factor. Auspos and Price (1989) rated the implementation of JOBSTART sites on four categories of services: education, training, support services, and job placement. Three of the four sites with statistically significant positive effects on high school completion were among the four sites that received a rating of “high” on implementation of education programs. The most successful implementations were not more costly than implementations rated “low.”
We noted above that JOBSTART appears substantially more cost-effective than Job Corps. As program costs for Job Corps were assumed to be incremental beyond the costs of services already available, we conducted a sensitivity analysis to test the reasonableness of this assumption and to see at what point Job Corps and JOBSTART would be equally efficient. We estimated that business-as-usual activities would need to account for $10,480, or 47% of the costs of Job Corps, for Job Corps to be as efficient as JOBSTART. Given that Job Corps targets dropouts who are not already receiving services comparable with a high school education, it is highly unlikely that the equivalent of nearly half of the program’s costs would have been incurred by business-as-usual services. This suggests that JOBSTART was indeed more efficient than Job Corps with respect to high school graduation.
National Guard Youth ChalleNGe
The National Guard Youth ChalleNGe program (NGYC) is an ongoing, residential program targeting 16- to 18-year-old youths who have dropped out or been expelled from school. Participants take courses in GED preparation, leadership development, and job skills, and participate in community service. Effectiveness of the NGYC program was evaluated using a random assignment design, including 3,074 youth across 10 NGYC sites by Millenky, Bloom, and Dillon (2010), and Millenky, Bloom, Muller-Ravett, and Broadus (2011). By the end of 36 months, NGYC treatment-on-the-treated participants completed high school at a rate 19.8 percentage points above that of the control group. Site-level data were not available.
Cost data for NGYC were collected by Perez-Arce, Constant, Loughran, and Karoly (2012), primarily from budgeted expenditures, complemented by interviews with site directors. Total average operating costs were estimated at $11,633 per youth, including site-level operating costs and central administration costs. This estimate included expenditures on personnel, facilities, transportation, dining operations, supplies and equipment; educational, medical, and other contracted services; outreach and security services; and volunteer time. We did not exclude the stipends paid to cadets from the operating costs since costs of these allowances were combined with costs of meals; instead, we subtracted the combined costs in a sensitivity analysis. The NGYC cost data appeared to reflect local prices rather than national prices, limiting comparability across sites and against other interventions. In addition, the average cost per participant for the overall program was calculated based on an equal weighting of the average participant cost per site. While this was consistent with reporting of effectiveness results in the impact evaluation by Millenky et al. (2011), the other programs we reviewed reported costs reflecting variability in site scale. Cost data for NGYC were collected some years after program implementation and costs of services received by the comparison group were not provided.
We transformed the total average operating cost of $11,633 per youth into a treatment-on-the-treated estimate using the program registration rate of 82.5%, thereby deriving a cost per participant for NGYC of $14,100. With a total program cost for the 596 treatment-on-the-treated NGYC participants of $8.4 million dollars and a yield of 118 extra high school graduates compared with the control group, the cost-effectiveness ratio was $71,220 per extra high school graduate and the yield per $100,000 expenditure was 1.4 extra high school graduates. Compared with the other four programs targeting dropouts, NGYC appeared to be one of the more cost-effective programs for improving high school completion. When the costs of $1,314 per youth for meals and allowances were subtracted in a sensitivity test from the operating costs of $11,633, the cost-effectiveness ratio fell to $63,310 per extra high school graduate and the yield per $100,000 expenditure rose to 1.6 extra high school graduates, placing NGYC as the most efficient of the four programs targeting dropouts. However, we note that it served a population of whom two thirds were already likely to graduate from high school without the program.
Intervention Targeting Young, Dropout Mothers: New Chance
New Chance was a national demonstration project that operated between 1989 and 1992 at 16 sites in 10 states. New Chance targeted 16- to 22-year-old mothers who had first given birth as teenagers, had dropped out of high school, and were receiving cash welfare assistance. New Chance offered five main types of services: adult basic education and GED preparation, employment-related services, health and personal development, services to enhance the development of the participants’ children, and case management (Quint, Bos, & Polit, 1997; WWC, 2008). Three features may have influenced the cost-effectiveness of New Chance. First, the program was relatively small in scale: Sites were expected to serve around 100 participants over 12 to 18 months. Second, the schedule for New Chance participation was similar to schooling: Participants were expected to attend all classes 5 days a week. Third, New Chance lasted longer than many programs targeting high school dropouts: Participants could remain enrolled for 18 months, with up to a year of follow-up services.
Quint et al.’s (1997) evaluation, based on a random assignment of 2,322 women, showed that participants in New Chance were 9.2 percentage points more likely to complete high school than the control group within 42 months after assignment. As for Talent Search and JOBSTART, there was considerable site-level variation in effectiveness, with gains in the high school completion rate for the treatment group as high as 31 percentage points at the most effective site and as low as −10 percentage points at the most ineffective site.
Cost estimates for New Chance were collected by Fink and Farrell (1994) using an approach similar to that used by Cave et al. (1993) for JOBSTART. Estimates were based on individual staff salary information, time-study data, staff interviews, site expenditure reports, and participation tracked using an information system. It is unclear whether local cost data were adjusted to reflect national prices. Costs were reported for a 1-year “steady-state period” from 1990 to 1991, and comprised expenditures on personnel and overhead, including rent, utilities, equipment, supplies, fringe benefits, and administration. The program was categorized into different service components and the total annual expenditure per component was divided by a participation measure to obtain the unit cost per period of time. The cost per experimental participant for each component was derived as the unit cost multiplied by the participation measure over the whole period of the program. The total cost per experimental participant for each site was calculated as the sum of the costs per experimental participant for each component. We divided these intent-to-treat estimates of the site-level average costs by the corresponding participation rates to obtain the treatment-on-the-treated estimates of average cost per participant.
According to Fink and Farrell (1994), a high proportion of both the control group and the New Chance participants received educational and occupational training services from other programs. While these costs were not estimated by Fink and Farrell, and are therefore not included in our analysis, Quint et al. (1997) estimated costs of all services received by New Chance participants (i.e., New Chance costs plus the costs of other services) and compared these with costs of services used by the control group. They found the latter to be 17% to 31% lower depending on assumptions about costs of childcare and case management.
Among the full sample of 1,240 participants, New Chance cost $17,820 per participant and yielded 113 extra high school graduates above and beyond those that would be expected without treatment, at a total cost of $22.1 million for the whole program. These results translated into a cost-effectiveness ratio of $194,640 per extra high school graduate and a yield of 0.51 extra high school graduates per $100,000 expenditure. Compared with other programs analyzed here, New Chance appeared to be the least cost-effective at improving high school completion. However, a direct comparison is unwarranted because the program offered young mothers and their children a wide range of supports.
As site-level costs and effects were available for New Chance (see Tables 4.7 and 4.8 in Levin et al., 2012), we performed the same site-based sensitivity tests as for JOBSTART. The most cost-effective of the 16 New Chance sites yielded 1.67 extra high school graduates per $100,000 spent on the program, more than three times the estimate for the overall program. The least cost-effective site yielded 0.69 fewer high school graduates than the control group for every $100,000 spent. Including costs from all sites but only counting extra graduates from the effective sites, the yield of extra high school graduates per $100,000 spent fell to 0.35 compared with the overall program estimate of 0.51. Under the assumption of perfect targeting to effective sites where we included only costs and extra graduates from the effective sites, the yield rose to 1.32 extra high school graduates per $100,000 spent. As for Talent Search and JOBSTART, costs and cost-effectiveness for New Chance were not obviously related at the site-level but three of the four effective sites were also the most cost-effective. This latter result is to be expected if costs are uniform across sites. While costs of the program were not uniform across sites, the costs did not vary as much as the effectiveness estimates across the sites.
Discussion and Conclusion
Summary of Findings
The results of our cost-effectiveness analyses indicate that the costs to produce extra high school graduates from a population of dropouts through non-school-based programs, above and beyond those expected to graduate without program participation, range from around $70,000 to $195,000 per extra graduate. These high costs may reflect the difficulty for education programs alone to overcome barriers to educational success deriving from both academic and out-of-school influences (Rumberger, 2011b). They may also reflect the fact that each program addressed multiple outcomes in addition to high school completion. Some of the differences in program impact and cost may be explained by the probability of high school graduation for the target population even without receiving program services. For example, 67% of the NGYC target population was likely to graduate from high school without treatment, compared with only 34% of the Job Corps target population.
While inconsistencies in collection of cost data across programs and differences in target populations limit the reliability of comparing results across the five programs, NGYC and JOBSTART appear more cost-effective at increasing high school completion among dropouts than Job Corps. New Chance appears the least cost-effective but is not directly comparable because it serves a different population. Differences in average cost per participant for each program appear to partially explain these cost-effectiveness results. The costs for NGYC, $14,100 per participant, seem low for a residential program, but the intensive part of the program is relatively short at 22 weeks, with only around 20 hours of follow-up services over the next year. The $22,290 cost per student for Job Corps is high, partly due to the residential nature of the program over about 7 months, and partly due to the fact that services provided are more intensive than those offered by JOBSTART, a similar but nonresidential program averaging around 6 months in duration and costing only $10,460 per participant. New Chance, at $17,820 per participant, was both relatively expensive compared with the other three programs for dropouts and less effective, resulting in the least favorable cost-effectiveness ratio. However, the target population, new mothers aged 16 to 22, were arguably a tougher population to help complete high school, requiring additional supports such as childcare and other services for their children.
While Talent Search cannot be directly compared with the four programs serving dropouts, the cost-effectiveness ratio we calculate for this program with respect to high school completion is less than half the amount for the most cost-effective out-of-school program. There are some straightforward reasons for this finding. Talent Search, for the majority of students who participate in the intervention, is a supplementary program providing services to students over and above what they already receive in school. It is also more narrowly focused than other programs: Beyond high school graduation, its goal is to get students into college. In contrast, the other programs provide an array of services including health services and employment training with the aim of improving employability, earnings, health, and other life outcomes. Talent Search is targeted at a population of students who have a 72% chance of completing school and may need fewer resources than dropouts to help them succeed in this goal.
Overall, it is apparent that remedial programs aiming to help dropouts obtain a GED or high school diploma are very expensive relative to preventive programs such as Talent Search that target students still in school. While the benefits of the extensive services offered by remedial programs such as Job Corps, JOBSTART, NGYC, and New Chance may extend beyond academic attainment to include higher earnings and better life outcomes, these cannot be captured in a cost-effectiveness analysis that compares programs with respect to high school completion. However, given the substantial returns to individuals and society of high school graduation (Levin & Belfield, 2007), the costs of remedial programs are probably worthwhile, that is, the total long-term economic benefits are likely to exceed the total costs, as found in cost-benefit analyses of NGYC (Perez-Arce et al., 2012) and Job Corps (McConnell & Glazerman, 2001).
Analysis of site-level data for Talent Search, JOBSTART, and New Chance indicate clearly that some sites in each program are very cost-ineffective in raising the high school completion rate and that an overall cost-effectiveness analysis of each program—and perhaps by implication other interventions with site-specific variation—is very imprecise. These results support our assertion that site-level cost-effectiveness ratios are more accurate and informative for decision makers than pooled estimates derived from multiple sites that mask differences in implementation, resource allocation, and effectiveness.
Lessons From Conducting Retrospective Cost-Effectiveness Analyses
Our efforts to conduct a cost-effectiveness analysis of programs that improve high school completion lead us to a number of conclusions about conducting cost-effectiveness analysis using preexisting data. We review the challenges we encountered to offer lessons for others attempting to conduct similar analyses in this or other areas of educational programming.
One essential lesson is that costs and effectiveness of an intervention should be assessed simultaneously at the same sites and based on the same sample of study participants. Although this advice may seem obvious, it directly contrasts with that given in a recent prominent review offering guidance for effectiveness research. In their otherwise excellent treatment, Chandra, Jera, and Skinner (2011) state that “effects are typically expensive to determine and require years or even decades of data. Costs are much easier to measure, and can be appended at a later date” (p. 34). We argue that costs should be based on actual resource use, and that it is much harder to identify these resources retrospectively.
In addition, we show the importance of conducting cost analyses at the same sites where impact is assessed: If cost data are not obtained from these sites, it may not be legitimate to resample and collect these data from different sites. Our analyses of New Chance, JOBSTART, and Talent Search show that when variability in site-level costs and effectiveness are high, calculating a cost-effectiveness ratio for the program using pooled results is imprecise. Site-level analysis yields more accurate results and demonstrates the range of cost-effectiveness across different implementations of the same program. Data on impact and costs should be accompanied by descriptions of program implementation at each site such that variations in implementation can help explain variations in costs and effectiveness. Such descriptions could shed light on practices at the most effective sites that could be emulated elsewhere and problems at the least effective sites that might be avoided.
Even when a program is well defined and has not changed over time, it is unlikely that retrospective cost data can be collected for the counterfactual or comparison group. While this group does not receive resources from the program being evaluated, it may receive similar resources from alternative programs. It is possible that the evaluated program is actually cheaper than business-as-usual, which would have significant implications for interpreting effectiveness evidence. Only by contemporaneously tracking the nonparticipants is it possible to get accurate information on their resource use.
Our final lesson is that, to compare alternative interventions in a cost-effectiveness analysis, costs should be collected in a consistent manner across evaluations. The research community already strives for consistency in studies of effectiveness by using standard experimental or nonexperimental methods. Similarly, evaluations should ascertain total program costs and average individual costs by applying a consistent cost method. The ingredients method we recommend is designed to capture all components of each program being evaluated and to apply a consistent set of prices in a comparative framework. Opportunity costs of all resources are accounted for in each program being compared; labor costs are calculated with benefits included where relevant; prices are consistent, for example, all national averages; and facilities and capital costs are accounted for using the same method, for example, market rental rates or amortization method. This approach avoids the apples to oranges comparisons that arise when different costing methods are used across programs. It also has the advantage of transparency: For a given ingredient, other researchers can see exactly how it is priced. In the same way that WWC sets rigorous, well-documented standards for reviewing effectiveness, we believe that equivalent standards should be promoted for cost-effectiveness analysis.
The Role of Cost-Effectiveness Analysis in Decision Making
The ultimate value of a cost-effectiveness analysis is its ability to help decision makers allocate limited resources to maximize effectiveness in seeking educational goals. In the context of high school completion programs, our current analysis is limited to five programs, and only three (Job Corps, JOBSTART, and NGYC) may be considered policy alternatives serving similar populations of dropouts. Even among this small number of options, it is clear that significant differences in efficiency of resource use exist between programs and among sites within programs. Availability of such data for a wide range of program options would greatly facilitate resource allocation decisions. Furthermore, within a single program, site-level cost-effectiveness data would help decision makers choose which sites can serve as models for the program and which ones need reforming or closing. More generally, if a decision maker needs to work within a limited budget, as might be the case for a school principal, a table of cost-effectiveness ratios for interventions addressing an outcome of interest can help determine which intervention would provide the most impact for the lowest cost. If the budget limit is not yet established, as might be the case for a legislator with flexibility to allocate funds across social program areas, the data could be used to identify the interventions that promise the greatest desirable impact.
While cost-effectiveness ratios and rankings are key pieces of information for choosing among alternatives, they are not the only criteria that should be used. Other considerations may determine feasibility. It is important to assess whether the resources or ingredients required to implement a particular intervention would be easily available at comparable costs in the decision maker’s jurisdiction (Tsang, 1997). If, for example, an intervention required the employment of additional specialists in reading and the decision maker was aware of a local shortage of such individuals, he or she might anticipate that local costs would be proportionately higher than the national average, and would therefore result in a less favorable cost-effectiveness ratio. The decision maker must also consider which interventions are likely to be acceptable in his or her jurisdiction from both a regulatory and political standpoint. For example, an intervention that would require eliminating teaching positions might contravene an existing contract with a teachers union or run up against state-mandated class size requirements. In addition, many parents will object to any increase in class size.
Analyses that calculate the cost-effectiveness ratios of interventions at different levels of scale allow decision makers to assess whether an intervention that has been cost-effective in a small setting is likely to be cost-effective if replicated on a broader scale. Had such an analysis been conducted in 1996 for decision makers in California prior to adopting class size reduction for 1.6 million children, modeled on the Tennessee STAR project which served only 7,000 children, it would have been clear that the costs of recruiting and training an enormous cadre of new teachers and of creating more classroom space would mitigate the appeal of the intervention.
Decision makers can use contextual information to analyze possible reasons for differences in cost-effectiveness ratios of alternative programs. For example, a comparison between the cost-effectiveness ratios for a highly focused program with a single outcome and a broad-based program with multiple outcomes may be misleadingly unfavorable to the latter, as the cost in question is, in effect, buying more than the single measured outcome. Programs also differ in their level of targeting; for example, high school completion programs that successfully target students just on the margin between dropping out and graduating will, all else being equal, appear to be more cost-effective than those that serve a broader population of students. Decision makers must consider whether such targeting is realistic when implementing programs in their own context or, if a program may have benefits to participants beyond the immediate intended effect, whether such targeting is desirable.
We emphasize that, to inform educational policymaking, cost-effectiveness comparisons should be routinely incorporated into evaluations of educational programs. Without such comparisons, even the highest quality research evidence presents an incomplete and perhaps misleading picture to decision makers. As we show here, cost-effectiveness analysis has its own methodological challenges. In this endeavor, we were constrained to use the best available, but retrospective, cost and effectiveness data. This is not the most accurate or parsimonious way of performing an economic evaluation. We believe that by documenting program ingredients at the time of implementation, costs can be ascertained with greater accuracy. When this method is applied consistently across multiple interventions, it will allow for more precise cost-effectiveness comparisons and consequently more salient guidance for education policy.
Footnotes
Authors’ Note
The authors collaborated as a research team with all providing substantive contributions to the project. Belfield and Levin designed the study and its implementation. Hollands served as the overall coordinator, summarizer, and writer. Bowden, Cheng, Hanisch-Cerda, Pan, and Shand carried out the extensive data collection. The opinions expressed in this article are those of the authors and do not represent the views of the Institute of Education Sciences or of the U.S. Department of Education.
Declaration of Conflicting Interests
The author(s) declared no potential conflicts of interest with respect to the research, authorship, and/or publication of this article.
Funding
The author(s) disclosed receipt of the following financial support for the research, authorship, and/or publication of this article: This research was supported by the Institute of Education Sciences, U.S. Department of Education, through Award Number R305U120001 to Teachers College, Columbia University.
Notes
Authors
FIONA HOLLANDS is the associate director and a senior researcher at the Center for Benefit-Cost Studies of Education at Teachers College, Columbia University. Her research interests include cost-effectiveness analysis of educational programs, online and blended learning, and models of comprehensive supports for disadvantaged students.
A. BROOKS BOWDEN is a research associate and the assistant director of the Center for Benefit-Cost Studies of Education at Teachers College, Columbia University. She is interested in conducting rigorous evaluations of educational policies and programs to provide stakeholders with information on costs and causal impacts.
CLIVE BELFIELD is an associate professor of economics, Queens College, City University of New York and co-director of the Center for Benefit-Cost Studies of Education, Teachers College, Columbia University. His research interests are the economic returns to education.
HENRY M. LEVIN is the co-director of the Center for Benefit-Cost Studies of Education and the William Heard Kilpatrick Professor of economics and education, Teachers College, Columbia University. He specializes in the economics of education, cost-effectiveness and cost-benefit analysis, and educational choice.
HENAN CHENG is a postdoctoral fellow at the Center for Benefit-Cost Studies of Education at Teachers College, Columbia University. She is also an adjunct assistant professor in the Department of International and Transcultural Studies at Teachers College. Her primary research interests include policy issues facing urban schools in the United States, and education of ethnic minorities and children of internal migrants in China.
ROBERT SHAND is a researcher at the Center for Benefit-Cost Studies of Education at Teachers College, Columbia University. His research interests include teacher training and effectiveness, education of recent immigrant students, and the transition from high school to college.
YILIN PAN is a doctoral student in economics and education, and a researcher at the Center for Benefit-Cost Studies of Education, Teachers College, Columbia University. Her research interests include cost analysis, decision theory, and randomized evaluations.
BARBARA HANISCH-CERDA is a PhD student in the economics of education at Teachers College, Columbia University. She is a researcher at the Center for Benefit-Cost Studies of Education and is developing a software tool to facilitate the execution of cost-effectiveness analyses. Her research interests are in cost-effectiveness analysis of educational programs, policy evaluation, and evaluating educational voucher systems.