



Abstract
We used population-based, longitudinal data to investigate the relation between mathematics instructional practices used by first-grade teachers in the United States and the mathematics achievement of their students. Factor analysis identified four types of instructional activities (i.e., teacher-directed, student-centered, manipulatives/calculators, movement/music) and eight types of specific skills taught (e.g., adding two-digit numbers). First-grade students were then classified into five groups on the basis of their fall and/or spring of kindergarten mathematics achievement—three groups with mathematics difficulties (MD) and two without MD. Regression analysis indicated that a higher percentage of MD students in the first-grade classrooms were associated with greater use by teachers of manipulatives/calculators and movement/music to teach mathematics. Yet follow-up analysis for each of the MD and non-MD groups indicated that only teacher-directed instruction was significantly associated with the achievement of students with MD (covariate-adjusted effect sizes [ESs] = .05–.07). The largest predicted effect for a specific instructional practice was for routine practice and drill. In contrast, for both groups of non-MD students, teacher-directed and student-centered instruction had approximately equal, statistically significant positive predicted effects (covariate-adjusted ESs = .03–.04). First-grade teachers in the United States may need to increase their use of teacher-directed instruction if they are to raise the mathematics achievement of students with MD.
Yet relatively few investigations have examined whether and to what extent a range of student-, family-, classroom-, and school-level factors contribute to early mathematics achievement, particularly for students with learning difficulties (e.g., Aunola, Leskinen, Lerkkanen, & Nurmi, 2004; Jordan, Kaplan, & Hanich, 2002). Even fewer studies have examined the effects of specific instructional practices that first-grade teachers might use to more effectively increase mathematics achievement (Desimone & Long, 2010; Palardy & Rumberger, 2008). It is currently unknown to what extent these practices, when used naturally by teachers as part of their day-to-day instructional routines, are uniformly effective or instead have differential effects when used with students who do and do not have mathematics difficulties (MD; Kroesbergen & Van Luit, 2003). Yet researchers have already observed differential effects for specific types of reading practices (Sonnenschein, Stapleton, & Benson, 2010; Xue & Meisels, 2004), identifying instructional practices that teachers may use to increase reading achievement for those with and without reading difficulties (e.g., Foorman et al., 2006).
Teacher-Directed and Student-Centered Mathematics Instruction
Two potentially effective types of instructional practices can be characterized as “teacher-directed” or “student-centered” (e.g., Clements, Agodini, & Harris, 2013; Guarino, Hamilton, Lockwood, & Rathburn, 2006; Le et al., 2006; NMAP, 2008; National Research Council, 2001; Staub & Stern, 2002). The goal of teacher-directed instruction is “transmitting sets of established facts, skills, and concepts to students” (Clements & Battista, 1990, p. 34). Teachers initially demonstrate specific procedures for solving problems, and then provide students with repeated opportunities (e.g., worksheets, routine practice and drills) to independently practice these procedures. Teacher-directed practices should help students increase their procedural fluency in applying explicitly taught and repeatedly practiced sets of procedures to solve mathematics problems, which should result in more effective use of higher order thinking and problem-solving skills (Stein, Silbert, & Carnine, 2004).
Teacher-directed practices may be particularly helpful to students experiencing MD (Kroesbergen, Van Luit, & Maas, 2004; NMAP, 2008). This is because these practices often place less demand on attention, working memory, language, and general cognitive resources—resources with which students with MD often display deficits or delays (e.g., Miller & Mercer, 1997). 1 Emphasizing procedural fluency for students with MD may be especially appropriate as they begin to master basic knowledge and skills (e.g., number identification, rote counting) requiring relatively less abstract reasoning or other higher order strategies (Kroesbergen & Van Luit, 2003).
In contrast to teacher-directed instruction’s emphasis on the transmission of teacher-provided knowledge to students, student-centered instruction gives “preeminent value to the development of students’ personal mathematical ideas” (Clements & Battista, 1990, p. 35). 2 Student-centered activities provide students with opportunities to be actively involved in the process of generating mathematical knowledge (Clements & Battista, 1990; NMAP, 2008). Students work on problems involving real-life situations, lead discussion of these problems, and learn how the problems may be solved using several different solutions (McCaffrey et al., 2001). Students also learn multiple strategies for explaining and solving mathematics problems, as well as to compare and contrast these strategies through cooperative activities with other students in the classroom (e.g., Bottge, Heinrichs, Chan, & Serlin, 2001; Carpenter et al., 1997; Usiskin, 1997). Student-centered practices place greater emphasis on understanding underlying mathematical concepts than on acquiring procedural fluency. Learning these concepts should in turn help students realize the usefulness of particular mathematical skills, the contexts in which these skills are used, as well as how these skills relate to other, previously learned skills (National Research Council, 2001). This in turn should result in greater skill retention and fewer problem-solving errors, and, over time, increased mathematics achievement (National Research Council, 2001). Opportunities to communicate their mathematical understanding should strengthen children’s metacognitive reasoning (Parmar & Cawley, 1991; Schoenfeld, 1992). Other types of activities consistent with student-centered instruction and that are also thought to increase mathematics achievement include greater use of (a) manipulatives or calculators or (b) movement and music (Huntley, Rasmussen, Villarubi, Sangtong, & Fey, 2000; Wood, 2008). These additional types of activities also emphasize conceptual understanding and greater student-directed learning, particularly in contrast to more traditional, teacher-directed practices (e.g., worksheets, textbooks).
Students without MD may be better able to benefit from student-centered instructional practices due to the greater organizational, social, verbal, and task demands of this approach (Baxter, Woodward, & Olson, 2001; Kroesbergen et al., 2004; Mayer, 1998). These students may sometimes be provided with too much teacher-directed instruction and independent work (e.g., Claxton, 2002; Cobb & McCain, 2002; National Research Council, 2001; Woodward & Montague, 2002), which may slow the development of their conceptual understanding of key topics (Hiebert, 1999; National Research Council, 2001; Woodward & Howard, 1994). The generally poor mathematics achievement of many U.S. schoolchildren has sometimes been hypothesized to result from the over-use of teacher-directed instruction, particularly with non-MD students (e.g., Hiebert, 1986; Woodward & Montague, 2002).
Evaluating the Contributions of Teacher-Directed or Student-Centered Instruction to Student Mathematics Achievement
Which instructional practices should first-grade teachers use to best facilitate the mathematics achievement of MD and non-MD students? This is not well established. The NMAP’s (2008) Task Group on Instructional Practices attempted to synthesize the extant experimental evidence but found that the very limited literature base “does not provide a case for favoring or promoting either strategy over the other” (pp. 6–24). Non-experimental studies have also been undertaken to identify instructional practices that relate most strongly to increases in mathematics achievement when used naturally by teachers in their classrooms. 3 These non-experimental studies are important because “surprisingly little” is known about how teachers’ day-to-day mathematics instruction contributes to student learning (Palardy & Rumberger, 2008, p. 112). The non-experimental studies generally report weak or inconsistent effects (e.g., Aitken, Bennett, & Hesketh, 1981; Desimone & Long, 2010; Saxe, Gearhart, & Seltzer, 1999). For example, Le et al.’s (2006) large-scale study yielded instructional practice estimates that were small in magnitude or statistically non-significant. Some of the measures of specific practices—group-work, mixed-ability group-work, and problem-solving group-work—had negative effects on learning. Only seatwork had a large, positive effect on elementary schoolchildren’s mathematics achievement. Hamilton et al. (2003) reported an average effect size (ES) estimate for student-centered instruction of .03, with confidence intervals ranging from −.001 to .06. Palardy and Rumberger’s (2008) analyses yielded small and variable associations for the two specific types of mathematics instructional practices evaluated. Desimone and Long’s (2010) analyses yielded small, inconsistent associations with instruction for at-risk student groups (e.g., those from low-socioeconomic status [SES] households). Guarino et al.’s (2006) analyses indicated that both “traditional practice and computation” and “student-centered mathematics instruction,” as measured by teacher reports, predicted gains in kindergarteners’ mathematics skills. Guarino, Dieterle, Bargagliotti, and Mason’s (2013) subsequent analysis reported on a few significant associations between specific instructional practices and first-grade mathematics achievement, with ESs ranging from .03 to .04 depending on the estimation procedure.
The Extant Work’s Methodological and Substantive Limitations
The extant work indicates that some instructional practices may relate to children’s mathematics achievement, but that the ESs are likely to be small. Yet, this work has several limitations. Although differential effects have repeatedly been observed in studies of instructional practices in reading (Sonnenschein et al., 2010; Xue & Meisels, 2004), the existence of differential effects of instructional practices with MD and non-MD students has yet to be established. Doing so is important because MD might be affected by changes in instructional practice. In particular, few studies have contrasted teacher-directed and student-centered mathematics instruction as pedagogically distinct approaches. The extant work has been criticized for ignoring student-, classroom-, and school-level factors, and instead examining only (a) student- and classroom- or (b) student- and school-level factors (Palardy & Rumberger, 2008). Doing so may have resulted in inflated ES estimates. In addition, these studies have often been unable to control for prior mathematics achievement, SES, and other potential confounds (e.g., Le et al., 2006). Despite constituting a “gateway grade,” as mathematics instruction becomes increasingly formal, Camburn and Han’s (2011) recent synthesis “turned up very little evidence on instruction in first grade” (p. 574), as only 10% of the included studies reported results from this grade level. Only one fourth of the included studies were peer reviewed. Thus, researchers, policymakers, and practitioners currently lack rigorously-derived estimates of the extent to which teacher-directed and student-centered instructional practices, when used naturally by first-grade teachers, relate to mathematics achievement gains by students, particularly by those experiencing MD. Such estimates should be especially timely given the recent adoption of Common Core standards and their greater emphasis on in-depth understanding (see http://www.corestandards.org). Furthermore, it is unknown whether these instructional practices yield differential effects on the mathematics achievement of students with transitory or persistent MD, as well as average versus high achievers without MD. Yet, students with persistent MD (i.e., experiencing MD repeatedly over time) are very likely—even as early as kindergarten—to continue experiencing MD as they age (Morgan et al., 2009), thereby necessitating instruction better tailored to their learning needs (Toll & Van Luit, 2012). More generally, it is largely unknown which instructional practices and content-area skills are emphasized by first-grade teachers, and how these instructional choices vary by the skill level of students in the classroom. This knowledge can help identify whether first-grade teachers are matching, or possibly mismatching, their mathematics instruction to the learning needs of first-grade students, including those with MD (e.g., Engel, Claessens, & Finch, 2012).
Study’s Purpose
The purpose of the present study was to identify patterns of mathematics instruction by first-grade teachers, and the relation between the frequency with which they used various instructional practices and the mathematics achievement of their students. 4 We were particularly interested in establishing whether the observed relations differed for students with and without a prior history of MD, including those with transitory or persistent MD. Three questions guided our study as follows:
Method
Analysis Plan
We undertook four analytical steps to investigate these questions. We first began with teachers’ responses to two sets of questions. One set asked teachers how often (number of times per week or per month) they used each of 19 mathematics instructional activities (e.g., count out loud, work with geometric manipulatives, do math problems from their textbooks, solve math problems in small groups or with a partner). The other set of questions asked how often teachers taught each of 29 mathematical skills (e.g., writing all numbers between 1 and 10, sorting objects into subgroups according to a rule, adding single-digit numbers). To identify underlying structures, we factor analyzed all 48 items together. As further described below, 12 factors emerged. One factor was consistent with teacher-directed instructional activities, and 3 were consistent with student-centered instruction or related activities (i.e., using manipulatives/calculators or movement/music to help children learn mathematics). In addition, 8 factors corresponded to groupings of specific mathematics skills whose instructional frequencies loaded together in the factor analysis. We examined the correlations among the 12 factors to see which were more or less likely to occur together.
Our second analytical step involved dividing the sample of students into MD and non-MD groups. To construct these groups, we used the weighted distribution of Mathematics Test scores in the fall and spring of kindergarten as estimates of the national score distributions at these time points. We classified students in the bottom 15% of the score distributions at either time point as MD at that time. We defined three MD groups, consistent with Morgan et al.’s (2009) findings that students with MD in the fall and/or spring of kindergarten displayed distinct achievement growth trajectories for the remainder of elementary school. We did so as follows: (a) students who were MD in both fall and spring (i.e., persistent MD), (b) those who were MD in the fall only, and (c) those who were MD in the spring only. We considered those displaying MD in only the fall or spring as having transitory MD. For students who were MD at neither kindergarten time point, we used their spring of kindergarten scores to divide them into the bottom half of non-MD students (referred to as low-to-middle achievers) and the top half of non-MD students (middle-to-high achievers), respectively. These groupings resulted in a total of 2,486 sampled students approximately evenly divided across the three MD groups, and 10,907 sampled students approximately evenly divided across the two non-MD groups. We then computed descriptive statistics for each of these five groups to examine how instructional, student, family, classroom, and school variables differed across the groups.
Our third analytical step examined how a teacher’s use of instructional practices varied in response to having a larger share of MD students in the classroom. We first computed the percentage of (any of the three groups of) MD students among the surveyed students in each sampled teacher’s classroom. The number of children sampled in these classrooms varied from 1 to 24, with most falling in the 1 to 10 range. Although it is based on an incomplete sample of all children in each of the classrooms, this percentage provides an unbiased estimate of the true percentage of MD children in these classrooms. (As a check on this, we found no relation between the number of children sampled in each class and the estimated percentage of MD students in the class.) We then regressed the frequency with which the teacher engaged in each of the four sets of instructional activities and taught the eight sets of skills against the classroom percentage of students with MD.
For our fourth step, and separately for each of the three MD and two non-MD groups, we estimated multi-level regressions using the 12 instructional factors and extensive covariate adjustment to predict the children’s mathematics achievement in the spring of first grade. Because the study’s covariates included prior mathematics achievement, these regressions may be considered as residualized change, or value-added estimates. Collectively, these analyses provide rigorously-derived estimates of the extent to which a range of instructional practices used by teachers relate to mathematics achievement gains by students with and without a prior history of MD in U.S. first-grade classrooms.
Database and Analytical Sample
We analyzed data from a longitudinal analytical sub-sample of kindergarten children participating in the Early Childhood Longitudinal Study, Kindergarten Class of 1998-99 (ECLS-K). The ECLS-K is maintained by the U.S. Department of Education’s National Center for Education Statistics (NCES). NCES used multi-stage random sampling to recruit a nationally representative sample of children entering kindergarten in the fall 1998. These students attended both public and private kindergartens offering full- and part-day programs. (Additional details of the ECLS-K data set are available at http://nces.ed.gov/ecls/kindergarten.asp). We used multiple imputation to maximize the study’s analytical sample size (Allison, 2002; Little & Rubin, 1987; Rubin, 1987; Schafer, 1997). Specifically, we used multiple imputation for a baseline group of kindergarten children with valid sample weights and valid individual- and school-level identifying numbers. We used the NCES-constructed student sampling weight from the spring kindergarten and spring first-grade survey waves.
We used the IVEware software (Raghunathan, Solenberger, & Van Hoewyk, 2002) to impute missing values. This resulted in five imputed data sets. Multiple imputation adjusts parameter estimates and standard errors for uncertainty due to missing data (Sinharay, Stern, & Russell, 2001). It should provide unbiased coefficient estimates for the sample if, conditional on control variables in the regressions, data were missing at random. Our data should approximate this condition because we utilized an extensive set of control variables and allowed a number of them (e.g., SES) to have non-linear effects. These procedures yielded an analytical sample size of 13,393 children who participated in the ECLS-K from the fall of kindergarten to the spring of first grade. As described above, we used the weighted distribution of mathematics achievement test scores in the fall and spring of kindergarten to define three MD and two non-MD groups of students. Of the 13,393 (unweighted) children in the sample, 2,486 did and 10,907 did not have a prior history of MD, as measured by their scores in the fall and spring of kindergarten. (Note that the sampled children falling in the bottom 15% of the weighted distributions constituted more than 15% of the analytical sample because over-sampled groups of children tended to have below-average test scores.) These students attended 3,635 classrooms in 1,338 schools.
Measures
Total Time on Mathematics Instruction
Teachers reported the total number of minutes per week that they spent on mathematics instruction. We controlled this variable (and its value squared) when estimating the association between the frequency of different instructional activities and skills taught and students’ mathematics achievement. This control variable allows us to isolate the unique effects of different instructional activities and skills taught, separate from the total time spent on mathematics instruction.
Mathematics Instructional Activities and Skills Taught
Teachers rated how frequently (i.e., daily, 3–4 times a week, 1–2 times a week, once a month, or never) students in their first-grade classrooms engaged in 19 specific mathematics instructional activities and were taught 29 specific mathematics skills. (A complete listing of the activities surveyed is available at http://nces.ed.gov/ecls/kinderinstruments.asp.) These questionnaires included groups of items forming scales of teacher-directed or student-centered activities. We undertook similar scale construction to those used by Guarino et al. (2006). We standardized the teacher’s responses by recoding them to the frequency per month that each mathematics instructional activity or skill taught occurred in the classroom. We did so to account for the measure’s original scaling, in which some response categories were coded on a per week basis and others were coded on a per month basis. To arrange these response options on a common scale, we defined a month as 20 school days in 4 weeks. If a teacher reported using a particular practice only once a week, then we recoded that response as 4 times per month. If a teacher reported using a particular practice 5 times per week, we recoded that response to be 20 times per month. Frequencies given on a monthly basis remained on that basis.
Mathematics Achievement
We used the ECLS-K’s Mathematics Test to estimate children’s mathematics achievement. NCES used a multi-step panel review process to establish the ECLS-K’s Mathematics Test as a psychometrically sound measure of children’s mathematics achievement (Rock & Pollack, 2002). The test was based on the National Assessment of Educational Progress (NAEP)’s specifications. The ECLS-K research team used item response theory (IRT) to create adaptive, untimed tests administered one-to-one to each student. Thus, students were given a test whose coverage varied according to their grade and skill level. Criterion-referenced clusters of items were associated with specific stages that students pass through as they acquire more sophisticated mathematical knowledge. The Mathematics Test consisted of the following hierarchically ordered subscales: (a) Count, Number, Shape; (b) Relative Size; (c) Ordinality, Sequence; (d) Add/Subtract; (e) Multiply/Divide; (f) Place Value; (g) Rate and Measurement; (h) Fractions; and (i) Area and Volume. As students moved from kindergarten through to first grade, their relative mastery of these skills increased as expected. Reliabilities of the theta scores were in .93 and .94 in the springs of kindergarten and first grade, respectively (NCES, 2002). We statistically controlled for these students’ mathematics achievement at the spring of kindergarten when estimating the relation between the use of instructional practices by first-grade teachers and their students’ mathematics achievement gains. Statistically controlling for the “autoregressor” provides a conservative estimate of the predicted effects of other factors (e.g., Finkel, 1995; Torgesen, Wagner, Rashotte, Burgess, & Hecht, 1997).
MD
We estimated the predicted effects of the instructional practices separately for students with and without a prior history of MD. As previously explained, we identified students whose scores on the fall or spring of kindergarten administration of the Mathematics Test were in the bottom 15% of the weighted test score distribution as having a prior history of MD. (The weighted distribution is nationally representative.) This cutoff is consistent with, but somewhat more conservative than the identification criterion used in past investigations of MD (e.g., Fuchs, Fuchs, & Prentice, 2004; Geary, Hoard, & Hamson, 1999; Hanich, Jordan, Kaplan, & Dick, 2001; Jordan et al., 2003; Passolunghi & Siegel, 2004; Wilson & Swanson, 2001). To test for robustness, we repeated the calculations using cutoffs of 10% and 33%. The results were quite similar to those reported here.
Reading Achievement
Reading achievement may contribute to mathematics achievement (Jordan et al., 2002; Robinson, Menchetti, & Torgesen, 2002). We therefore statistically controlled for children’s end of kindergarten reading achievement. The ECLS-K’s measure of reading achievement, the Reading Test, includes questions about a student’s basic skills (e.g., letter recognition, sight word recognition), vocabulary, and comprehension skills. The Reading Test was created through a multi-stage panel review. All items were field-tested. Items were included in the Test’s final form upon displaying (a) acceptable item-level statistics, (b) good fit with maximum likelihood IRT parameters, and (c) no differential item functioning across gender or race. The Reading Test uses a routing procedure and IRT to derive scale scores that are comparable across different grade levels. The kindergarten theta reliability estimate was .95 (NCES, 2002). First graders’ Reading Test scores correlated .85 or above with the Kaufman Test of Educational Achievement reading test (Pollack, Atkins-Burnett, Rock, & Weiss, 2005).
Learning-Related Behaviors
Learning-related behaviors (e.g., attention, task persistence, organization) may also contribute to mathematics achievement (e.g., Duncan et al., 2007). We therefore used the frequency of learning-related behaviors as an additional statistical control. The ECLS-K uses an adapted version (i.e., the Social Rating Scale [SRS]) of the Social Skills Rating System (SSRS; Gresham & Elliott, 1990) to measure a student’s classroom behavior. Correlational and factor analyses support the SSRS’ construct validity (Feng & Cartledge, 1996; Furlong & Karno, 1995). (For details on NCES’s adaptations to the SSRS, see Meisels, Atkins-Burnett, and Nicholson, 1996.) The ECLS-K’s Teacher SRS includes the Approaches to Learning subscale. Teachers use this subscale to rate their students’ attentiveness, task persistence, eagerness to learn, learning independence, and organization. Split-half reliabilities for the spring of kindergarten Approaches to Learning teacher subscale was .89 (NCES, 2002).
Additional Student- and Family-, Classroom-, and School-Level Variables
We statistically controlled for many additional potential confounds, including gender (e.g., Aunola et al., 2004), SES (e.g., Jordan, Kaplan, Nabors Olah, & Locuniak, 2006), and both classroom and school contexts (e.g., Opdenakker & Van Damme, 2001) to more rigorously estimate associations between variation in first-grade teachers’ instructional practices and their students’ mathematics achievement gains.
Student Level
Parents reported on their child’s race/ethnicity and gender. We adjusted for a student’s age. We also adjusted for the household SES, which was computed as an average of the father’s and mother’s (or, when applicable, the guardian’s) education level and occupation, as well as the household’s income. We included whether or not the student had an Individualized Education Program (IEP) on record at the school or another school in the spring of first grade, as well as whether or not the student was eligible for a free or reduced lunch at school in the spring of first grade. Students who were administered and did not pass the English language proficiency test given in the fall of kindergarten by ECLS-K staff were coded as English Language Learners. To adjust for the amount of instruction each student received prior to being tested, we also controlled the Julian calendar date at which each student was administered the Mathematics Test in the spring of first grade.
Classroom Level
As described above, we included the time allocated for classroom mathematics instruction. We also included the number of years that the teacher reported having taught by the spring of first-grade survey wave. Teachers reported on their highest educational level attained by the spring of first grade. We used this variable to construct dummy variables of whether the teacher had a bachelor’s degree, master’s degree, or a PhD. We estimated the percentage of female and male students in each classroom by dividing the number of boys and girls, respectively, in the class by the number of children in the class and multiplying by 100. We used similar calculations to estimate the percentage of African Americans, Hispanic Americans, Asian Americans, Whites, and children of other races/ethnicities, as well as of children with limited English proficiency.
School Level
Private or public schools were identified, as were school enrollments. We also included the urbanicity of the school and its U.S. region, as well as the average SES. Students with the same school ID in the spring of first grade were grouped together and their average SES was calculated.
Results
Factor Analysis
We conducted a factor analysis on the frequency of the 48 mathematics activities and skills taught. This was a principal components analysis followed by an oblique rotation. Twelve factors had eigenvalues greater than 1.0 and were retained. Forty of the 48 items loaded strongly on one of the factors, presenting clear and meaningful patterns. To optimize the resulting scales, we undertook confirmatory factor analyses in which a single factor was extracted from the items with loadings of .50 or above on each of the factors. (See Kline, 2011, p. 359, for discussion of .5 as a standard for retaining a factor loading.)
Table 1 displays the factor loadings and Cronbach’s alphas from each of these confirmatory factor analyses. Among the 19 instructional activities, 15 loaded on one of the first four factors. (Instructional activities were found to load only with other activities, and skills taught only with other skills taught.) The first factor clearly corresponds to teacher-directed activities. The next three correspond to different dimensions of more student-centered activities. The loading magnitudes remain above .50; the Cronbach’s alpha values are .67, .78, .48, and .66. The remaining eight factors accounted for 25 of the 29 skills taught items. Factor loadings and alphas were in the acceptable to very good range. We named these factors according to the preponderant skill items loading on each.
Factor Loadings for Scales of Frequency of First-Grade Instructional Activities and Skills Taught (N = 13,393 Students)
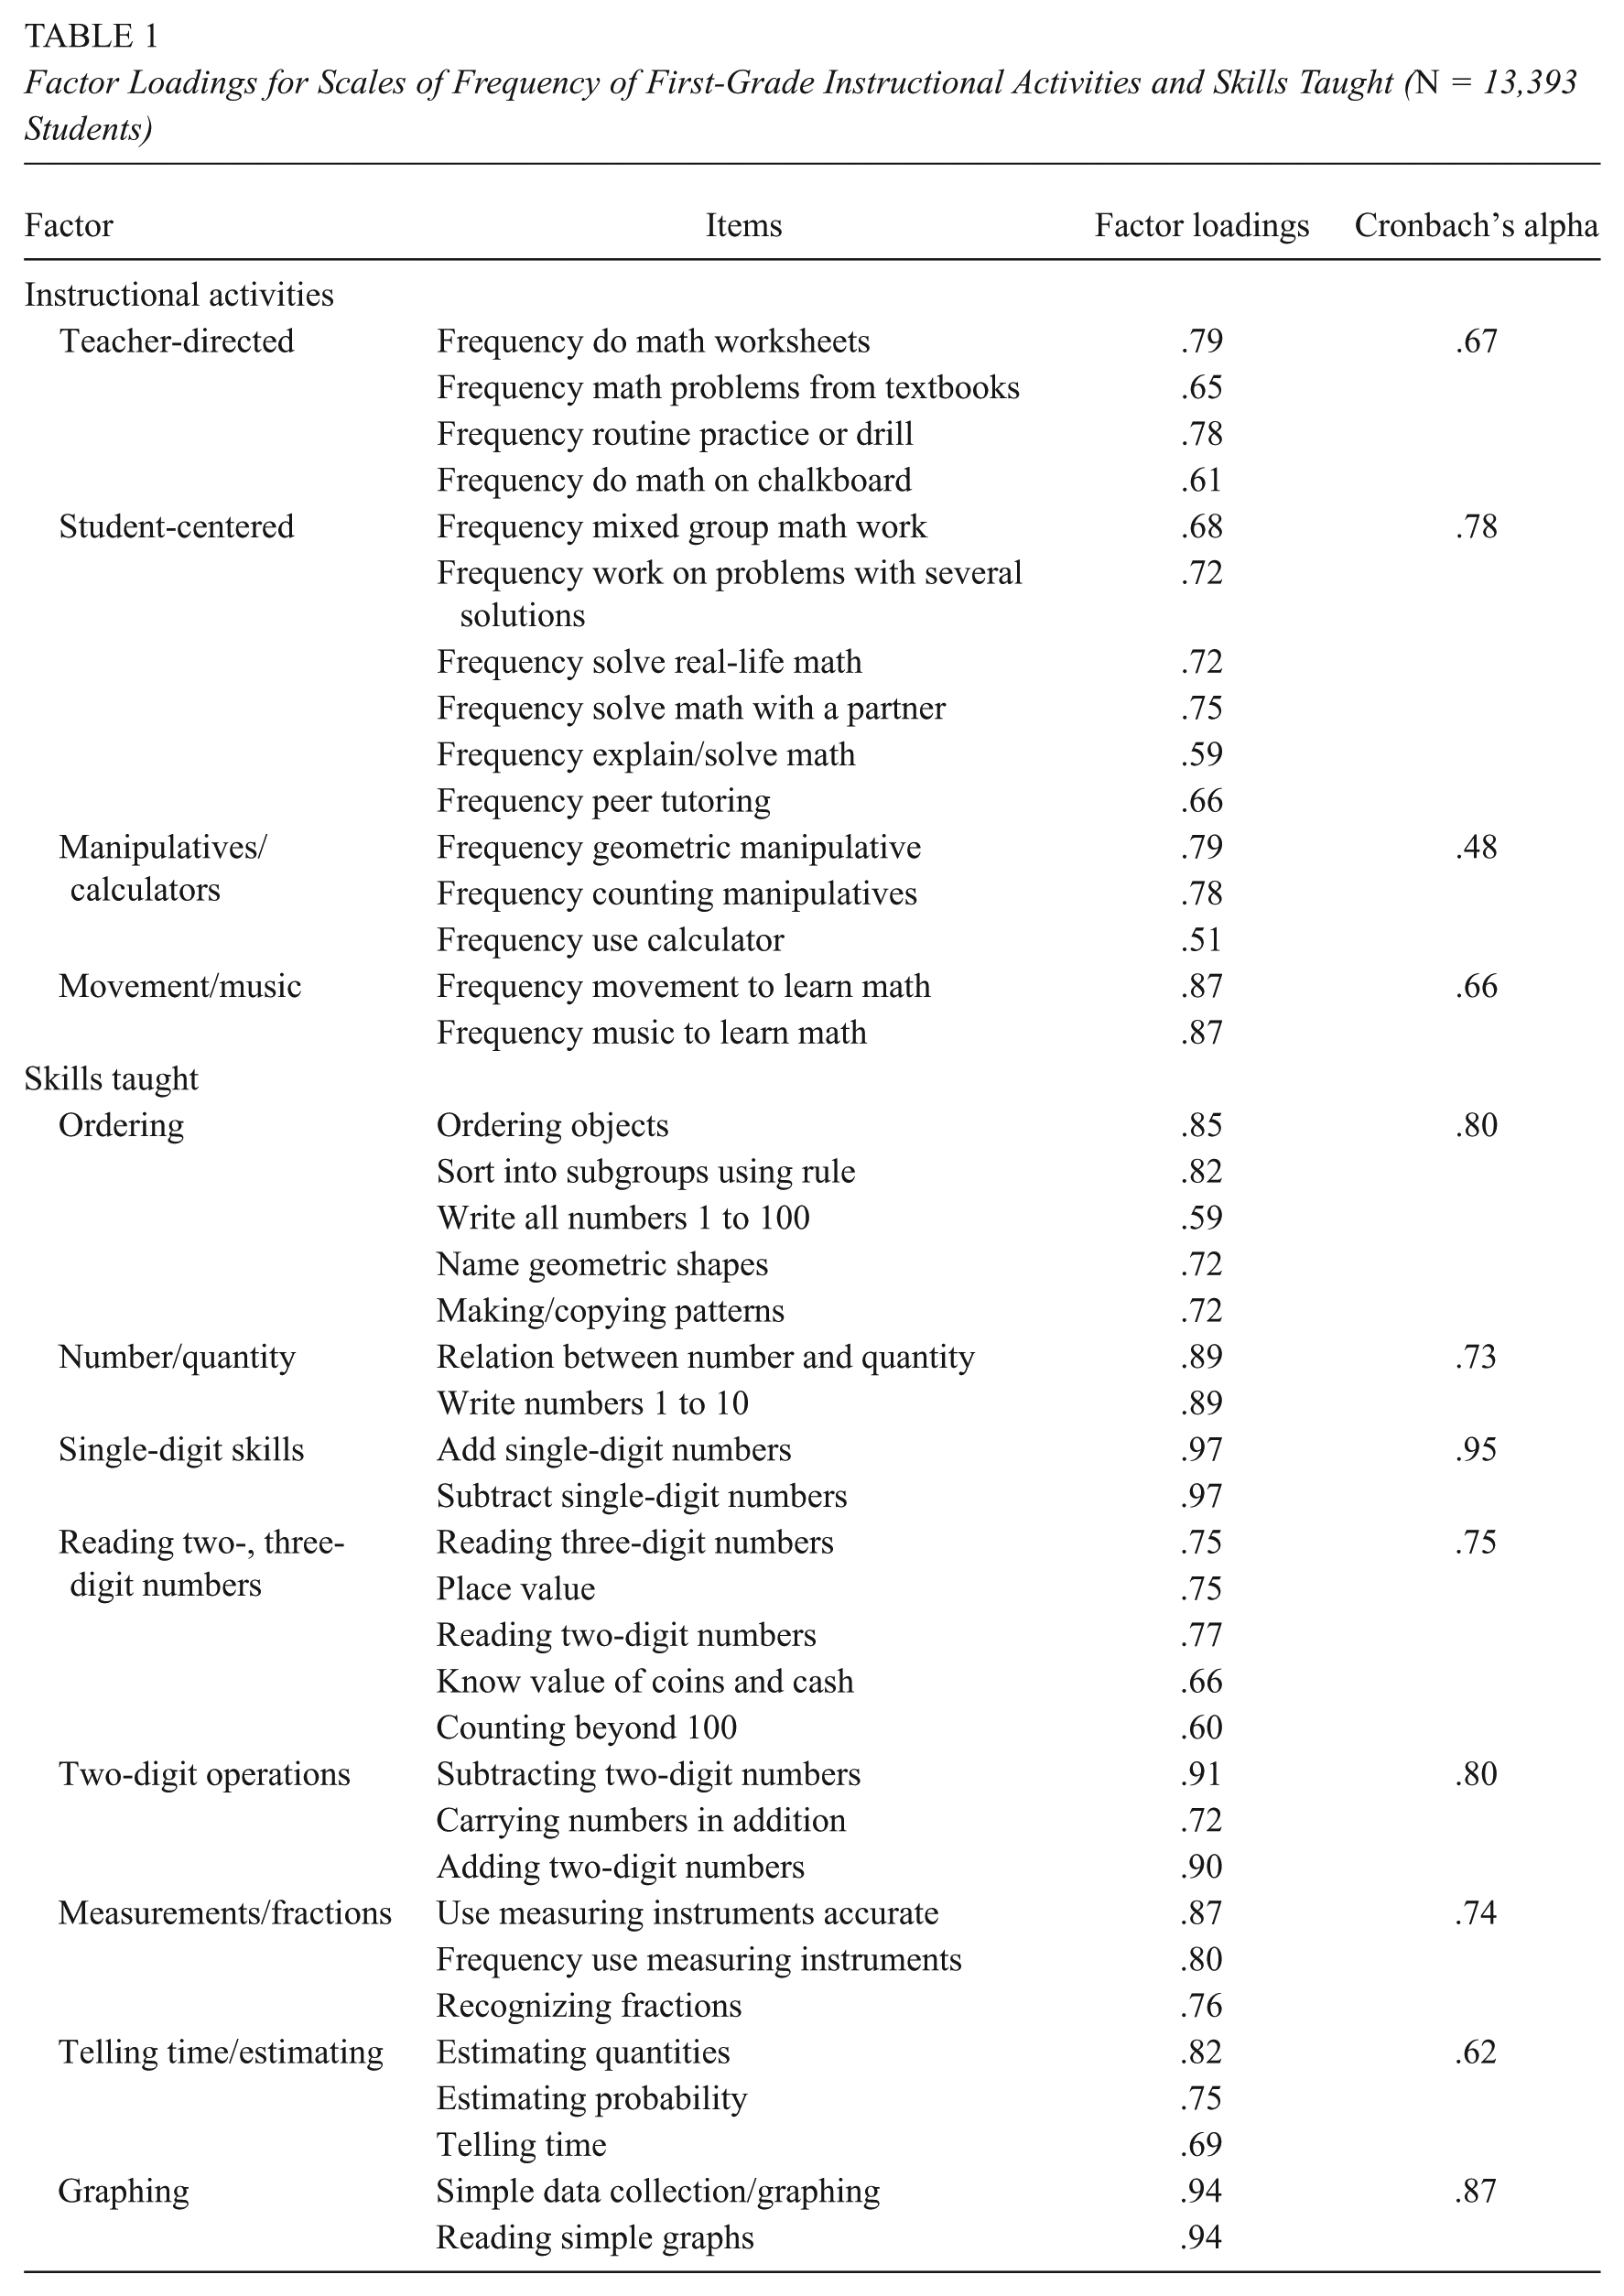
Substantively, the factor based on math worksheets, problems from textbooks, routine practice or drill, and math on chalkboard is consistent with an emphasis on teacher-directed instruction. By contrast, the factor based on mixed groups, problems with several solutions, real-life math, math with a partner, explain/solve math, and peer tutoring contains six activities emphasized in student-centered instruction. Two additional factors emerged. One involved use of either geometric and counting manipulatives or calculators. The other involved using movement and music to learn mathematics. We termed these “manipulatives/calculators” and “movement/music,” respectively.
Eight factors emerged from the skills taught items. We termed the factor comprising ordering objects, sorting into subgroups, writing numbers 1 to 100, naming geometric shapes and making/copying patterns as “ordering.” Other factors were “number/quantity” (relation between number and quantity and writing the numbers 1–10), “single-digit skills” (adding and subtracting single-digit numbers), “reading two- to three-digit numbers” (reading two- to three-digit numbers, place value, counting beyond 100, and knowing value of coins and cash), “two-digit operations” (adding and subtracting two-digit numbers, carrying numbers in addition), “measurement/fractions” (measuring instruments, recognizing fractions), “telling time/estimating” (telling time, estimating quantities and probability), and “graphing” (simple data collection, making and reading graphs).
We examined the correlation matrix (see Table 2) to identify which of the instructional activities and skills taught factors were most strongly and weakly associated with one another. The low correlations (.16, .05, .06) between teacher-directed and each of the three student-centered factors support the conclusion that they constitute distinct instructional approaches. In contrast, the higher correlations (.41, .29, .30) among the student-centered factors suggested that they tend to be used together by teachers. Teacher-directed activities correlated most strongly with single- and two-digit skills. Student-centered activities correlated most strongly with ordering and telling time/estimating. Manipulative/calculator activities correlated most strongly with ordering, number/quantity, measurement/fractions, and telling time/estimating. Movement/music activities correlated most strongly with ordering and measurement/fractions. Overall, ordering was the skill most likely to be taught by teachers emphasizing student-centered instruction.
Correlation Matrix of Frequency of Instructional Activities and Skills Taught Scales (N = 13,393 Students)
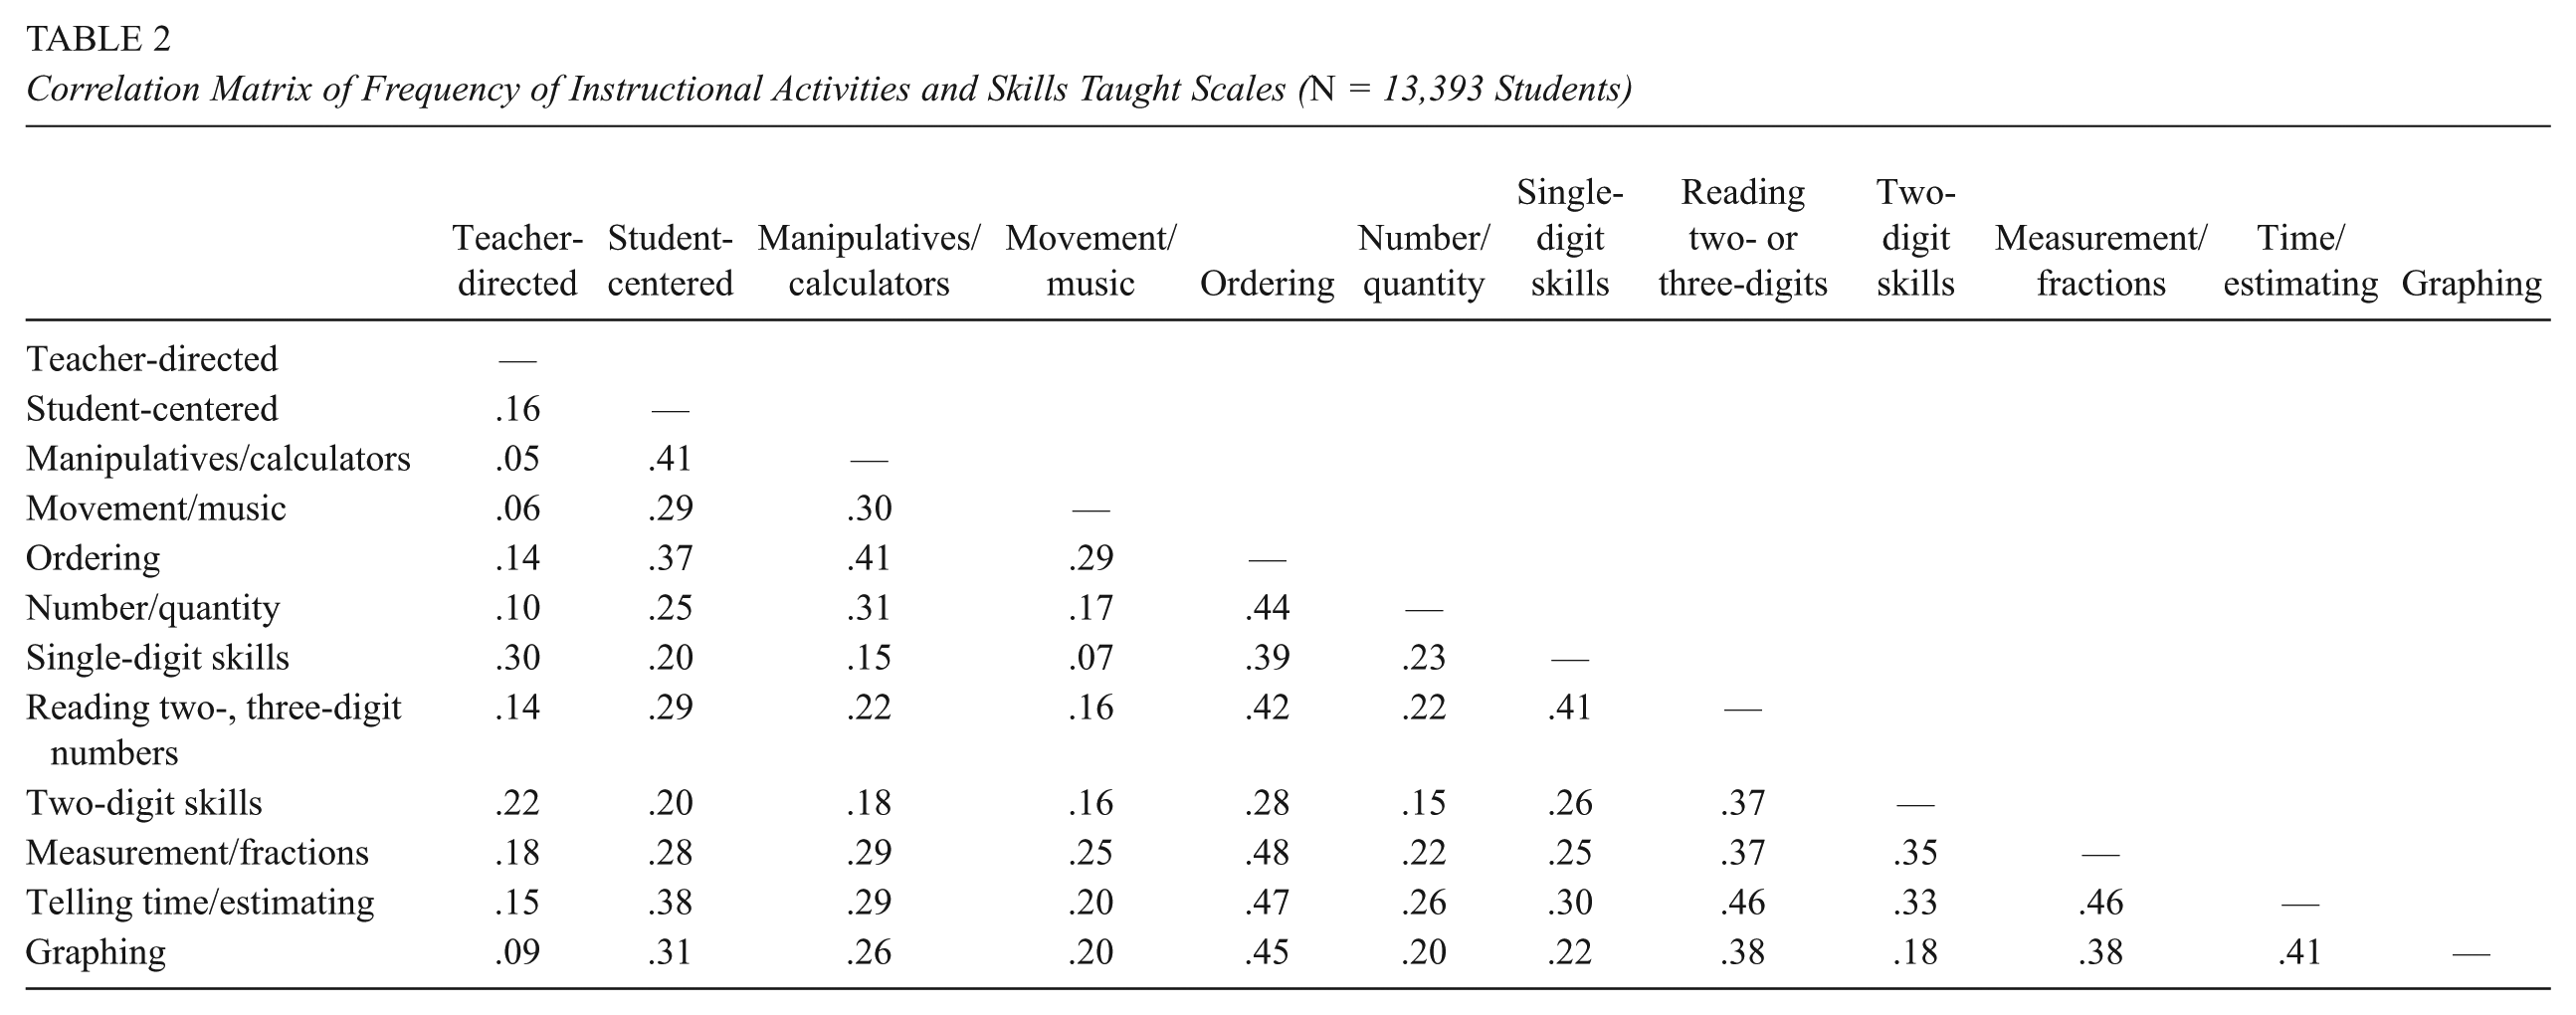
Among the nine most highly correlated pairs of skills (with correlations above .4), five correlated most strongly with ordering. These were number/quantity, reading two- to three-digit numbers, measurement/fractions, telling time/estimating, and graphing. Thus, skills taught in the ordering factor often occurred as part of student-centered instruction, and strongly correlated with five other skills categories. In contrast, teacher-directed instruction correlated most strongly with single- and two-digit operations.
Classroom Percentage MD, Instructional Activities, and Skills Taught
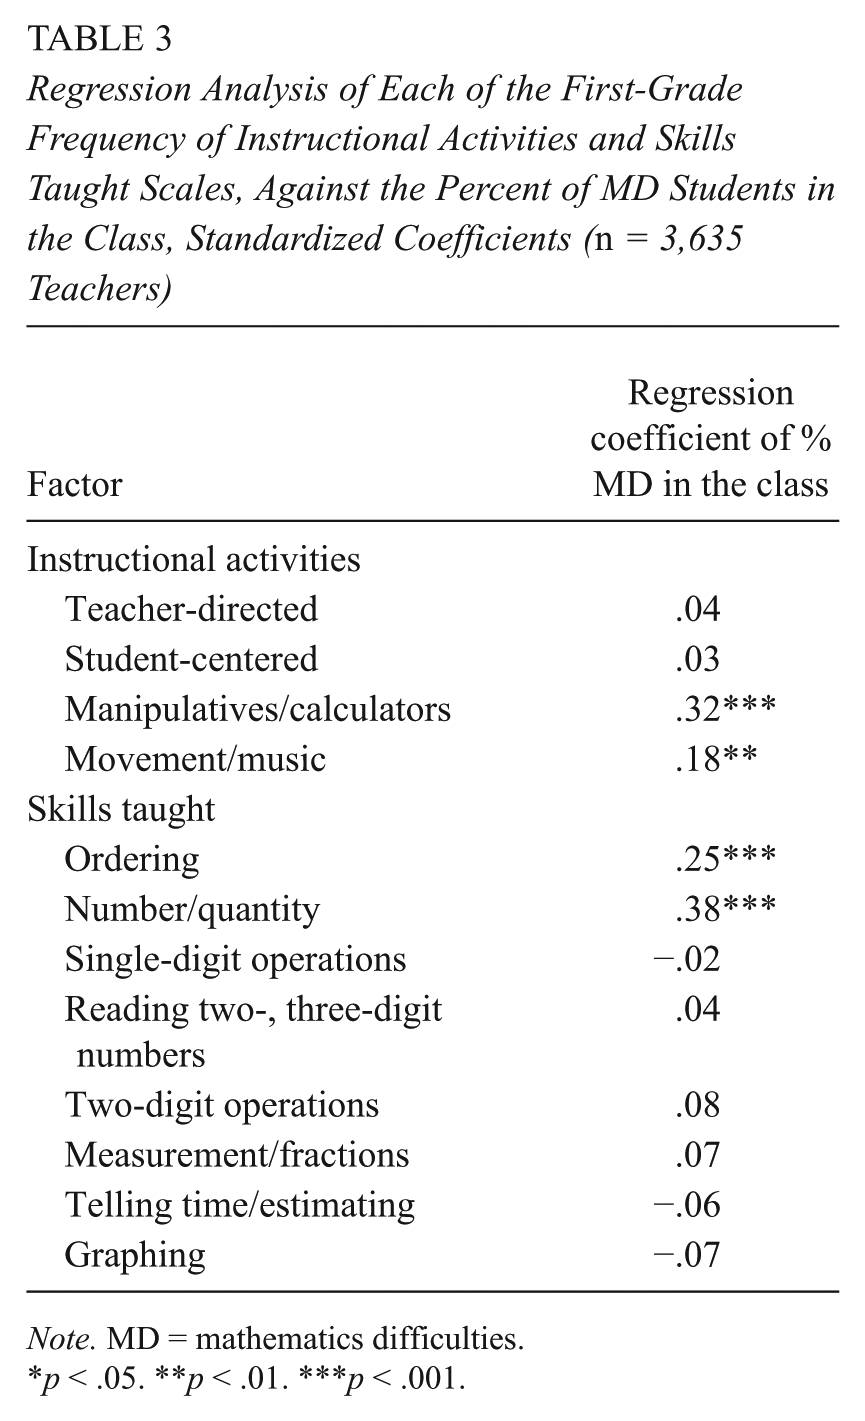
Using the 3,635 teachers in the sample as the unit of analysis, we then regressed the frequency of each of the 12 instructional factors against the percentage of MD students in the class. Table 3 displays these results. We found no significant relation between the percentage of MD students in the classroom and the frequency of teacher-directed or student-centered instructional activities. However, we did find that the percentage of students with MD in the class was positively and significantly associated with manipulatives/calculators and movement/music activities, as well as teaching the ordering and number/quantity sets of skills. Thus, classes of students with higher percentages of MD students were more likely to be taught these skills and with instructional practices emphasizing using manipulatives/calculators and movement/music. As reported below, these instructional activities and skills were not associated with mathematics achievement gains by students with MD.
Regression Analysis of Each of the First-Grade Frequency of Instructional Activities and Skills Taught Scales, Against the Percent of MD Students in the Class, Standardized Coefficients (n = 3,635 Teachers)
Note. MD = mathematics difficulties.
p < .05. **p < .01. ***p < .001.
Instructional Activities, Skills Taught, and Achievement
Table 4 displays results from the regressions estimating the effectiveness of the different instructional activities and skills taught, separately for each of the three groups of MD and the two groups of non-MD students. Students with MD in both fall and spring of kindergarten (i.e., persistent MD) had the lowest average spring kindergarten Mathematics Test score of 17.8. Next were students with MD in the spring but not the fall. Their average score was 19.9. This second group of students with transitory MD was at risk because their achievement was in the lowest 15% in the spring of kindergarten, despite entering kindergarten with relatively higher achievement and having received a year of school-based instruction. Next are those who scored in the MD range when they entered kindergarten in the fall, but who displayed higher achievement in the spring after receiving instruction. These transitory MD students averaged 26.7, considerably above the previous groups. Following this were the non-MD students who scored in the mid-range of spring of kindergarten scores. These students averaged 28.7 in the spring of kindergarten. Finally, students in the highest half of non-MD students had kindergarten scores averaging 44.2, well above the other groups. The groups also displayed ascending levels of performance in spring of first-grade mathematics achievement, spring of kindergarten reading achievement, and learning-related behavioral functioning. This same ordering was reported by Morgan et al. (2009).
Descriptive Statistics

Note. The values are weighted M (SD) or percentages. IRT = item response theory; IEP = Individualized Education Program; SES = socioeconomic status; LEP = Limited English Proficiency.
Because each group of similarly performing students is typically dispersed across a great many classrooms, we did not expect great variation in the average instruction received by these groups. This is what we observed. Each of the performance groupings received about 270 minutes of mathematics instruction per week, or 54 minutes per day. During approximately 20 school days per month, the groups averaged approximately 11.8 instances of teacher-directed activities, and about 9.2 instances of student-centered activities. Manipulative/calculator activities were much less frequent, averaging 6 to 7 instances per month, and movement/music activities were infrequent, averaging only 1.4 to 2.0 instances per month. Consistent with the results of Table 3, the latter two types of activities were somewhat more frequent for the lowest performing groups of students.
As for the specific skills taught to these first graders, single-digit skills were the most frequent, being taught approximately 14.6 times per month. Next most frequent was reading two- and three-digit numbers, about 10.2 to 10.8 times per month. This was followed by number/quantity at about 7.7 to 10.3 times per month, graphing at about 6.8 times per month, telling time/estimating at 6.3 to 6.8 times per month, and ordering at 5.3 to 6.6 times per month. Finally, two-digit operations and measurement/fraction are typically taught less than 5 times per month. Consistent with Table 3’s results, ordering and number/quantity were taught more frequently to lower performing students.
We then conducted multilevel regression analyses of spring of first-grade mathematics achievement, separately for each of the five MD and non-MD groups of students. Here, we used the frequency with which instructional activities and skills were taught, plus a very large set of covariates, as predictors. The results are shown in Table 5. (The covariates are listed at the bottom of this table.) We observed a consistent pattern in the estimated effects of teacher-directed and student-centered activities across the five groups of MD and non-MD students. Teacher-directed instructional activities displayed positive and significant predicted effects for the two lowest and two highest performing groups. The largest adjusted ESs (.05 and .07) occur for the two lowest MD groups. Smaller but positive and significant effects were found for the two non-MD groups (adjusted ES = .03). By contrast, student-centered activities had positive and significant coefficients only for the two non-MD groups (adjusted ES range = .03–.04). Thus, teacher-directed activities not only were associated with greater mathematics achievement by students with MD but also were associated with greater achievement by students without MD. By contrast, student-centered activities were only associated with greater achievement by non-MD students. Pooling the groups of students, we ran regressions with and without interaction terms to calculate an F test for the significance of the differential effects of teacher-directed and student-centered activities between the persistent MD and the other groups. The p value for this F test was .08, offering modest support to the existence of differential effects across groups. Among the t tests for the significance of the individual interaction terms, the only significant ones were for the differential effect of teacher-directed activities between the persistent MD and two non-MD groups. This post hoc analysis supports the inference that the largest gains occurred when teacher-directed activities were used with low-performing MD students. We also conducted additional analyses (not shown) to evaluate which of the specific teacher-directed activities were associated with achievement gains by these students. Results suggested that routine practice and drill produced the largest effects. As for the manipulatives/calculator and movement/music activities, the only statistically significant coefficient was negative (adjusted ES = −.03) for use of manipulatives/calculators for the highest performing students. We found no evidence that these particular activities were associated with achievement gains by any of the groups of first-grade students.
Three-Level HLM (Student, Teacher, School) Analysis of First-Grade Mathematics Achievement (Standardized, Covariate-Adjusted Coefficients)

Note. The values in parenthesis are SE. Some findings carried out to nearest non-zero decimal point to report effect size. Reported estimates covariate-adjusted for the following variables: mathematics instruction, minutes/week, mathematics instruction, minutes/week squared, spring kindergarten Mathematics Test IRT-scale score, spring kindergarten Reading Test IRT-scale score, spring kindergarten Approaches to Learning, child is male, child is African American, child is Hispanic American, child is Asian American, child is Other race/ethnicity, child age at spring first grade, child is English Language Learner, child receives free school lunch, child has Individualized Education Program, kindergarten SES quintiles, Julian date of first-grade assessment, years of teacher experience, teacher’s educational level, percent girls in class, percentages of African Americans, Hispanic Americans, Asian Americans, and Other races/ethnicities in class, percent Limited English Proficiency in class, private/public school, rural/urban/suburban location, U.S. regions, school enrollment, school average SES. HLM = hierarchical linear model; IRT = item response theory; SES = socioeconomic status.
p < .05. **p < .01. ***p < .001.
For the frequency with which the eight groups of skills are taught, the associations were much less clear. There was little pattern to these 40 coefficients, only 3 were statistically significant, with 2 of these being positive and the other being negative. If all the coefficients were 0 in the population, this result could easily have occurred by chance. Thus, there was little evidence of a relation between these variables and children’s mathematics achievement.
In sum, teacher-directed activities were associated with greater achievement by both MD and non-MD students, and student-centered activities were associated with greater achievement only by non-MD students. Activities emphasizing manipulatives/calculators or movement/music to learn mathematics had no observed positive association with mathematics achievement. These results do not support the usefulness of the instructional assignment pattern observed, in which classrooms with higher percentages of MD students were more likely to be taught by teachers emphasizing use of manipulatives/calculator and movement/music instructional activities, and ordering and number/quantity skills.
Discussion
We investigated the use of mathematics instructional practices by first-grade teachers in the United States. Overall, we found no evidence of a relation between the percent of MD students in a first-grade teacher’s class and the frequency with which teacher-directed activities were used or skills taught. However, we did observe that first-grade teachers in classrooms with higher percentages of students with MD were more likely to use practices not associated with greater mathematics achievement by these students. Controlling for many potential confounds, we also found that only more frequent use of teacher-directed instructional practices was consistently and significantly associated with residualized (value added) gains in the mathematics achievement of first-grade students with prior histories of MD. For students without MD, more frequent use of either teacher-directed or student-centered instructional practices was associated with achievement gains. In contrast, more frequent use of manipulatives/calculator or movement/music activities was not associated with significant gains for any of the groups. For the wide range of eight sets of skills taught, we found little consistent relation between the frequency with which particular skills were taught and the mathematics achievement of first-grade students.
Limitations
This study is limited by its reliance on first-grade teacher self-reports of the frequency of their instructional practices and skills taught measured in the ECLS-K. We were unable to measure the relative quality with which these practices were implemented. Stronger achievement gains may have been observed if teachers had used specifically structured and integrated mathematics curricula or supplemental programs (e.g., Saxon Math, Peer Assisted Learning Strategies; see http://ies.ed.gov/ncee/wwc/). A teacher’s use of the practices may have changed over the school year. Teachers may have interpreted the same rating scale item (e.g., “explain/solve math”) differently, or adapted or modified a practice so as to make it less consistent with this study’s operationalization. Some practices may have been more likely to be emphasized in particular types of classrooms (e.g., those located in urban settings) as a result of district-level adoption of standardized curricula (e.g., Everyday Mathematics). The ECLS-K measures of instructional practice may not fully capture what is generally considered to constitute teacher-directed or student-centered instruction. For example, quick pacing and frequent corrective feedback are considered optimal features of teacher-directed instruction (e.g., Stein et al., 2004), whereas problem solving, reasoning, and other cognitive processes are strongly emphasized in student-centered approaches (National Council of Teachers of Mathematics, 2000). Yet these aspects either are not measured in the ECLS-K surveys or are only measured using superficial frequency ratings. Teacher frequency ratings of instructional practices and skills taught may be less sensitive than direct observation or teacher logs, which may bias our estimates of the effect of a teacher’s instructional practice downward, and so be more conservative (Matsumura, Garnier, Slater, & Boston, 2008; Rowan & Correnti, 2009). However, self-report ratings are known to provide fairly accurate estimates of a teacher’s relative frequency of use of particular instructional practices, and to co-vary with direct observation (e.g., Mayer, 1999; Ross, McDougall, Hogaboam-Gray, & LeSage, 2003; Stipek & Byler, 2004). Our grouping of sets of specific practices together as teacher-directed or student-centered also should have resulted in higher reliability than using the specific practice items individually (Carmines & Zeller, 1979). As with any non-experimental survey data, analyses of the ECLS-K data do not allow for strong causal inferences.
Study’s Contributions and Implications
Despite these limitations, the study’s estimates should be considered fairly robust. We examined the relations between the frequency of various instructional practices, as well as skills taught, and first-grade students’ mathematics achievement using (a) a relatively large, longitudinal, and nationally representative sample of schoolchildren; (b) multiple measures with strong psychometric properties; (c) extensive covariate adjustment, including both the strong confound of prior mathematics achievement and many additional factors previously established as relating to early mathematics achievement (e.g., prior reading achievement, frequency of learning-related behaviors); and (d) a variety of cut points to define MD. We tested for differential effects of the frequency with which a diverse range of practices and skills were taught.
These rigorously-derived estimates help confirm and extend those reported in prior work. Previous investigations in both reading (Foorman et al., 2006; Xue & Meisels, 2004) and mathematics (Desimone & Long, 2010; Guarino et al., 2013; Le et al., 2006; Palardy & Rumberger, 2008) have also observed associations between a classroom teacher’s instructional practices and children’s academic achievement. For example, Xue and Meisels’ ES estimates for whole language- and phonics-type instruction were .08 and .06, respectively, about the same magnitudes we found for the effects of teacher-directed instruction on the two lowest performing groups of students. Our results are consistent with findings from these and other studies indicating that the types of instructional practices used by teachers relate to children’s academic achievement, even after prior achievement and other potential confounds have been statistically controlled. The magnitude of our study’s reported instructional practices ESs are small, but consistent with magnitude of reading or mathematics instructional ESs reported in other published, high-quality studies (e.g., Foorman et al., 2006; Guarino et al. 2013; Palardy & Rumberger, 2008; Sonnenschein et al., 2010; Xue & Meisels, 2004). Unlike many other factors (e.g., the family’s SES, the student’s gender), instructional practices constitute modifiable factors under the direct control of schools.
Our results also yield some unanticipated findings. The increasing reliance on non-teacher-directed instruction by first-grade teachers when their classes include higher percentages of students with MD is surprising, both given prior research on the instructional needs of these students (e.g., Kroesbergen et al., 2004; NMAP, 2008), as well as our findings that this type of instruction is not associated with increased achievement for students with MD. Instead, first-grade teachers in the United States may more successfully assist MD students to learn mathematics by using teacher-directed instructional practices. Some types of instructional practices are commonly considered “evidence-based,” and so presumably their use by teachers should result in increased mathematics achievement. For example, Baker, Gersten, and Lee’s (2002) synthesis of researcher-directed intervention studies yielded a weighted ES of .66 for the use of structured peer tutoring on low-skilled children’s mathematics achievement. Additional syntheses also support peer tutoring as an evidence-based practice (Elbaum, Vaughn, Tejero, & Watson, 2000; Mathes & Fuchs, 1994). Yet our estimate of student-centered instruction, which includes peer tutoring, was statistically non-significant when used with students with prior histories of MD (Guarino et al. [2013] also reported a statistically non-significant finding for peer tutoring). One possible explanation for these inconsistent findings is that teachers modify and use practices in ways that vary substantially from their experimentally designed and evaluated versions (e.g., Antil, Jenkins, Wayne, & Vadasy, 1998). Our study’s results indicate that the need for additional investigation of how teachers adopt and make use of instructional practices—even those that could reasonably be characterized as evidence-based—and how their use of such practices can be modified and structured so that classroom instruction contribute as strongly as possible to young children’s mathematics achievement.
Our study also contributes to the extant work by indicating that, for a large, nationally representative sample of first graders in the United States, variation in classroom instructional practice is associated with positive change in their mathematics achievement. Prior theoretical and empirical work suggests that young students with MD might benefit more from more explicit, teacher-directed approaches (Kroesbergen et al., 2004; NMAP, 2008), whereas those without MD might benefit more from more student-centered approaches (Baxter et al., 2001; Kroesbergen & Van Luit, 2003). Our results support this view. An important contribution of our work is that we find that teacher-directed instructional practices are associated with achievement by both students with a prior history of persistent MD, as well as those with a prior history of transitory MD. In contrast, other, more student-centered activities (i.e., manipulatives/calculators, movement/music) were not associated with achievement gains by students with MD. Yet kindergarten students with persistent or transitory MD are likely to struggle with mathematics throughout the remainder of elementary school, and so should be receiving instruction that is as effective as possible (e.g., Morgan et al., 2009).
Our study extends the current knowledge base, and helps guide future experimental work by indicating how instructional practices, as naturally implemented by teachers, might be better differentiated to maximize achievement gains by first-grade students. Teacher-directed instructional practices might be expected to result in greater achievement by students with and without prior histories of MD. In contrast, only those student-centered practices involving work on problems with several solutions, peer tutoring, and activities involving real-life mathematics might be expected to result in greater achievement, and only for first-grade students without a prior history of MD. First-grade teachers should reconsider their more frequent use of manipulative/calculator and movement/music activities in classrooms with greater percentages of students with MD, as these activities are not associated with significant mathematics gains either by these or by non-MD groups of students.
Footnotes
Declaration of Conflicting Interests
The author(s) declared no potential conflicts of interest with respect to the research, authorship, and/or publication of this article.
Funding
The author(s) disclosed receipt of the following financial support for the research, authorship, and/or publication of this article: Funding support was provided by Grant R324A120331, National Center for Special Education Research, Institute of Education Sciences, U.S. Department of Education and by infrastructure Grant R24HD041025-11, National Institute of Child and Human Health and Development, National Institutes of Health.
Notes
Authors
PAUL L. MORGAN, PhD, is an associate professor of education, Department of Educational Psychology, Counseling, and Special Education, the Pennsylvania State University. His work examines risk factors for learning and behavioral disabilities.
GEORGE FARKAS, PhD, is a professor in the School of Education at the University of California, Irvine. His research focuses on educational inequality and how it can be reduced.
STEVE MACZUGA, MS, is a programmer analyst at the Population Research Institute at the Pennsylvania State University.