



Abstract
This study examines the community-wide effects of investments in two early childhood initiatives in North Carolina (Smart Start and More at Four) on the likelihood of a student being placed into special education. We take advantage of variation across North Carolina counties and years in the timing of the introduction and funding levels of the two programs to identify their effects on third-grade outcomes. We find that both programs significantly reduce the likelihood of special education placement in the third grade, resulting in considerable cost savings to the state. The effects of the two programs differ across categories of disability, but do not vary significantly across subgroups of children identified by race, ethnicity, and maternal education levels.
This study examines how investments in two early childhood initiatives in North Carolina—one that provides child, family, and health services for 0- to 5-year-olds and the other that funds preschool slots for 4-year-olds—affect the probability that children are placed into special education by the end of third grade. The secular rise in special education placements over time and the high costs of these programs make this focus both timely and important. Furthermore, a recent public funding model for prekindergarten in Utah is predicated on the expectation that investment in high-quality preschool will lower special education cost outcomes (Dubno, 2011). We ask the following question: Is there evidence that by making available high-quality preschool and other early childhood programs, special education placements are reduced when children are enrolled in third grade?
North Carolina has been a national leader in developing initiatives designed to address childhood disadvantages. The Smart Start Initiative (SS) began in the early 1990s with the goal of improving the delivery and quality of child care and preschool services for children between the ages of 0 and 5. Complementary to SS, the More at Four (MAF) preschool program was introduced in 2001 to provide access to high-quality preschool for disadvantaged 4-year-olds. In a prior study, we reported positive effects of each program on third-grade standardized test scores in reading and math that were robust across numerous model specifications and subgroups of children (Ladd, Muschkin, & Dodge, 2014). Based on the research literature and these findings, we hypothesized that these benefits would extend to special education placements.
As in our prior study, our empirical strategy is to take advantage of the variation across North Carolina counties and years in the timing of the introduction and funding levels of the two programs to identify their effects on third-grade outcomes. As we describe below, we combine information at the individual level from birth records over a 13-year period with third-grade outcome data at the child level and programmatic funding data at the county level. Our treatment variable is the per-child funding level for each of the programs for each year, and the “treated” children are all those of the appropriate age who were living in the county during the specified year, not just those who participated in funded services. Thus, we measure average county-wide effects of each program, rather than effects on individual participants. In this way, we incorporate both direct and spillover effects of the two programs. In addition to examining how the early childhood programs affect overall placement rates, we also examine effects on placement in specific exceptionality categories. It is plausible, even likely, that these programs would affect some types of placements (e.g., behavior disorder, learning disability) to a greater degree than others (e.g., physical handicaps). We also explore heterogeneity in these effects, by evaluating whether the impact on special education placements varies across groups of children based on ethnicity, race, and maternal education level.
Background and Prior Research
The research literature clearly documents adverse outcomes typically associated with special education placements in third grade. Placement in special education in third grade is associated with a widening deficit in reading ability and academic performance (Aron & Loprest, 2012; Hibel, Farkas, & Morgan, 2010), and with a high risk for failing to achieve later successful life-course outcomes, including high school completion, post-secondary education, employment, earnings, and freedom from involvement with the criminal justice system (Aron & Loprest, 2012; Hibel et al., 2010).
From the perspective of public education, the financial benefits of reducing special education placements are substantial. Researchers estimate that the average annual per-pupil cost of special education is approximately double that of regular education (Harr, Parrish, & Chambers, 2008; Verstegen, 2011).
The benefits of avoiding special education placements are tempered by a consensus that ethical and humane treatment includes accommodations for children with enduring disabilities, even if they cost a great deal. Indeed, the law requires schools to serve those children with identifiable disabilities (Aron & Loprest, 2012). Developmental science indicates, however, that some disabilities that become chronic are a function of an interaction between a child’s endowment and early environmental experiences (Caspi & Moffitt, 2006), suggesting that systematic intervention to alter early experiences could prevent later disability. We thus proceed with a heuristic model that optimal education policy attends to three different groups of young children who are at risk for disability. One group of children is born with chronic disabilities that require lifelong attention, such as physical handicaps and genetic abnormalities. Although long-term special education placement for these children is costly, these placements are both humane and cost-effective. A second group includes young children who are at risk for a later chronic disability that could be alleviated by early identification and educational treatment during preschool or Grades K to 2, followed by a transition out of special education before Grade 3. Studies that examine outcomes for students who are placed early and then successfully transition out of special education find that these children continue to increase their gains in academic and intellectual functioning across later development (Daley & Carlson, 2009; Innocenti, 2005). A third group of young children is also at risk for a special education diagnosis, but with high-quality early environments, child care, and educational experiences, the need for special education placement could be prevented altogether.
The outcome measure in our study is special education placement at the end of third grade, thus capturing program effects on reducing the second and third groups without distinguishing between them. Measurement in third grade is appropriate because transitions out of special education decline after age 9. Jenkins et al. (2006) estimate that 41% of students identified with a disability in prekindergarten transition out of special education by Grade 3; only 26% of students with a disability in Grade 3 are de-classified by age 19. This trend, together with the higher proportions of grade retention among students with disabilities, inflates the cumulative costs of special education for students who continue to need services after the third grade (Bartik, 2011; Dong, 2010; Reschly & Christenson, 2006; Silverstein, Guppy, Young, & Augustyn, 2009).
How Early Childhood Programs Might Alter Later Chronic Disability
Significant cognitive and behavioral disadvantages emerge before children enter kindergarten. These disadvantages often cascade into chronic disabilities as children progress through school (Dodge et al., 2009). As skill begets skill, so does disability beget disability. Cunha, Heckman, and Schennach (2010) describe a multistage production function for children’s cognitive skills. They find that the elasticity of substitution between investments in one period and stocks of skills in that period decreases in later stages of the life cycle in the production of cognitive skills. Their finding implies that it is optimal to invest relatively more in the early stages of childhood than in later stages. Early childhood intervention provides the best opportunity to reduce early cognitive and social disabilities (Barnett, 2011; Burkam & Lee, 2002; Heckman & Masterov, 2007). Recent evidence suggests that early intervention has effects on children at high risk for special needs that are equivalent to or larger than the effects on typically developing children (Phillips & Meloy, 2012).
Potential developmental effects of early education and child care experiences on later chronic disabilities may vary in important ways across types of disability. Early intervention and high-quality experiences might help children at risk for mild disabilities avoid special education diagnosis and placement altogether (Aron & Loprest, 2012). Children who attend school-based preschool programs are more likely to receive support for the transition to kindergarten, and effective transition strategies significantly improve the school success of high-risk children (Carlson et al., 2009; Phillips & Meloy, 2012; Schulting, Malone, & Dodge, 2005).
Teachers in high-quality child care programs are trained to identify children performing below normative expectations, thereby increasing the likelihood of effective remediation at an early age (Mann, McCartney, & Park, 2007). High-quality early childhood programs can prevent unnecessary disability diagnoses and special education costs among minority children and children from low-income families. Children who experience family disadvantage may develop poor social and cognitive skills in school that sometimes are misdiagnosed as learning disabilities or emotional-behavioral disabilities (Hibel et al., 2010). High-quality early childhood education can compensate for this early disadvantage and thus avoid the need for special education services in elementary school.
Children identified as having speech and language impairments and specific learning disabilities, which constitute about half of all exceptionality categories in North Carolina (see Figures 1 and 2), are the most likely to “graduate” from special education back into regular education during early elementary grades if their disability is identified early (Daley & Carlson, 2009; Innocenti, 2005). Finally, children with chronic physical handicaps and severe disabilities would not be expected to leave special education once identified; thus, early intervention would not affect their course of special education placement.

Percentage of children with disabilities: Ages 3 through 5 (2009–2010 school year, North Carolina).
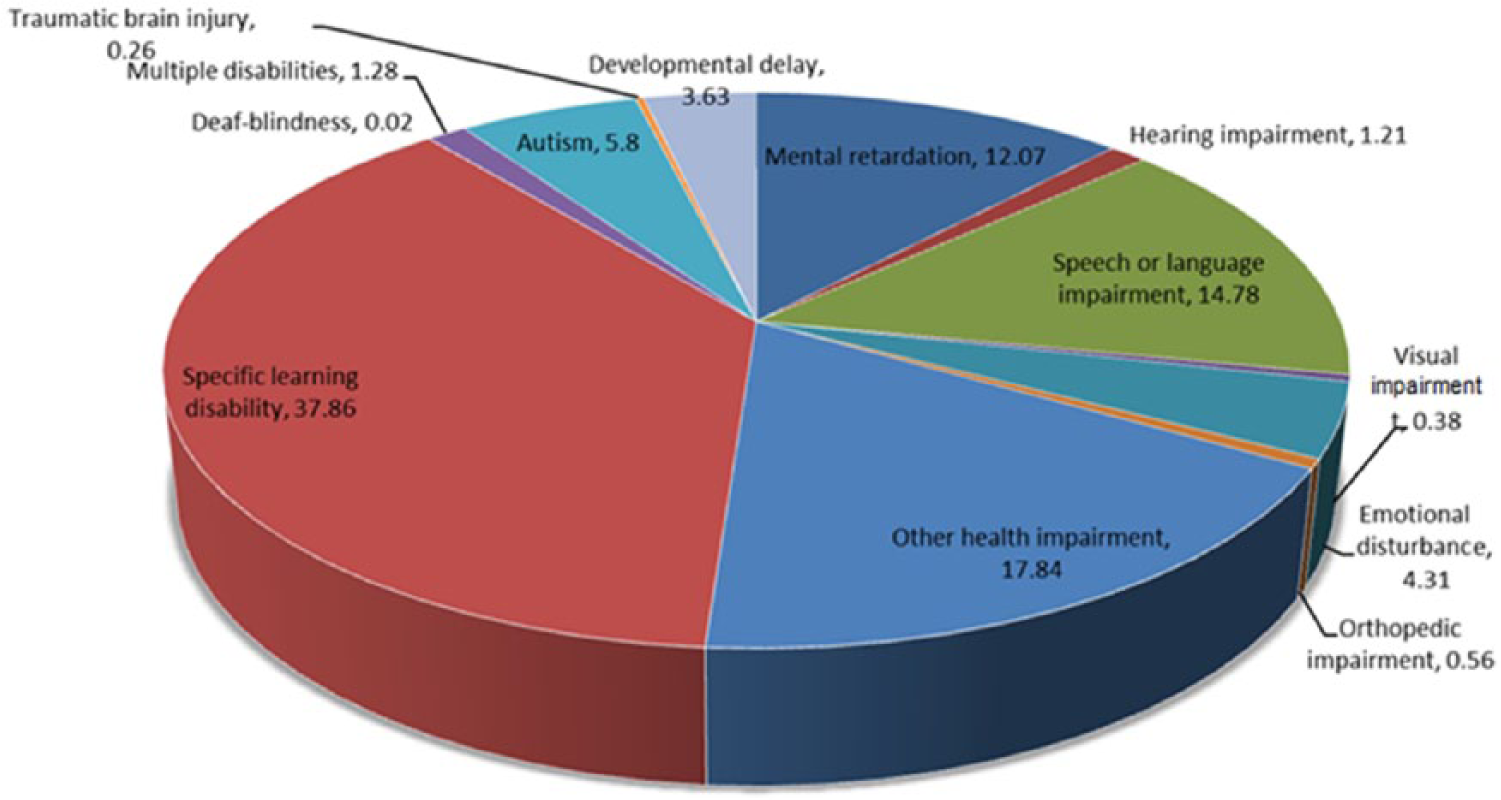
Percentage of children with disabilities: Ages 6 through 21 (2009–2010 school year, North Carolina).
One of the goals of this study is to investigate variations in effects of program investments on student placement in different types of exceptionality categories. We hypothesize that the two programs would prevent special education placements for “preventable” conditions, specifically, behavioral-emotional handicaps, educable and mental handicaps, specific learning disabilities, and autism (classified in North Carolina as part of “other” conditions), but they would have no impact on “non-preventable” conditions, specifically, speech–language impairments and physical disabilities (blindness, deafness, etc.). We are agnostic about differential effects of the two programs on the preventable conditions.
The Impact of Early Childhood Interventions on Special Educational Disabilities
The research community has devoted considerable effort to evaluating the returns to investments in preschool education. We review a limited set of evaluation studies, focusing on those that have examined effects on special education placement and the persistence of effects over time.
Studies of the effectiveness of the Abecedarian and High Scope/Perry Preschool programs find that both programs reduced special education placements through age 15 (Abecedarian: Campbell & Ramey, 1995) and through high school (Perry Preschool: Schweinhart et al., 2005). Although these findings are important, they might not generalize to implementation at the population level. These model programs were designed to deliver intensive and high-quality services to participant children under conditions of close supervision, and they were evaluated with only small samples in randomized controlled trials. These conditions provide strong internal validity, but they limit usefulness for predicting the effectiveness of state-level programs that are delivered with less intensity at scale.
Recent studies of state-level programs find that participants experience gains in cognitive measures over the short term (Gormley, Gayer, Phillips, & Dawson, 2005; Huang, Invernizzi, & Drake, 2012; Wong, Cook, Barnett, & Jung, 2008), and a few studies find significant improvements in reducing special education placements for participating children (Daley & Carlson, 2009; Phillips & Meloy, 2012). Although these results are promising, they provide no evidence on the persistence of program benefits beyond 2 years.
Conyers, Ou, and Reynolds (2003) examine the impact of the Chicago Child–Parent Centers (CPC), a high-quality public school early childhood program, by comparing participants with a matched, non-treated comparison group. They found that children who participated in CPC had significantly lower special education placement rates than non-participants from first through eighth grades. Arteaga, Reynolds, and Temple (2010) found similar long-term benefits of CPC participation on overall special education placement, as well as placement for specific learning disabilities.
These statewide longitudinal studies, though important, share the problematic feature that their findings may be subject to selection bias, as children are not randomly assigned to the early childhood program that is being evaluated. Even the most rigorous quasi-experimental design is vulnerable to selection bias that arises when families of participating children vary on unobservable characteristics related to the likelihood that a child will be placed in special education. This selection problem is further exacerbated in the context of special education placements, as appropriate identification of special needs at early ages is likely to vary with unobserved characteristics such as a teacher’s perceptiveness and parents’ willingness to access special services for the child.
All of the studies reviewed here measure program impact only on children who were assigned to an early childhood program. Thus, they ignore the possibility of spillover effects, given that program and control children reside in the same communities and attend the same schools. Positive spillovers would occur if high-quality early childhood programs improve the elementary school classroom environment for all children. For example, positive spillover results when all children in a classroom, as well as their teacher, benefit from having fewer classmates in need of academic or behavior remediation. The result is that the teacher can attend more to the task of high-quality academic instruction for all children, thereby preventing special education placements for the entire population. In such a case, typical evaluations underestimate program effects. Negative spillovers would arise if an education system functions at equilibrium with a fixed number of special education slots for the population, independent of actual need, perhaps due to prior employment of special education teachers in need of students to teach, or external funding predicated on identification of a fixed number of students. In this case, prevention of special education placement among a subgroup that has received early intervention would be offset by an increase in placement rates among the group that had not been targeted for intervention (either the control group or a non-matched remainder group). Under these circumstances, evaluations based only on program participants would overestimate program impact, especially if the program is later implemented at scale.
The possibility of either positive or negative spillover is a specific type of a broader limitation of past studies, one inherent in study designs that identify control students from the same schools as intervention students, that is, the non-independence of participants and the resulting misspecification of standard errors. In the current design, standard errors are clustered within districts to account for non-independence. Our research design thus avoids some of the threats to external validity of many large-scale evaluations, as well as to their policy relevance; like public health, education policy is concerned with population-level impact.
The Current Research Question and Policy Context
Our study addresses the following question: What are the community-wide effects of state-supported early education initiatives on special education placements in third grade? In particular, we examine the effects on special education placements for all age-appropriate children, not only those who participated directly in state-supported centers and classrooms. Although the unit of analysis in our study is the individual student, we focus on average effects across all children in a community. This community-wide approach provides a more comprehensive platform for policymakers to view the benefits of investing in early education programs, both for the children who are directly affected, and for the classrooms, schools, and districts in which they learn.
Children born during the period covered by this study (every qualifying birth in North Carolina between 1988 and 2000) have had access to special education services that have evolved through the passage and expansion of the federal Individuals With Disabilities Education Act (IDEA). From its inception in 1975, IDEA required the public education system to meet the needs of children with disabilities through free and appropriate public education in the least restrictive environment. This phrase denotes the emphasis of this legislation on providing, whenever possible, instruction for special needs students within regular classrooms. The impact on public education has been enormous, with the growth of the special needs population over the past 20 years increasing far more rapidly than public school enrollments as a whole. The secular trend in special education placements for students ages 3 to 21 is represented in Figure 3, showing a steady increase in the proportion of children served under IDEA to a peak of 13.8% of the eligible population in 2004, declining only slightly to 13.1% in 2010. North Carolina’s enrollments followed a similar pattern, peaking at 14.4% in 2005 and declining to 12.5% in 2010.
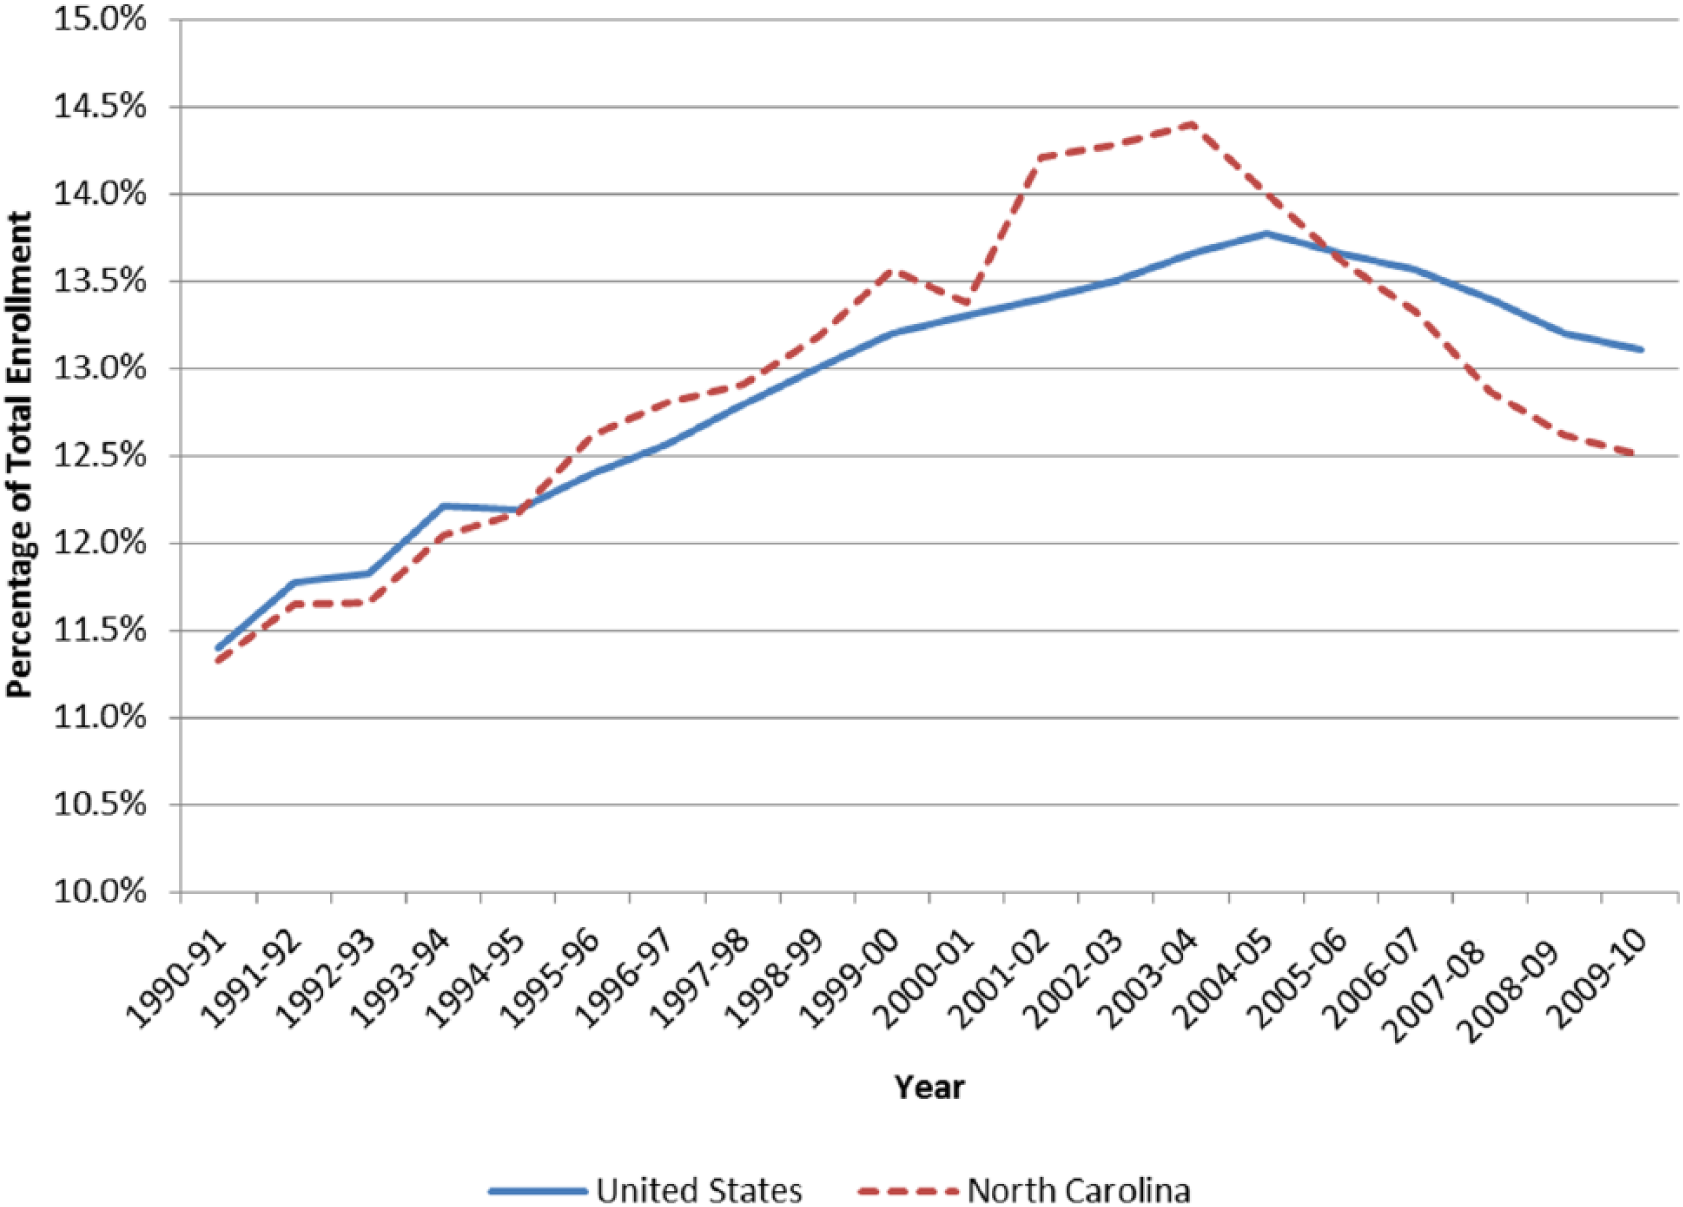
Number of individuals served under IDEA as percentage of total enrollment: Ages 3 to 21.
The evolution of IDEA and the funding structures for meeting children’s special needs have important implications for the timing of educational intervention and the types of services they receive. Signaling a shift in emphasis toward preventive interventions, a 1986 amendment to IDEA required that children with disabilities become eligible for services from their school district at age 3. This change was to be implemented in all states, as it was in North Carolina, by the 1991–1992 school year. As a result, over the following two decades, the proportion of children ages 3 to 5 receiving special education services increased by 67%. Figure 4 provides trend information for children ages 3 to 5 served under IDEA Part B, indicating steady increases for both the United States and North Carolina, with peaks and declines similar to those of the larger age group depicted in Figure 3. Another important change in policy established IDEA Part C, a federal grant program focusing on the needs of children ages 0 to 2. In 2003, services for infants and toddlers under IDEA covered approximately 2.6% of the age 0 to 2 population in the United States and 1.8% in North Carolina. By 2010, these rates increased by 0.2% nationally and by 0.8% in North Carolina. Eligibility criteria have varied over time in North Carolina, with a tightening of criteria after services for infants and toddlers were consolidated under the state Department of Health and Human Services in 2005.
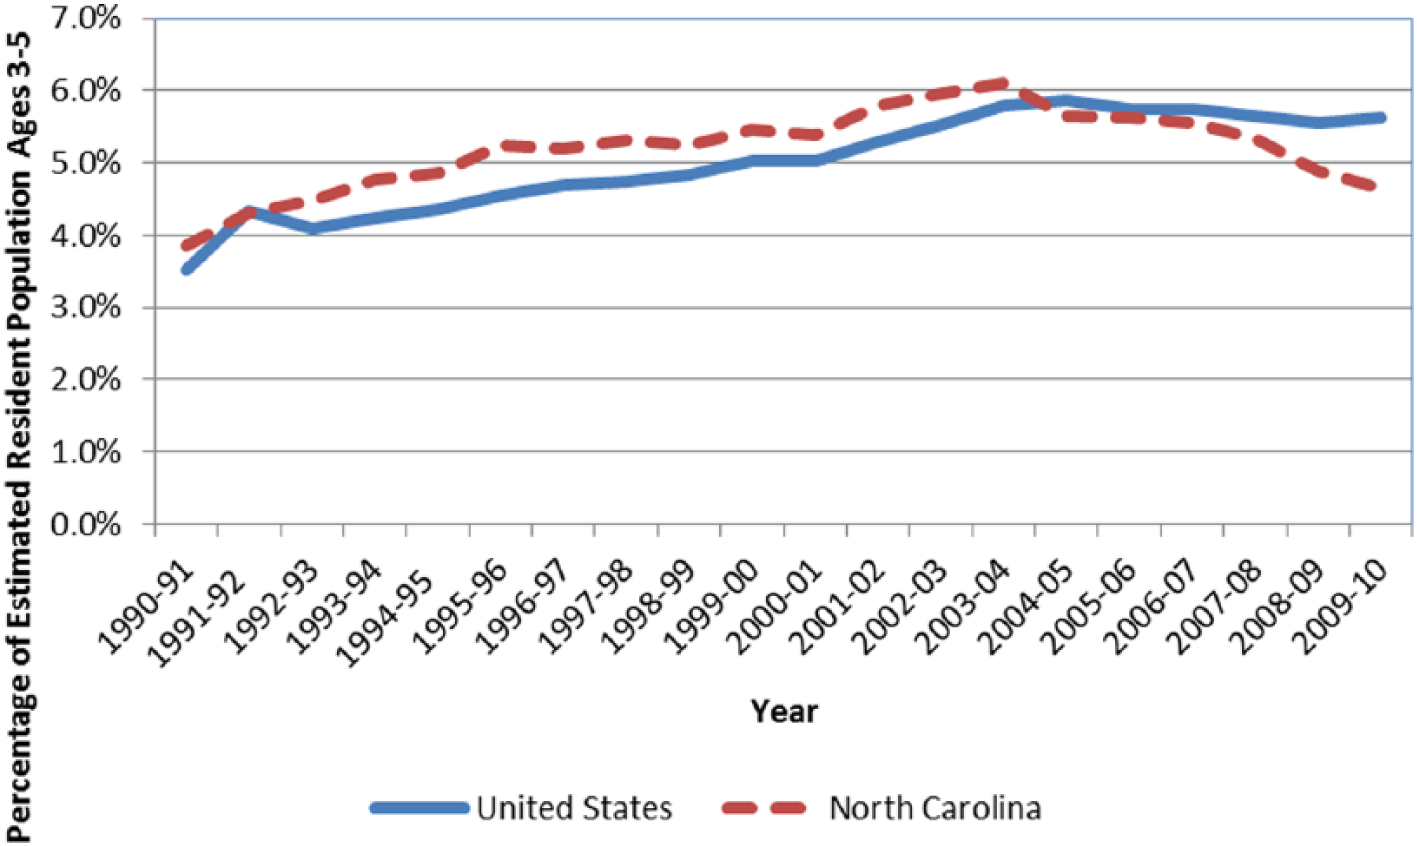
Number of individuals served under IDEA as percentage of estimated resident population: Ages 3 to 5.
The most recent amendments to the IDEA were intended to boost the development of comprehensive publicly supported services for early intervention. However, as is the case for the broader range of special education programs provided by school districts, only a portion of the costs are covered by federal programs, with the remainder funded by state and local programs (U.S. Department of Education, 2012). As a result, eligibility criteria and funding levels vary considerably by state, and may vary over time as states experience increasing fiscal difficulties. Variation in the levels and distribution of funding sources for exceptional children in North Carolina public schools is presented in Figure 5 for all ages. Over time, the largest component of funding comes from federal programs, including IDEA and Head Start, but the state has the fastest growing funding component for school-based special education. North Carolina’s two statewide early education initiatives serve as important vehicles for meeting the federally mandated (but not fully funded) screening and intervention services for children with special needs.
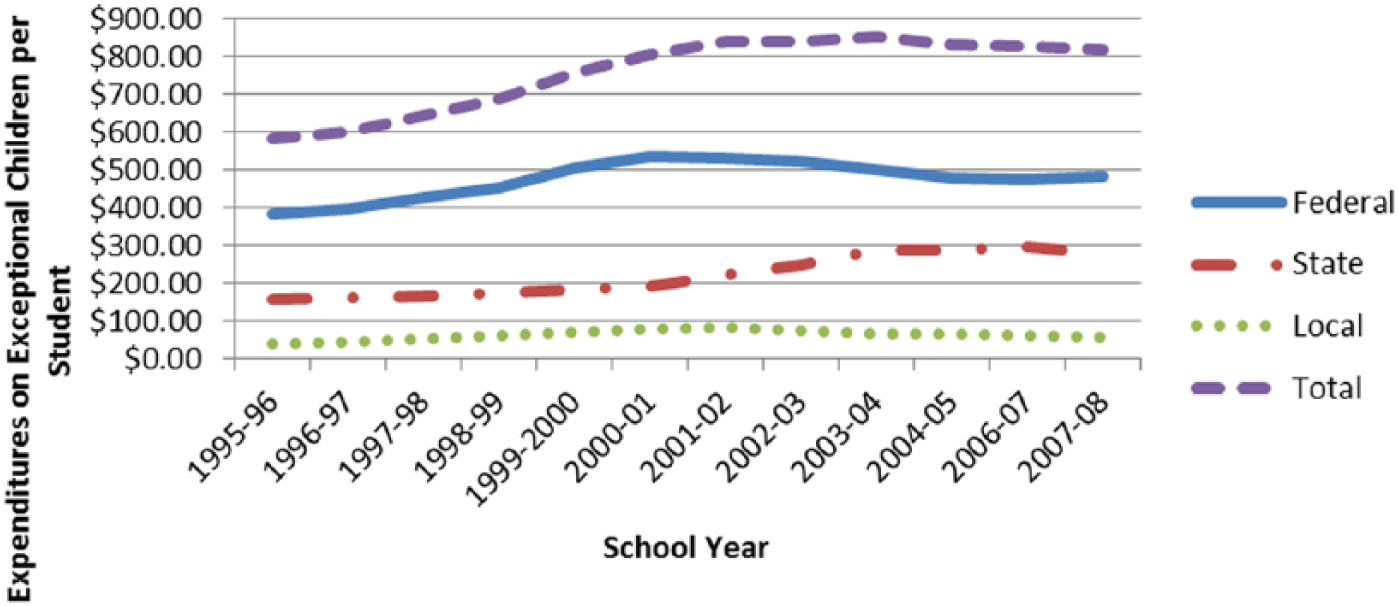
North Carolina expenditures on exceptional children, by source of funding.
Early Childhood Initiatives in North Carolina
The SS and MAF program provide funding to local entities for delivery of early childhood services designed to ensure that children enter school healthy and ready to learn. Each of these initiatives is an important vehicle for screening, referral, and service provision for children at risk for disabilities. Both SS and MAF began as demonstration projects in a small number of counties and were later expanded to serve all counties. Together, they are recognized as national models for early childhood initiatives to address academic achievement gaps. SS finances services for all children from birth to age 5, and MAF serves disadvantaged 4-year-olds.
SS
The SS was the outcome of 1993 legislation that established the North Carolina Partnership for Children, a nonprofit corporation charged with developing a comprehensive, long-range, strategic plan for early childhood development. The partnership provides funds to local nonprofit organizations representing individual counties or, in a few cases, groups of counties. The local communities can use the funding for a variety of services benefiting young children, such as day care vouchers, health and family support services, child care services, professional development, and promoting collaborations among local agencies providing IDEA Part C–funded developmental screenings. One of the goals of SS is to increase the proportion of high-quality child care centers, where early intervention to prevent developmental delays is most likely to occur.
Organizations have substantial discretion over how they use SS funds, provided they use the funds to promote the development of children between the ages of 0 and 5. From its inception, SS established inclusion of children with special needs as a high priority (Ponder, 2011). The mechanisms for serving children at risk for disabilities include funding of specific services and supports, fostering collaboration between special needs agencies and the broader early childhood community, and modifying child care subsidy policies to provide incentives for programs to enroll children with special needs. A summary of SS’s efforts to provide services and supports for young children with special needs noted the following accomplishments as of 2009 (Ponder, 2011):
The number of infants and toddlers with special needs who were provided early intervention services annually increased from 4,719 in 2004 to 17,608 in 2009.
The average age at referral to early intervention decreased from 22 months in 2001 to 16 months in 2008.
The number of preschool children with special needs served annually increased from 11,708 in 2002 to 14,392 in 2009. The percentage of child care programs reporting at least one child with documented special needs who has been referred to services or who is being evaluated for special needs increased from 36% in 2003 to 45% in 2006.
The number of preschool special education students participating in child care programs increased by 27% during this time period.
In addition, an intervention launched by SS, Assuring Better Child Health and Development, raised the proportion of children in this age group receiving recommended developmental screenings from 81% to 98% in participating counties (K. McCombs-Thornton, personal interview, June 14, 2012).
The state specifies no limits on the income levels of the families that may receive benefits, but it does require that at least 30% be spent on child care services for specific children. The flexibility and breadth of the SS means that the treatment cannot, and should not, be viewed as a narrowly defined program or package of specific program elements that has an impact only on its direct participants, but instead as a system-level effort to improve the quality of early child care for a community.
The SS was started in 1993 in 12 pilot partnerships that represent 18 different counties, then increased to more than 50 counties by 1997 and to all 100 by the 1998–1999 school year. During that period, SS funding rose to a peak in 2000 of US$250 million (in 2009 U.S. dollars) and has since fallen. Across counties, average funding per 0- to 5-year-olds peaked in 2000 at about US$400 per child and fell to about US$220 per child in 2009 (the last year of current evaluation). A child living in a county with SS funding for all 5 of his or her early childhood years would have access to SS funding equal to about 5 times these per-child amounts. Both the penetration and funding levels varied considerably between counties over the study period (Ladd et al., 2014).
MAF Prekindergarten Program
In North Carolina, MAF (now North Carolina Pre-K), the state-funded preschool program for at-risk 4-year-olds, provides an important mechanism for identifying students with special needs and providing access to services. The MAF program was initiated in 2001 with the goal of addressing the lack of school readiness among low-income children in the year prior to kindergarten matriculation. MAF targeted “at-risk” 4-year-olds who were eligible if the family had annual income at or below 75% of the state median income, or if the child was limited English proficient, disabled, chronically ill, or had a developmental need. In addition, MAF served a critical role in ensuring screening for all special needs and providing access to needed services through referrals to other agencies, or through intervention services provided within the MAF classroom or through other providers within the school district.
Funding for MAF was provided as classroom-based slots for eligible children, not for specific preschool programs. Across the study period, the program provided on average about US$4,200 per slot for 1 year, which had to be supplemented with other funding sources, such as Title I, or IDEA Part B for special education interventions provided within the classroom. Over the period of our study, approximately half of the MAF slots were in public school settings, a third in for-profit community child care centers, and the remainder in nonprofit child care centers and Head Start programs. Each local entity designated acceptable sites for state-funded slots in classrooms that had to meet state-delineated quality standards for staff qualifications, class size, teacher–child ratios, and state child care licensing requirements.
Importantly, because many children not funded by MAF dollars were enrolled in the same centers as those who were funded, they also benefited from the spillover of high-quality standards required for MAF funding. Program evaluators found that these classroom quality standards were consistently maintained throughout the process of scaling up MAF over this period, enrolling approximately 25% of all 4-year-olds in 2010 (North Carolina Office of State Budget and Management, 2013; Peisner-Feinberg & the MAF Evaluation Team, 2008). MAF has contributed to statewide improvements in Pre-K quality: According to National Institute for Early Education Research (NIEER) national evaluations of preschool programs, quality standards in North Carolina increased from a score of 7 in 2003 to 10 (the highest possible score) in 2010 (Barnett et al., 2010). In recognition of these and other potential spillovers, we use the same approach as for SS and define the “treatment” as the availability and level of MAF funding (per age-appropriate child) in the county. All counties in North Carolina provided funding for MAF by 2004. Throughout the study period, there was significant variation in the distribution of funding and availability of classroom slots across counties (Ladd et al., 2014).
When first established and in recognition of its educational goal, MAF was managed by the Office of Early Learning within the North Carolina Department of Public Instruction. In 2011, the Legislature changed the name of MAF to the North Carolina Pre-K Program and moved it to the North Carolina Department of Health and Human Services.
Analytical Approach and Methodology
We focus on investments in two early education initiatives with statewide implementation in North Carolina, SS and MAF, and evaluate their effects on the special education placements of children enrolled in third grade in public school between 1995 and 2010. Our approach is to estimate effects in models that examine special education outcomes in third grade as a function of state financial allocations to the county in which children were born and attended school, in the year(s) when the child was age-eligible for that funding. We describe the approach in more detail below.
Data
Information about students and the schools that they attend in the third grade is drawn from administrative data files provided by the North Carolina Department of Public Instruction and made available to us through Duke University’s North Carolina Education Research Data Center. To identify the county in which a child was born and eligible to receive early education services through SS and MAF, we link the education data to individual birth records for all children born in the state between 1988 and 2000 and enrolled in third grade between 1995 and 2010. We use for this analysis only the children whose records we were able to link across domains—that is, students who were born in North Carolina and were enrolled in third grade in a public school in a North Carolina county. This matched sample comprises 68% of children born in North Carolina during this period. The match rate is lower for children of Hispanic mothers, around 56%, which may reflect higher levels of mobility among this population, or may be due to problems in the matching process due to errors in recording of names. Based on the American Community Survey, we estimate that across all children born in North Carolina, 74% attend public schools in the state at ages 8 or 9; thus, our match rate of 68% accounts for more than 90% of the births in the state during the study period (Ladd et al., 2014). 1 We use birth record data to identify the individual-level control variables that we include in our models: gender, child’s race and ethnicity, birth weight, marital status of the mother, education level of the mother, whether the father is identified, and race, ethnicity, and immigrant status of the mother.
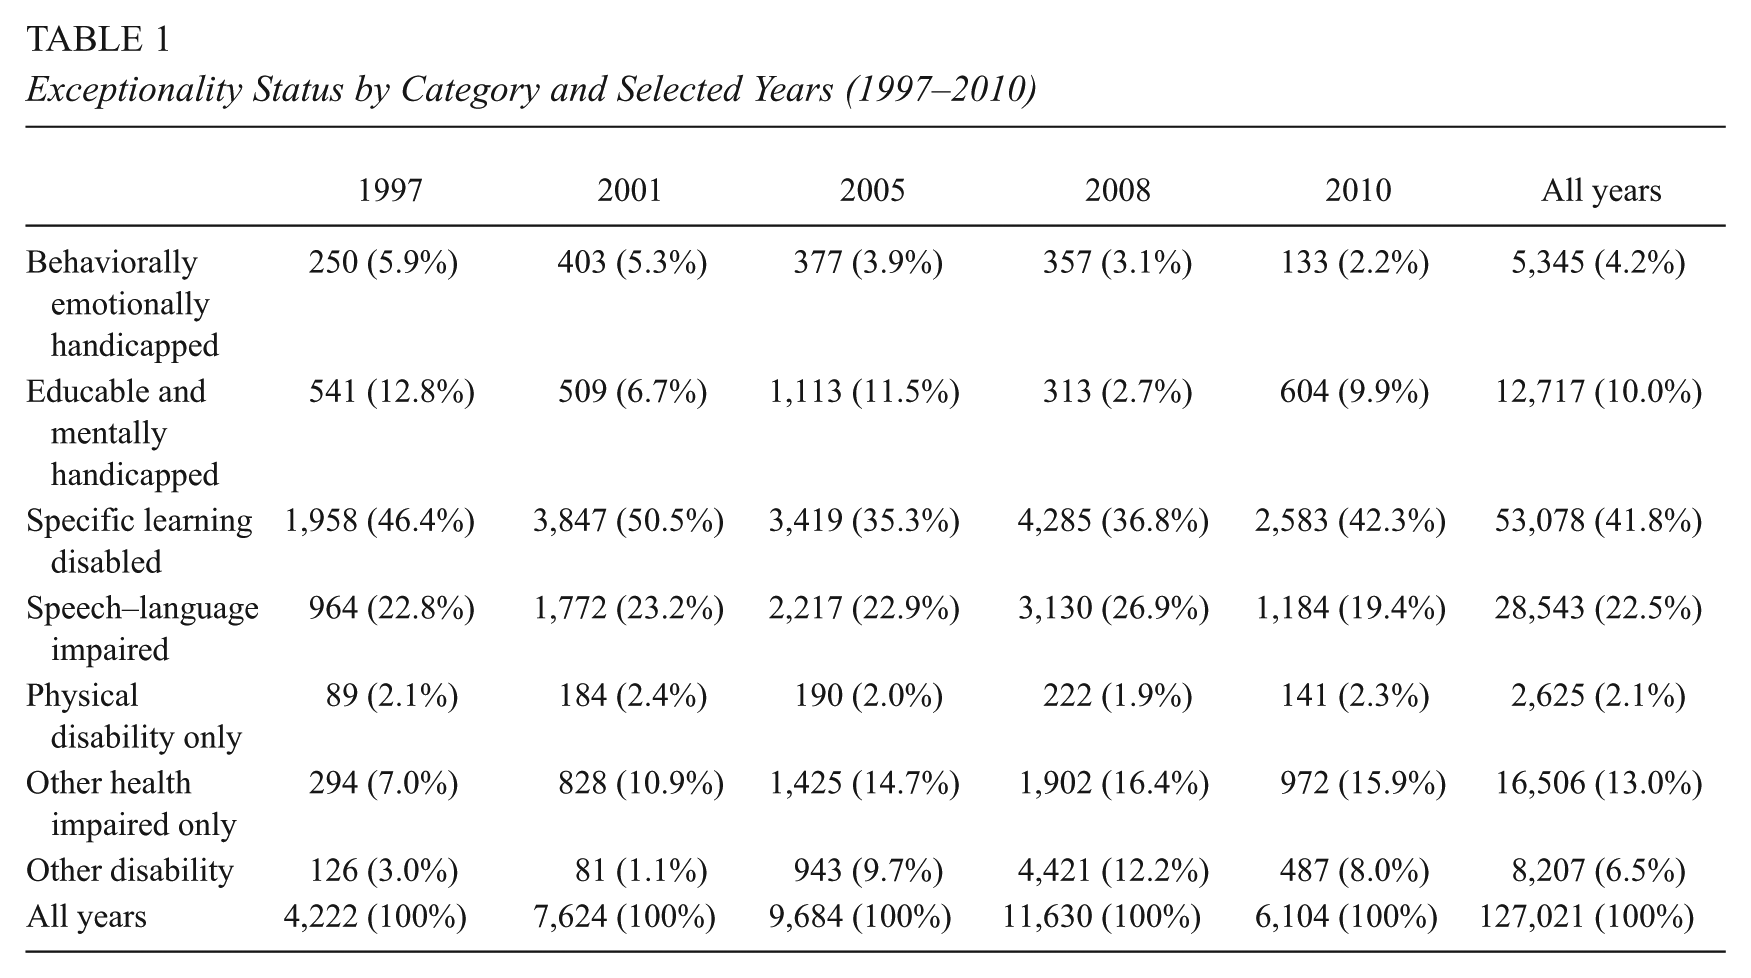
The outcome variables in our models are drawn from the educational administrative data files, and are based on the exceptionality information contained in the end-of-year data files submitted by the Accountability and Exceptional Children divisions of the North Carolina Department of Public Instruction. The reported classes and definitions of disability, or exceptionality categories, have changed over time. For this reason, we have grouped special education students into a smaller number of categories that reflect similarities in service needs. This type of alternate grouping has been used in other longitudinal research on special education students and is recommended as a practical means of facilitating discussion of program outcomes and policies (Aron & Loprest, 2012). Definitions for these exceptionality categories are presented in the table of Appendix 1 (see the online appendix, available at http://epa.sagepub.com/supplemental). Table 1 provides, for selected years, the distribution of third-grade EC students in our sample across exceptionality categories. Specific learning disabilities and speech–language impairments remained the two largest disability categories across the entire study period; however, specific learning disabilities declined from 46% to 42% of all exceptional students—perhaps a reflection of successful interventions for this disability at ages earlier than third grade. Proportional changes in speech–language impairments and other health impairments reflect changing definitions and diagnoses of these categories, such as the inclusion of attention disorders in the latter. The distribution of students across the remaining exceptionality categories was fairly stable over the study period.
Exceptionality Status by Category and Selected Years (1997–2010)
We created a third data set with administrative records of funding levels by county by year, for SS and MAF. All funding levels are calibrated to 2009 U.S. dollars. Information on school characteristics and district expenditures, used for sensitivity analyses, is drawn from the National Center for Education Statistics (NCES) Common Core of Data. Publicly available information is used to identify county-level demographic characteristics that vary over time.
Table 2 provides descriptive statistics for all outcome, predictor, and control variables used in our analyses. The table in Appendix 2 (available online at http://epa.sagepub.com/supplemental) provides detailed variable definitions and data sources.
Descriptive Statistics

Analytic Framework
Using the Exceptionality classifications from individual students’ school records, we identify students who were placed in any category of special education. The same model specification is then applied to analyses of individual categories: behaviorally emotionally handicapped, educable/mild mental disability, specific learning disability, speech–language disabled, physical disability, other health impaired, and other disability.
The basic model takes the form of the following equation:

where, Pict is the unobserved probability of receiving any EC placement or placement in a specific EC category. We observe the binary indicator Eict, equal to 1 for EC placement in third grade and 0 otherwise, for the ith student in county c in year t. SSicb is a SS variable for the ith child, defined further below; MFicb is a MAF variable for the ith child, defined further below;
Of primary interest are the coefficients on the two program variables. In the basic model, we define the SS variable as follows:

where b refers to the period of eligibility for SS funding. PSS refers to the penetration of SS defined as the inflation-adjusted dollars per child age 0 to 5 in the relevant county in each of the years when the child was less than 5. As the sum of the penetration rates over the years when the child was less than 5, this measure accounts not only for different spending per year but also for the possibility that funding may not have been available in the relevant county during all the child’s preschool years.
The analogous measure for MFicb* is PMFicb(age = 4). In this case, the penetration rate refers to the inflation-adjusted dollars per 4-year-old for MAF in the relevant county for the year in which the child was 4 years old. Note that the variable is normalized by the total number of 4-year-olds in a county, not by the smaller number of 4-year-olds who meet the eligibility criterion. Consequently, one explanation for the variation across counties in this measure is the variation in the proportion of at-risk 4-year-olds to all 4-year-olds. Much of the variation of this type would be absorbed, however, by the county fixed effects. Over time, the variation within a county could be attributable to a rise or fall in the proportion of eligible children to all 4-year-olds. We have included county-year-level covariates of proportion of population on food stamps, proportion on Medicaid, and median family income.
The county and year fixed effects are important to the model. By including fixed effects for each county, we rule out the possibility that positive findings for the early childhood programs are the result of stable county-specific activities or investments that differ across counties and are correlated with the state’s investments in SS and MAF. As we include county fixed effects, our estimates reflect departures from placement trends in each county. We include year fixed effects to control for state-level factors that could potentially affect all counties in a particular year, such as changes in eligibility criteria for special education services at different ages. Because the fixed effects control only for time-invariant differences across counties, we also control for a number of time-varying county characteristics, measured at the individual student’s birth year. We include county-level indicators of the proportions of minority children and of children from disadvantaged families because differences in these proportions across birth cohorts could possibly be correlated with funding levels for SS and MAF. Total population and median family income are included as well, to control for potential variation in counties’ ability and willingness to invest in early childhood programs and to support public education.
The models are estimated using logistic regression, appropriate for the special education outcomes that we define as binary variables. The primary outcome variable is the “any exceptionality” classification in third grade; secondary outcome variables specify each individual exceptionality category. We then introduce several variations to the basic model, first by including interaction terms to test for variation in effects across groups of children. In another model variation, we test whether the models are robust to the inclusion of additional predictors of special education placements.
Results
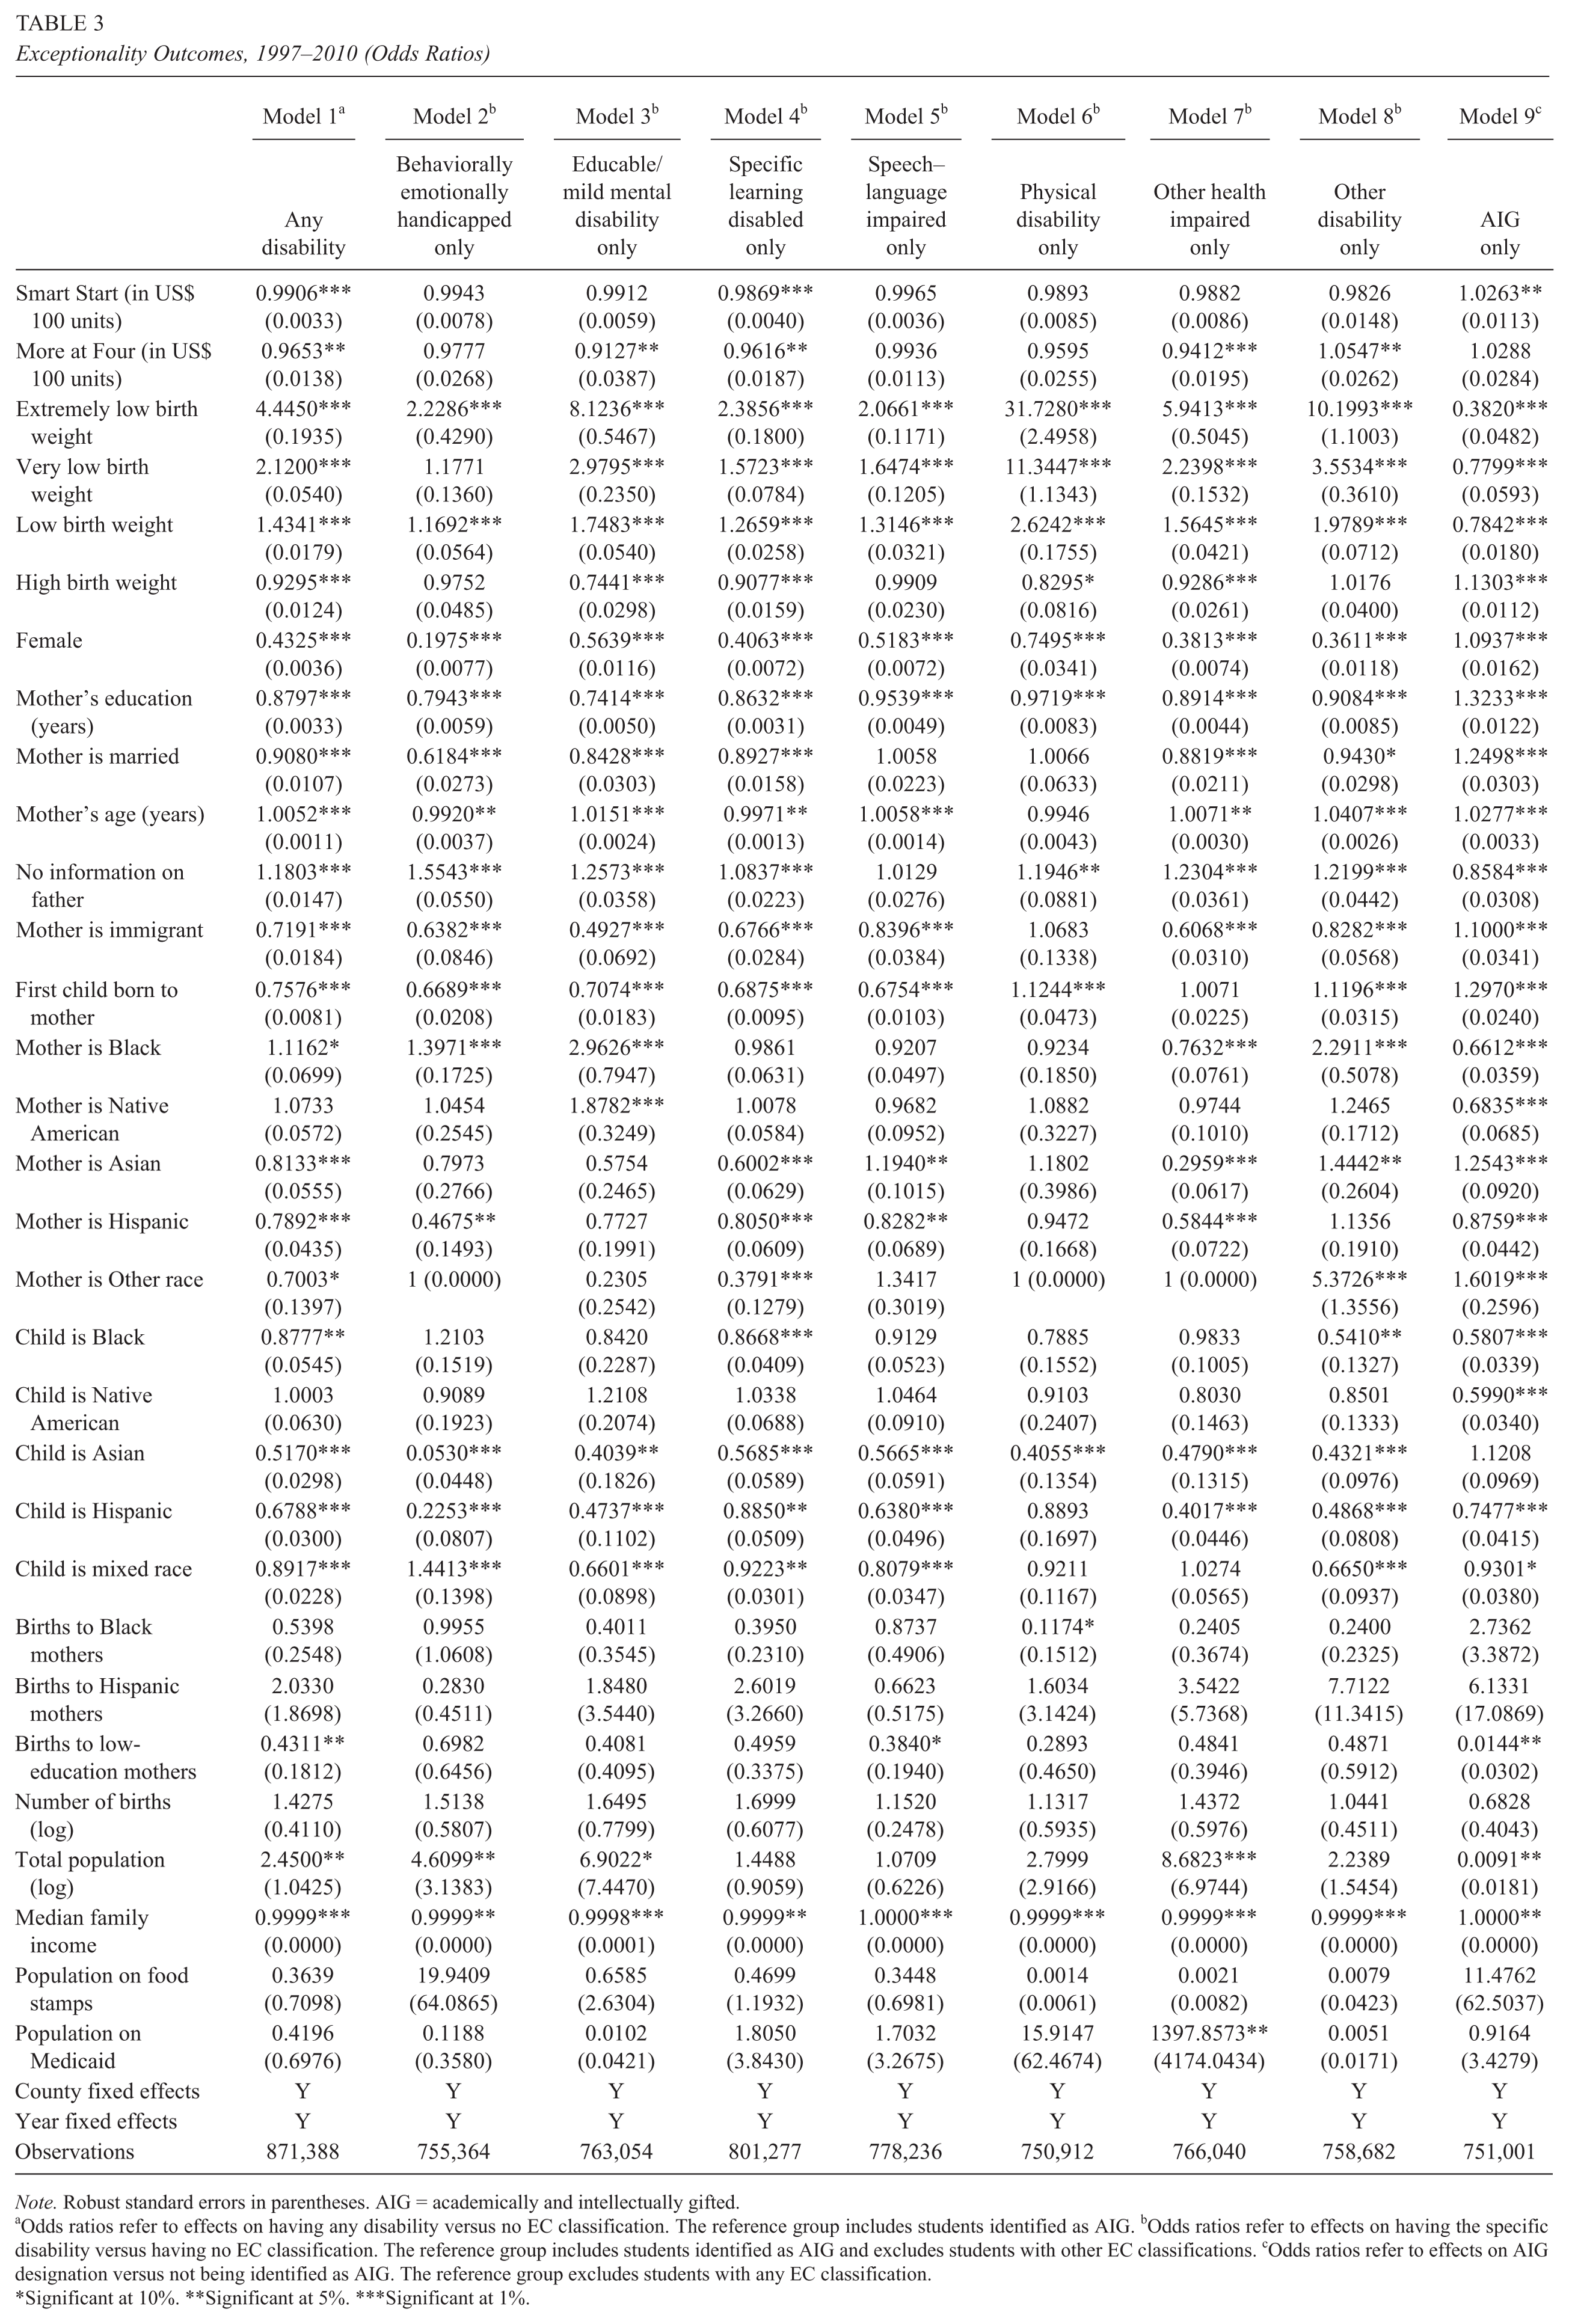
The main results are presented in Table 3, with the logistic coefficients transformed to odds ratios for ease of interpretation. For the basic model, we define the outcome for each student as follows: having any exceptionality classification (excluding Academically Gifted) while enrolled in the third grade. For this binary variable, the reference group is all third graders who did not have any exceptionality classification (but it includes Academically Gifted), and is defined for all students in the study sample (N = 871,388). A separate contrast compares students designated as Academically Gifted in the third grade with all other third graders.
Exceptionality Outcomes, 1997–2010 (Odds Ratios)
Note. Robust standard errors in parentheses. AIG = academically and intellectually gifted.
Odds ratios refer to effects on having any disability versus no EC classification. The reference group includes students identified as AIG. bOdds ratios refer to effects on having the specific disability versus having no EC classification. The reference group includes students identified as AIG and excludes students with other EC classifications. cOdds ratios refer to effects on AIG designation versus not being identified as AIG. The reference group excludes students with any EC classification.
Significant at 10%. **Significant at 5%. ***Significant at 1%.
The basic model (Model 1) contains covariates measured for the individual child and the mother, constructed with information from birth and education records. The pattern of odds ratios in analyses of covariates conforms to past literature. For example, the odds of having an exceptionality classification in third grade are 43% higher for children with low birth weight than for children of normal birth weight. For children with extremely low birth weight, the likelihood of an exceptionality classification is 344% higher than for children of normal birth weight. The odds of EC classification are comparatively high for boys, children of unmarried mothers, children whose father is not listed on the birth certificate, children who have mothers who are unmarried, and children whose mothers are Black or Native American.
Another important influence on special education placement is family socioeconomic status (SES). Although ideally measured with information on household income, parental educational attainment, and occupational status, we have access only to information on the mother’s educational attainment (in years) at the time of the child’s birth. We consider this an appropriate proxy for family SES, based on findings from the Panel Study of Income Dynamics that parental education is more highly predictive of education outcomes than is family income (Davis-Kean, 2005). In Model 1, each additional year of the mother’s educational attainment is associated with a 12% decrease in the odds of special education placement. This basic model includes only information from birth records and county-level data corresponding to each student’s county of birth. We add information corresponding to students’ third-grade year (in the models reported in Table 5), to check the robustness of findings to inclusion of additional school- and district-level variables.
Main Effects
Of primary interest in Table 3 are the odds ratios for the two program variables, measured as units of US$100 investments in SS and MAF. These are per-child expenditures over the years that the child was eligible for services within the county of the student’s birth and school enrollment. In Model 1, the odds ratios for the effects of each program variable are statistically significant and in the expected direction—investments in each program lower the odds of special education placement. Specifically, each US$100 investment in SS reduces the odds of a student receiving a special education placement of any type by 1%; the same investment in MAF reduces these odds by 3.47%.
Although the odds ratio is an indicator of effect size, it is useful to estimate the SS and MAF odds ratios at meaningful levels of investment in these programs. The average SS funding level for the entire sample period is approximately US$1,100 (US$220 per 0- to 5-year-old child per year over the 5 years that a child is eligible for SS funds); this is approximately equivalent to the average funding level during 2009. Based on the odds ratio for SS in Model 1 of Table 3, an investment of US$1,100 would reduce the likelihood of a special education placement in third grade by (1-.901), or 10% reduction. 2 The magnitude of the MAF odds ratio can be interpreted in a similar fashion. The average expenditure on MAF across the years in which the program existed was about US$334 per 4-year-old in the entire state. However, this average is far below the 2009 funding level for MAF, which is close to US$1,100 per 4-year-old. At that higher funding level, MAF reduces the odds of special education placement in the third grade with a ratio of (1-.678), or 32% reduction. Together, the two programs at the 2009 funding level reduce the odds of special education placement in the third grade by 39%.
Odds ratios for the effects of the SS and MAF program variables on individual disability categories are presented in Table 3, Models 2 through 8. The outcome variables in these models are binary variables coded 1 for students with a particular disability, and 0 for students who have no disability (including those classified as academically gifted without any disability). The sample size varies across each of these models, as students with other exceptionality classifications are excluded from the reference group. MAF significantly reduces placements for educable and mental handicaps, specific learning disabilities, and other health impairments. Each US$100 investment in MAF reduces the odds of placement for specific learning disabilities by 4%, for educable mental handicap by 9%, and for other health impairment by 6% (this category includes some placements for attention disorders). The unexpected finding that MAF increases the odds of “other disability” is difficult to address because this is a low-base-rate and catch-all category that varies over time both in its definition and in the proportion of students included.
SS reduces the odds of placement for a specific learning disability but not in any other category. The impact of both SS and MAF on reducing placements for specific learning disabilities is consistent with the hypothesis that this category is preventable. It is also the largest and most rapidly increasing disability group, accounting for 40% of all classifications (see Table 1).
Table 3 includes, in Model 9, the results of analysis of “academically and intellectually gifted” (AIG) as an educational outcome in which the indicator variable is equal to 1 if a student is classified as AIG in the third grade, and 0 if the student is identified as not AIG and does not have any other EC classification. SS significantly increases AIG identification, whereas the odds ratio for MAF is positive and similar in size but is less precisely estimated and is not statistically significant.
Subgroup Analyses
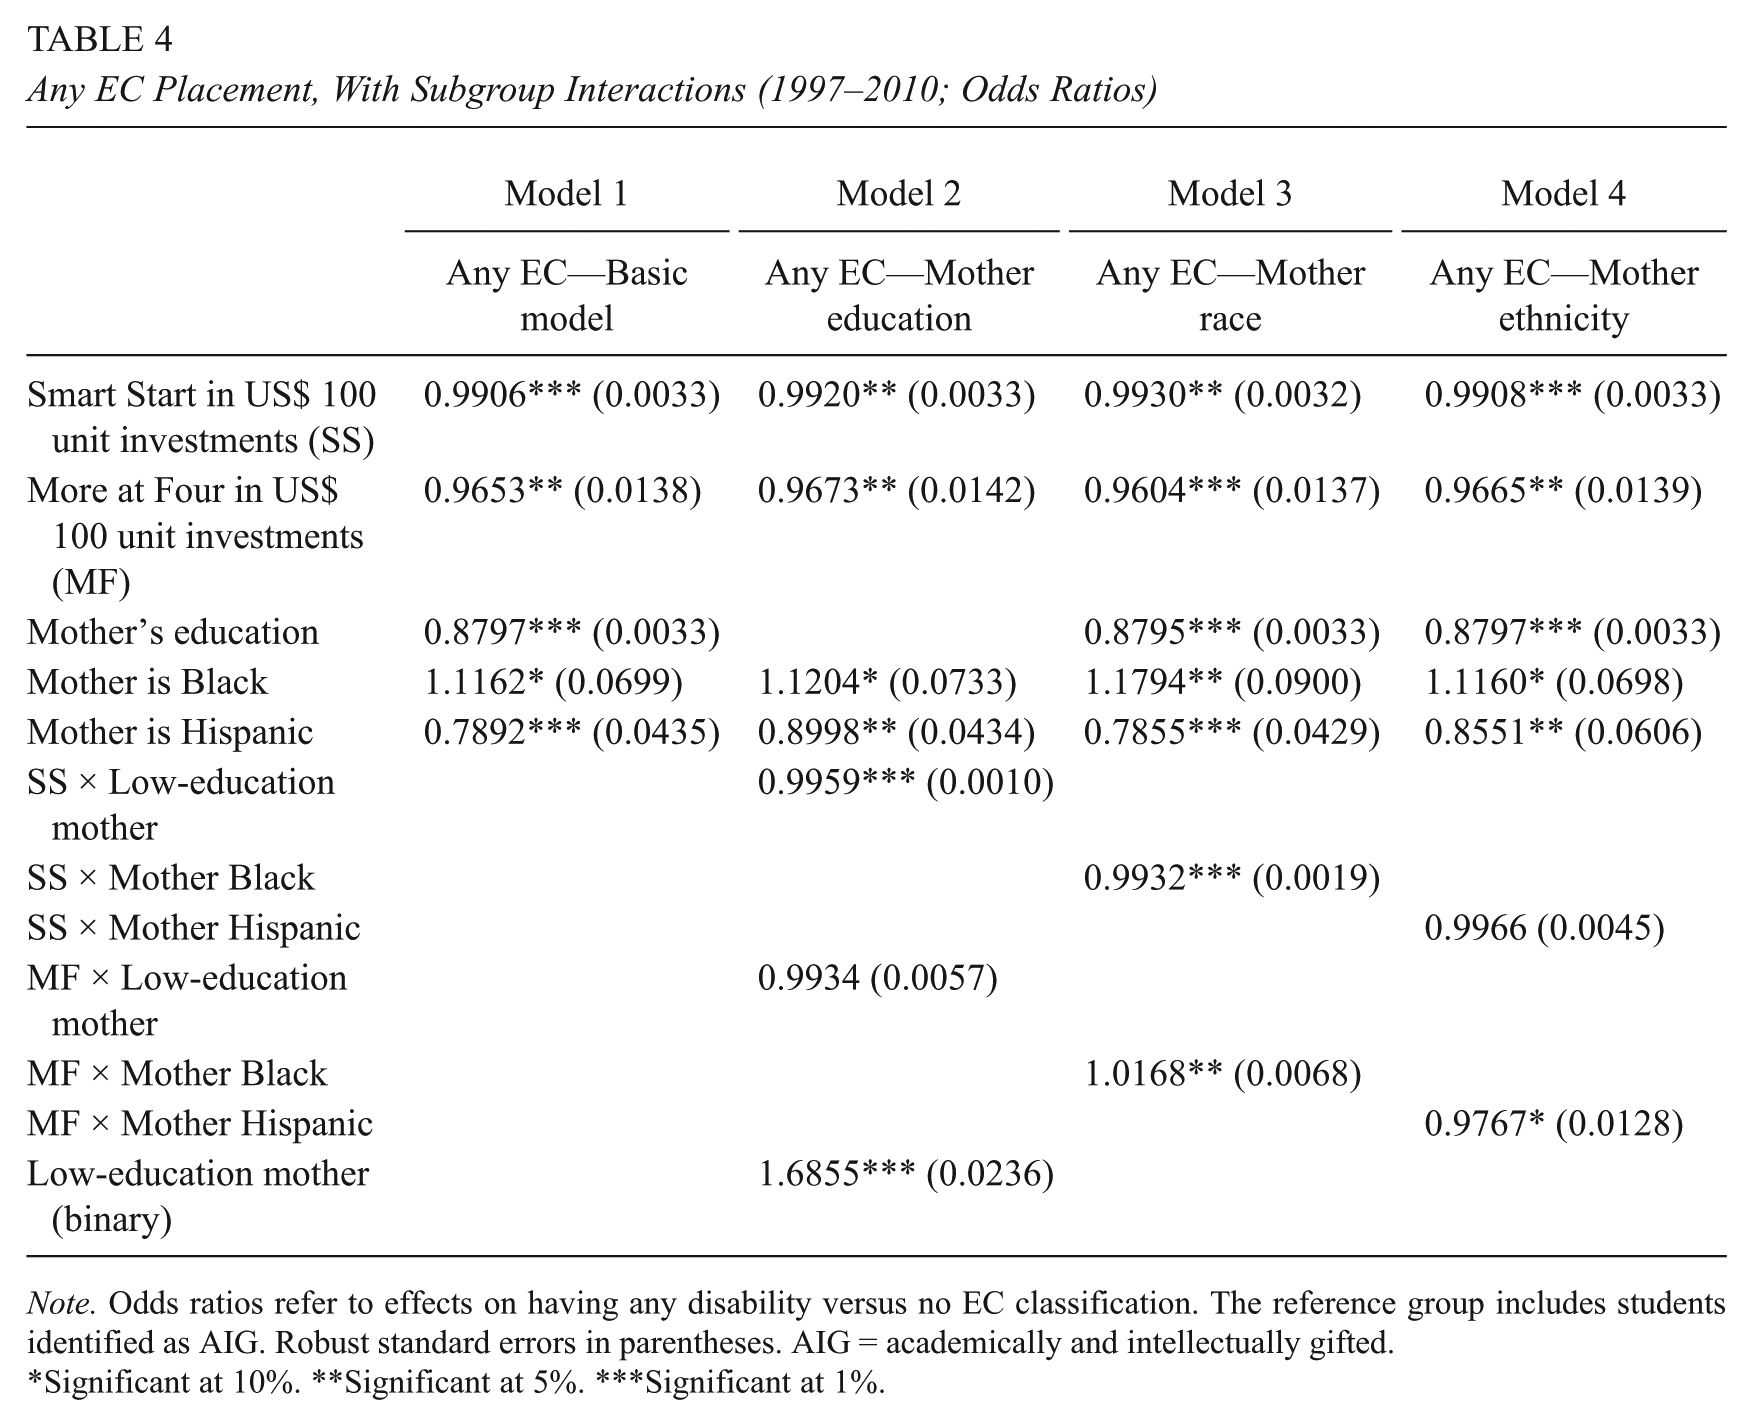
As noted earlier, the research evidence on effects of early education indicates that these programs may be most beneficial for children whose families experience some level of disadvantage. We test for differential effects of exposure to SS and MAF by introducing interaction terms to the basic model (Model 1 in Table 3). These terms test for variation in the effects of SS and MAF on special education placement by race, ethnicity, and education level of the child’s mother. As reported in Table 4, heterogeneous effects are present for race groups (mother is Black vs. all others) and for education level of the mother (less than high school vs. all others). In the presence of the interaction term, the main effect of each program refers to the odds ratio of the program variable for the reference category: Mother has at least a high school education (Model 1), the mother is not Black (Model 2), or the mother is not Hispanic (Model 3).
Any EC Placement, With Subgroup Interactions (1997–2010; Odds Ratios)
Note. Odds ratios refer to effects on having any disability versus no EC classification. The reference group includes students identified as AIG. Robust standard errors in parentheses. AIG = academically and intellectually gifted.
Significant at 10%. **Significant at 5%. ***Significant at 1%.
The effects of the SS program variable are significantly higher for children in the less advantaged category of low maternal education, whereas the effects of MAF do not differ significantly by mother’s education level. Although the SS program coefficients for all of the racial groups are positive and statistically significant, they do not differ significantly from one another. The effects of MAF vary significantly by race; although the effects are positive for each racial group, they are smaller for children of Black mothers. We find no evidence that the effects of SS differ significantly for students of Hispanic mothers, as compared with other ethnic groups, whereas MAF had a larger effect on children of Hispanic mothers than on children of non-Hispanic White mothers.
Sensitivity Tests
The strongest threat to the validity of our findings is the possibility of a confound between state expenditures on the early childhood programs for a county within a particular year and a coinciding unmeasured variable. We consider two types of potential confounding variables measured in the year that the child is in the third grade: characteristics of the school where the student was enrolled, and school district expenditure levels and sources. We test the sensitivity of our main results by adding these variables to the basic outcome model (this model is the same as reported in the first column of Table 3).
The first sensitivity test involves adding characteristics of the school that the child attended in the third grade. We examine the effects of race composition and teacher characteristics, measured at the school level as percentage of Black students, percentage of other minority students, average licensure scores of all teachers in the school, and percentage of inexperienced teachers. As reported in Table 5, we find that inclusion of these school-level predictors has little effect on the estimated odds ratios for SS and MAF funding, and all effects remain significant.
Any Exceptionality Model With Additional Control Variables (1997–2010)

Note. Selected coefficients are from regression models that also include controls for an extensive set of child and parent characteristics at time of birth, fixed effects for county and year of birth, and county time trends. School characteristics are the percent Black students and percent other minority students in the child’s school, the percent of new teachers in the school, and the average test scores of the teachers in the school. District expenditures are per-pupil expenditures in 2009 U.S. dollars. Revenue by source, all in per-pupil 2009 U.S. dollars at the district level are revenue from the state government, from the local district, and from the federal government. Teacher information, district expenditures, and district revenues by source only available until 2009. Standard errors, clustered at the county level, are in parentheses. See the table in Appendix 2 (available online at http://epa.sagepub.com/supplemental) for details.
Significant at 10%. **Significant at 5%. ***Significant at 1%.
The second sensitivity test is reported in column 2 of Table 5, referring to the results of analyses that include two county-level measures of school resources. The model in column 2 does not include school-level characteristics. The measure included in column 2 is per-pupil spending (in 2009 U.S. dollars) in the county where the child attended school, measured when the child is in third grade, whereas the programmatic funding for SS and MAF is measured for the relevant years before the child enters school. In these models, we are addressing the concern that the absence of these time-varying resource variables would lead to biased estimates of program effects and that their inclusion might substantially reduce the magnitudes of the estimated program effects. That concern is based on the potential for a positive correlation between changes in program funding and subsequent changes in school funding within counties. In our models (see the table in Appendix 3, available online at http://epa.sagepub.com/supplemental), we find that total per-pupil expenditures have a significant, very small positive impact on special education placements. However, we note that in column 2 of Table 5, the odds ratios for the programmatic variables are very similar to those in our basic model, indicating that our results are not sensitive to time-varying resources at the county level. In the models in columns 2 and 3, the effects of both SS and MAF on reducing exceptionality placements remain significant, with the estimated effects now slightly larger than in the basic model. This pattern is consistent with the view that the programs may have some effect on the quality of the schools that children subsequently attend, with the children who are at higher risk of being identified as having special needs attending the lower quality schools.
Conclusion
We find that access to early childhood programs in North Carolina significantly reduces special education placements in third grade. At 2009 funding levels, the SS reduces placements by 10% and the MAF program by 32%. Together, at these funding levels, the two programs reduce the odds of special education placement by 39%. Furthermore, we examine programmatic effects on placement for each disability category and find evidence of effects on the preventable categories of specific learning disability (both SS and MAF), educable mental handicap (MAF), and other health impaired (MAF), but not the less malleable categories of physical disability and speech–language impaired. Neither program has a measurable impact on behavioral-emotional disabilities. We find evidence that SS reduces placements more for children of less well-educated mothers than for children of more well-educated mothers, and more for children of Black mothers than for children of White mothers. These interactions occur in a context of generally positive effects on all subgroups and indicate a matter of degree rather than change in direction of effect. Thus, SS is likely to have a positive impact on reducing population-level income and racial gaps in special education placements. In contrast, although MAF has a positive effect on all subgroups, the program’s net effects are larger for children of White mothers than for children of Black mothers. This pattern was unexpected and bears further scrutiny.
Our study is limited by the lack of detailed information on our outcome measures. We are able to determine disability status only according to the categories established each year for federal reporting on exceptional children in public schools. Because these categories and their definitions changed over the period covered by our study, we had to develop alternative, somewhat more inclusive disability classifications than we would have preferred. Our re-classification may have influenced the pattern of effects in our models, particularly across individual disability categories. For individual students, we do not have any information on symptoms or severity of conditions that leads to special education placement. More detailed information of this type would provide some insight into possible mechanisms through which the programs influence disability status across types of placements.
As noted earlier, for SS, an investment level of US$1,100 per child generates a 10% reduction in third-grade special education placements. It is useful to consider these program benefits in terms of cost reductions across all third graders in the community. The cost reductions associated with this SS effect may be roughly estimated by considering a single year of expenditures associated with special education placement. In 2005 to 2006, North Carolina spent approximately US$8,000 per third grader who received special education services, on top of the cost of regular education. A reduction of 10% in special education placements for 1 year only (1,508 third graders) would represent a savings for the year of US$112 for every third-grade student enrolled in North Carolina. 3
We find that MAF investments generate an even larger savings in terms of reduced special education placements in third grade. An investment of US$1,100 per child in MAF results in a reduction of 32% of special education placements in third grade. Considering the 2005–2006 school year, this reduction represents a savings of US$358 per student enrolled in the third grade across the state. Because many students receive special education services for multiple years, the benefits of either early childhood intervention are likely to be much higher than this single year savings. For example, if students who receive special education services in third grade also receive these services in kindergarten, first, and second grades, the per-student savings associated with SS investments is US$448, and the savings from MAF is US$1,348 (for students completing the third grade in 2006). The cost savings from reducing special education placements are only one of the returns to investments in early childhood programs, but they make an important contribution and should be considered in comprehensive policy analyses of early childhood programs.
Footnotes
Declaration of Conflicting Interests
The author(s) declared no potential conflicts of interest with respect to the research, authorship, and/or publication of this article.
Funding
The author(s) received no financial support for the research, authorship, and/or publication of this article.
Notes
Authors
CLARA G. MUSCHKIN is an assistant research professor in the Sanford School of Public Policy, associate director for undergraduate studies in the Center for Child and Family Policy, and director of the North Carolina Education Research Data Center at Duke University. She is a sociologist and demographer with an interdisciplinary research focus. In her research, she asks how education policies and institutions influence student behavior, academic performance, and opportunities across the life course.
HELEN F. LADD is the Susan B. King Professor of Public Policy Studies and professor of economics in the Sanford School of Public Policy at Duke University. She is a past president of the Association for Public Policy Analysis and Management and a member of the National Academy of Education.
KENNETH A. DODGE is the William McDougall Professor of Public Policy and Psychology and Neuroscience and director of the Center for Child and Family Policy at Duke University. He is a psychologist who is interested in how problem behaviors develop in children and how public policy can improve children’s development and well-being. He has studied issues such as violent behavior, school dropout, substance use, and kindergarten readiness.
References
Supplementary Material
Please find the following supplemental material available below.
For Open Access articles published under a Creative Commons License, all supplemental material carries the same license as the article it is associated with.
For non-Open Access articles published, all supplemental material carries a non-exclusive license, and permission requests for re-use of supplemental material or any part of supplemental material shall be sent directly to the copyright owner as specified in the copyright notice associated with the article.
