
Abstract
While most educators assume that not all students try their best on achievement tests, no current research examines if behaviors associated with low test effort, like rapidly guessing on test items, affect teacher value-added estimates. In this article, we examined the prevalence of rapid guessing to determine if this behavior varied by grade, subject, and teacher, and evaluated if rapid guessing influenced teacher value-added estimates. We observed differences in rapid guessing across grades, subjects, and teachers; however, this behavior did not appear to have a substantive effect on teacher value-added estimates. These findings suggest that rapid guessing occurs frequently enough that educators should be mindful of its effect on the interpretations of student test results. However, based on the value-added specifications used in this research, this type of behavior did not appear to affect estimates of teacher performance.
We sought to investigate two broad issues in this research. First, we examined whether rapid guessing varied across teachers, test administration periods, grades, or subject areas. Second, we generated teacher value-added estimates using several different model specifications, including models that accounted for student rapid-guessing behaviors in differing ways. Results from these effort-adjusted VAMs were compared with standard value-added results (not adjusted for effort) to determine how rapid guessing may contribute to differences in the rank orderings of teachers, including a review of how the composition of teachers identified at different points in the performance distribution changed conditional on student rapid-guessing behavior. If states base teacher pay or remediation decisions on VAM-related effectiveness classifications, and teachers are reclassified when test-taking effort is considered, then states may be punishing or rewarding teachers based on test results that do not accurately reflect what students know or have learned.
A pivotal issue related to this research is the role teachers play in improving or maintaining student test-taking behavior. That is, do differences in student rapid-guessing rates reflect differences in the students assigned to a teacher, or do those differences provide some indication of the effectiveness of the teacher? If more effective teachers are able to elicit better test effort from their students, then controlling for rapid guessing in VAM could reduce a clear signal of teacher effectiveness from VAM estimates. While we do not directly answer the question of how teachers affect student test-taking behavior in this research, we do consider various ways to account for student rapid-guessing behavior when estimating teacher value added, which we elaborate on in greater detail in this article.
This article is organized as follows: In the next section, we summarize current research on how test-taking effort can be measured and how rapid guessing can introduce bias into estimates of student achievement. We also identify value-added modeling issues that are particularly relevant to this line of research. We then provide a summary of the data used for this study, an overview of how we measured rapid guessing, and a description of the VAMs employed for this research. Finally, we summarize our methods and results for each of our research questions, including a summary of how we accounted for student rapid guessing in our VAMs, and conclude with a discussion of the implications of this research.
Background
Measuring Student Test-Taking Effort
When presented with a selected response test item, a student can respond to that item in different ways. The student may carefully read the item and each of the potential answers, giving thoughtful consideration to selecting the correct answer for that item. This approach can be viewed as “effortful,” as the student is attempting to provide a correct response to the test item. Conversely, a student’s approach to responding to test items may be categorized as “non-effortful” if he or she makes no attempt to respond correctly, such as by randomly guessing when selecting item responses.
There are myriad reasons why a student may rapidly guess during a test event. There may be some idiosyncratic reason, such as a student feeling ill during testing or a testing environment that is overly loud and distracting. This behavior could also be a sign of test fatigue, with effort waning as the test progresses (Cao & Stokes, 2008). Rapid guessing may also be a signal of more persistent student characteristics, perhaps providing some indication about students’ perceptions of their own abilities or capacity to do well on a test, especially one that might be perceived as challenging (Soland, Jensen, Keys, Bi, & Wolk, 2017). If students do not believe they can do well on a test, then they may be more likely to rapidly guess on a single test or across multiple test events over time.
Teachers may also have some effect on student test effort. For example, some teachers may be better able to motivate their students to put forth their best effort on classroom assessments or have greater control over student behavior during a testing session compared with other teachers. These examples may be a signal of general teacher quality, especially if some teachers are better able to elicit and maintain high levels of test effort from their students. The extent to which teachers influence student test-taking effort has not been widely examined in the existing literature on this topic.
Whatever the reason for why rapid guessing occurs, measuring this behavior accurately and efficiently is not a straightforward task. Previous research on test-taking effort relied on student self-evaluations of their effort on more traditional pencil-and-paper tests, where students rated their overall level of test-taking effort upon completion of the test (Wise, 2015; Wise & DeMars, 2006). While this approach may capture some of the variability of student effort, it also requires students to truthfully and accurately summarize their effort across the entirety of the testing process. Beyond issues related to self-report bias, these self-evaluations may be less credible if students who did not try on the test also did not respond to the survey effortfully (Wise & DeMars, 2005).
Person-fit statistics can also be used to evaluate student test-taking effort by identifying item-score patterns that are atypical or improbable from what would be expected given a specific test design. Meijer and Sijtsma (2001) provided a comprehensive overview of various statistics that can be used for this purpose, including an elaboration on the practical uses of these various approaches for the purposes of detecting behaviors like cheating or guessing. An example of one such approach, intended specifically to identify these types of behaviors on computerized adaptive tests (CATs), was described by Bradlow, Weiss, and Cho (1998) and van Krimpen-Stoop and Meijer (2000). The authors suggested that patterns of consecutive correct or incorrect item responses at the end of a CAT—when item responses tend to alternate between correct and incorrect responses—may be an indication of an aberrant testing pattern. However, the utility of these person-fit approaches for the specific purpose of identifying low student test-taking effort is limited. Meijer and Sijtsma (2001) noted that the ability to detect these aberrant patterns is influenced by the degree and magnitude of student behavior, which may make it difficult to identify low test-taking effort in all but the most extreme cases. Wise and Kong (2005) concurred with this perspective and also described other factors that may influence a student’s item-response pattern, including cheating, lucky guessing, cognitive issues, and curricular differences across classroom and/or school settings, which further limits the ability to distinguish between these behaviors and clear instances of low test effort.
A method specifically developed for the purposes of measuring student rapid-guessing behavior on computer-administered tests, known as response time effort (RTE), was developed by Wise and Kong (2005) and refined by Wise and Ma (2012). RTE is a summary of student test-taking effort in which a student’s response to a test item can be classified as either solution behavior (i.e., effortful) or rapid-guessing behavior (i.e., non-effortful). This is done by comparing the duration of a student’s individual item response with a predetermined time threshold, with item responses flagged as rapid guesses if the duration of the student’s item response is less than the item-specific threshold.
Wise and Kong (2005) proposed thresholds that varied by the amount of reading required of a student. A review of item-response time distributions for a set of items showed that the distributions for many of these items were bimodal, with a spike in the frequency of test responses that were completed in 10 seconds or less. Based on this information, the authors established item thresholds of 3, 5, or 10 seconds, depending on the number of characters in an item, with responses that fell below these item-specific thresholds categorized as rapid guesses. The authors found that test-taking effort measured in this way was highly correlated with student self-reports of effort, and that the accuracy rates of item responses identified as rapid guesses were correct at a rate consistent with chance (approximately 25% accuracy for items with four response options). Using the same threshold-setting approach, Kong, Wise, and Bhola (2007) found that accuracy rates of items classified as rapid guesses were slightly higher than random chance (approximately 29%).
The threshold-setting process was later reevaluated by Wise and Ma (2012) to consider the mean duration of responses to individual items. This normative threshold approach was adapted to maximize the identification of rapidly guessed items, while minimizing the misclassification of an effortful item response as a rapid guess. The authors evaluated item accuracy rates based on three different minimum thresholds: 10%, 15%, and 20% of the average duration of item responses. To illustrate, if an item took students 60 seconds on average to complete, then item responses of 6 seconds or less would be flagged as a rapid guess using the 10% threshold. A maximum of 10 seconds was established for all items, given that responses longer than 10 seconds would no longer be reasonably considered a rapid response.
Wise and Ma (2012) found that the accuracy rates of rapidly guessed items identified using the 10% threshold closely approximated random guessing, while item responses classified as solution behaviors were consistent with expected accuracy rates. The expanded thresholds of 15% and 20% flagged item responses with accuracy rates greater than those of random guessing, suggesting that these increased thresholds misclassified some effortful student item responses as rapid guesses. These findings indicate that the 10% threshold allowed for effective differentiation between solution behaviors and rapid guesses, and that item responses flagged for rapid-guessing behavior reflect actual low-effort student responses (Wise & Ma, 2012). This specific threshold approach is supported by a considerable amount of validity evidence, which is described in detail by Wise (2015).
Relevant to this discussion, rapid guessing detected using the RTE approach has been shown to be uncorrelated with measures of student academic ability, indicating that this metric is not simply identifying low-achieving students who may have difficulty responding to items on a particular test (Kong et al., 2007; Rios, Liu, & Bridgeman, 2014; Wise & Kong, 2005). For example, Kong et al. (2007) examined the relationship between rapid guessing on a mandated college assessment and student academic ability measured on the SAT assessment. The authors found correlations that were near zero, indicating that rapid-guessing behavior was not simply a function of student academic ability.
Impact of Low Test-Taking Effort on Student Test Results
The effect of low test-taking effort on student test scores has been well documented in research and shows that low effort typically biases student test scores downward, underestimating what students know or have learned (Rios et al., 2017; Wise, 2015; Wise & DeMars, 2005; Wise & Kingsbury, 2016; Wise & Ma, 2012). Wise and DeMars (2005) reviewed a number of studies on the relationship between test-taking motivation and student performance and found that motivated students performed over a half of a standard deviation higher, on average, than unmotivated students. In a simulation study, Rios et al. (2017) also showed that students who rapidly guess on 6% or more of their test items tend to have their observed scores biased downward relative to their true scores by .2 standard deviations on average.
Because low test-taking effort can significantly distort inferences about student performance, Wise (2015) provided evidence that test events on which students rapidly guessed on 10% or more of the items could suffer from an understatement of the student’s true score sufficient to call the validity of that score into question. This 10% threshold was chosen empirically, in part by showing that scores from tests below the threshold showed lower levels of internal reliability, as well as other signals that these scores might be less valid (Wise & DeMars, 2010; Wise, Kingsbury, & Hauser, 2009; Wise & Ma, 2012). Rios et al. (2017) not only found that the removal of non-effortful responses resulted in increased mean test scores but also noted that these means could be upwardly biased if effort is highly correlated with academic ability.
Research focusing on the implications of low test-taking effort on student outcomes highlights the importance of identifying low test effort and how it may skew overall interpretations of student performance. This implication is particularly relevant when test results are used to evaluate the performance of teachers, schools, or educational programs. For example, the link between low test-taking effort and skewed test results was identified on the Trends in International Mathematics and Science Study (TIMSS), an assessment used to compare the quality of educational programs in different countries (Eklöf, Pavešič, & Grønmo, 2014). The authors found that low test effort contributed to differences between countries in assessed student performance.
Variations in student test-taking effort have also been shown to influence summaries of comparative school performance. Despite observing only a small amount of low student motivation on an assessment measuring knowledge in business-related subjects (1.3% of items were rapidly guessed), Setzer et al. (2013) found notable changes in the rank ordering of 84 higher education institutions after removing the scores for students who were clearly unmotivated while taking the test, and concluded that the variation of these rankings could have been much greater had the prevalence of low test-taking effort been more widespread.
Student Test-Taking Effort and VAM
No research to date has examined how student test-taking effort affects teacher VAM estimates or teacher rank orderings based on those estimates. Because low test effort can introduce negative bias into student test results, evidence that this test-score bias influences VAM estimates could have significant policy implications around the use of test scores for high-stakes evaluation purposes. If, for example, the test scores for a teacher’s students are substantially biased at posttest as a result of a high amount of rapid guessing, but no rapid guessing occurred at the pretest event, then the trajectory of growth in that classroom from pre- to posttest could be artificially deflated. The opposite is true if more rapid guessing occurs at the pretest event. Consistent with the prior literature that describes the potential impact of omitted variables on teacher VAM estimates (Lockwood & McCaffrey, 2014; McCaffrey, Lockwood, Koretz, Louis, & Hamilton, 2004), failing to account for rapid guessing in VAMs could potentially affect the validity of teacher value-added results, given the impact this behavior could have on the trajectory of student growth.
The way students are sorted to teachers and vice versa could also influence teacher VAM estimates. This sensitivity of VAM estimates is relevant to our study if patterns of student test-taking effort are nonrandom and teachers are sorted to students with differential test-taking effort in ways not accounted for in a VAM. Current research demonstrates that students are not randomly sorted to teachers (Kalogrides, Loeb, & Béteille, 2013; Loeb, Kalogrides, & Béteille, 2012; Paufler & Amrein-Beardsley, 2014) and that this nonrandom sorting can influence VAM estimates; however, issues related to nonrandom sorting may be sufficiently mitigated in models that account for lagged student achievement (Goldhaber & Chaplin, 2015; Kane & Staiger, 2008; Koedel & Betts, 2011; Rothstein, 2009). Nonetheless, current research on this topic has not evaluated the extent to which students with differential levels of test effort are nonrandomly assigned to teachers, and how that test effort, if left unaccounted for, may influence teacher value-added results. We fill a gap in the existing VAM literature by examining how rapid-guessing behavior varies across classrooms and by exploring the extent to which teacher VAM estimates are affected by student rapid-guessing behavior.
Data
The data used in this study came from 134 schools in 44 districts in an eastern U.S. state from the 2012–2013 and 2013–2014 school years. These districts were a subset of all districts in the state and were part of a consortium of districts that collaborated on best practices and uses of student test results for the purposes of educator evaluations. Three types of data were collected: student demographic data, student–teacher linkage information, and student testing data. The student demographic data files included information on student gender, race/ethnicity, English language learner (ELL) status, student eligibility for free or reduced lunch (FRL), and special education (SPED) status. The student–teacher linkage files included information about the number of instructional minutes a teacher provided a student, as well as the course(s) in which the teacher delivered instruction to students. In total, the datasets included information for 42,267 students in Grades 3 through 8 across 1,121 mathematics teachers and 1,109 reading teachers. Teachers with fewer than 10 students were excluded from this sample, an approach consistent with current research (e.g., see Lockwood & McCaffrey, 2014, and Loeb, Soland, & Fox, 2014).
Student test results from the NWEA MAP Growth reading and mathematics assessments were used in this study. The MAP Growth assessments are CATs that are typically administered 3 times a year, in the fall, winter, and spring. Each test takes approximately 40 to 60 minutes depending on the grade and subject area, though the test themselves are untimed. The reading assessment is generally comprised of 40 test items, and the mathematics assessment generally includes 50 test items. Students respond to assessment items in order (they cannot come back to a test question later), and a test event is finished when a student completes all of the test items. In this study, student achievement growth on the MAP Growth assessments was measured from spring of 2013 to spring of 2014.
There are several characteristics of the MAP Growth assessments themselves that may reduce, but not remove altogether, the likelihood of student rapid-guessing behavior. For example, the assessments and items are untimed, so the assessment format should provide minimal incentive for students to rapidly guess to try and complete all of the items on the assessments. Furthermore, because the assessments are adaptive, students only receive items at a difficulty level commensurate with their estimated achievement level, which reduces the likelihood that students are rapidly guessing due to responding to item content that is too easy or difficult for them. Finally, student rapid guessing on the MAP Growth assessments was collected unobtrusively, with item-response duration information not readily available to teachers or schools at the time of this research. This makes it unlikely that students or teachers adjusted their behavior in any way during the testing process that may affect the interpretation of our results.
Method
Measuring Rapid Guessing
This study utilized the previously referenced RTE metric with normative thresholds (Wise & Ma, 2012) to identify instances in which a student clearly engaged in non-effortful (i.e., rapid-guessing) test-taking behavior on the MAP Growth assessments. The normative thresholds used for this research were established by NWEA, the publisher of the MAP Growth assessments, and were based on item-level responses from a national sample of students. Using item-specific RTE data aggregated at the test event level, we summarized rapid guessing across a student’s test event as the proportion of the total number of test items on which a student’s item-response time was consistent with solution behavior. This proportion ranges from .0 to 1.0, with higher values indicating fewer numbers of test items being rapidly guessed and vice versa. For example, a test event in which a student did not rapidly guess on any test items would have an RTE of 1.0, and a test event in which a student rapidly guessed on half of his items would have an RTE of 0.5. Based on the previously described approach established by Wise (2015), test events with an RTE of 0.90 or less (10% or more rapidly guessed item responses) were flagged as potentially invalid and referred to as low-effort test events in this study.
Student responses flagged as rapid guesses using the RTE with normative thresholds approach (Wise & Ma, 2012) provide a validated way of accurately identifying when students have not invested enough time to appropriately consider the test question and attempt to provide an accurate response. However, there are situations, such as when a student takes an extremely long period of time on a test item but still provides a random guess, where rapid guessing does not fully capture the overall test effort of a student. Furthermore, as we have previously noted, there are any number of reasons for why a student may have rapidly guessed. This behavior may reflect a student’s general approach to test taking, or it may be an indicator of the ability of a teacher to keep his or her students motivated prior to and throughout the test-taking process. Rapid guessing may also simply be a signal of test fatigue, with students’ effort waning as the test progresses (Cao & Stokes, 2008). As such, the results of this research are limited to understanding how the specific behavior of rapid guessing on test items may influence teacher value-added estimates, irrespective of the specific reasons for why that rapid guessing occurred.
Estimating Teacher Value Added
We generated teacher performance estimates three ways using two different spring-to-spring VAM specifications. The first model, which we refer to as Model 1 throughout this article, is a teacher fixed-effects model that applies empirical Bayes shrinkage as described in Guarino, Maxfield, Reckase, Thompson, and Woolridge (2015). Estimates from this VAM, which did not directly account for student rapid guessing, served as our baseline set of teacher performance estimates.
Model 1 can be expressed in three equations: one that models student achievement over time (1.1), and two that model test measurement error (1.2) and (1.3). We modeled teacher value added for student i at time t such that
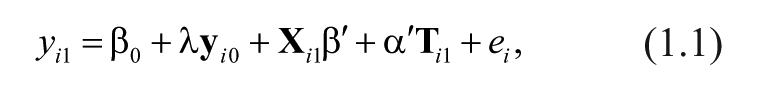
where
In practice, we do not observe “true” current achievement


where
where
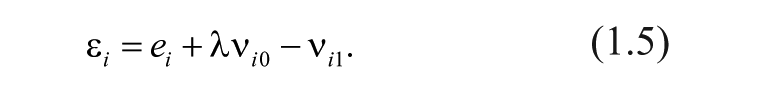
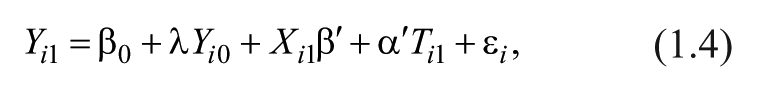
Equation 1.4 cannot be consistently estimated using ordinary least squares because
Teacher value added was also estimated using a model that introduced student test-taking effort at pretest (prior spring) as a model covariate. In practice, teacher value-added estimates should only be affected if there are substantive differences in the prevalence of rapid guesses between test administrations. Given that rapid guessing introduces negative bias into estimates of student achievement (on average), we would expect that a student with a high number of rapid guesses at pretest (and therefore an artificially lower pretest score) and no rapid guessing at posttest would demonstrate a growth pattern that was upwardly biased. Conversely, a student with no rapid guessing at pretest and a high number of rapid guesses at posttest (resulting in an artificially lower posttest score) would demonstrate growth that was downwardly biased. Because rapid guessing can affect student growth trajectories in different ways depending on when the rapid guessing occurs and to what extent, it may seem reasonable to control for this student behavior at all testing terms.
We did not, however, control for rapid guessing at both terms, given that contemporaneous effort is endogenous to a model of achievement. That is, it may be reasonable to hypothesize that a more effective teacher is able to elicit greater focus and effort from his or her students compared with a less effective teacher. If student test-taking effort is an indicator of teacher quality, and if teachers are responsible for improving or maintaining student test effort, then the presence of rapid guessing at posttest could be directly related to the effectiveness of the current teacher—the more effective the teacher, the less rapid guessing we might observe. Controlling for rapid guessing at posttest could therefore reduce a clear signal of teacher effectiveness from VAM estimates. For this reason, we controlled for student rapid guessing at pretest from the prior spring when the current teacher had no direct control over a student’s test-taking behavior. Results from this VAM specification are referred to as Model 2 in this article, with differences between Model 1 and Model 2 estimates serving as one way of interpreting how rapid guessing may affect estimates of teacher effectiveness. We intend to explore whether more effective teachers have a differential impact on student test-taking effort in future research.
Building upon Equation 1.4, Model 2 can be expressed as follows:
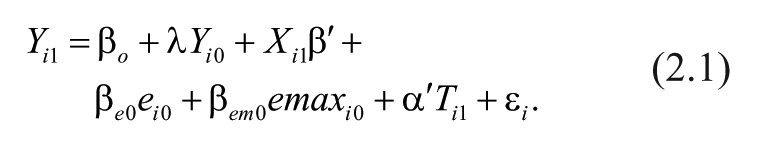
In this model specification,
As previously noted, one potential concern with adjusting for effort by including only lagged RTE is that it does not directly account for effort at posttest. This decision was made to avoid endogeneity concerns, given that teachers are likely able to influence student test-taking effort, at least to some extent, and more effective teachers may be better at maintaining student effort throughout the test than less effective teachers. However, this does limit our ability to directly examine the effects of rapid guessing at posttest, which is relevant to this research given the potential influence this behavior at posttest can have on the trajectory of student growth (i.e., depressing student growth, given the negative bias introduced into the posttest score). While we cannot circumvent endogeneity issues in models that account for posttest rapid guessing, we did opt to estimate teacher value added in an alternative manner to examine the robustness of our Model 2 results when accounting for posttest effort.
For this alternative method, we reestimated teacher value added using Model 1 specifications but used scores from the MAP Growth assessments at pre- and posttest that were reestimated after removing rapidly guessed item responses. These “effort-moderated” scores essentially treat rapid guesses as missing, reproducing item-response theory (IRT) estimates using maximum-likelihood estimation based only on nonrapidly guessed item responses. With this effort-moderated approach, if a student rapidly guessed on 10 of 50 items, then the student’s IRT estimate would be based only on information from the 40 items that were not rapidly guessed.
These effort-moderated scores involve a classic bias-precision trade-off. Wise and DeMars (2006) and Wise and Kingsbury (2016) showed that effort-moderated scores remove most of the bias introduced into observed test scores by rapid guessing but yield achievement estimates with lower precision (i.e., greater standard error of measurement) because the estimates are based on fewer items. The main benefit of effort-moderated scores in the VAM context is that we can account for rapid guessing at pre- and posttest, which Model 2 does not and generate VAM estimates using test scores with reduced bias that was a direct function of student rapid-guessing behavior.
However, this approach does not assuage endogeneity concerns, given the potential influence teachers have on student behavior on a test. While this approach removes bias that occurs as a function of a student, this approach can still bias VAM estimates if rapid guessing is correlated with teacher quality. That is, if less effective teachers have student test scores that are nosier estimates of student achievement as a function of the increased presence of rapid guessing, then this effort-moderated approach could positively bias teacher VAM estimates, given that the effort-moderated scoring approach removes student item responses that may provide information about teacher quality. Specifically, less effective teachers whose students demonstrate more instances of rapid guessing would have VAM estimates that are positively biased relative to what their “true” VAM estimates should be (estimates based on all item responses, not just those item responses that were not rapidly guessed). Thus, we acknowledge that endogeneity issues remain a concern with this effort-moderated approach, but results from this model do allow us to examine how this behavior affects VAM estimates when we account for rapid guessing at both test terms, and chiefly serve as a robustness check for our primary Model 2 results.
We refer to our VAM model that uses student effort-moderated scores as Model 3 and compare these model results with results from Model 1. This approach, in a sense, represents an upper-bound of the effects of rapid guessing on teacher VAM estimates, when attributing none of the variations in rapid guessing at posttest to the effects of the teachers themselves. Because the model specification used in this approach is identical to that of Model 1, any differences observed between results are not a function of our modeling choices but instead reflect differences in achievement estimates based on all item responses or only nonrapidly guessed responses. As such, using effort-moderated scores helps ensure that our main results are not a function of omitting posttest RTE, nor are they a function of our modeling choices more generally.
Research Question 1: How Prevalent Was Rapid Guessing?
The first research question focused on the prevalence of rapid guessing within the research sample, including the extent to which rapid-guessing behavior varied across teachers, test administration periods, grades, and subject areas. To address this question, we relied primarily on descriptive statistics to identify the proportion of all tests within the study sample that met the low-effort test event criterion, and present this information at pretest and posttest by grade and subject. We also summarized differences in rapid guessing across teachers, showing the proportion of teachers within the sample with varying counts and proportions of students who met the low-effort test event criterion. We hypothesized that VAM estimates would only be affected in a significant way if rapid guessing was clustered within classrooms.
We also identified the proportion of students in our sample who did or did not meet the low-effort test event criterion at both pre- and posttest, to give some indication as to how common it was for students to repeat this behavior over time. Finally, we also present information on the relationship between mean student achievement and RTE aggregated at the teacher level, as it is relevant to understanding how rapid guessing may influence estimates of teacher performance.
Research Question 2: What Was the Effect of Rapid Guessing on VAM Estimates?
Our second research question addressed the extent to which rapid guessing influenced teacher VAM estimates. We examined this issue in several ways using teacher-level VAM estimates based on the previously described model specifications. We first examined the correlations in VAM estimates between Model 1—our baseline estimates of teacher performance—and Model 2 (rapid guessing at pretest introduced as a model covariate). This comparison included a summary of the average and maximum difference in VAM estimates across models, as well as the proportion of teachers with VAM estimates that differed by .25 and .50 standard deviations. We present this information by the number of low-effort test events at pretest to demonstrate if increased instances of rapid guessing contributed to differences in VAM estimates across model conditions.
We also examined how test effort influenced the relative ranking of teachers, focusing primarily on those teachers in the top and bottom 5% of the performance distribution. The identification of low- and high-performing teachers is consistent with current policy and research (Hanushek, 2011; Hanushek, Kain, O’Brien, & Rivkin, 2005). To do this, we ranked teachers within grade and subject using estimates from all three VAM conditions. We used these rankings to determine if there was consistency in the subsets of teachers identified in the top and bottom 5% of all teachers across model conditions, and if the rank ordering of teachers shifted at any other point in the distributions.
Limitations
The sample used in this study was a consortium of districts in one state that used student MAP Growth results as a component in their state-mandated educator evaluation system. Because these districts self-selected into this consortium, the overall generalizability of these findings may be limited. In addition, because MAP Growth results were used for high-stakes purposes for teachers, but were low stakes for students (meaning performance on the assessments did not affect students in any direct manner), that may have contributed to differences in how students, teachers, or schools approached the test-taking process. Further research of this type can help demonstrate if the trends and results we see with this research sample are consistent with what occurs in other school settings. Finally, the manner in which rapid guessing is measured in this article is limited in application only to computer-administered assessments. Alternative approaches to measuring rapid guessing would need to be used in replications of this study that utilize test results from traditional pencil-and-paper assessments.
Results
Research Question 1: How Prevalent Was Rapid Guessing?
Results in Table 1 show the proportion of students within the study sample who met the low-effort test event criterion (RTE ≤ .90), with this information presented by test event, subject, and grade. We observed differences in test-taking effort by grade and subject area, with rapid guessing more prevalent in the middle school grades (sixth–eighth) compared with elementary grades, and more common in reading than in mathematics. The percentage of students who met the low-effort test event criterion ranged from 1% of third-grade students in mathematics to 14% of seventh-grade students in reading. The greater prevalence in reading was likely a result of students having to engage with longer text passages on the reading assessment compared with the mathematics assessment, and is consistent with previous research on this topic (Setzer et al., 2013; Wise, 2006; Wise et al., 2009).
Proportion of Students With Low-Effort Test Events (RTE ≤ .90)
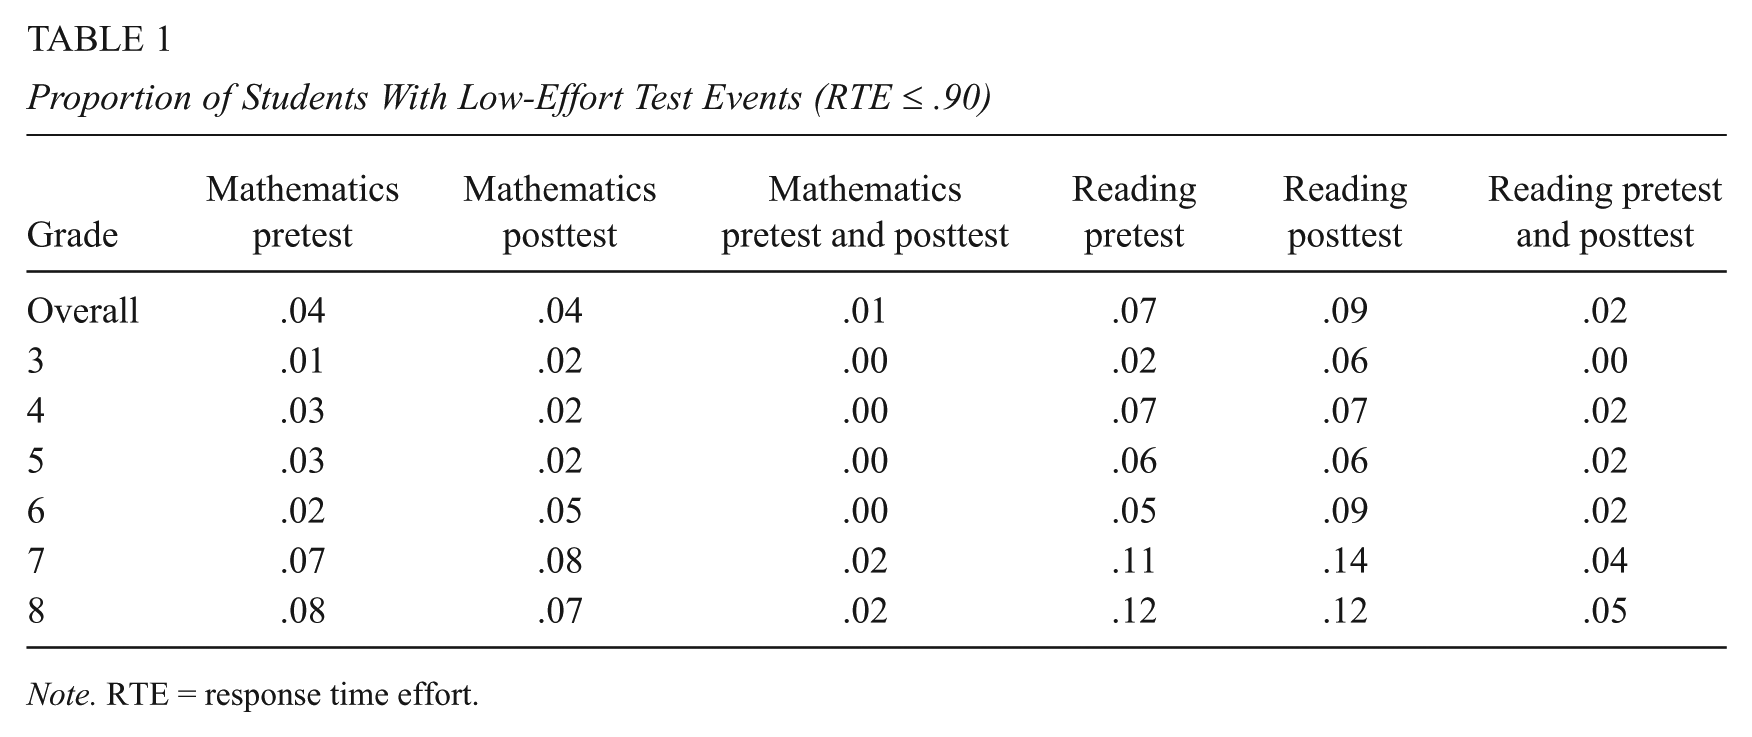
Note. RTE = response time effort.
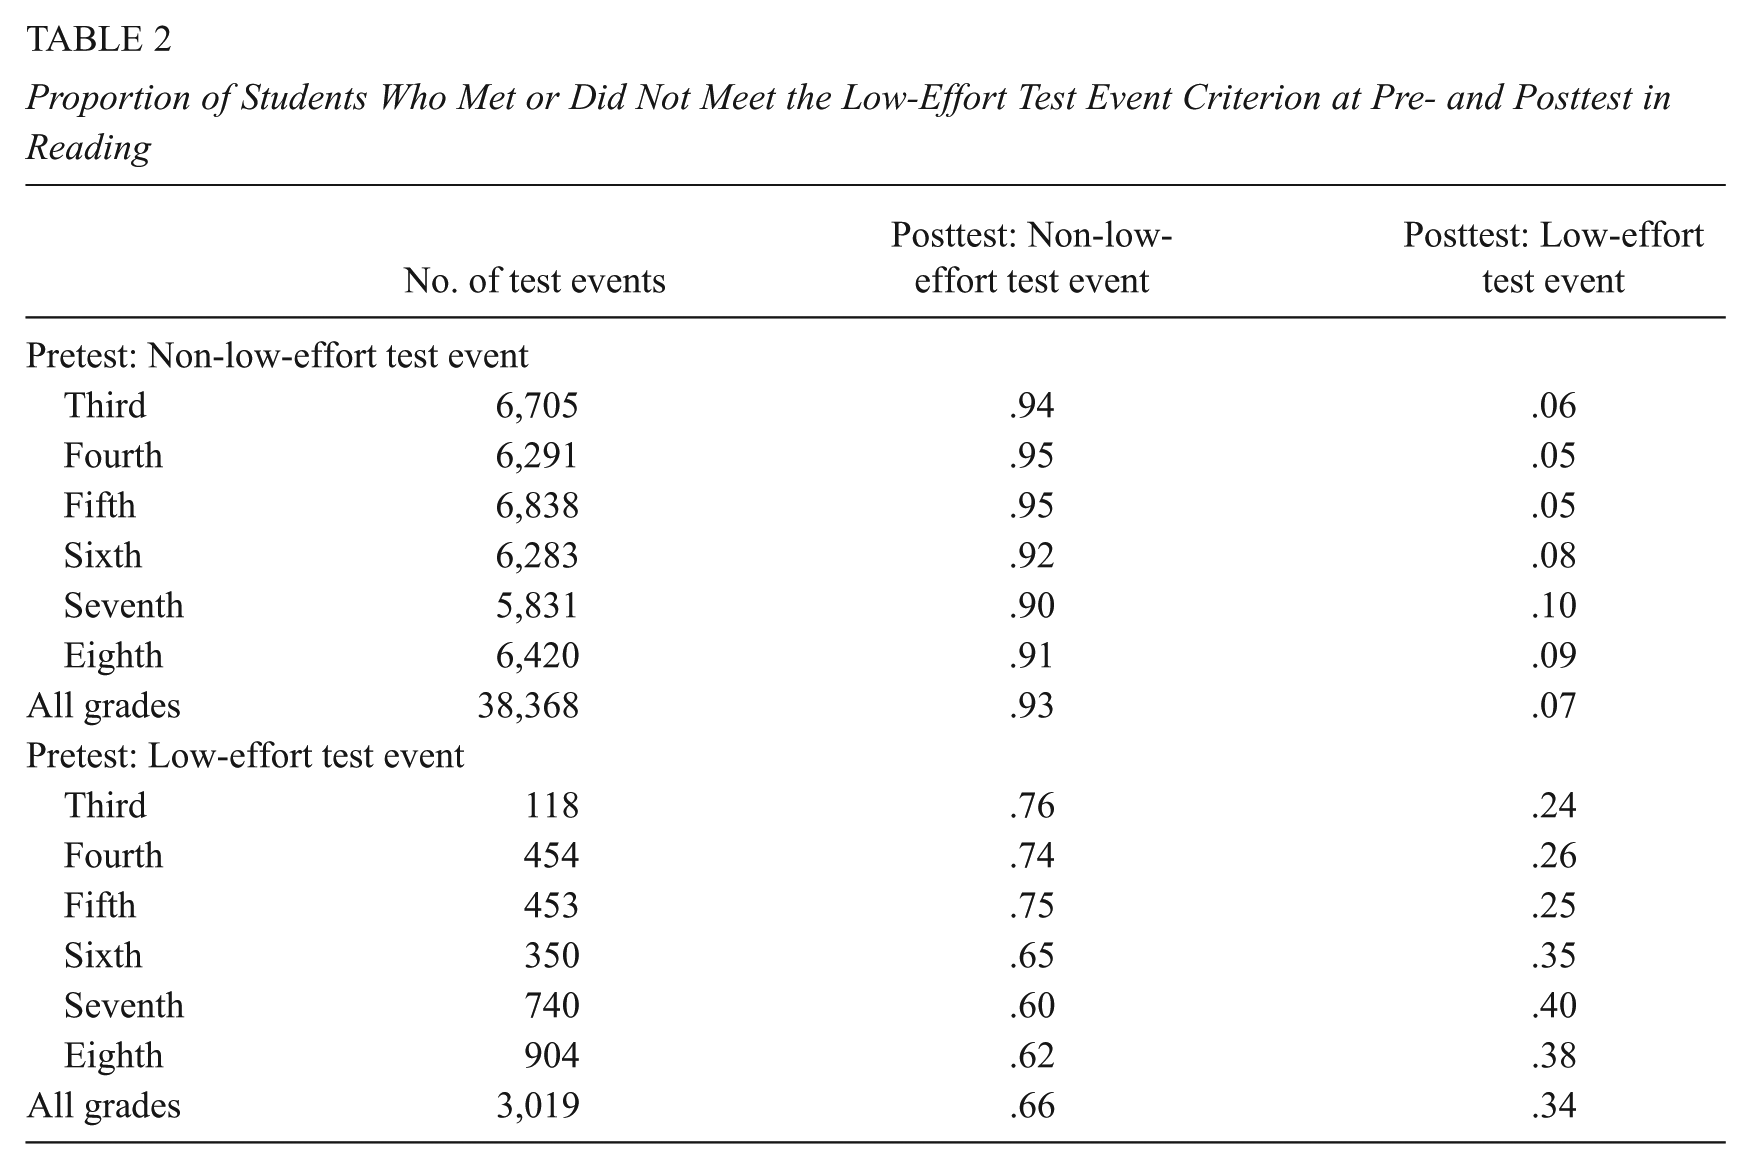
We also observed a small proportion of the overall student sample with low-effort test events at both pre- and posttest, including up to 5% of all eighth-grade reading students. Correlations of student-level RTE at pre- and posttest range from .13 in third-grade mathematics to .37 in eighth-grade reading, which indicates a moderate correlation in student-level test behavior across test events. Due to censoring in the RTE variable, we also summarized the proportion of students who did not meet the low-effort test event criterion at pretest and did or did not meet that criterion at posttest, and similarly for those students who did meet the low-effort test event criterion at pretest. These results for reading are presented in Table 2 and show that 93% of all students who did not meet the low-effort criterion at pretest also did not meet the criterion at posttest. Conversely, 34% of students who met the low-effort test event criterion at pretest also met that criterion at posttest. These results further suggest that there is some consistency in student test-taking behavior over time, giving increased importance to our effort-moderated estimates, which, unlike Model 2, account for effort at pre- and posttest. Results in math show similar trends.
Proportion of Students Who Met or Did Not Meet the Low-Effort Test Event Criterion at Pre- and Posttest in Reading
There were also differences in the distribution of low-effort test events in both subject areas across teachers (see Table 3). We present this information by school level based on the differences we observed in the prevalence of low-effort test events in middle school grades (sixth–eighth) compared with the elementary school grades (third–fifth), and by the count and proportion of low-effort test events. In general, we see greater variability across teachers in the upper grades, and in reading compared with the lower grades and mathematics. For example, 70% of elementary teachers had no low-effort test events in mathematics at pretest. By contrast, only 14% of middle school teachers had no low-effort test events in reading at pretest, whereas 33% of teachers had 20% or more of students who met this criterion.
Proportion of Teachers With Increasing Counts and Proportions of Low-Effort Test Events
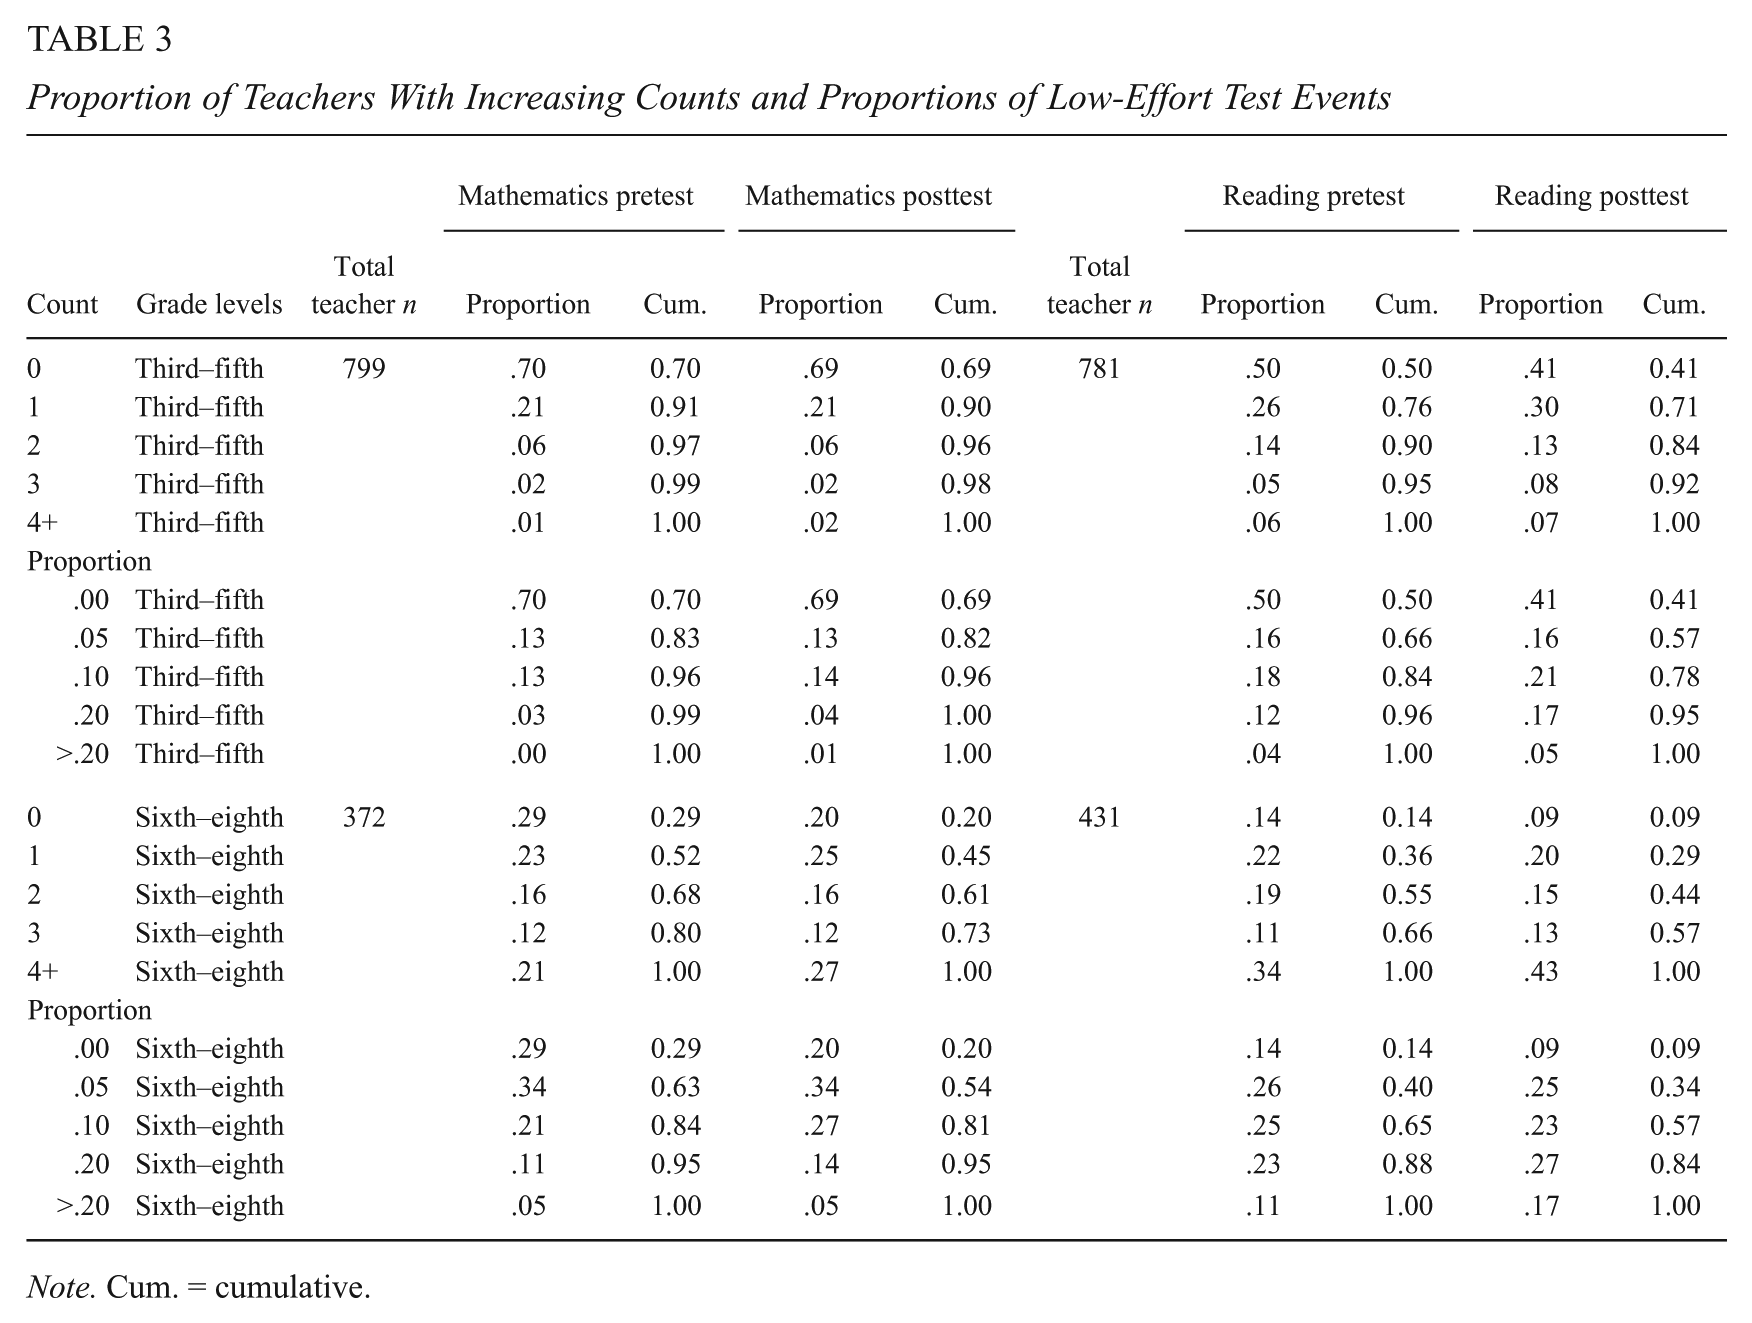
Note. Cum. = cumulative.
Finally, we also examined the relationship between rapid guessing and student achievement, as it is relevant to understanding how this behavior might influence VAM estimates. In Figure 1, we show this relationship by summarizing mean achievement across subjects at pretest by the mean RTE decile for a teacher’s group of students. These results show a clear relationship between achievement and RTE—the greater the amount of rapid guessing within a classroom, the lower the overall mean achievement. The direction of this relationship makes intuitive sense, given the negative bias that rapid guessing introduces into estimates of student achievement.
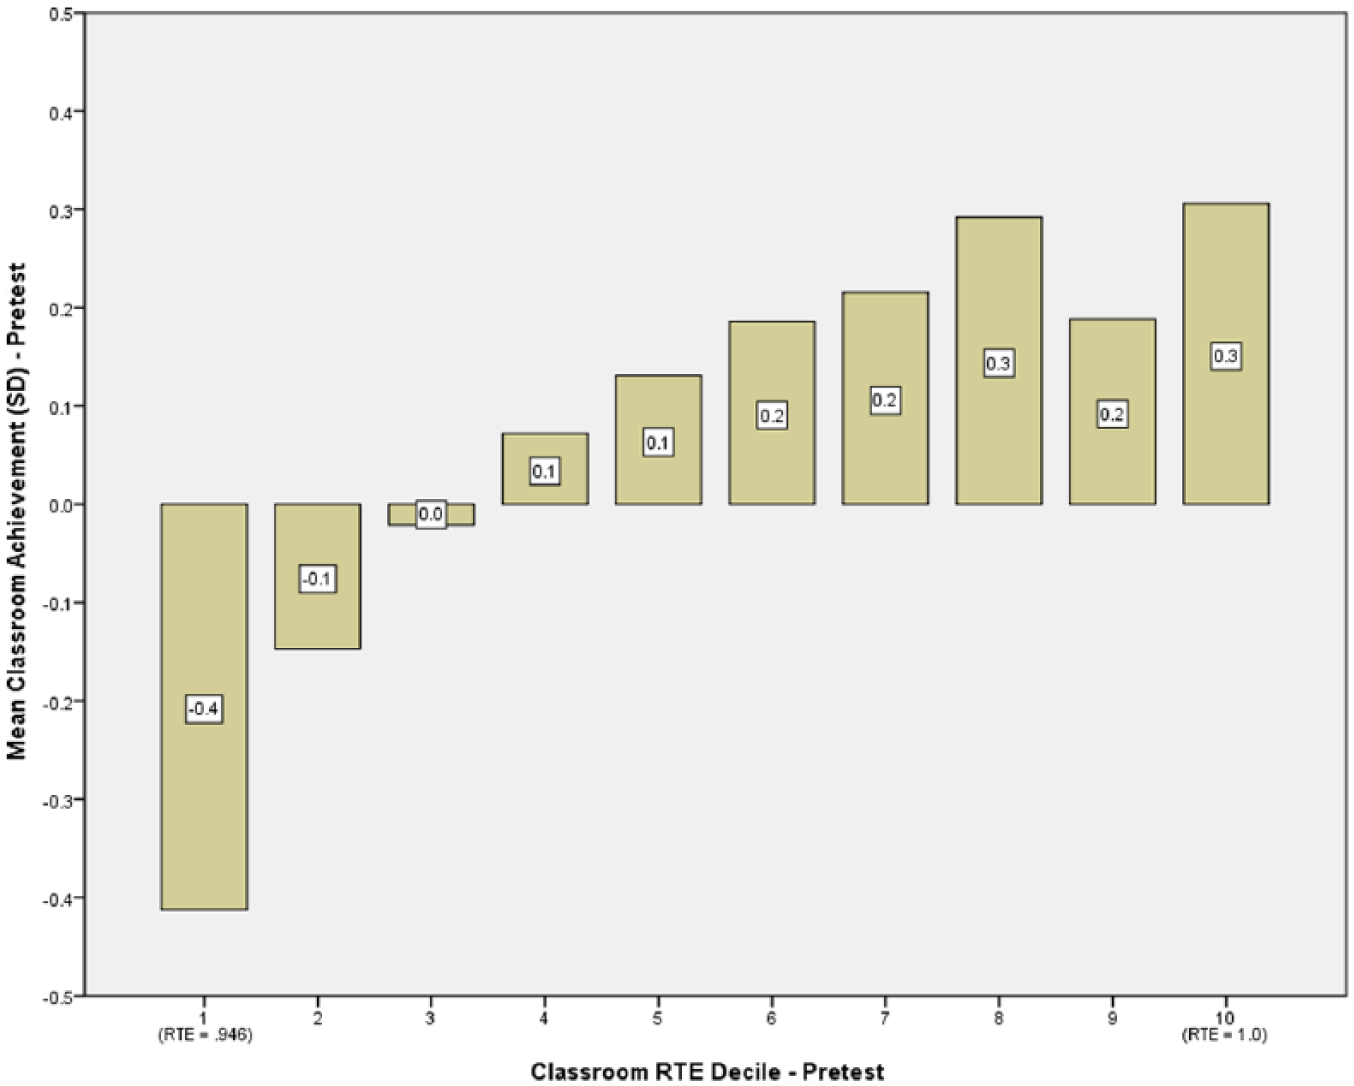
Relationship by RTE deciles between mean achievement and mean RTE at pretest.
Research Question 2: What Was the Effect of Rapid Guessing on VAM Estimates?
Given the differences we observed in the prevalence of rapid guessing across grades, subjects, and teachers, we next evaluated the extent to which rapid guessing influenced teacher value-added estimates. A comparison of VAM estimates between Model 1, our baseline VAM specification, and Model 2, where rapid guessing is controlled for at pretest, is shown in Table 4, with these results presented by subject, school level, and the number of pretest low-effort test events. These results show that even in the most extreme settings—reading results in middle school grades for teachers with four or more low-effort test events—there is minimal divergence in teacher VAM estimates. The average absolute difference between model estimates is .04 standard deviations, and only 2% of teachers had VAM estimates that differed by .25 standard deviations or more (with no teacher estimates differing by .50 standard deviations or more). A comparison of VAM estimates between Model 1 and Model 3 returned similar results (results not shown).
Comparison of Teacher-Level Value-Added Estimates by Subject, School Level, and Number of Low-Effort Tests at Pretest, Models 1–2
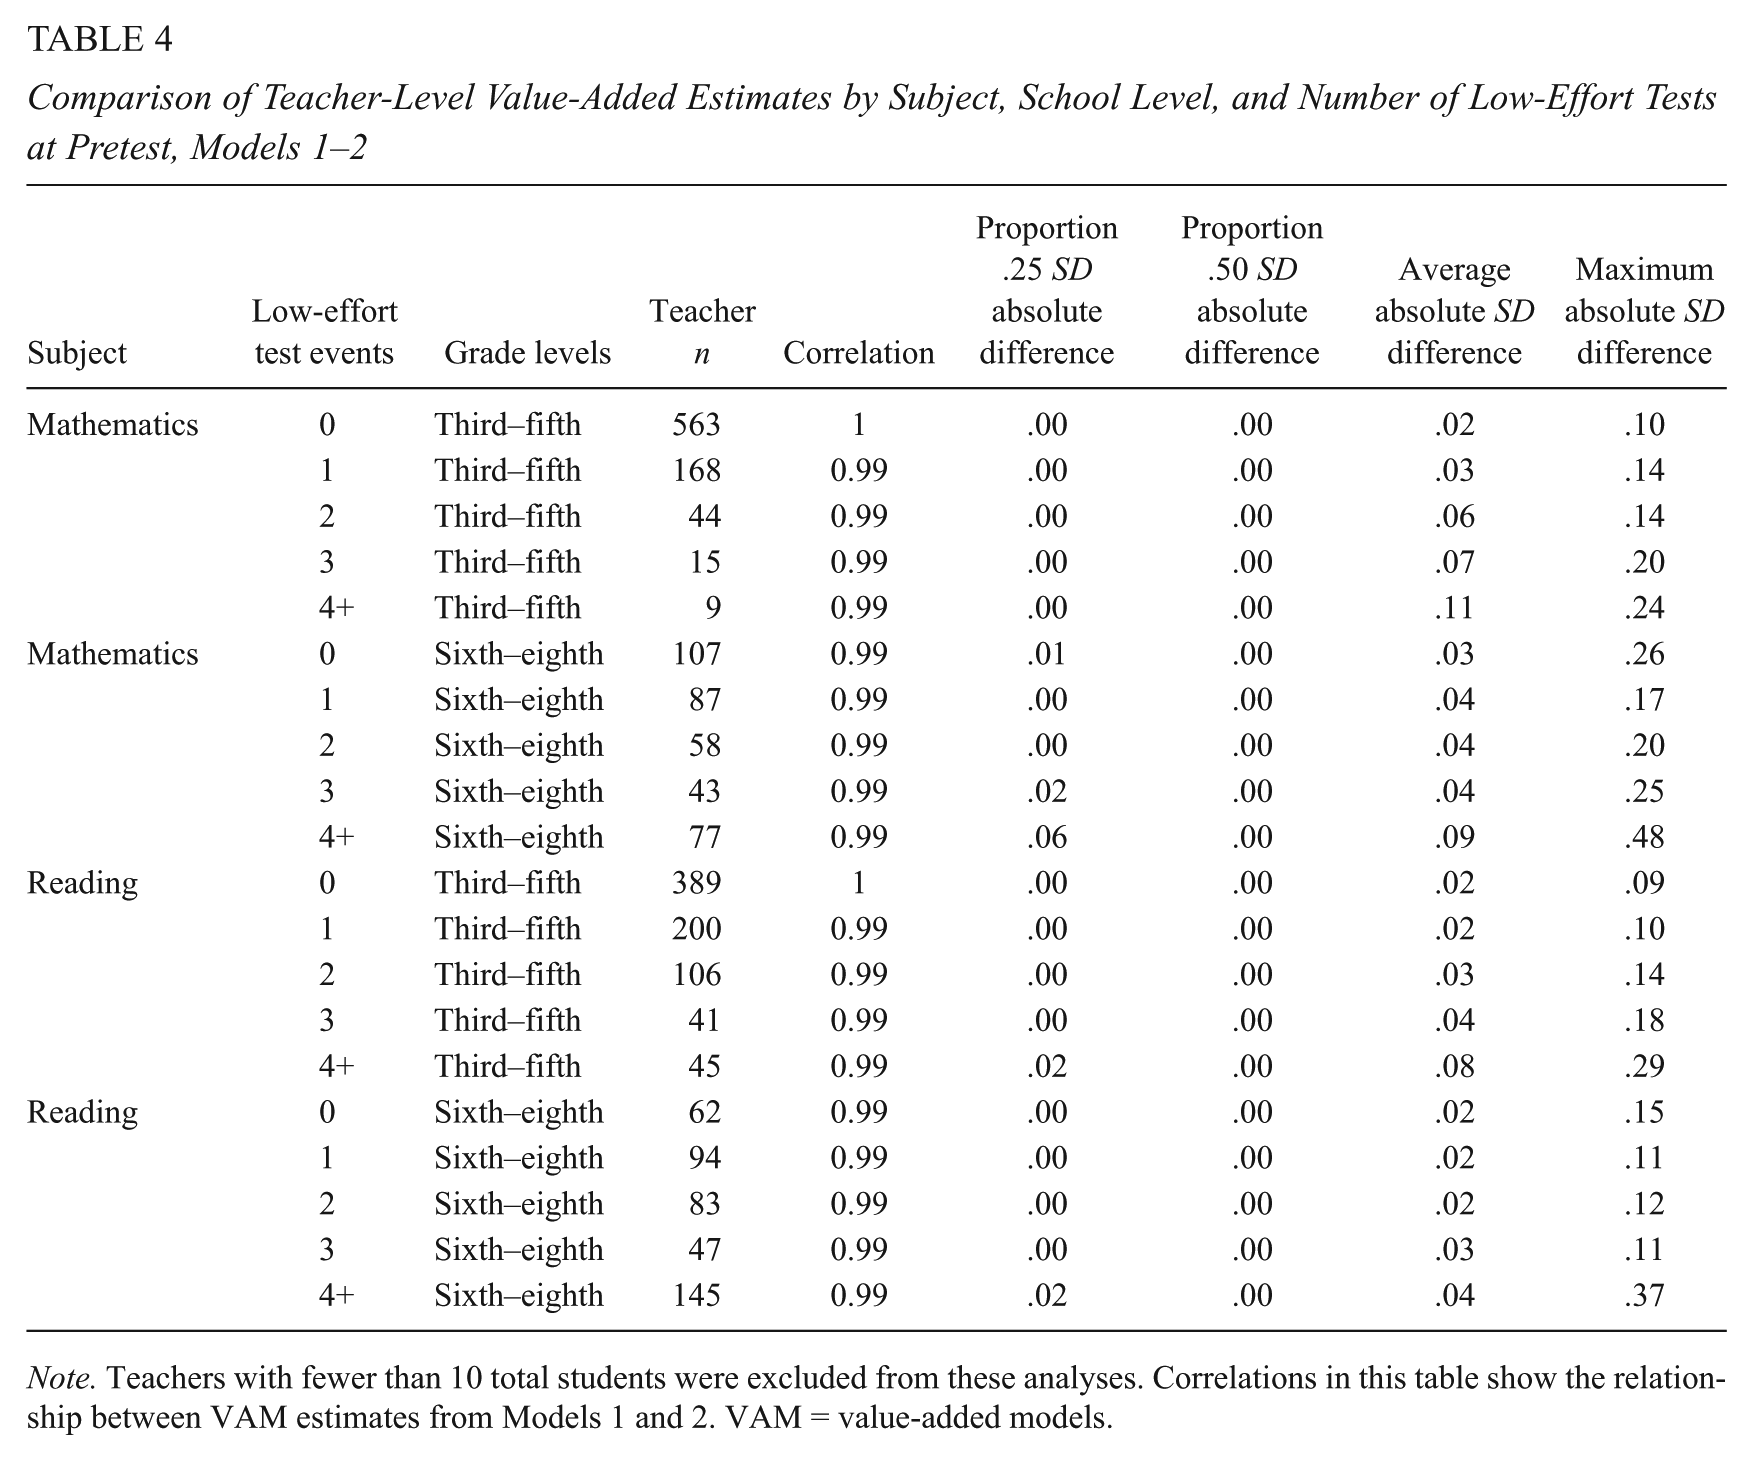
Note. Teachers with fewer than 10 total students were excluded from these analyses. Correlations in this table show the relationship between VAM estimates from Models 1 and 2. VAM = value-added models.
Not surprisingly, the minimal differences in VAM estimates resulted in little resorting of teachers across the performance distribution based on teacher rankings generated from Model 1 and Model 2 estimates. These results are presented in Table 5 and show that across grades and subjects, teacher rankings generated from Model 1 estimates are highly consistent with rankings from Model 2, including at the extremes of the performance distribution (i.e., top and bottom 5% of teachers). For nearly all teachers, the performance category in which they were ranked under the Model 1 condition was the same as their ranking under the Model 2 condition.
Changes to Rank Ordering of Teachers Based on Model 1 and Model 2 VAM Estimates
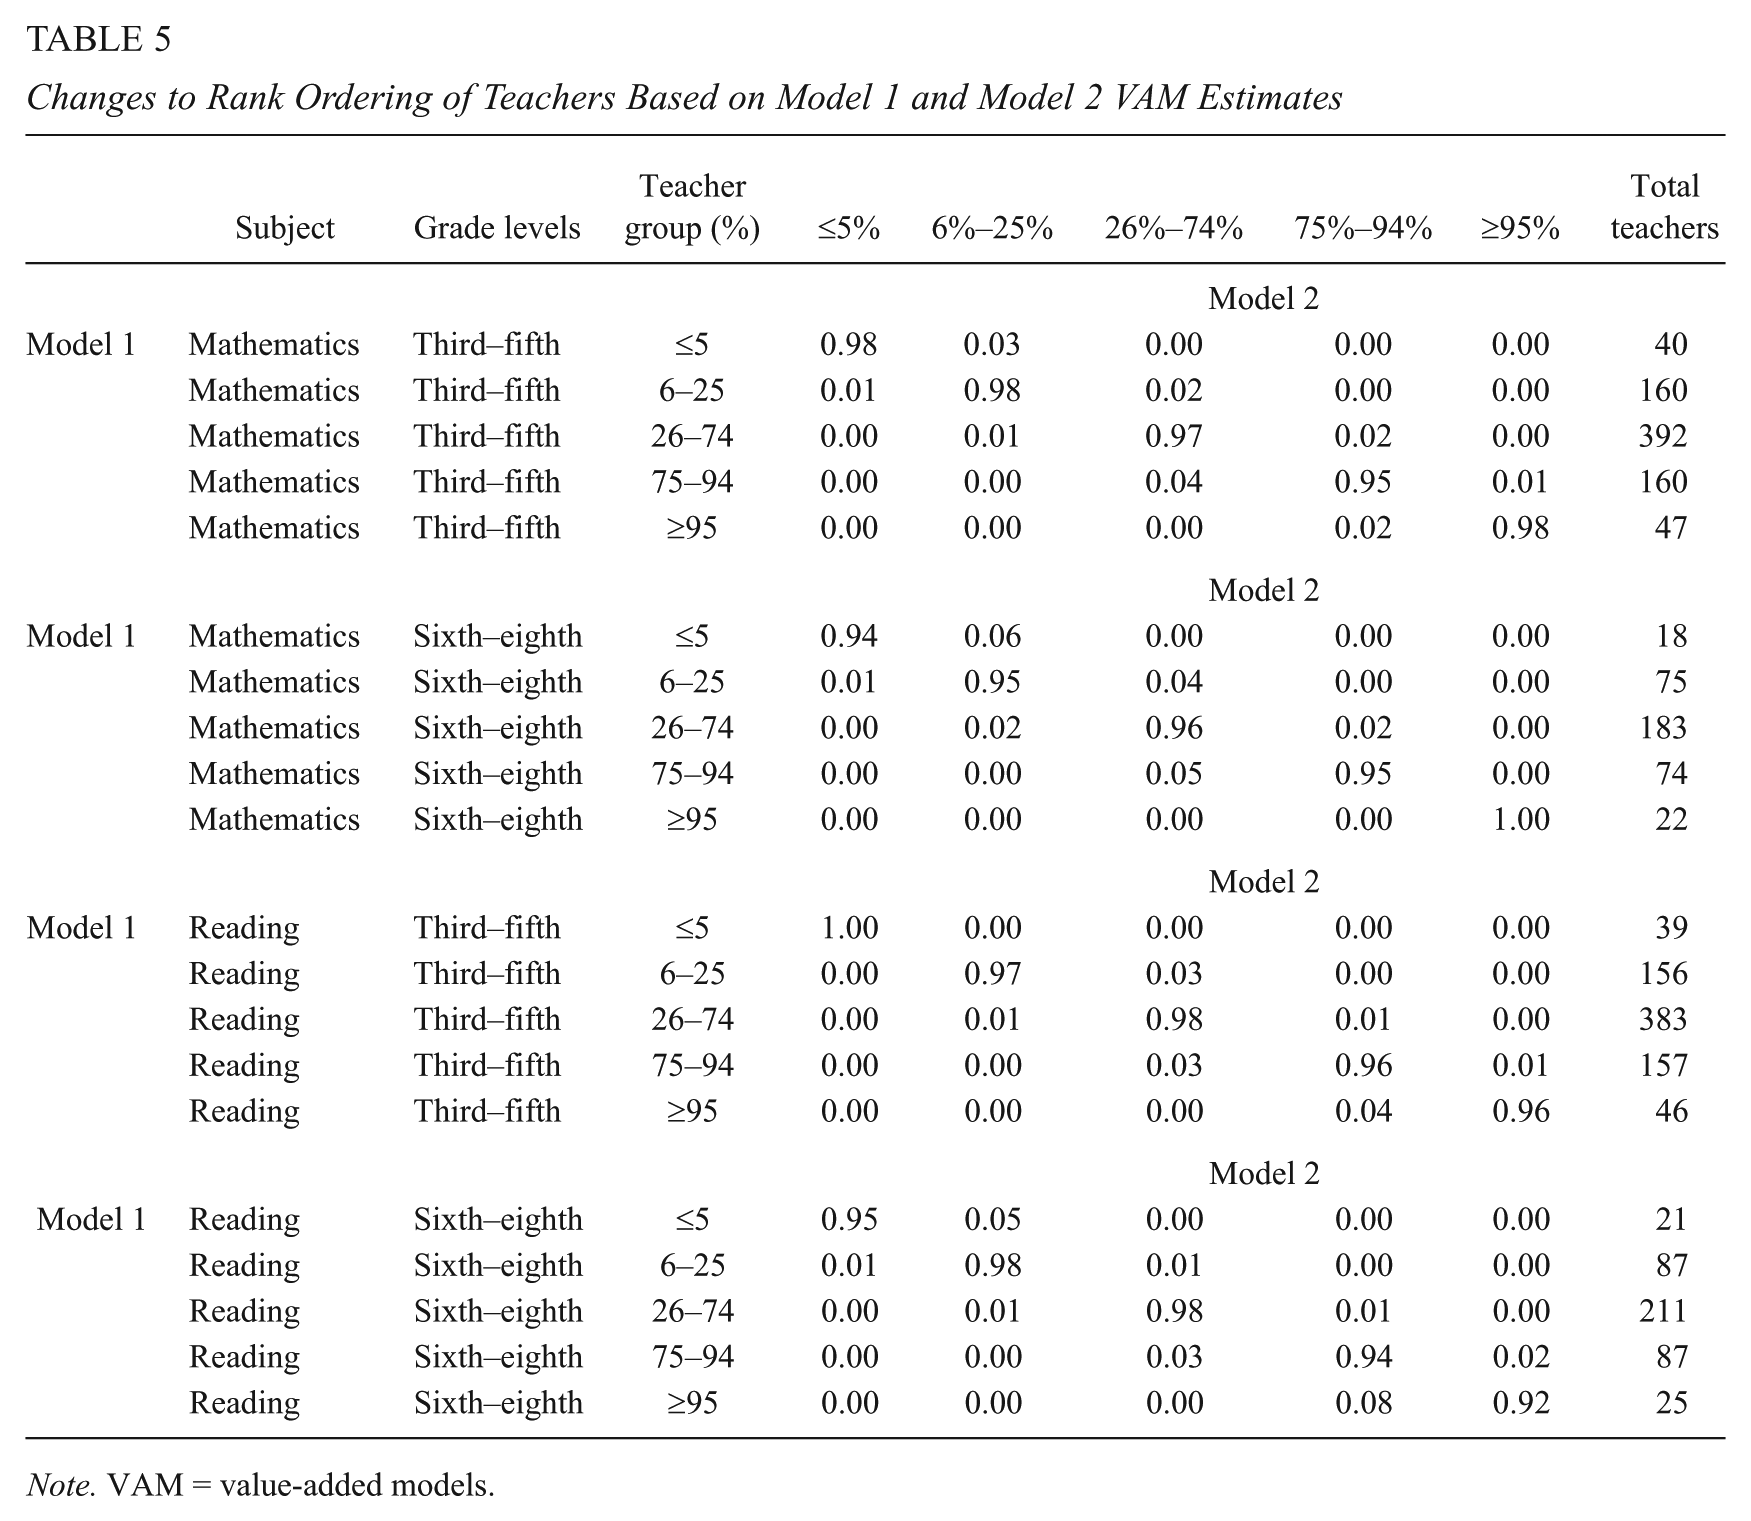
Note. VAM = value-added models.
We also examined the stability of rankings based on teacher VAM estimates by comparing Model 1 estimates with Model 3 estimates. Results from this comparison are shown in Table 6 and show similar trends to what was observed in the previous comparison: The relative ranking of teachers is not significantly affected for the majority of teachers across the performance distribution based on the use of these two different VAM estimates. There was a greater amount of resorting of middle school reading teachers at the high end of the performance distribution, with 20% of those teachers identified in the top 5% of teachers under Model 1 conditions shifting into the next lowest performance category under Model 3 conditions. These teachers had the highest amount of rapid guessing for their students at pretest, and therefore the highest percentage of pretest items dropped from student achievement estimates. The positive change in mean preachievement, as well as the noise introduced due to item-level sampling variability, likely both contributed to this downward shift in teacher rankings for teachers at the high extreme of the performance distribution. However, across both sets of comparisons, there are no instances of teacher rankings shifting more than one performance category in either direction.
Changes to Rank Ordering of Teachers Based on Model 1 and Model 3 VAM Estimates

Note. VAM = value-added models.
Discussion
The results from this study highlight two broad findings related to the prevalence of student rapid-guessing behavior on assessments, and how that behavior may affect estimates of teacher quality: First, using data that identified when students rapidly guessed on test items, we found that the prevalence of rapid guessing varied across grades and subject areas. Students in upper grades were more likely to rapidly guess compared with students in lower grades, and this behavior was more common in reading than in mathematics. At the extreme, 14% of seventh-grade students provided rapid guesses to 10% or more of the items on their posttest reading assessment. We also found that rapid guessing was not uniform across teachers, as there were some teachers with greater rapid-guessing rates compared with others.
However, our second finding is that the rapid guessing found in our sample did not appear to have a substantive influence on teacher value-added estimates. VAMs that accounted for rapid guessing in differing ways returned estimates highly similar to those generated from models that did not directly account for student rapid guessing. Estimates from effort-adjusted models also returned rank orderings of teachers consistent with rankings from baseline VAM estimates. While not shown in this article, we also generated teacher VAM estimates using controls for rapid-guessing behavior at both pre- and posttest (not using effort-moderated scores), and those results were also highly similar to the results presented in this article. Thus, these results suggest that under these VAM specifications, rapid guessing had minimal influence on teacher value-added estimates.
There are several plausible reasons for this that could be investigated in future research: First, VAMs, such as those used in this research, may already indirectly account for student rapid-guessing behavior. When students rapidly guess, there is a subsequent negative biasing effect on student achievement estimates. As most VAMs control for lagged student test scores, these models may already capture whatever component of rapid guessing is persistent.
The minimal impact on teacher VAM estimates may also be a function of rapid guessing not being extreme and clustered at a great enough level to have a meaningful effect. Even if students are nonrandomly assigned to teachers in ways correlated with test-taking effort, then there would need to be significant differences in rapid-guessing rates across teachers for this behavior to differentially influence VAM estimates. While we do observe variability in rapid guessing across teachers, our results show that the average overall rapid-guessing rates are still quite low even for those teachers with the most extreme occurrences of this behavior (see Figure 1). Thus, this behavior may not be great enough at the aggregate to substantively influence the stability of teacher VAM estimates, especially with VAMs that control for lagged student achievement.
One remaining and important question we did not examine in this study, but intend to address in future work, is if maintaining or improving student test-taking effort is something within a teacher’s direct control. That is, do differences in rapid-guessing rates reflect differences in the students assigned to these teachers? Or are these differences an explicit signal of teacher effectiveness? Regardless of the reason for why rapid guessing occurs, and where the responsibility lies in improving and maintaining student test-taking effort, it would be prudent for educators to actively monitor this student behavior. Given that rapid-guessing behavior can negatively bias student achievement and growth estimates, and countless educational decisions are made for students based on test results, this further reinforces the need for educators to attend to the test-taking effort of their students. School systems may also identify incentives that can be tied to these assessments, especially for those assessments with little or no stakes for students, so that students are further encouraged to try their best on achievement tests.
In summary, the results of this research should help mitigate potential concerns from educators and policymakers about how student rapid guessing may influence the validity of teacher value-added estimates. Our findings suggest that rapid guessing has minimal influence on VAM estimates, especially when models used account for lagged achievement. Further research can show if these findings are unique to the specific modeling approaches or measures of student test-taking effort used in this research and if rapid guessing differentially affects interpretations of teacher performance in school systems that do not use value-added modeling in their accountability framework.
Supplementary Material
EEPA759600_Appendix – Supplemental material for The Influence of Rapidly Guessed Item Responses on Teacher Value-Added Estimates: Implications for Policy and Practice
Supplemental material, EEPA759600_Appendix for The Influence of Rapidly Guessed Item Responses on Teacher Value-Added Estimates: Implications for Policy and Practice by Nate Jensen, Andrew Rice and James Soland in Educational Evaluation and Policy Analysis
Footnotes
Declaration of Conflicting Interests
The author(s) declared no potential conflicts of interest with respect to the research, authorship, and/or publication of this article.
Funding
The author(s) received no financial support for the research, authorship, and/or publication of this article.
Authors
NATE JENSEN, PhD, is a senior research scientist at NWEA. His primary research interests include teacher and school accountability, test motivation, best practices in the application and use of student testing data, and the relationship between attendance and student achievement growth.
ANDREW RICE, PhD, is the vice president of research and operations at education analytics. His primary research interests include school accountability models, assessment data, educator impact measurement, student growth measurement, human capital management metrics, and social-emotional learning metrics.
JAMES SOLAND, PhD, is a research scientist at NWEA. His research focuses on educational assessment, evaluation, and accountability. In particular, he explores how to measure social-emotional learning and test motivation, including how both influence estimates of teacher and school effectiveness.
References
Supplementary Material
Please find the following supplemental material available below.
For Open Access articles published under a Creative Commons License, all supplemental material carries the same license as the article it is associated with.
For non-Open Access articles published, all supplemental material carries a non-exclusive license, and permission requests for re-use of supplemental material or any part of supplemental material shall be sent directly to the copyright owner as specified in the copyright notice associated with the article.