
Abstract
Discipline reformers claim that suspensions negatively affect suspended students, while others suggest reforms have unintended consequences for peers. Using student panel data from the School District of Philadelphia, we implement student fixed effects and instrumental variable (IV) strategies to examine the consequences of suspensions for offending students and their peers. A suspension decreases math and reading achievement for suspended students. The effects are robust to IV estimates leveraging a district-wide policy change in suspension use. Suspensions are more salient for students who personally experience suspension than for their peers. Exposure to suspensions for more serious misconduct has very small, negative spillovers onto peer achievement, but does not change peer absences.
Introduction
Disciplinary consequences, such as suspension, are one tool teachers and administrators use to manage classrooms, respond to student misbehavior, and ensure that all students feel safe and are able to learn. Most agree that suspensions are necessary in the case of serious infractions, such as violent student misconduct. Still, many districts and schools regularly employ suspensions for less serious, nonviolent infractions, such as insubordination (Lacoe & Steinberg, 2018; Steinberg & Lacoe, 2017). Nationwide, insubordination has accounted for an increasing share of all serious disciplinary actions—that is, suspensions for five or more days, transfers to specialized schools, and expulsion—from 22% during the 1999–2000 school year to 43% in 2007–2008 (Steinberg & Lacoe, 2017). In California, nearly half of all suspensions issued during the 2011–2012 school year were for “willful defiance,” a category of student misconduct that includes failure to remove a hat, turn off a cell phone, or wear the school’s uniform (Watanabe, 2013).
Yet suspending students for less serious, nonviolent infractions may not address the cause of student misbehavior or provide teachers with tools or support to manage student behavior once the student returns to the classroom. Moreover, the academic and behavioral consequences of suspensions, particularly those for less serious student misconduct, are largely unknown. In this article, we address the following questions:
This paper extends existing literature by employing panel data to implement student fixed effects and instrumental variable (IV) strategies to bound the effect of suspensions on the outcomes of suspended students. While a true causal estimate is difficult to obtain without experimental conditions, we leverage detailed panel data on individual students to eliminate many sources of potential bias present in existing correlational estimates that typically rely on cross-school variation in suspension rates (Perry & Morris, 2014; Rausch & Skiba, 2005) or cross-sectional variation in student behavior and outcomes (Kinsler, 2013). The student fixed effects approach, which relies on within-student variation in the receipt of suspension, conditions on time-invariant student characteristics that may be correlated with both the likelihood of committing a behavioral infraction resulting in a suspension and student outcomes, including academic achievement.
We complement the student fixed effects approach with an IV strategy that relies on a districtwide policy change to the student code of conduct governing the consequences associated with specific behavioral infractions. Beginning in the 2012–2013 school year, the School District of Philadelphia (SDP) revised its student code of conduct and discipline policy, prohibiting suspension as a disciplinary option for two nonviolent behavioral infractions—failure to follow classroom rules/disruption and profane/obscene language or gestures (i.e., classroom disorder infractions). The change in the statutory penalties for these nonviolent infractions allows us to leverage policy-induced (as opposed to within-student) variation in the probability of receiving a suspension to further isolate the effect of out-of-school suspension on the outcomes of suspended students. The combination of the student fixed effects and IV approaches allows for identification of the effects of suspensions for nonviolent classroom disorder suspensions on student outcomes—a particularly understudied area in research on school discipline practices.
We find that the academic achievement of suspended students decreases following a suspension. Suspensions for nonviolent classroom disorder infractions, which are generally shorter in length, also decrease achievement. While we find little change, on average, in school attendance in the month after a suspension, absences increase in the month following a suspension for elementary grade students. These results are robust to estimation with student fixed effects and IV approaches. Once a student receives a suspension for classroom disorder, he or she is significantly more likely to receive another classroom disorder suspension in the subsequent school year. The strength of this relationship is tempered following the policy reform, suggesting that the reform played an important role in reducing the use of classroom disorder OSS. While suspension in one year is correlated with a higher probability of suspension in the subsequent year, the negative effect on test scores is concentrated in the year of the suspension. For peers who are not suspended, exposure to students within the same school and grade who are suspended for more serious misconduct is related to small declines in achievement, but no discernable change in school attendance.
The paper is organized as follows: The introductory sections summarize the existing literature and describe the data and sample. The next section discusses the empirical approach and describes the student fixed effects and IV strategies. Then, we present our results on the effect of suspensions on student outcomes, both for suspended and nonsuspended students. We conclude by discussing the policy implications of the study’s findings.
Related Literature
There are several hypotheses on how suspensions may affect student outcomes (Rausch & Skiba, 2005). First, suspended students receive less instructional time in the classroom, thereby decreasing their preparation for exams with negative consequences for their achievement. Second, suspended students may feel less engaged in school, leading to increased school absences. For grade-level peers who are not suspended, higher suspension rates may reflect greater disorder in schools and classrooms that ultimately disrupts the learning of all students. Alternatively, if removing disruptive students from the classroom via suspension improves the classroom or school environment and enables peers to engage in more productive learning, suspensions may positively affect the achievement of nonsuspended peers.
Consequences of Suspensions for Suspended Students
What do we know about the effects of out-of-school suspensions on students who are suspended? The existing literature is largely correlational and finds that suspensions are correlated with decreases in grades and performance on cognitive and standardized tests (Arcia, 2006; Davis & Jordan, 1994; Noltemeyer, Ward, & Mcloughlin, 2015; Rausch & Skiba, 2005). Among a sample of Black students in Grades 8 to 10, Davis and Jordan (1994) find negative correlations between the number of suspensions students received and subsequent levels of engagement in school and course grades. Rausch and Skiba (2005) use school-level data from public elementary and secondary schools in one state and find that the school suspension rate is negatively correlated with proficiency rates on state math and English language arts (ELA) examinations, after controlling for student characteristics. Arcia (2006) employs longitudinal student data and a matched comparison group design to estimate negative correlations between the length of suspension and postsuspension reading achievement. A meta-analysis by Noltemeyer et al. (2015) includes 34 studies examining the relationship between suspensions and achievement, and finds overall negative correlations between in-school and out-of-school suspensions and academic outcomes. In contrast, Kinsler (2013) finds that suspensions do not negatively affect the achievement of middle-school students after controlling for each student’s estimated risk of misbehavior. However, results from Kinsler (2013) rely on cross-sectional data and several assumptions about the degree of school-level control over discipline policies and student knowledge of discipline policies, calling into question the utility of the findings.
Not only are suspensions correlated with low academic achievement, but suspensions have also been shown to be correlated with more serious academic consequences, including grade retention and dropout. Marchbanks and colleagues (2014) examine seventh-grade students in Texas over a 3-year period and find increases in the probability of grade retention following both in-school and out-of-school suspensions. It follows that suspensions are correlated with a lower likelihood of high school completion (Balfanz, Byrnes, & Fox, 2015; Marchbanks et al., 2014; Noltemeyer et al., 2015; Rumberger & Losen, 2016). Analyzing longitudinal data for a cohort of ninth-grade students in Florida, Balfanz and colleagues (2015) find that each additional suspension is related to a 20% decrease in the odds of high school graduation, controlling for observable student characteristics. Rumberger and Losen (2016) match suspended and nonsuspended students in Florida on observable characteristics and find that suspensions are correlated with an increased risk of school dropout.
Suspensions may influence student outcomes beyond elementary and secondary school. Cobb-Clark, Kassenboehmer, Le, McVicar, and Zhang (2015) find that suspension is associated with lower university entrance scores among students in Australia. However, when the authors apply a sensitivity test used by Altonji, Elder, and Taber (2005) to measure the extent to which selection bias is present in the results, they find that the results are likely driven by unobservable differences across students, limiting their ability to draw a causal relationship between suspensions and university entrance exams. Balfanz and colleagues (2015) estimate negative associations between suspensions and postsecondary enrollment and completion. Beyond these associations with educational attainment, suspension is associated with an increased likelihood of other negative life outcomes including adult criminal victimization, criminal involvement, and incarceration (Wolf & Kupchik, 2017).
Although existing evidence suggests there are negative relationships between suspensions and educational achievement, attainment, and other important life outcomes, none of the existing studies isolates the causal effect of suspensions, and the identified associations may be driven by unobserved differences between students who are suspended compared with those who are not. These unobserved differences may stem from responses to school-level factors related to poor achievement and attendance, such as school disorder or violence (Chen & Weikart, 2008), or individual characteristics that might affect student behavior and outcomes, such as parental involvement (Houtenville & Conway, 2008), poverty (Chen, 2007), or other stressors at home (Sharkey, Tirado-Strayer, Papachristos, & Raver, 2012). Although the present study faces similar identification challenges inherent in observational (as opposed to experimental) settings, we improve on existing studies by employing two estimation strategies that leverage student-level panel data and multiple robustness tests of the central findings, while also explicitly modeling the magnitude of the potential bias implicit in our quasi-experimental estimators.
Spillovers Onto Peers
The influence of suspensions on student outcomes may not be limited to suspended students alone. Schools and classrooms are inherently social spaces, and misbehavior occurring in the school or classroom setting is likely to affect the students directly involved in the incident, as well as their peers. A growing body of literature addresses how school disorder, misbehavior, and discipline influence the well-being and achievement of school peers. Models of peer influence suggest that exposure to misbehaving youth has a lasting influence on the outcomes of other students (Deming, 2011). Leveraging natural experiments generated by hurricanes in the southeast United States, Imberman, Kugler, and Sacerdote (2012) find that exposure to students with discipline problems who were forced to evacuate to new school districts increased disciplinary problems and absenteeism among local students. The influence of peers may be particularly strong in middle school: Using the results of a lottery-based school selection mechanism, Deming (2011) finds that enrollment in a preferred school reduces crimes committed by students up to 7 years following assignment, and the gains among middle-school students are primarily due to less exposure to “crime-prone” peers. Another study finds that the level of minor infractions committed by middle-school peers, including rowdiness, disruptive behavior, and rule violations, is related to decreases in math test scores (Kinsler, 2013). Focusing on discipline, one study finds that greater school-level use of exclusionary discipline, such as suspension, is associated with declines in the achievement of nonsuspended students (Perry & Morris, 2014). Other studies show that in schools with higher suspension rates, students report lower levels of safety (Lacoe, 2015; Steinberg, Allensworth, & Johnson, 2011), and teachers report more crime and disorder (Steinberg et al., 2011).
This article advances the existing literature in several critical areas. First, we provide estimates of the effect of suspensions on student achievement and attendance using individual-level panel data on students from a large urban school district and an IV strategy that leverages a district-wide change in discipline policy. Doing so allows us to eliminate many sources of bias—those due to unobservable student-level heterogeneity—that plague existing estimates of suspensions on student outcomes. Second, we estimate effects for suspensions due to any type of infraction, and for suspensions for nonviolent, classroom disorder offenses. Understanding how suspensions for nonviolent student infractions affect outcomes is particularly relevant given that the concentration of suspensions for nonviolent misconduct has increased over the last two decades (Steinberg & Lacoe, 2017). Yet there is little empirical evidence on the effect of suspensions for minor infractions and student outcomes. Finally, we examine whether exposure to classroom misbehavior (that results in a suspension) influences nonsuspended peers, enriching the literature on educational spillovers.
Data and Sample
We employ longitudinal, student-level administrative data for students in Grades 3 to 12 attending a traditional (i.e., noncharter) SDP public school in any year during the 2011–2012 and 2013–2014 school years. Although we do not observe data for charter school students, charter schools have their own discipline policies and are not subject to SDP’s student code of conduct. The data contain detailed information on student demographics (age, race/ethnicity, and gender), enrollment, attendance, discipline records, scores on state achievement tests, free or reduced-price lunch (FRPL) status, disability (special education) status, and English language learner (ELL) status.
Student enrollment data include unique student and school identifiers, which allow us to follow students across schools and years. Student discipline data are at the Student × Infraction level, so that we observe each behavioral infraction a student commits that corresponds to an out-of-school suspension (OSS). For each OSS, we observe the length of the suspension in days, the behavioral reason for the out-of-school suspension, and the corresponding SDP code of student conduct rule number associated with the infraction. Our measures of student achievement are scaled scores and proficiency levels for math and ELA from the Pennsylvania System of School Assessment (PSSA) and are available for all students in Grades 3 through 8. In all analyses of student achievement, we standardize the scaled scores at the Subject × Grade × Year level. Data on attendance include measures of the total number of days enrolled and the total number of excused and unexcused absences. School days missed due to school absence for any reason, excused or unexcused, are exclusive of school days missed due to OSS.
Table 1 summarizes the demographic characteristics, achievement, and absences of all students in Grades 3 to 12 during the 2011–2012 school year. The SDP serves a largely minority and economically disadvantaged student population: 76% of students are Black or Hispanic, and 65% receive FRPL. A disproportionate share of students who received any OSS were Black (73%, compared with 57% districtwide), economically disadvantaged (73%, compared with 65% districtwide), and enrolled in special education services (23%, compared with 16% districtwide). These patterns of disproportionality have been documented extensively at the state and national levels (Balfanz et al., 2015; Rumberger & Losen, 2016; Steinberg & Lacoe, 2017). The demographic characteristics of students in Philadelphia who received at least one OSS for low-level, classroom disorder infractions are nearly identical to students receiving OSS for any disciplinary infraction.
Student Demographics, Achievement, and Absences
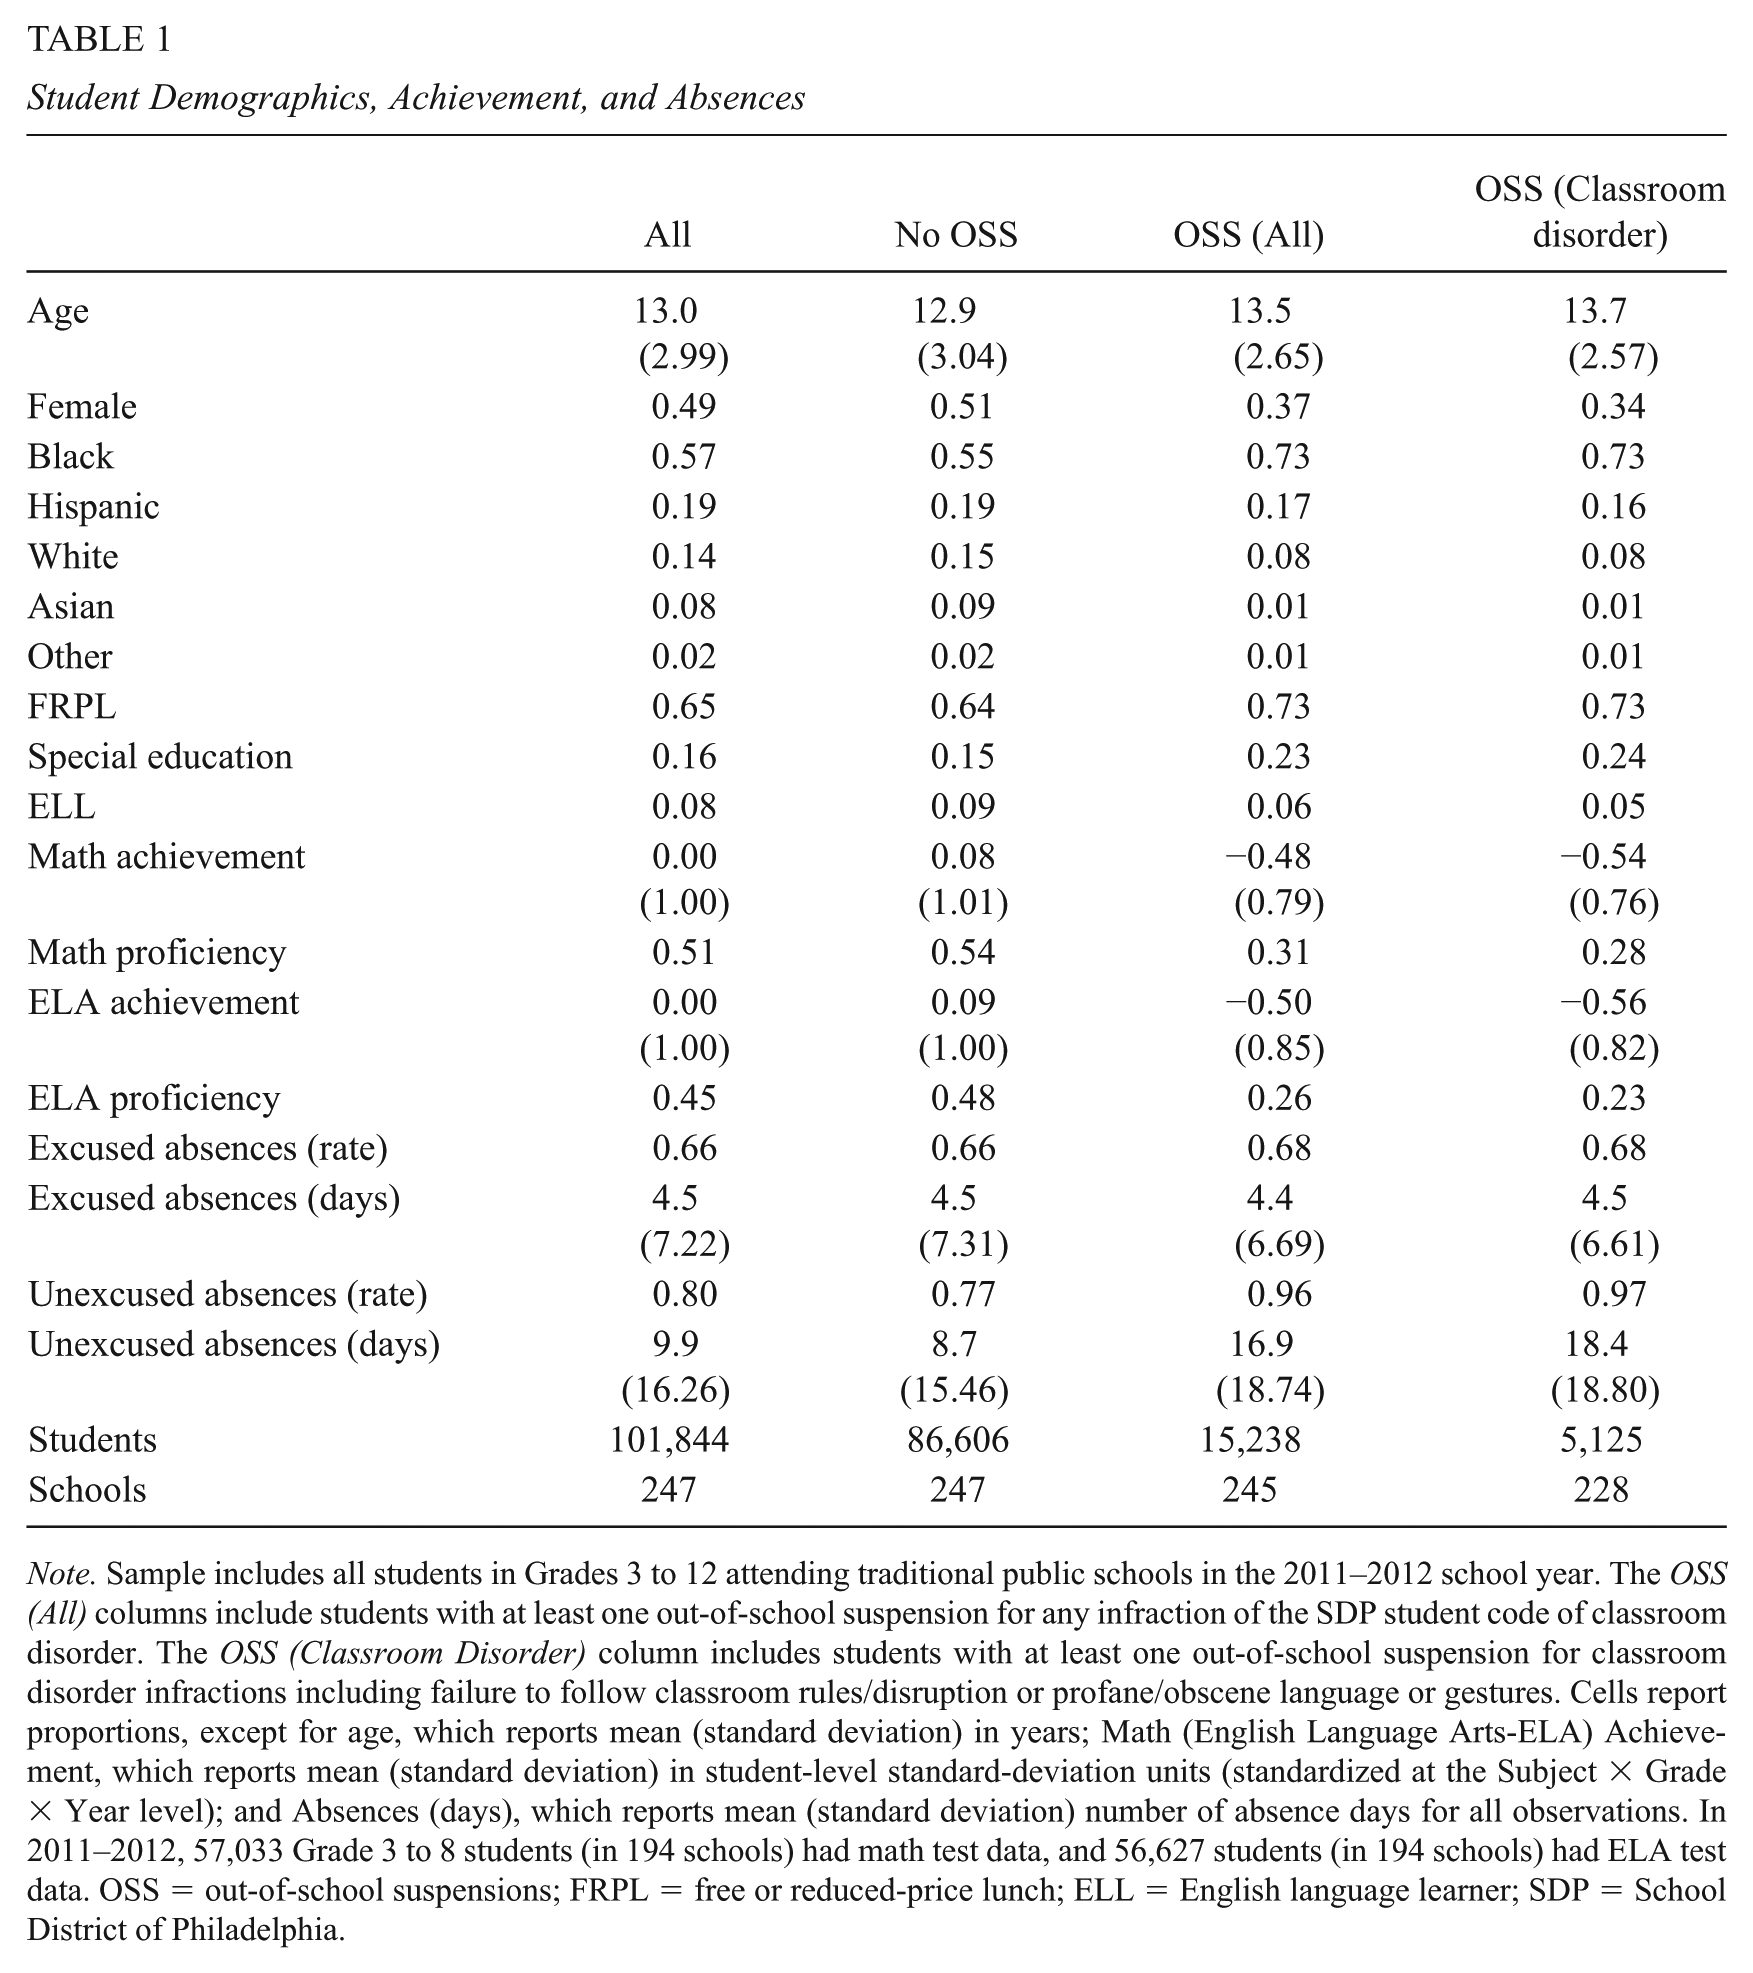
Note. Sample includes all students in Grades 3 to 12 attending traditional public schools in the 2011–2012 school year. The OSS (All) columns include students with at least one out-of-school suspension for any infraction of the SDP student code of classroom disorder. The OSS (Classroom Disorder) column includes students with at least one out-of-school suspension for classroom disorder infractions including failure to follow classroom rules/disruption or profane/obscene language or gestures. Cells report proportions, except for age, which reports mean (standard deviation) in years; Math (English Language Arts-ELA) Achievement, which reports mean (standard deviation) in student-level standard-deviation units (standardized at the Subject × Grade × Year level); and Absences (days), which reports mean (standard deviation) number of absence days for all observations. In 2011–2012, 57,033 Grade 3 to 8 students (in 194 schools) had math test data, and 56,627 students (in 194 schools) had ELA test data. OSS = out-of-school suspensions; FRPL = free or reduced-price lunch; ELL = English language learner; SDP = School District of Philadelphia.
Among SDP students in tested grades and subjects (Grades 3–8), 51% were academically proficient (based on Pennsylvania state standards) in math, and 45% were academically proficient in ELA in the 2011–2012 school year. Two-thirds of all Grade 3 to 12 students had at least one excused absence (with an average of 4.5 excused absence days), while 80% had at least one unexcused absence (with an average of 9.9 unexcused absence days). Students receiving at least one OSS for any disciplinary infraction were much lower-achieving and were absent from school for unexcused reasons much more frequently. Specifically, 31% of students in receipt of any OSS were academically proficient in math, while only 26% were academically proficient in ELA. While the rate (and average days) of excused absences varies little by receipt of OSS, 96% of students with at least one OSS were absent at least once for unexcused reasons, with, on average, 16.9 unexcused absence days. The substantive difference in unexcused absences between students who did and did not receive an OSS is notable, given prior evidence that unexcused absences are associated with lower educational attainment and delinquent behavior in youth (Baker, Sigmon, & Nugent, 2001). The patterns of achievement and unexcused absences among students who received at least one OSS for low-level, classroom disorder infractions are again nearly identical to students receiving OSS for any disciplinary infraction.
Empirical Strategy
We employ two complementary approaches to estimate the magnitude of the effect of suspension—both for any infraction and for less serious, classroom disorder infractions—on student outcomes. First, we describe the student-fixed effects approach; then, we describe the IV approach. We apply both approaches to our analyses of the effects of suspension on the achievement and absences of suspended students. We then present and describe our approach for estimating the potential spillovers of suspensions onto suspended students’ grade-level peers.
Estimating the Effect of Suspension on Achievement
We begin by estimating variants of the following student-level fixed effects model:
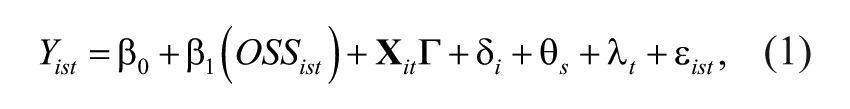
where Yist is a measure of academic achievement for student i in school s during school year t. The variable OSS equals one if student i received at least one out-of-school suspension for any disciplinary infraction in year t, and zero otherwise. To assess whether receipt of a suspension for low-level misconduct affects a student’s academic achievement, we replace OSS with OSS
Disorder
, which equals one if student i received at least one out-of-school suspension for either failure to follow classroom rules, classroom disruption or profane and obscene language or gestures in year t, and zero otherwise; and OSS
Other
, which equals one if student i received at least one OSS for any other type of infraction (i.e., any infraction other than failure to follow classroom rules/disruption and profane/obscene language or gestures) and no classroom disorder OSS during year t, and zero otherwise.
1
In Equation 1, the coefficient of interest is β1, which estimates whether being suspended for any type of infraction affects student achievement. In alternative specifications where OSS is replaced with OSS Disorder and OSS Other , β1 will estimate whether being suspended for low-level misconduct violations—failure to follow classroom rules/disruption or profane/obscene language or gestures—affects student outcomes, relative to students who were not suspended during the same school year. The inclusion of student fixed effects identifies the effect of suspensions on student outcomes for students whose suspension status changes over time. We consider both the extensive margin of suspension—the receipt of at least one out-of-school suspension—and the intensive margin of suspension—total days of out-of-school suspension. We estimate models based on the full Grade 3 to 12 sample and by grade span, given significant variation in the prevalence of suspensions (in terms of both the extensive and intensive margins) between elementary, middle, and high school students (see Table 2). In the fixed effect models, we do not aim to disentangle the effect of the suspension from the effect of the underlying misbehavior. Because we do not observe any misbehavior that does not lead to a suspension, we cannot definitively attribute changes in outcomes to the suspension event itself. Below, we present several robustness tests to assess the sensitivity of the results to multiple samples and controls.
Pre-Reform OSS, by Grade Level

Note. Sample includes students attending traditional public schools in the 2011–2012 school year. In Panel A, All OSS includes out-of-school suspensions for any infraction of the SDP student code of conduct. In Panel B, Classroom Disorder OSS includes out-of-school suspensions for infractions including failure to follow classroom rules/disruption or profane/obscene language or gestures. OSS Rate is reported in proportions; for OSS Days and Times, mean (standard deviation) is reported. OSS = out-of-school suspensions; SDP = School District of Philadelphia.
Estimating the Effect of Suspension on Absences
Relying on annual estimates of OSS and school absences may lead us to attribute changes in absences to suspensions that occurred subsequent to a school absence. Since chronic absences can lead to disciplinary consequences that include suspension, models that rely on annual counts could reveal positive effects of suspensions on absences, when in fact the causal direction may be, in part, the reverse. To ensure temporal precedence, we utilize monthly observations of OSS and absences, and estimate the effect of OSS in a given month on student absences occurring in the following month. We modify Equation 1 as follows:
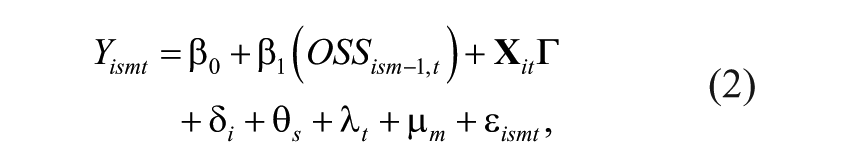
where m indicates the month and t indicates the year. In Equation 2, absences in month m are a function of OSS in the previous month (m − 1), in addition to time-varying student characteristics (
This student fixed effects approach controls for all time-invariant characteristics of individual students that likely lead to differences in both students’ probabilities of suspension and their outcomes. These individual characteristics may include personality traits such as self-esteem and aggression, interpersonal communication skills, or classroom behaviors (Segal, 2008). By controlling for these individual characteristics, we mitigate (though, do not eliminate) concern that nonrandom selection into suspension status biases estimates of the effect of suspension on student outcomes. Furthermore, the inclusion of school, year, and month fixed effects minimize concern that unobserved differences in schools—such as the propensity to suspend students—or district-wide shocks during a certain year (or month) are driving the results.
Nonetheless, since the student fixed effects approach relies on within-student variation in suspension status, this variation may be related to time-varying unobserved shocks correlated with both a student’s behavior and his or her outcomes (including academic achievement and school attendance). Moreover, since we do not observe a student’s behavior (apart from his or her suspension status), within-student variation in suspension status may be due to unobserved changes in student behavior over time. We provide complementary estimates that rely on policy-induced variation in the probability of suspension and which assume homogeneity of within-student behavioral patterns; doing so allows for an upper-bound on the magnitude of the effect of suspensions on student outcomes. We describe this approach in the following.
IV Strategy
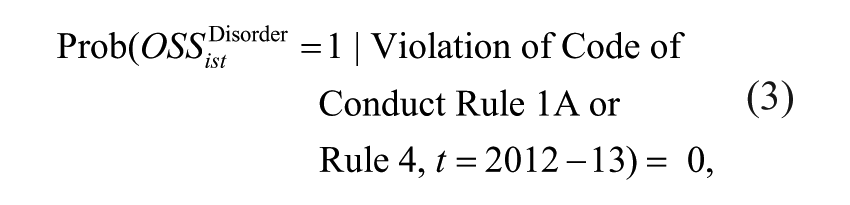
The SDP’s 2012–2013 student code of conduct reform aimed to eliminate suspensions for low-level misconduct. Specifically, the 2012–2013 reform changed the statutory penalties for two specific types of student misconduct—failure to follow classroom rules/disruption or profane/obscene language or gestures. In the pre-policy school year, students who committed either of these two infractions were subject to 1 to 3 days of out-of-school suspension; however, the code of conduct reform prohibited out-of-school suspensions for these infractions beginning in the 2012–2013 year. As such, the policy reform should affect the probability that an OSS is given (and, by extension, days of OSS received) for either of these two disciplinary infractions. Therefore, under full compliance with the revised student code of conduct, we have the following conditional probability:
where
In the postpolicy period, suspensions for these classroom disorder infractions accounted for a nonzero share of out-of-school suspensions, though at significantly lower rates than in the pre-policy period. In the 2011–2012 school year, 5% of all Grade 3 to 12 students were suspended for either classroom disruption or profanity; in the first postpolicy year (2012–2013), this rate declined by nearly half, to 2.7% (see Figure 1).
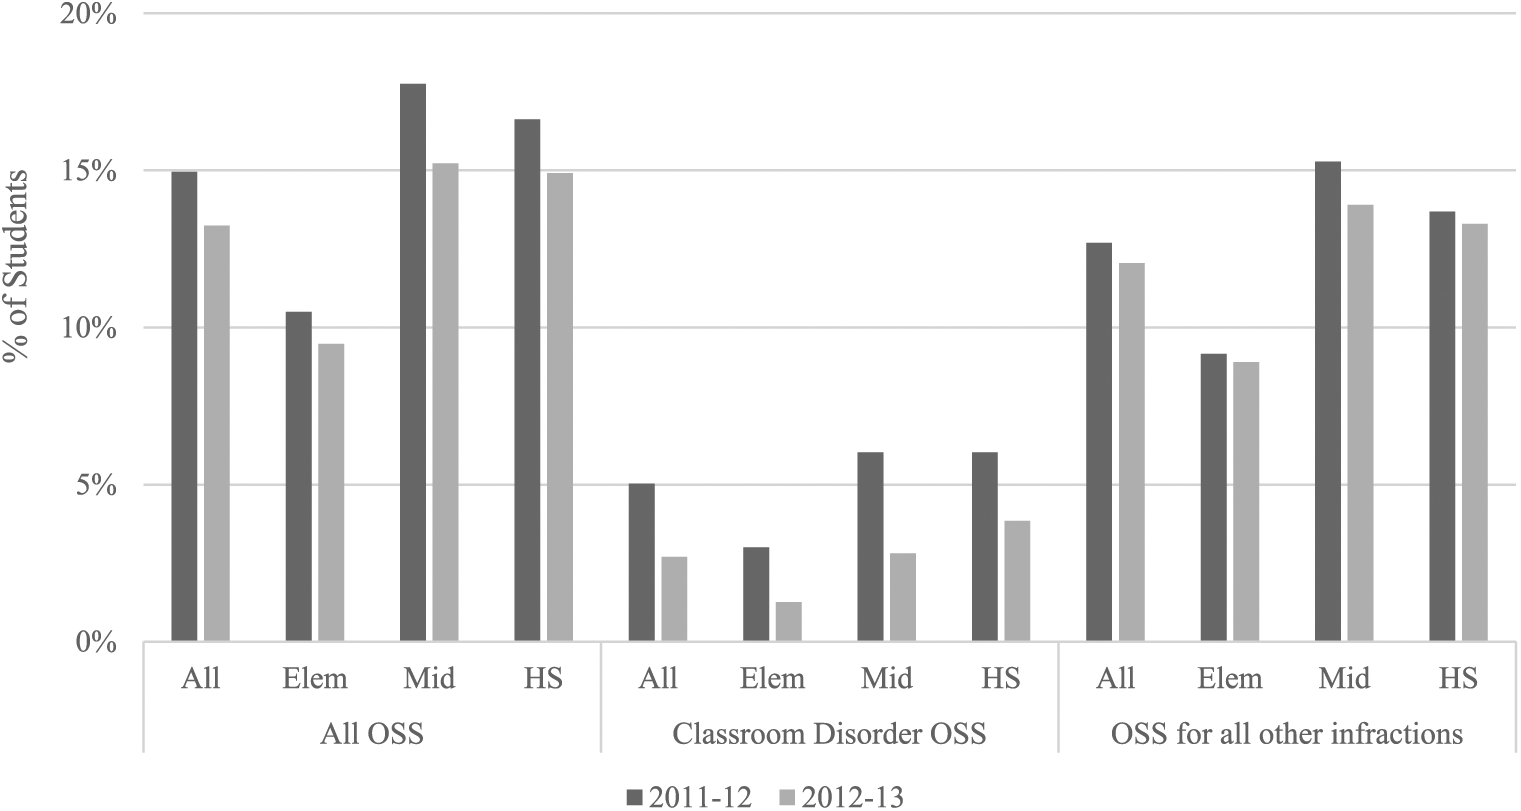
Prevalence of OSS in Philadelphia, by grade level and infraction type.
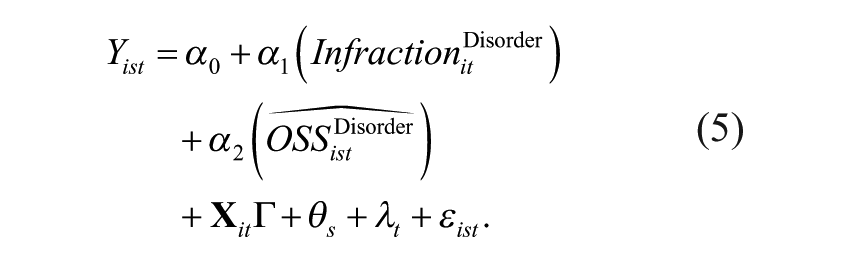
This policy-induced decline in the probability of receiving OSS for low-level classroom disorder infractions motivates the following IV strategy. Specifically, we employ a two-stage least squares (2SLS) approach to estimate the effect of low-level misconduct suspensions on student outcomes. The first stage equation is specified as
where
Notably, we only observe student misconduct related to either a student’s failure to follow classroom rules/disruption or profane/obscene language or gestures if a student receives an out-of-school suspension for these classroom disorder infractions. Specifically, any disciplinary infraction not associated with a disciplinary response (i.e., an out-of-school suspension) remains unobserved in the data. To address this missing data problem, we assume that any student suspended for classroom disorder infractions in the pre-policy year (2011–2012) but who did not receive a classroom disorder suspension in the postpolicy year (2012–2013) committed at least one classroom disorder infraction in the postpolicy period. We, therefore, set
To examine this assumption, we estimate the relationship between prior classroom disorder OSS and future classroom disorder OSS in the pre-policy period. 4 We find that the probability of receiving a classroom disorder OSS in the pre-policy period, conditional on receiving a classroom disorder OSS in the prior year, increases, on average, by 0.16 to 0.17 percentage points, or more than three times the base probability (5.5%) of receiving a classroom disorder OSS in the pre-policy period (see Online Appendix Table A). This provides evidence that, in the pre-policy years, students who committed a prior-year classroom disorder infraction were significantly more likely to commit a classroom disorder infraction in the current year. In contrast, the association between prior and subsequent classroom disorder OSS in the postpolicy period is approximately half the magnitude—a difference of 0.06 to 0.08 percentage points, relative to the pre-policy period—of the association between prior and subsequent classroom disorder OSS in the pre-policy period. This provides further evidence that the policy reform drove changes in the likelihood of receiving a classroom disorder OSS, conditional on receiving a classroom disorder OSS in the prior year.
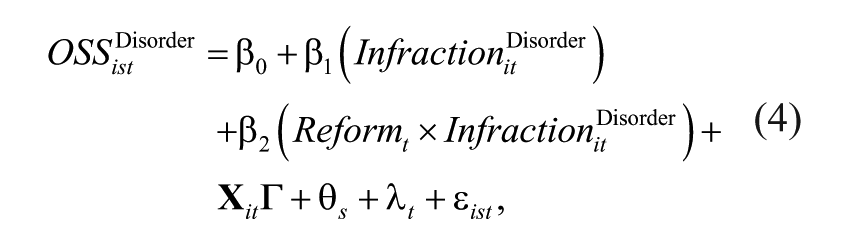
The second-stage outcome equation is specified as
In Equation 5,
Estimating the Influence of Exposure to Suspensions on Peer Outcomes
Students who are suspended for classroom disorder infractions may not be the only ones affected by such disciplinary practices. There is a rich literature on peer effects in education that provides evidence of educational spillover effects of domestic violence (Carrell & Hoekstra, 2010), chronic absences (Gottfried, 2014, 2015), and neighborhood violence (Burdick-Will, 2016; Sharkey, Schwartz, Ellen, & Lacoe, 2014). At the school level, the share of students suspended is correlated with the level of safety and disorder as perceived by students and their teachers (Lacoe, 2015; Steinberg et al., 2011). For students who are not engaging in misconduct (and, subsequently not receiving suspensions), exposure to school disorder may adversely affect their own academic and behavioral outcomes.
We expect exposure to student misbehavior, which is operationalized by exposure to suspensions, to be more salient for peers at the classroom level than at the school level. Descriptive evidence suggests that lower-level classroom disorder, such as the type of behavior that may lead to a classroom disorder OSS, is related to increased student fear and decreased student safety (Akiba, 2008; Mijanovich & Weitzman, 2003). Feeling unsafe in the classroom has a larger, independent association with student achievement than feeling unsafe in other parts of the school (Lacoe, 2016). Based on prior literature highlighting the importance of classroom-level experiences, we measure exposure to student misbehavior at the grade level to generate the closest possible approximation to the classroom environment. To investigate how exposure to misbehavior influences peers—students who were not suspended in a given school year—we estimate variants of the following student fixed effect model:

where Yisgt is an outcome (achievement, absences) for nonsuspended student i in school s and grade g during school year t. The variable
Students may respond differently to exposure to predominately serious, violent incidents at school compared with less serious, classroom disorder offenses. For example, schools with identical OSS rates may differ in the composition of OSS (i.e., the relative mix of OSS for minor and more serious infractions). Because the consequences of exposure to school disorder may depend in part on the type of infractions for which suspensions are meted out, we account for the rate of suspensions due to classroom disorder infractions. We include
Results
Effects of Suspension on Achievement
We find consistent evidence that being suspended decreases student’s academic achievement on both math and ELA standardized tests. Table 3 presents estimates of the effect of being suspended for any infraction (All OSS) and for classroom disorder infractions (Classroom Disorder OSS) on two outcomes: math and ELA test scores. The student fixed effects estimates (presented in the odd numbered columns) control for individual differences in ability or preparation between students who are suspended compared with students who are not. These models provide estimates of the effect of a suspension on a student’s performance relative to years when the same student was not suspended. The student fixed effect estimates show a negative effect of being suspended for any infraction on both math and ELA achievement for all students (a decrease of 0.05 standard deviations in math scores, and a decrease of 0.04 standard deviations in ELA scores). These declines in test scores translate into a lower probability of passing the state accountability math exam (Online Appendix Table B). The results by grade span are consistent in sign and magnitude as the results for all students: Among students in the elementary and middle grades, being suspended for any infraction decreases both math and ELA scores by 0.04 standard deviations (Table 3, Panels B and C).
Effect of Suspension on Student Achievement
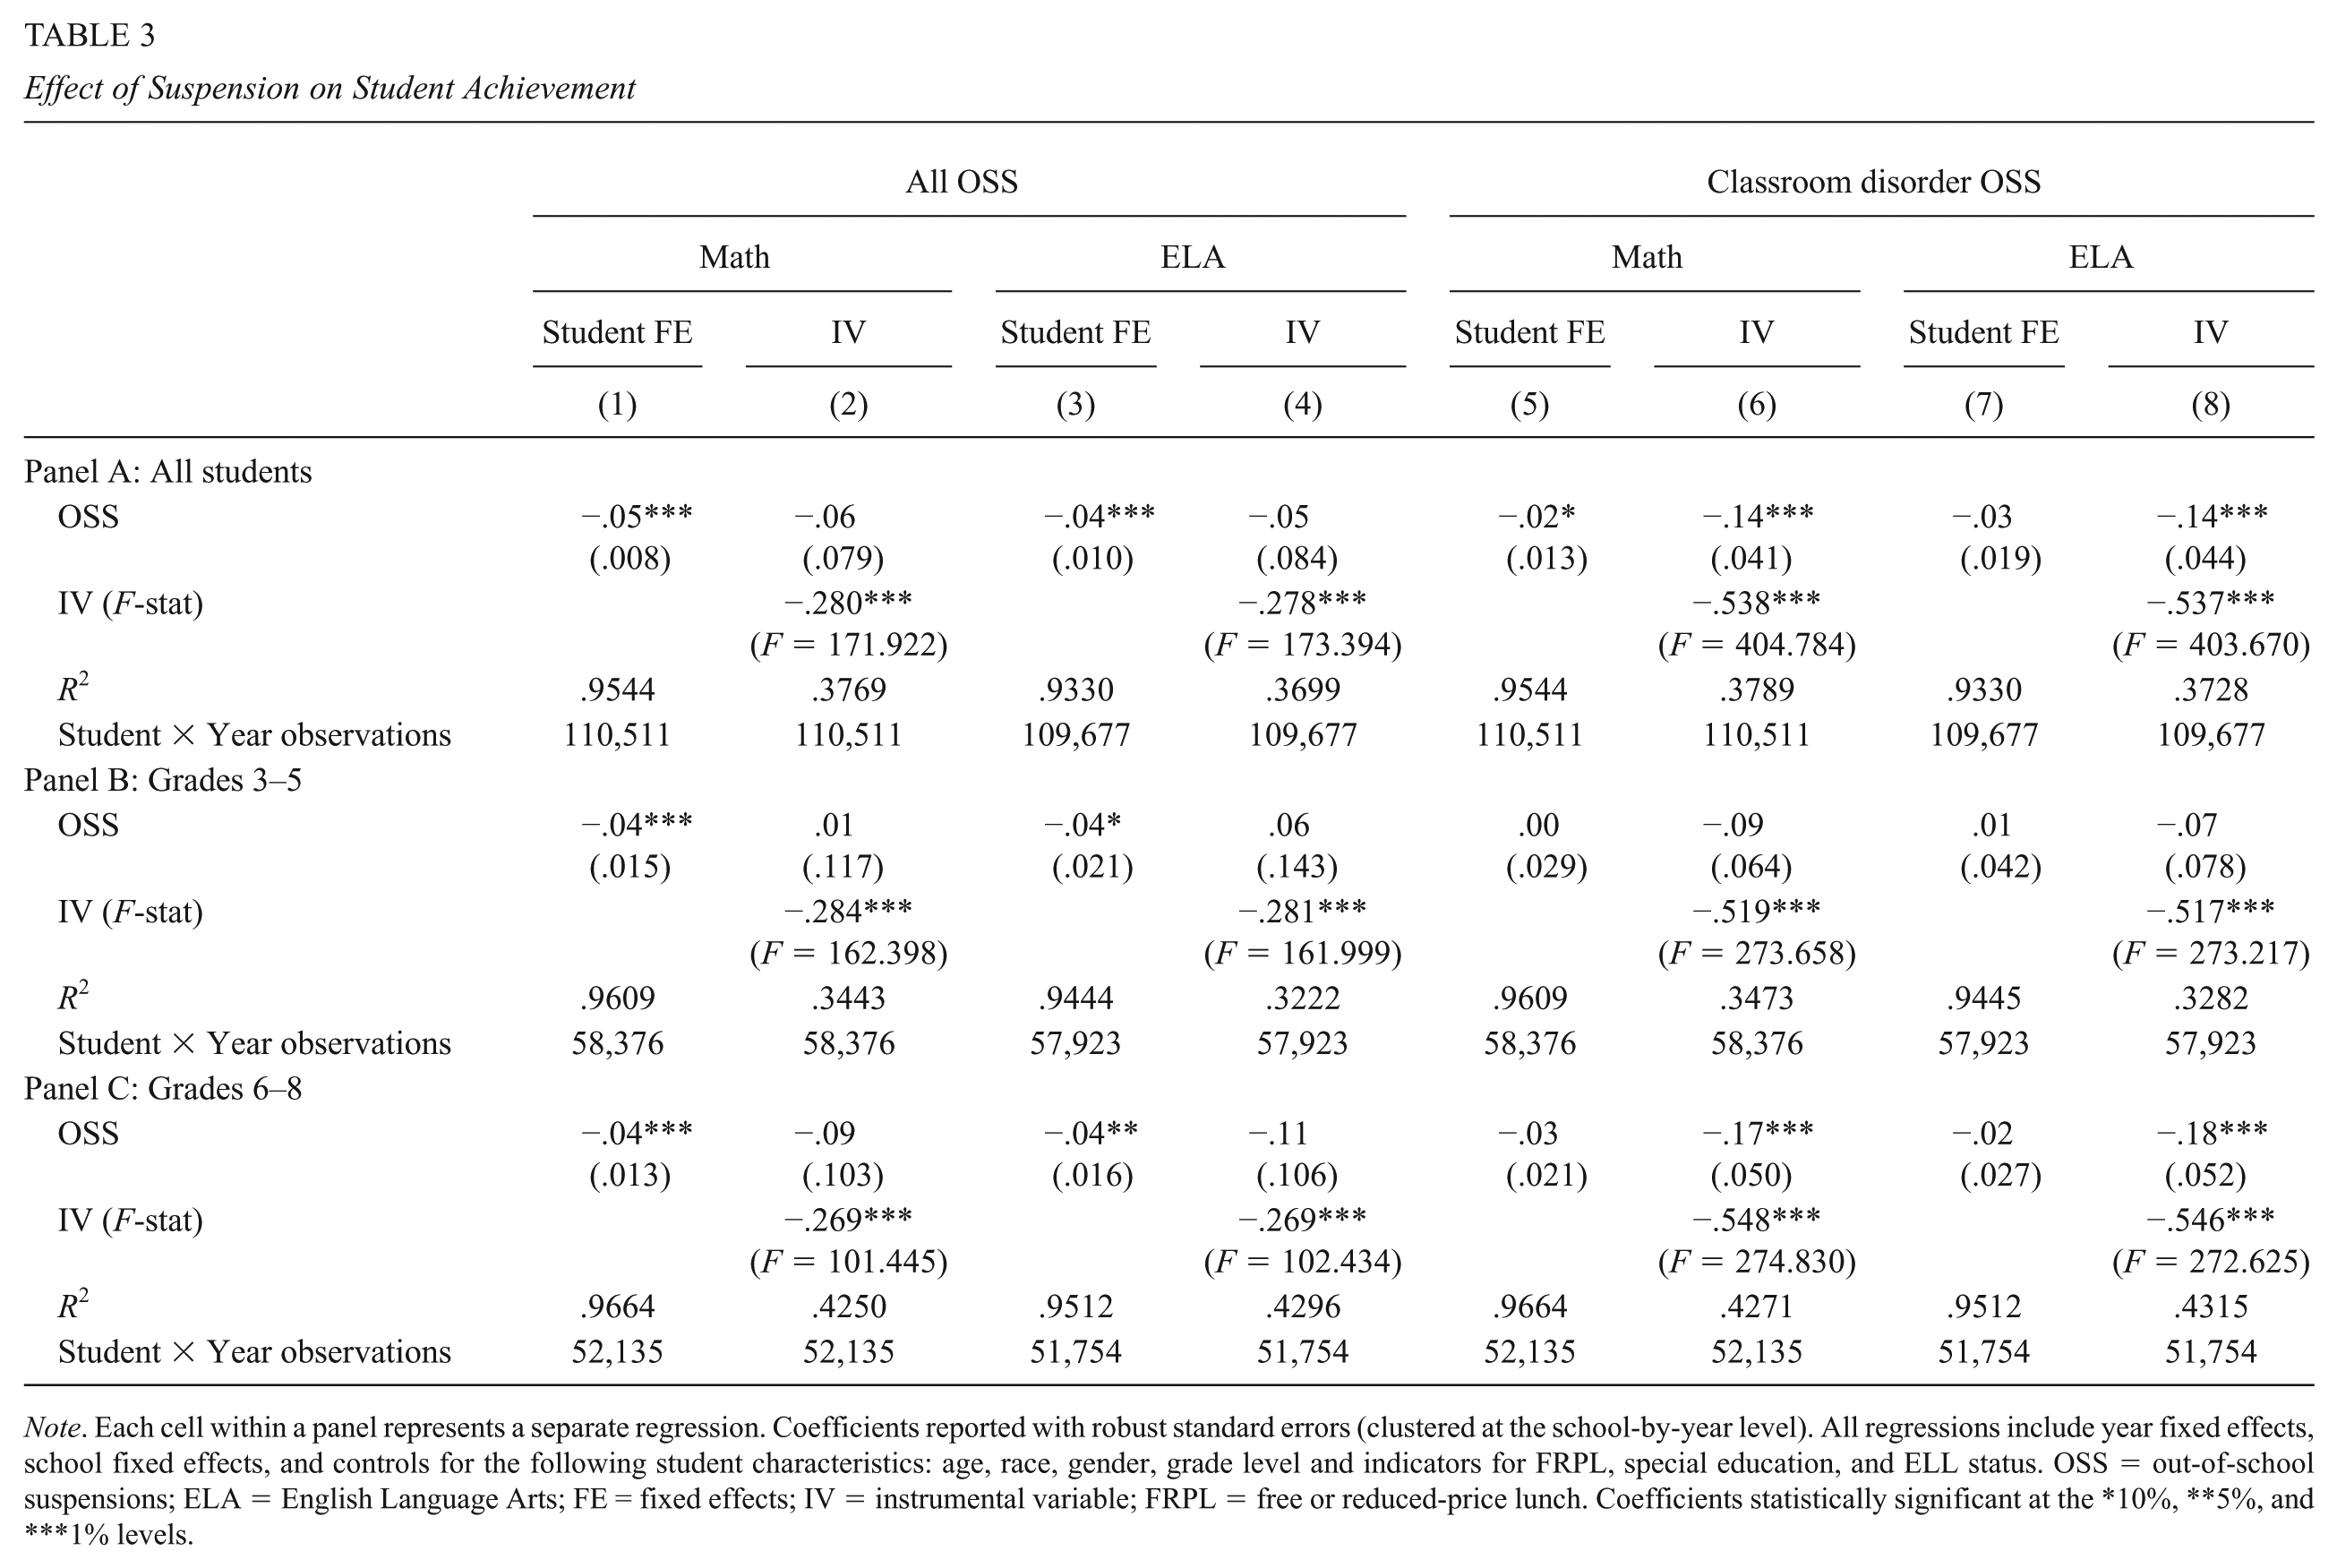
Note. Each cell within a panel represents a separate regression. Coefficients reported with robust standard errors (clustered at the school-by-year level). All regressions include year fixed effects, school fixed effects, and controls for the following student characteristics: age, race, gender, grade level and indicators for FRPL, special education, and ELL status. OSS = out-of-school suspensions; ELA = English Language Arts; FE = fixed effects; IV = instrumental variable; FRPL = free or reduced-price lunch. Coefficients statistically significant at the *10%, **5%, and ***1% levels.
To test the robustness of the main result, we implement an IV approach that leverages the change in the probability of being suspended following the introduction of the policy reform. The IV models, presented in columns 2 and 4 of Table 3, show strong first stage relationships between the instrument and the probability of being suspended. The second stage estimates of the effect of suspensions for any infraction on test scores for all students are consistent in magnitude with the main effects (columns 1 and 3), although they do not reach statistical significance. For the grade-specific estimates, the IV estimates for students in the elementary grades are not statistically different from zero (and positively signed; Panel B), while the IV estimates for middle-school students are slightly larger than those estimated with student fixed effects (FEs) (Panel C).
While one might expect students who are suspended for more serious infractions (and who may miss significant amounts of class time) to experience declines in achievement, we also find that students who are suspended for less serious, classroom disorder infractions experience similar declines in achievement. The results, presented in the last four columns of Table 3, show that math test scores decline following suspensions for classroom disorder infractions (Panel A). The student fixed effect estimate is −0.02 standard deviations; the estimated effect from the IV model is −0.14 standard deviations. The pattern of declines in ELA scores is nearly identical, although the coefficient on the student fixed effect estimate does not reach statistical significance (Table 3, Panel A, column 7). Decreases in test scores following suspensions for classroom disorder infractions result in a decreased probability of achieving academic proficiency on the math exam: The coefficients range from a 2 percentage point decline in the probability of reaching academic proficiency (student FE) to a 9 percentage point decline in the probability of reaching academic proficiency (IV; Online Appendix Table B).
The grade-specific results reveal that there is no effect of suspension for classroom disorder infractions on elementary grade test scores (Table 3, Panel B). The results for middle-school students vary by specification: Estimates from the student FE model are consistent in magnitude with the estimates for all students but are not significant, while the IV estimates reveal large, statistically significant declines in test scores among middle-school students (decreases of 0.17 and 0.18 standard deviations in math and ELA, respectively; see Panel C). As a result, the probability of achieving academic proficiency on either exam decreases among suspended middle-school students (9 percentage point declines for both math and ELA, based on the IV results in Online Appendix Table B). We discuss potential explanations for grade-level differences in the effect of a classroom disorder OSS on student achievement in the conclusion.
Differences in the FE and IV estimates for classroom disorder OSS are expected and informative given that they leverage different assumptions and sources of variation. The FE estimates rely on the assumption that there are no time-varying unobserved shocks to students that are correlated with both their behavior and achievement. If negative unobserved shocks are present, we might estimate adverse effects on student outcomes that are not attributable to classroom disorder suspensions. The IV estimates address the concern about time-varying unobserved shocks by isolating the effect of the change in the probability of receiving a classroom disorder OSS on student outcomes from other potential time-varying shocks. It follows that the FE and IV estimates of the effect of all OSS are nearly identical, while they differ for classroom disorder OSS, which is the type of OSS directly affected by the policy change. Because the IV is the policy change that prohibited OSS for classroom disorder misconduct, the IV approach provides a more robust approach for estimating impacts of classroom disorder OSS on student outcomes.
On the intensive margin, each subsequent day of suspension results in a larger effect on test scores. For all students, each additional day of suspension for any infraction results in a 0.01 standard deviation decline in math and ELA scores (Table 4, Panel A). The magnitude of the estimates are stable across estimators and by grade span (see Table 4, Panels B and C). However, in all the OSS models, the IV estimates do not reach statistical significance (columns 2 and 4), and in the classroom disorder OSS models, the student fixed effect models do not reach statistical significance (columns 5 and 7). We find some evidence that each additional day of suspension for classroom disorder infractions decreases test scores, with estimates ranging from a statistically insignificant −0.01 (based on the fixed effects model) to −0.06 standard deviations in both math and ELA, based on the IV models (Table 4, Panel A). These effects appear to be concentrated among middle-school students (Table 4, Panel C), where each additional day of classroom disorder OSS decreases test scores by 0.07 standard deviations.
Effect of Suspension Days on Student Achievement
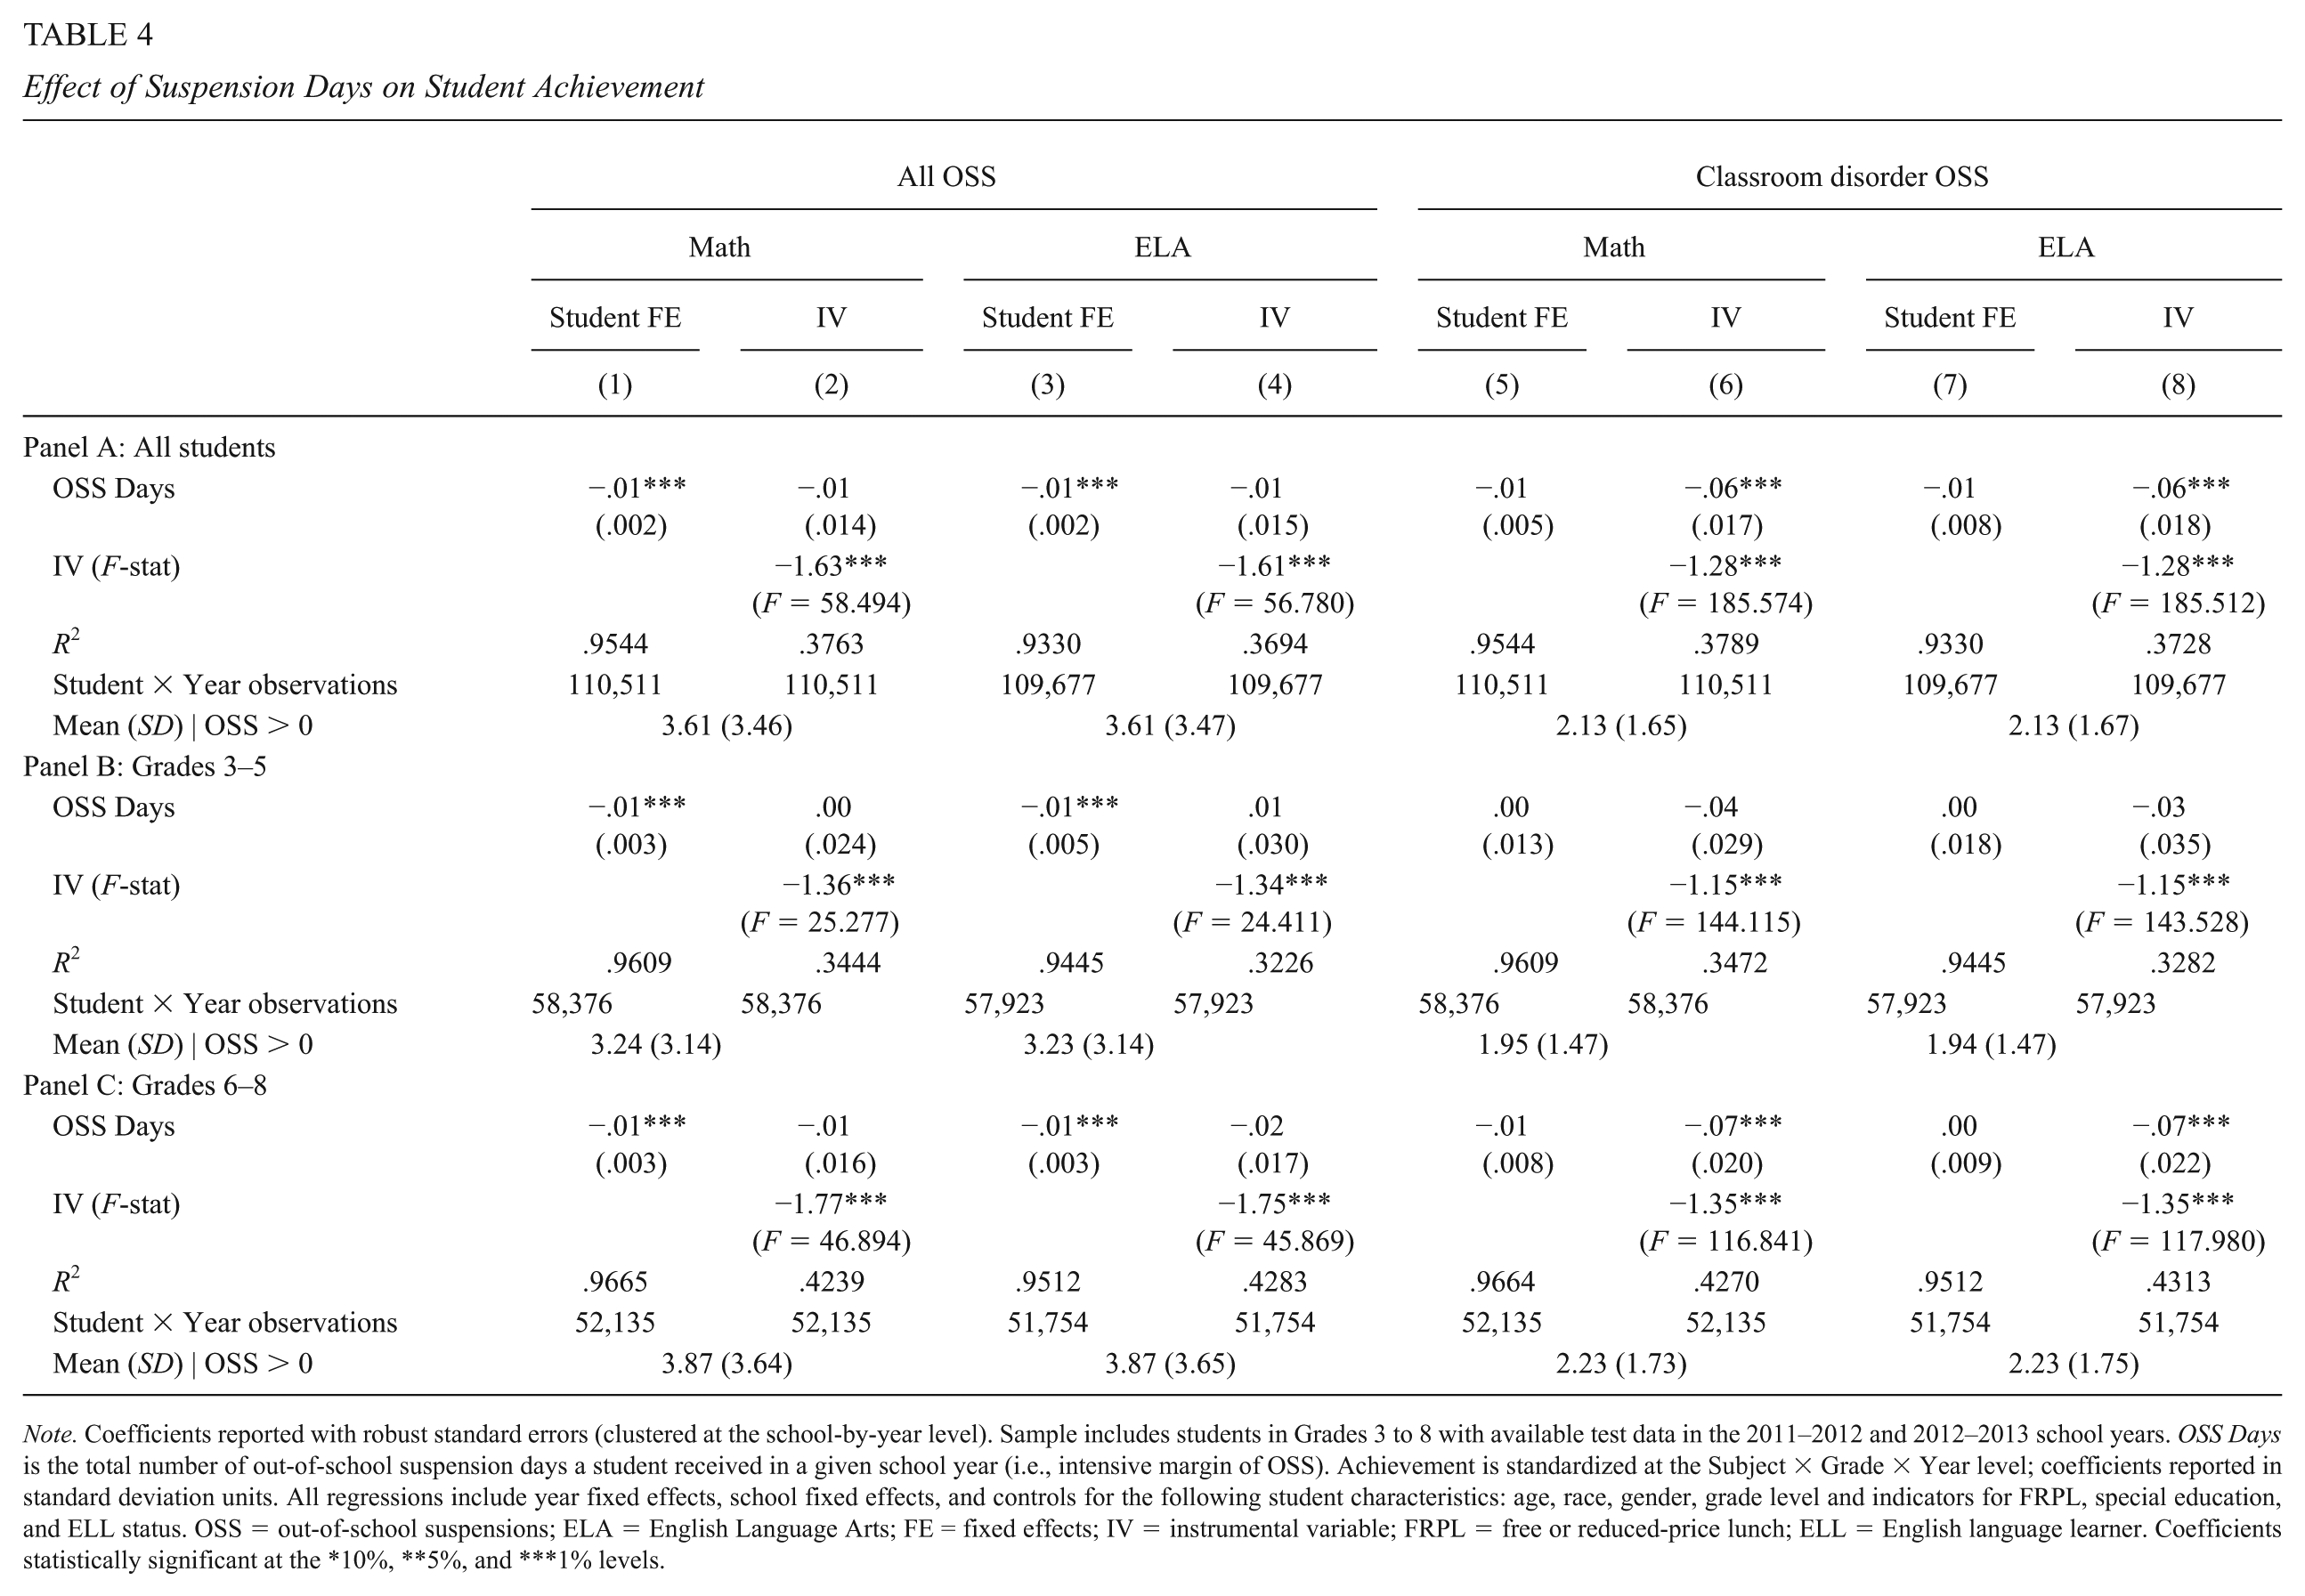
Note. Coefficients reported with robust standard errors (clustered at the school-by-year level). Sample includes students in Grades 3 to 8 with available test data in the 2011–2012 and 2012–2013 school years. OSS Days is the total number of out-of-school suspension days a student received in a given school year (i.e., intensive margin of OSS). Achievement is standardized at the Subject × Grade × Year level; coefficients reported in standard deviation units. All regressions include year fixed effects, school fixed effects, and controls for the following student characteristics: age, race, gender, grade level and indicators for FRPL, special education, and ELL status. OSS = out-of-school suspensions; ELA = English Language Arts; FE = fixed effects; IV = instrumental variable; FRPL = free or reduced-price lunch; ELL = English language learner. Coefficients statistically significant at the *10%, **5%, and ***1% levels.
To explore whether outcomes vary as days of suspension accumulate beyond the first suspension day, we estimate semiparametric models to explore nonlinearities in the relationship between suspensions and achievement. We find that even 2 OSS days have negative effects on achievement, and the accumulation of these effects result in larger declines in math and ELA test scores with each additional suspension day (Figure 2, Panels A and B). For classroom disorder suspensions, which are shorter in duration and last for an average of 2 days, the effects on both math and ELA test scores and math proficiency are concentrated in the first day of suspension, with longer suspensions having no additional effect on test scores (Figure 2, Panels C and D). In sum, students who are suspended for any offense experience a decrease in achievement, measured by standardized test scores and proficiency levels, and each subsequent day of suspension has an additional, negative effect. Even shorter suspensions for less serious, classroom disorder offenses significantly decrease test scores. The effects of each additional day of OSS on test scores are larger in magnitude than the effect of simply missing school due to absences. Indeed, Aucejo and Romano (2016) estimate the effect of absences on test score performance using a student fixed effects estimator and find that each additional day of absence decreases the reading and math achievement of Grade 3 to 5 students by 0.003 and 0.006 standard deviations, respectively.
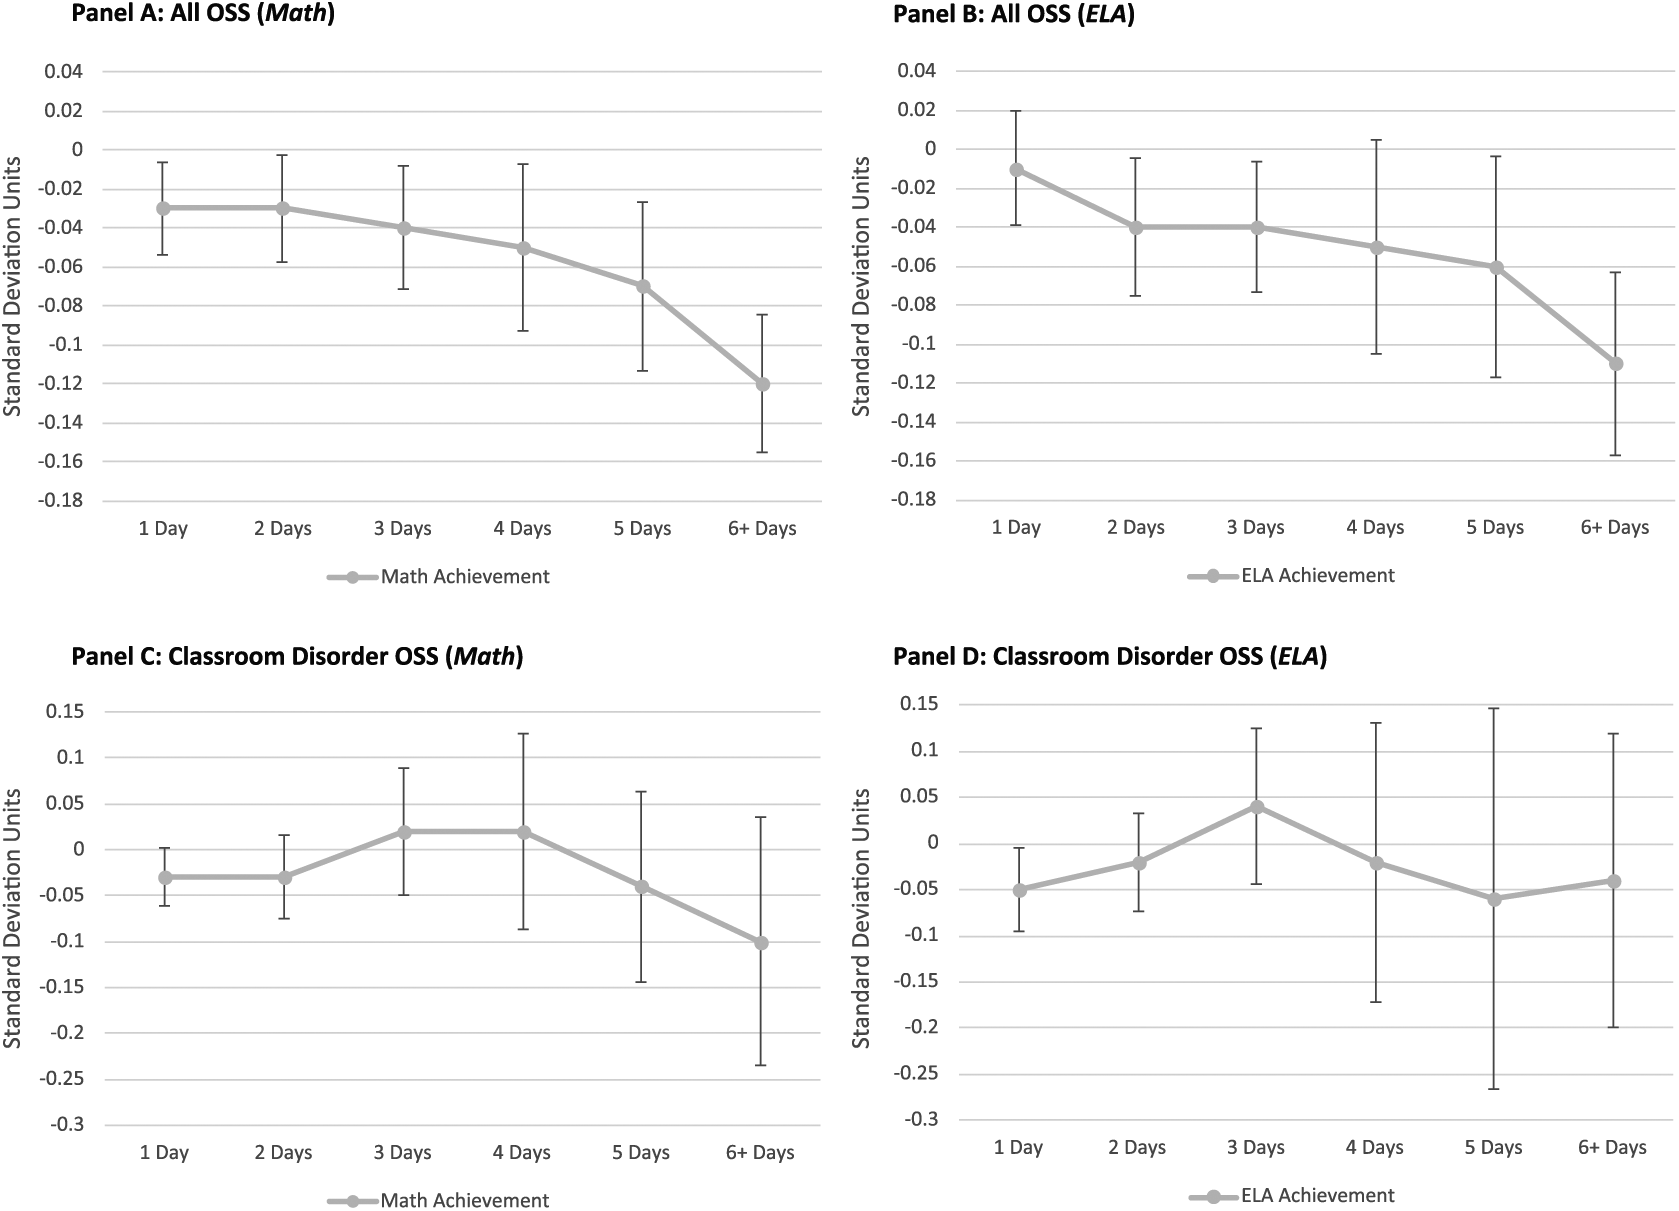
Achievement effects, by OSS days.
Sensitivity Checks
Taken together, we consider the student fixed effects and IV estimates to be lower and upper bounds, respectively, on magnitude of the true effect. The student FE model is based on within-student variation in suspensions over the study period: Students who receive no suspensions during this time, or students who ever receive a suspension in each year, do not contribute to the estimate. Therefore, the fixed effect estimates on the extensive margin—whether a student received a suspension—is based on a subset of students whose suspension status changes. Because students who are suspended in both periods are likely to have worse outcomes but do not contribute to the estimate, these models likely provide a conservative estimate of the change in outcomes following a suspension.
If the observed effect of suspensions on student outcomes can be explained by an omitted, time-varying shock in students’ lives (such as exposure to a violent event at home, a divorce, or a death in the family) not captured by the time-invariant student fixed effect, students might have experienced declines in outcomes regardless of suspension status. Therefore, if a systematic, unobserved time-varying shock is contributing both to misbehavior and outcomes, the student fixed effects estimate might overstate the change in outcomes due solely to suspensions. If this is the case, the magnitude of the true effect could be smaller (in absolute value) than our student fixed effects estimates.
We test the sensitivity of the student fixed effect results to different model specifications and samples. In Online Appendix Table C, we present the unadjusted relationship between OSS and achievement, and then add controls in each subsequent model, including student characteristics, year fixed effects, and school fixed effects. The table shows clearly that the inclusion of student fixed effects (column 5) accounts for a substantial amount of bias present in estimates that omit these controls. For instance, the Noltemeyer et al. (2015) meta-analysis finds that the effect size of OSS on student achievement is −0.24 standard deviations—an estimate that is identical to the estimate we generate in the school fixed effects model (Online Appendix Table C, column 4). In contrast, the student fixed effect estimate is −0.05 standard deviations in math and −0.04 standard deviations in ELA. Our main student fixed effects results (column 5) are robust to the inclusion of School × Year and School × Year × Grade FEs, the former of which control for different ways in which schools implement reforms from year to year, and the latter control for unobserved features of schools and grades that vary across years, such as teacher quality or turnover, or the propensity to suspend students (Online Appendix Table C, columns 7 and 8).
We also examined the sensitivity of our main fixed effects estimates to alternative sample years (see Online Appendix Table D). We estimate the student fixed effect models across different samples during the 2011–2012 through 2013–2014 school years. We find that the main fixed effect estimate is robust to alternative sample years, mitigating the concern that the estimated effects are driven by the time period under study. To allay concerns related to student attrition from the sample over time, we estimate the student fixed effect models on a stable sample of students present in each year during the 2011–2012 through 2013–2014 school years; the main results are robust to this sample restriction (see Online Appendix Table D).
Finally, because we do not observe the underlying infractions in the data (only the resulting receipt of suspension), the IV approach relies on the assumption that a student who misbehaved in the pre-policy year did not change his or her behavior in the postpolicy year. This approach assumes that a student who committed an infraction and received a suspension in 2011–2012 also committed an infraction in 2012–2013, independent of whether he or she received a suspension in the postpolicy year. As a result, the IV estimates might overstate the magnitude of the effect of suspensions on outcomes. The magnitude of the bias will depend on whether the underlying assumption—that student behavioral patterns remain (relatively) constant across years—is valid. Namely, if every student in the 2011–2012 year committed a classroom disorder infraction in 2012–2013, then our IV estimates are unbiased.
We examine the magnitude of the bias by calculating the following:
Effects of Suspension on Attendance
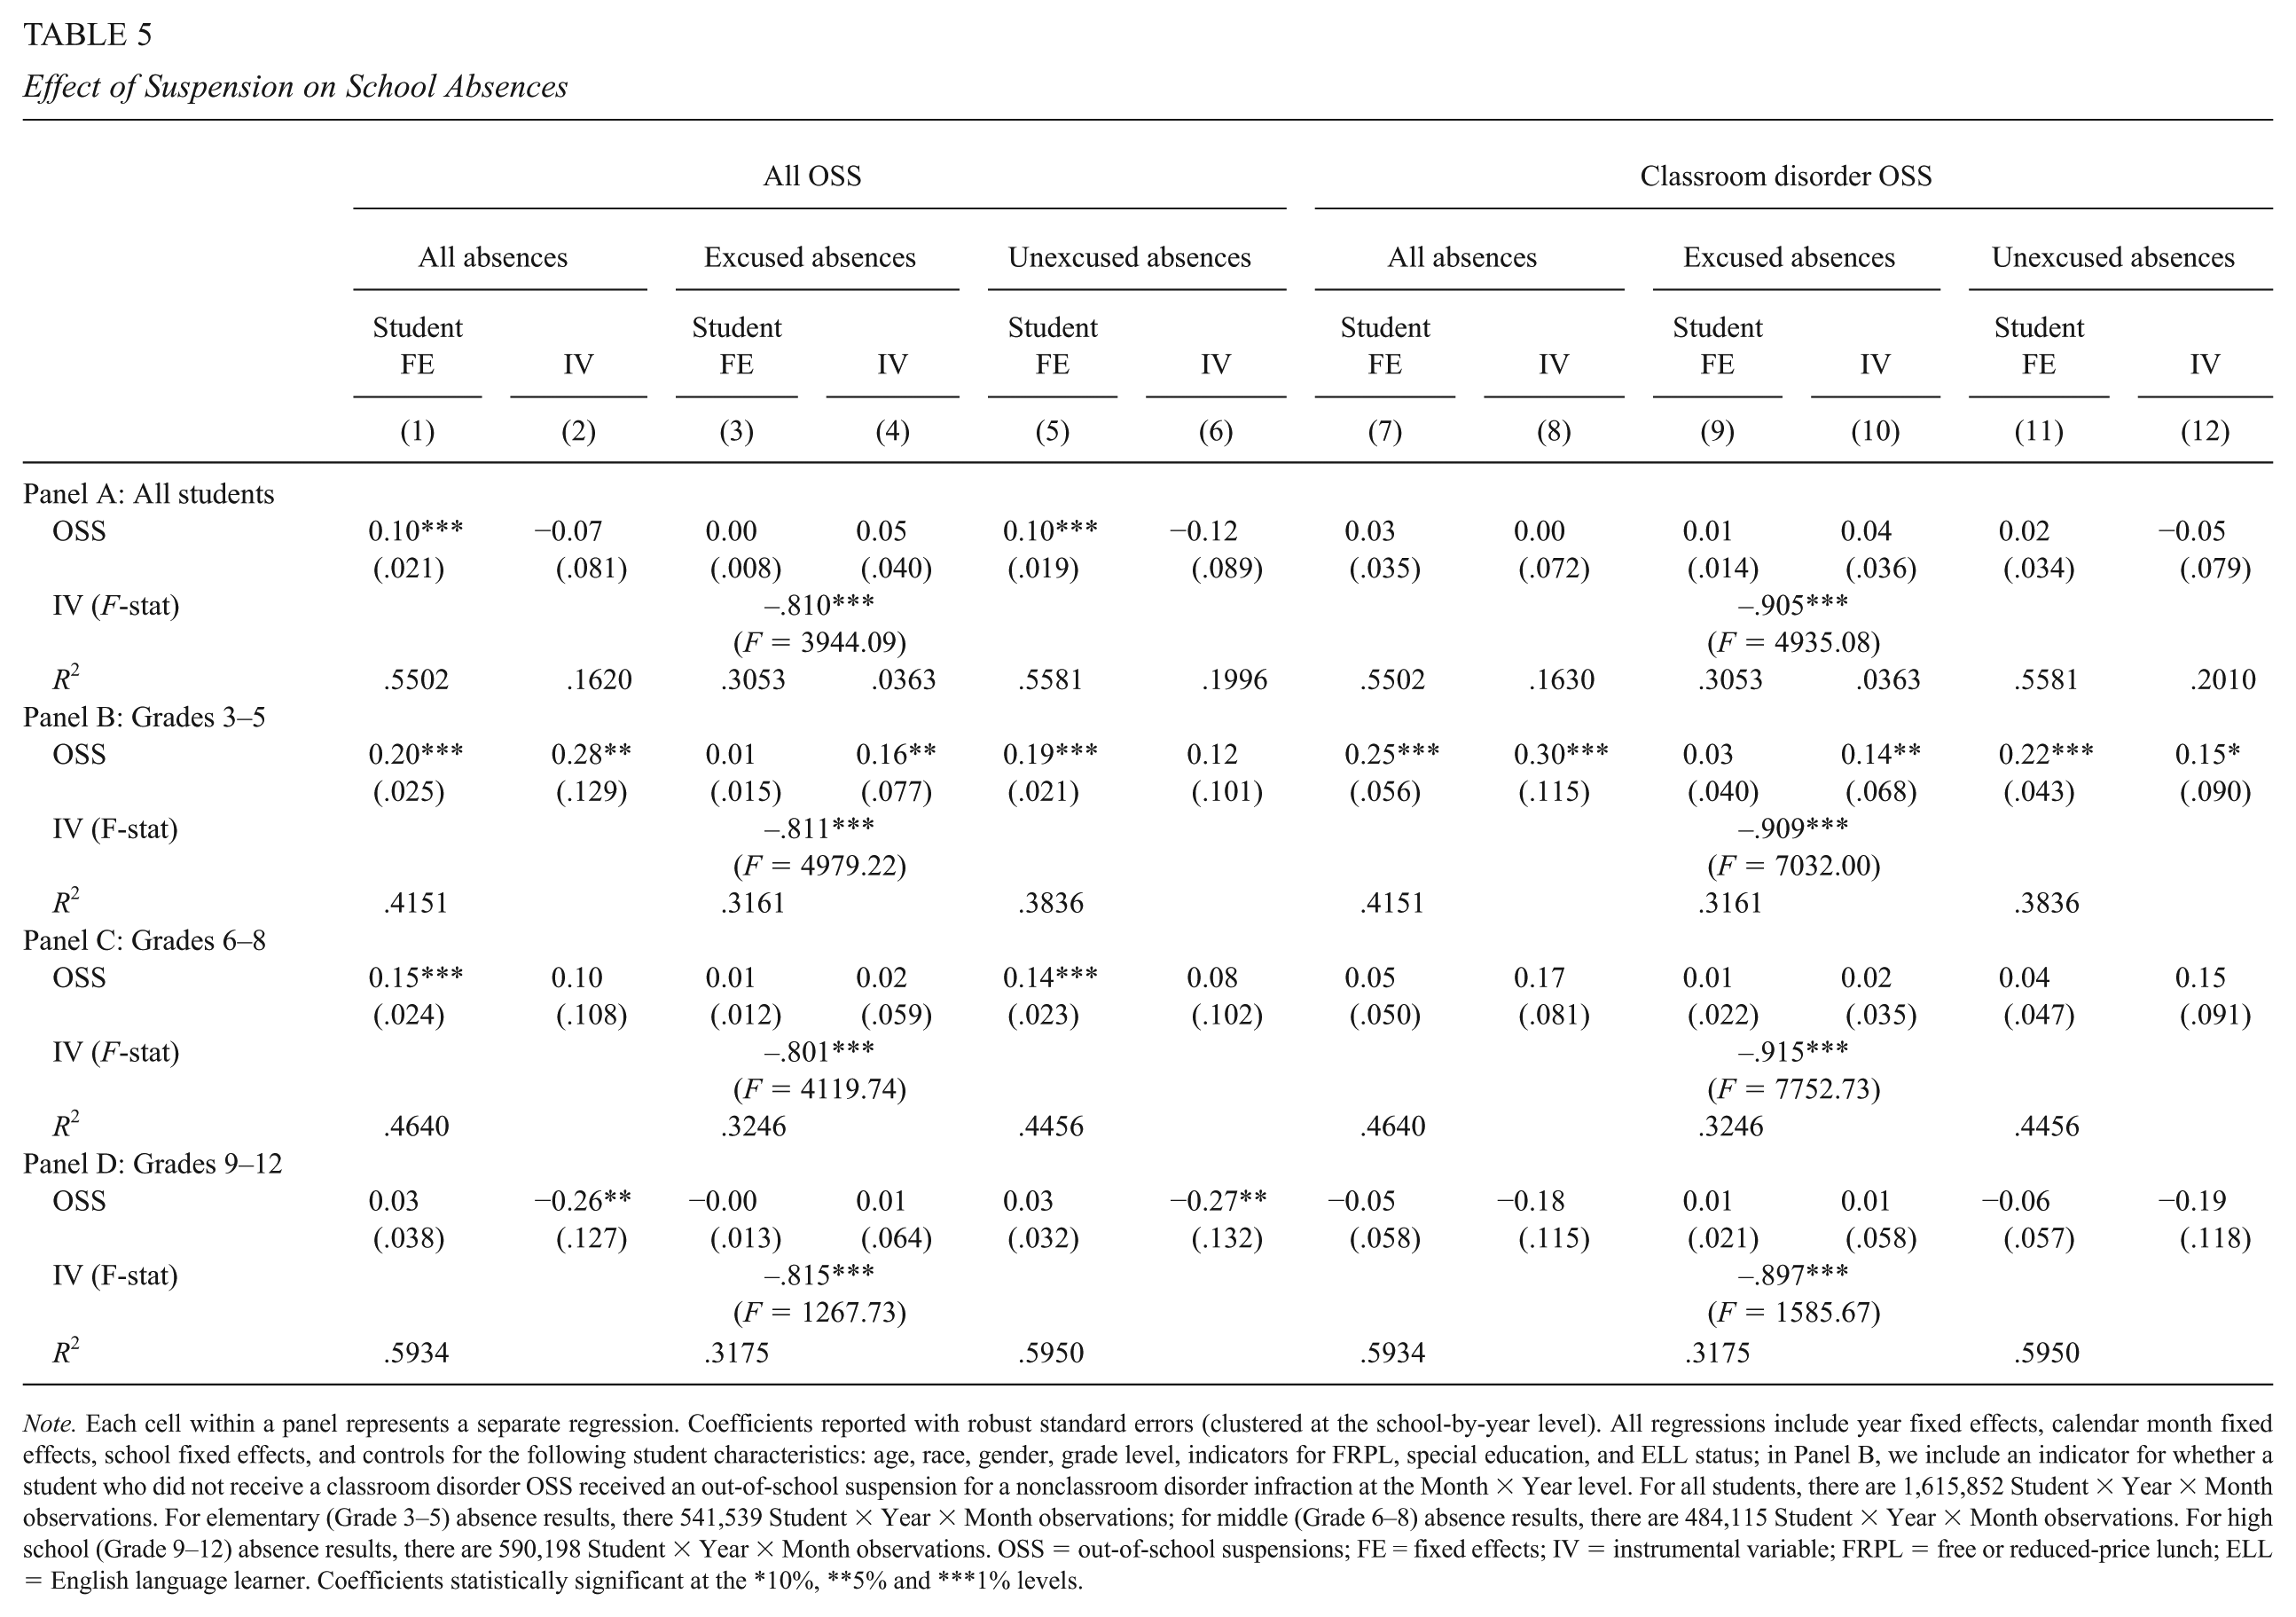
Beyond achievement, students who are suspended may become less engaged in school. Absences resulting from suspensions are not purely mechanical: The days a student spends out of school due to a suspension are independent of the total days absent from school. Therefore, any effect of suspensions on days absent are the result of behavioral responses to suspensions. Overall, we find little (to no) evidence that suspensions affect student absences in the month following a suspension, either for any infraction or for classroom disorder infractions (see Table 5, Panel A). For students in the elementary grades, however, an OSS for any type of infraction increases absences from school by 0.20 to 0.28 days per month, on average (Table 5, Panel B, columns 1 and 2), with commensurate increases in both excused and unexcused absences. The effect of classroom disorder OSS on elementary grade students is similar in magnitude, an average increase of 0.25 to 0.30 days absent per month. For students in the middle-school grades (Table 5, Panel C), we find that an OSS for any infraction results in a small increase in days absent (the IV estimate, though positive, is imprecisely estimated), but we find no evidence that classroom disorder OSS increases absences for Grade 6 to 8 students. Among high school students, the IV estimates suggest a decrease in absences following any OSS, with the decrease concentrated among unexcused absences (Panel D). Since the IV estimate is not robust to the FE estimator, we do not draw strong conclusions from this finding. We find no evidence of an effect of classroom disorder OSS on absences in the month following the suspension for high school students. Taken together, these results suggest that the adverse effect of suspensions on school absences are concentrated among younger students in Grades 3 to 5. In a sensitivity test (akin to a Granger test), we explore the direction of causality of the estimated effects of OSS on monthly absences and find the results are robust to the inclusion of future OSS as a predictor of prior absences. 8
Effect of Suspension on School Absences
Note. Each cell within a panel represents a separate regression. Coefficients reported with robust standard errors (clustered at the school-by-year level). All regressions include year fixed effects, calendar month fixed effects, school fixed effects, and controls for the following student characteristics: age, race, gender, grade level, indicators for FRPL, special education, and ELL status; in Panel B, we include an indicator for whether a student who did not receive a classroom disorder OSS received an out-of-school suspension for a nonclassroom disorder infraction at the Month × Year level. For all students, there are 1,615,852 Student × Year × Month observations. For elementary (Grade 3–5) absence results, there 541,539 Student × Year × Month observations; for middle (Grade 6–8) absence results, there are 484,115 Student × Year × Month observations. For high school (Grade 9–12) absence results, there are 590,198 Student × Year × Month observations. OSS = out-of-school suspensions; FE = fixed effects; IV = instrumental variable; FRPL = free or reduced-price lunch; ELL = English language learner. Coefficients statistically significant at the *10%, **5% and ***1% levels.
On the intensive margin, we find that each additional day of OSS for any infraction increases the average number of days absent in the following month (see Figure 3, Panel A; Online Appendix Table E). The largest effect on absences in the following month occurs after a suspension that is 4 days or longer. Notably, the increase in absences following suspensions are driven by increases in unexcused absences, with no change in excused absences following an OSS. We find no difference in the patterns of absences following classroom disorder OSS of varying lengths (Figure 3, Panel B; Online Appendix Table E). Among Grade 3 to 5 students, we find that each additional day of OSS increases unexcused absences, while excused absences only increase after 4 or more days of OSS (see Figure 3, Panel C).
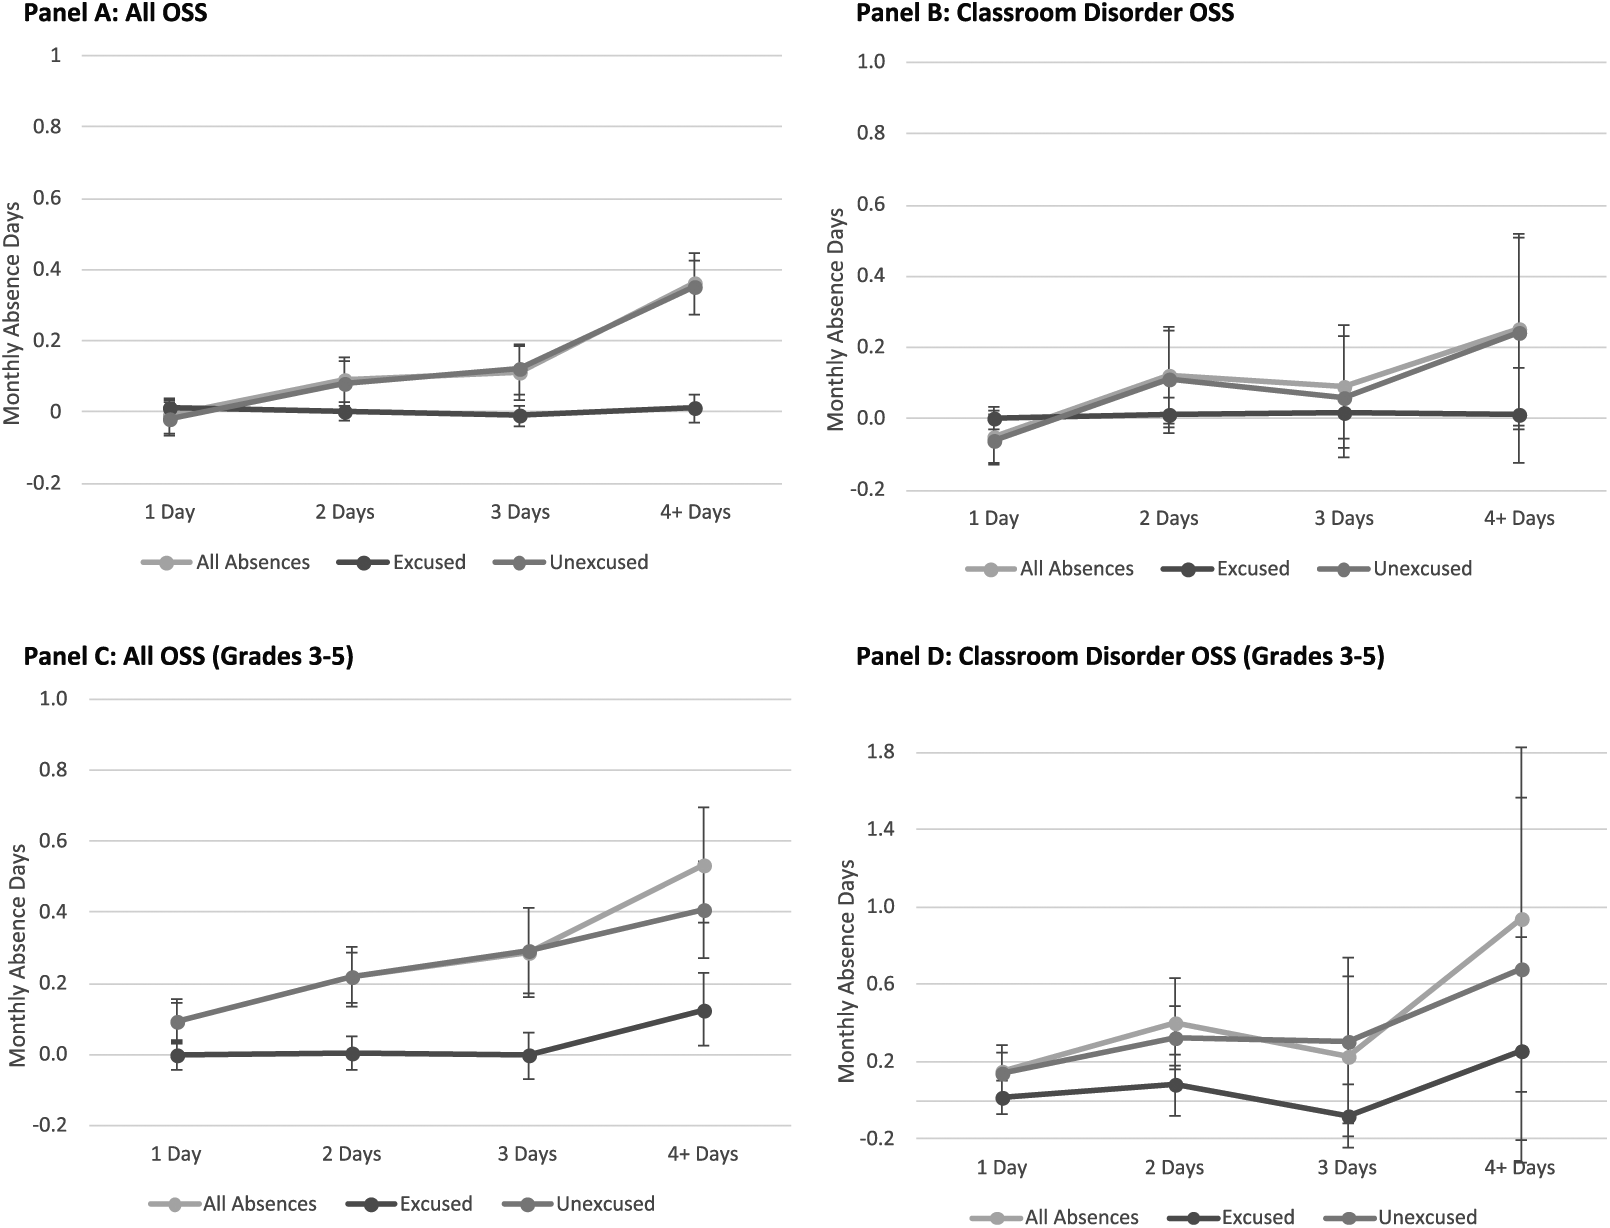
Absence effects, by OSS days.
For elementary school students (i.e., Grades 3–5), an increase in days absent of 0.2 days in a month represents a 19.8% increase in monthly absences, relative to the pre-policy (i.e., 2011–2012) mean for nonsuspended students (of 1.01 absences per month). In the pre-policy year, elementary grade students who receive a suspension miss approximately 13 days of school per year, on average, compared with nonsuspended elementary grade students who miss, on average, 9 days of school annually due to absences. Any increase in absences makes students more likely to be chronically truant, defined as missing 10 days of school in a school year, and can result in a referral to truancy court or to the Department of Human Services. 9 The increase in absences for elementary school students is notable, given their relatively high rates of attendance compared with middle- and high-school students, suggesting that OSS are consequential for attendance in elementary school. 10
Exposure to Suspensions and Peer Achievement
Students who are suspended from school experience academic and behavioral setbacks. Are the consequences of suspension concentrated just among those students who are suspended, or does exposure to student misbehavior and high suspension rates influence the peers of suspended students? High suspension rates may reflect a school climate that is lacking in many dimensions—frequent student fights, problems with gangs or drugs, perceptions of school rules as unfair or ineffective, or a place where students and teachers generally feel unsafe. To the extent that suspensions serve as a proxy for student misbehavior and school climate problems, the influence of suspensions on peers likely captures the influence of school disorder more broadly.
We define exposure to student misbehavior for each nonsuspended peer as the share of students who are suspended in the same school and grade in a given year. In Table 6, the effects of exposure to OSS for classroom disorder and OSS for other, more serious infractions are estimated separately, controlling for the ratio of classroom disorder to other offenses (i.e., the classroom disorder OSS rate). Overall, we find that as the share of students in the same school and grade who are suspended for serious offenses increases, nonsuspended peers experience small but statistically significant decreases in math and ELA test scores (−0.004 and −0.003 standard deviations, respectively; Table 6, Panel A, columns 1 and 4). Note that a one standard deviation increase in the share of students receiving a suspension is equivalent to 3.63 percentage points. Therefore, a one standard deviation increase in the share of students with a suspension is related to a decline in math and ELA test scores of approximately 0.01 standard deviations for a peer. These small declines in test scores translate into a decrease in the probability that peers will pass both the math and ELA state exams (Online Appendix Table F).
Effect of Exposure to Suspensions on Peer Achievement
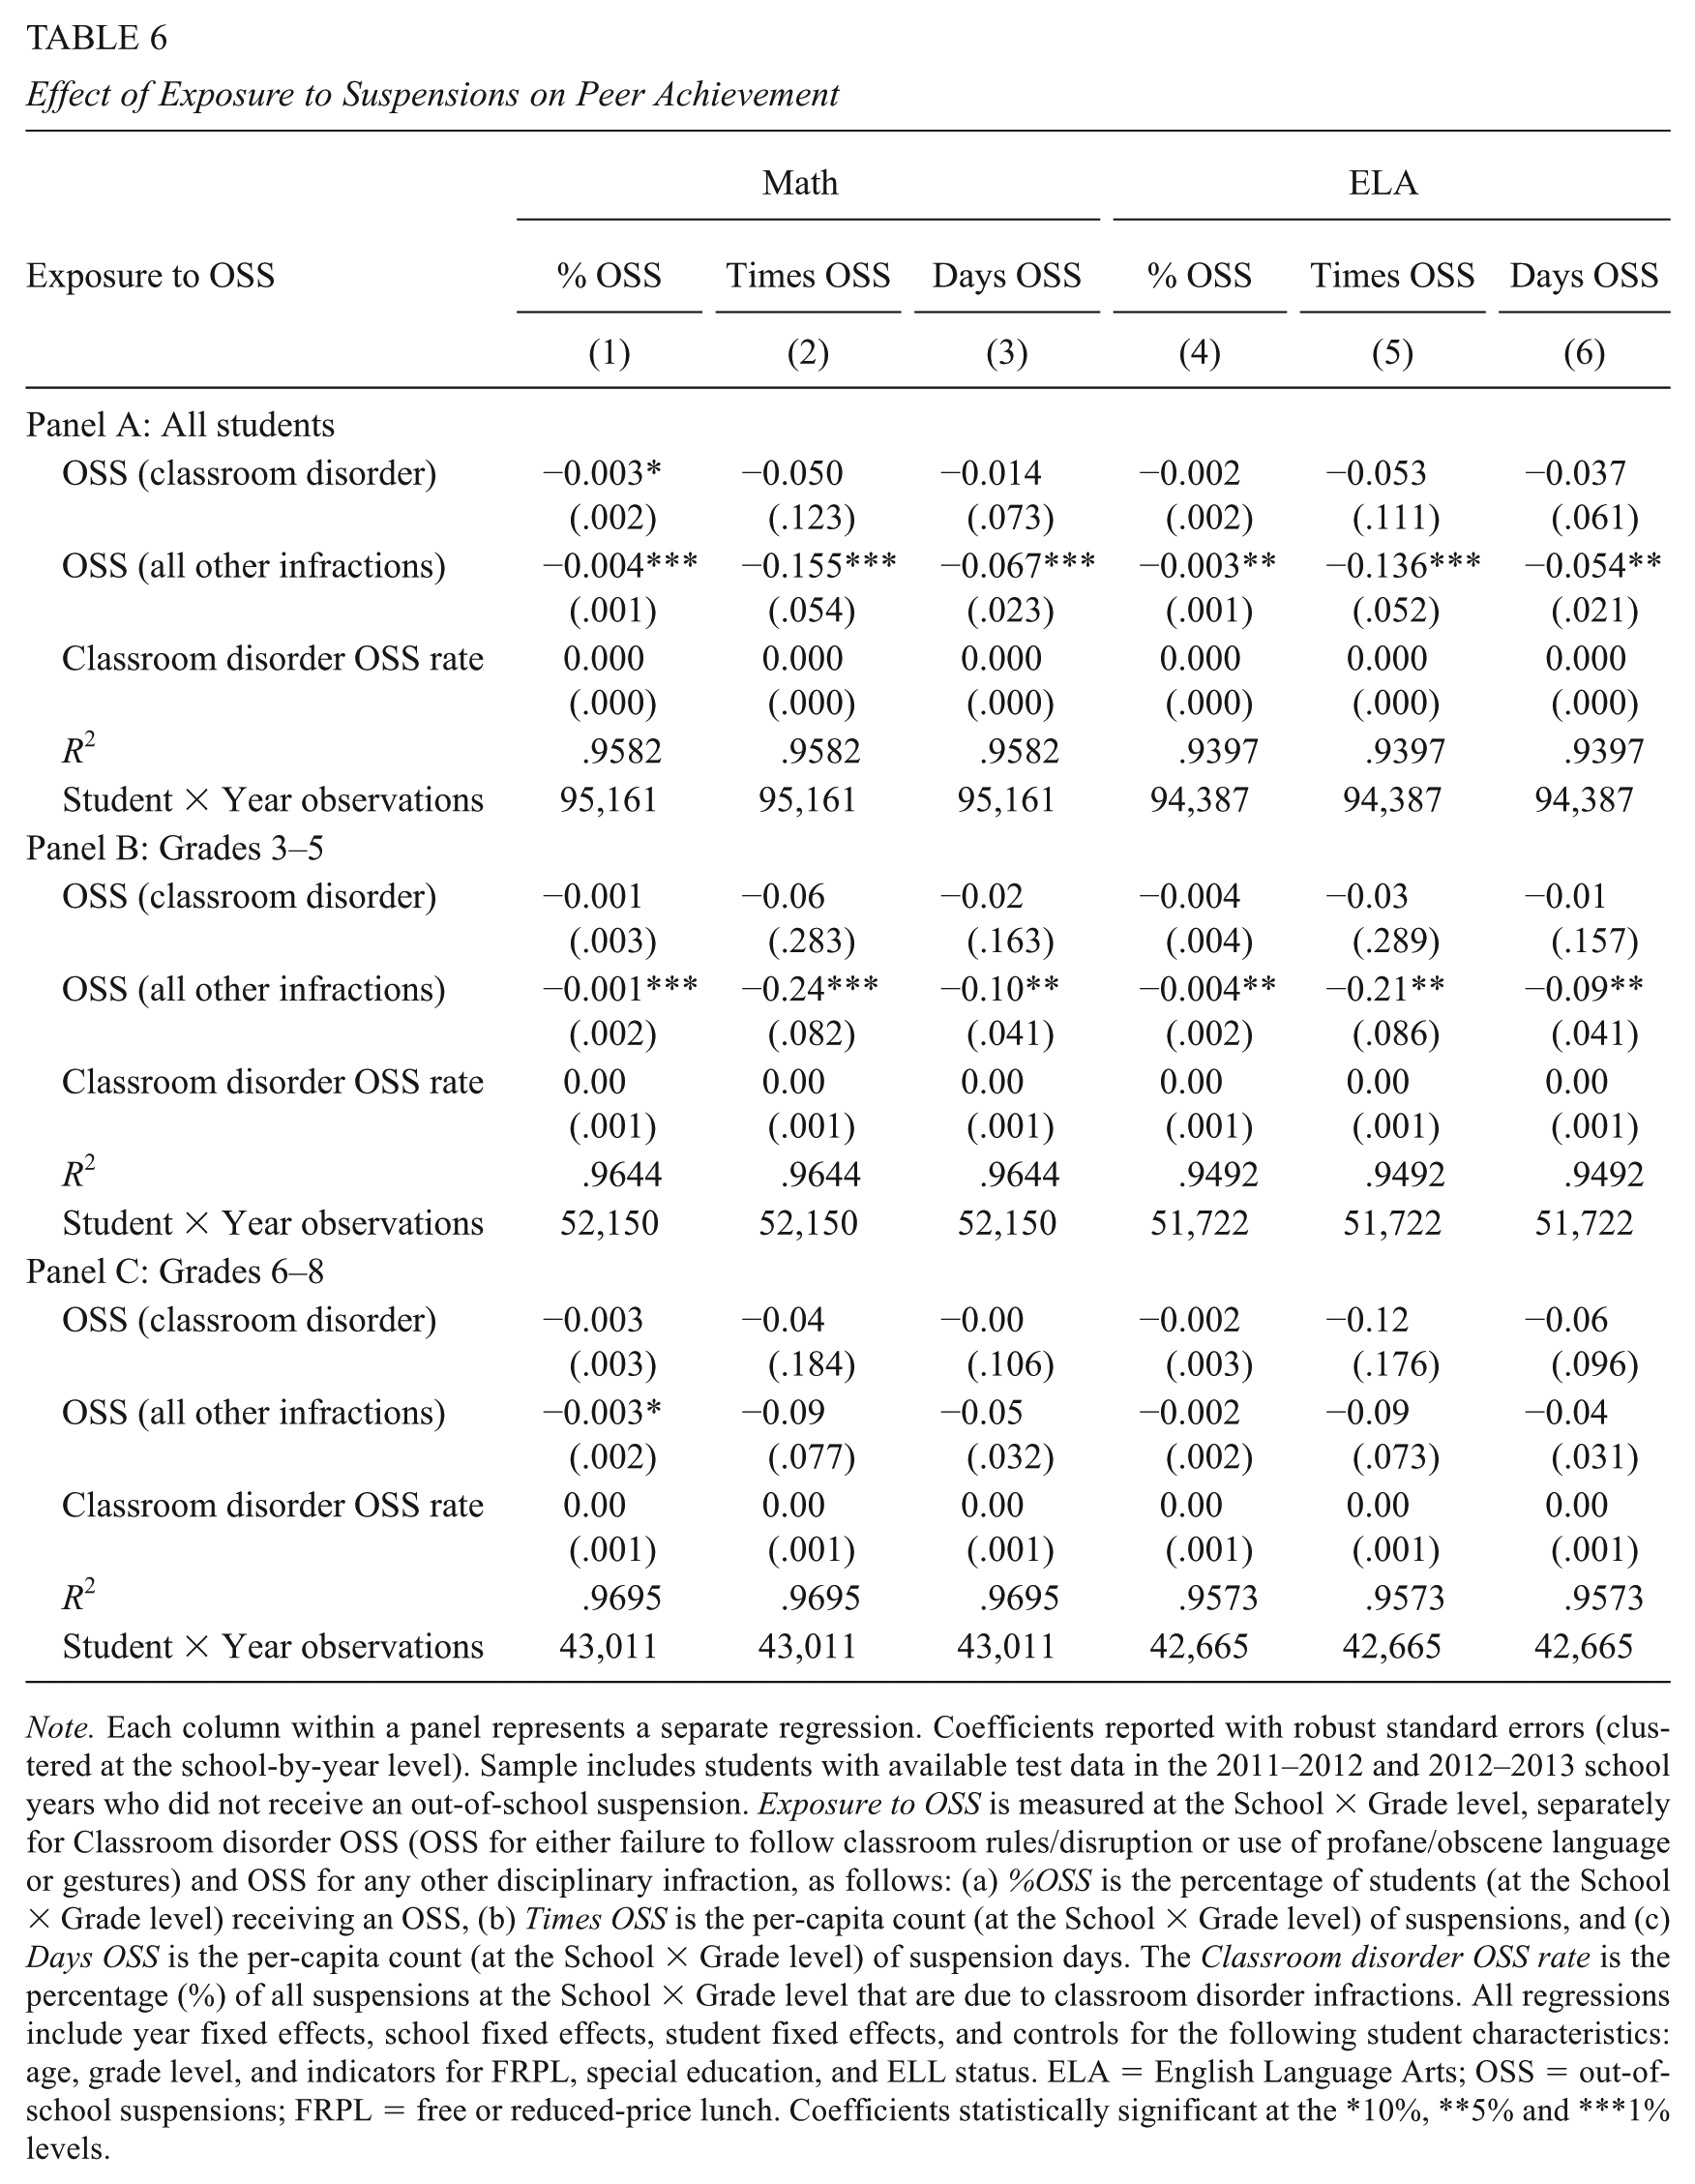
Note. Each column within a panel represents a separate regression. Coefficients reported with robust standard errors (clustered at the school-by-year level). Sample includes students with available test data in the 2011–2012 and 2012–2013 school years who did not receive an out-of-school suspension. Exposure to OSS is measured at the School × Grade level, separately for Classroom disorder OSS (OSS for either failure to follow classroom rules/disruption or use of profane/obscene language or gestures) and OSS for any other disciplinary infraction, as follows: (a) %OSS is the percentage of students (at the School × Grade level) receiving an OSS, (b) Times OSS is the per-capita count (at the School × Grade level) of suspensions, and (c) Days OSS is the per-capita count (at the School × Grade level) of suspension days. The Classroom disorder OSS rate is the percentage (%) of all suspensions at the School × Grade level that are due to classroom disorder infractions. All regressions include year fixed effects, school fixed effects, student fixed effects, and controls for the following student characteristics: age, grade level, and indicators for FRPL, special education, and ELL status. ELA = English Language Arts; OSS = out-of-school suspensions; FRPL = free or reduced-price lunch. Coefficients statistically significant at the *10%, **5% and ***1% levels.
In contrast, we find little (to no) relationship between exposure to less serious, classroom disorder suspensions and peer achievement. When the share of students suspended for classroom disorder in a nonsuspended peer’s grade-level increases by one percentage point, peer math achievement decreases by 0.003 standard deviations (marginally significant) and the estimate for peer ELA achievement is not statistically significant (Table 6, Panel A, columns 1 and 4, respectively). Overall, the prevalence of suspensions for more serious student misbehavior has greater consequences for peer achievement than the prevalence of suspensions for minor student misbehavior, suggesting that any adverse spillovers onto peers are being driven by student behavior (serious vs. minor) rather than by the consequences—out-of-school suspension—for that behavior.
We then estimate peer exposure models by grade span (Table 6, Panels B and C). We find that exposure to OSS for more serious infractions is consistently related to declines in achievement for students in the elementary grades, although the estimates are modest in magnitude (decreasing math and ELA test scores by 0.001 and 0.004 standard deviations, respectively). The results are robust to alternative measures of exposure—the total number of suspensions (Times OSS) and total number of suspension days (Days OSS) in the grade (Table 6). In contrast, for middle grade students, we do not find that exposure to more serious infractions is related to changes in test scores.
Exposure to Suspensions and Peer Attendance
We find no evidence that exposure to OSS—for either classroom disorder or other, more serious infractions—is related to increases in peer absences from school, for all students, and by grade span (Table 7). However, we do find suggestive evidence that exposure to classroom disorder OSS is related to increases in excused absences and decreases in unexcused absences by approximately the same magnitude (Online Appendix Table G). This trade-off between excused and unexcused absences represents a potential behavioral response to exposure to classroom disorder OSS (notably, we do not observe heterogeneity in this relationship by grade level; see Online Appendix Table H). These results are suggestive of both a deterrent effect and an avoidance effect of exposure to classroom disorder OSS. The deterrent effect is represented by reduced unexcused absences as students avoid behavior that may lead to punitive response, such as for chronic truancy. The avoidance effect may reflect that peers, observing punitive practices in their schools, may feel less safe or welcome in the school leading them to stay home more frequently (with a parent’s permission).
Effect of Exposure to Suspensions on Peer Absences
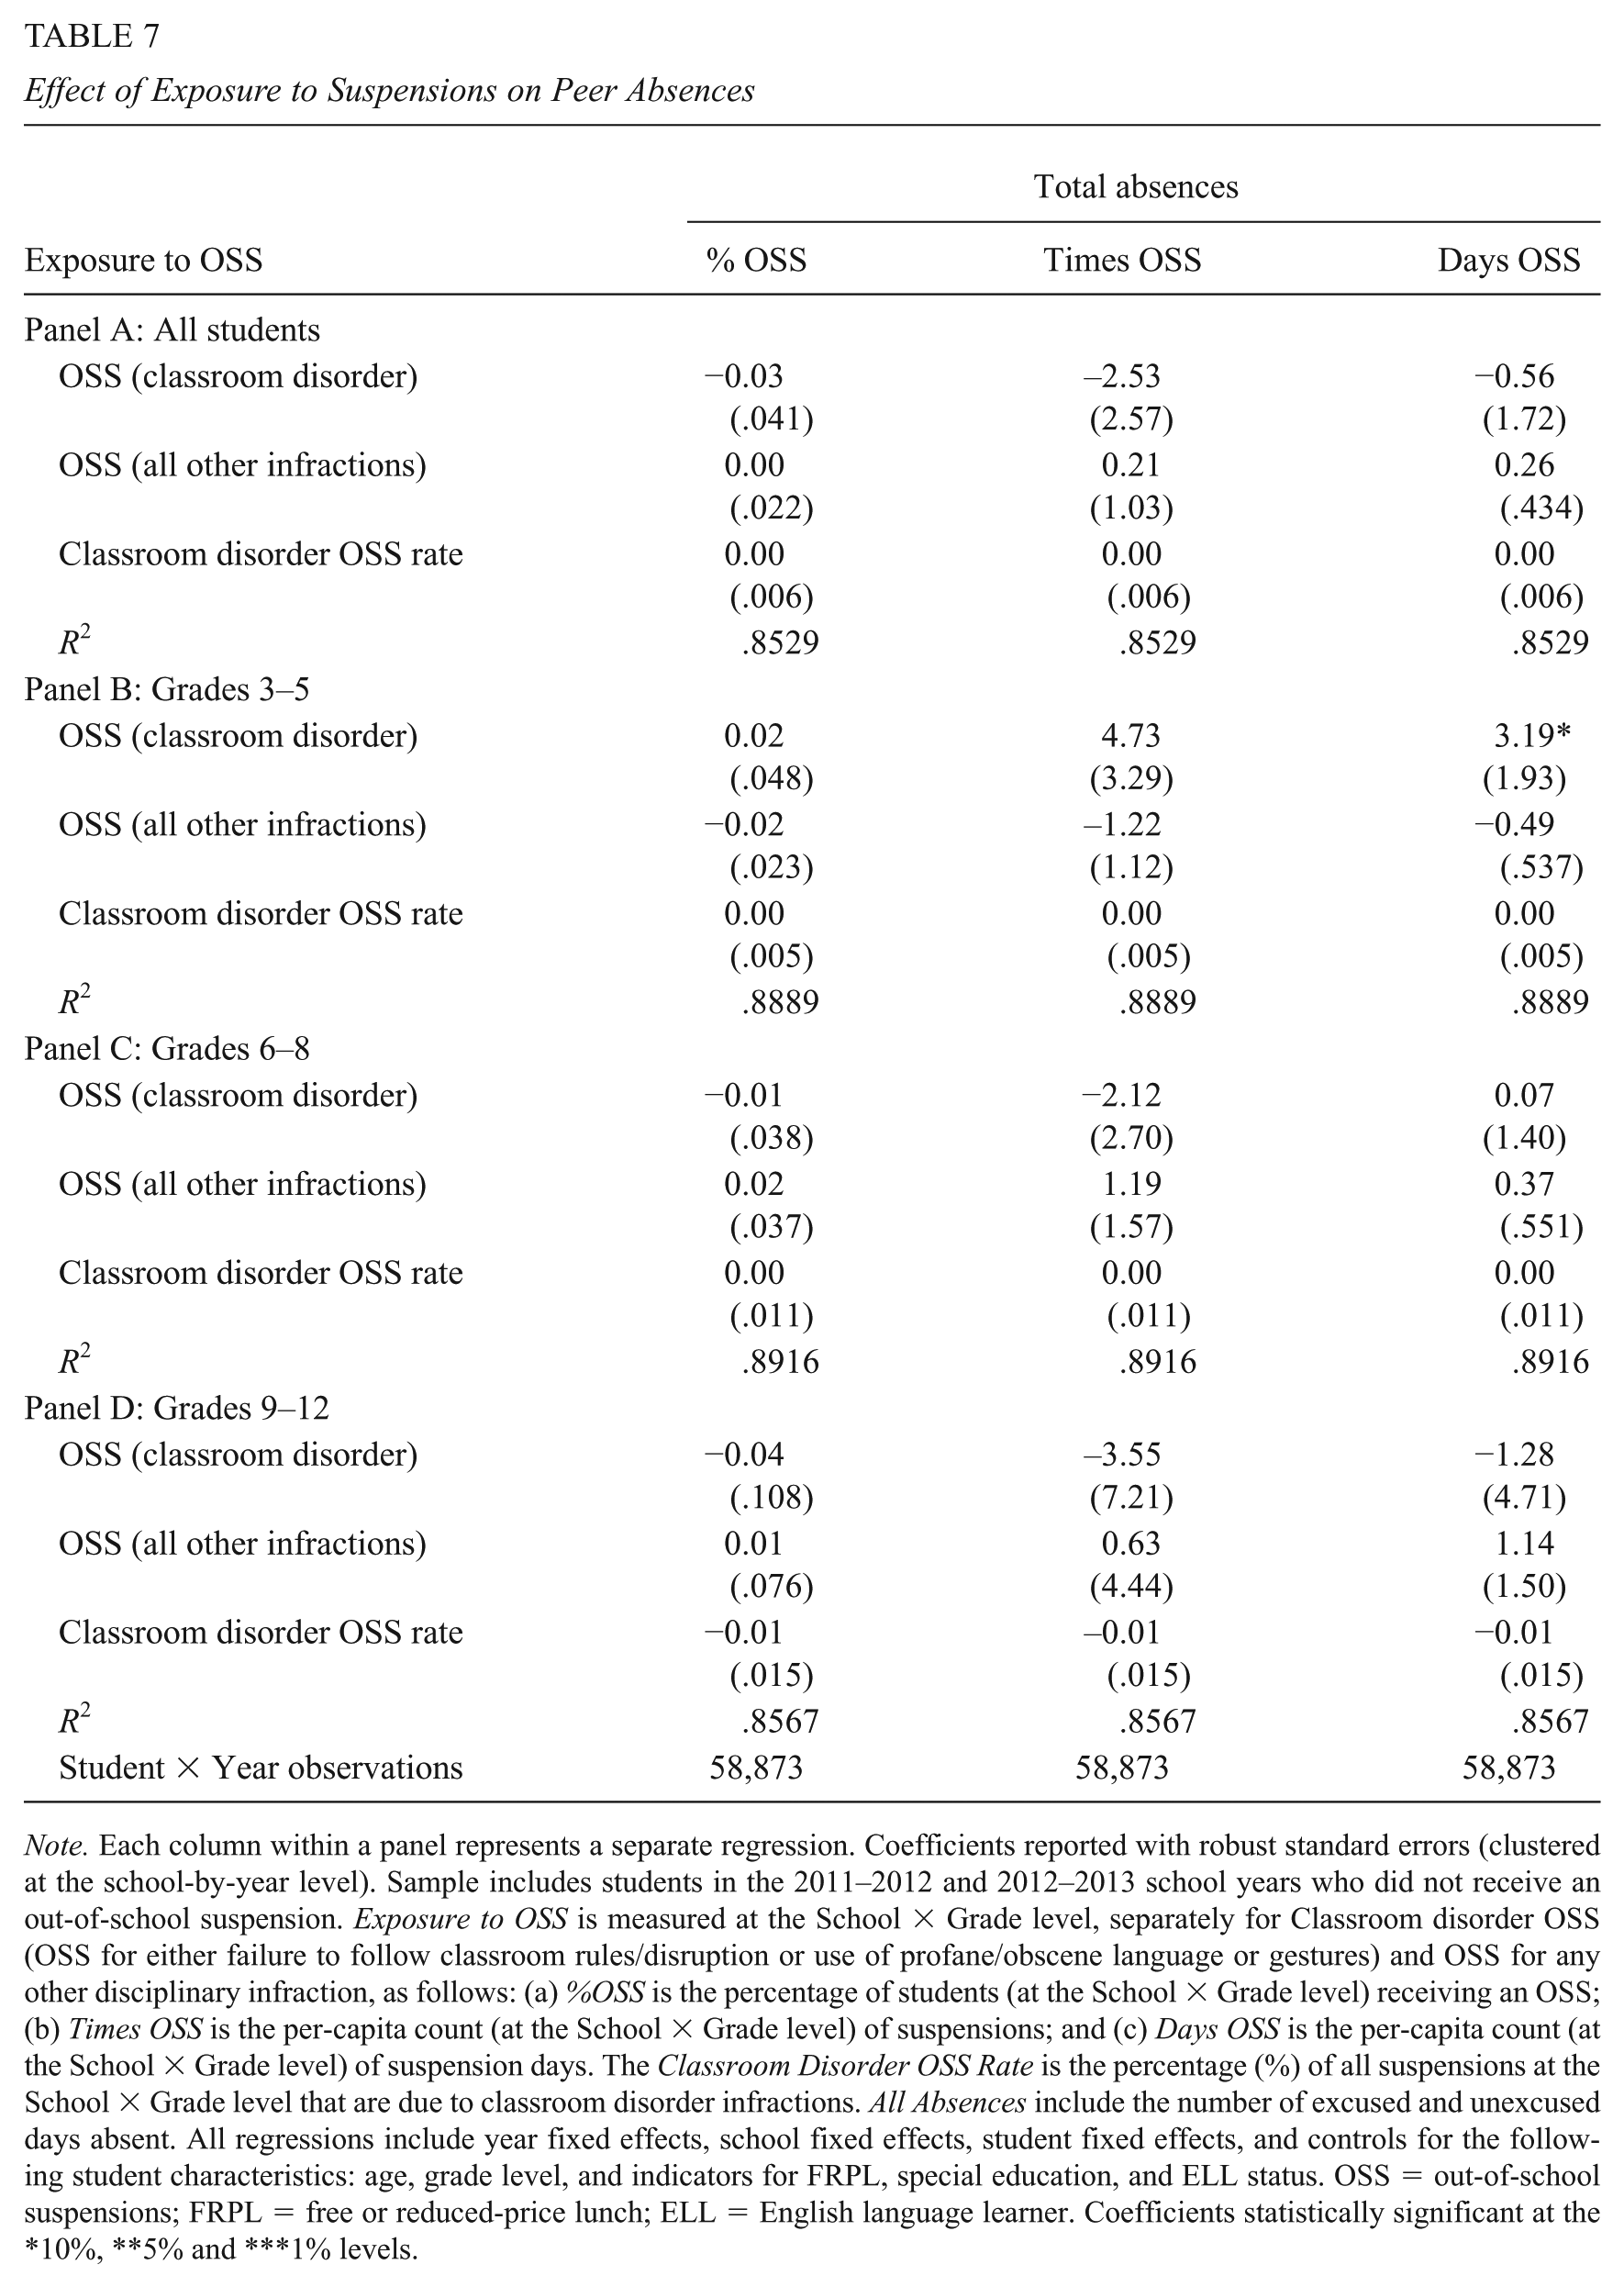
Note. Each column within a panel represents a separate regression. Coefficients reported with robust standard errors (clustered at the school-by-year level). Sample includes students in the 2011–2012 and 2012–2013 school years who did not receive an out-of-school suspension. Exposure to OSS is measured at the School × Grade level, separately for Classroom disorder OSS (OSS for either failure to follow classroom rules/disruption or use of profane/obscene language or gestures) and OSS for any other disciplinary infraction, as follows: (a) %OSS is the percentage of students (at the School × Grade level) receiving an OSS; (b) Times OSS is the per-capita count (at the School × Grade level) of suspensions; and (c) Days OSS is the per-capita count (at the School × Grade level) of suspension days. The Classroom Disorder OSS Rate is the percentage (%) of all suspensions at the School × Grade level that are due to classroom disorder infractions. All Absences include the number of excused and unexcused days absent. All regressions include year fixed effects, school fixed effects, student fixed effects, and controls for the following student characteristics: age, grade level, and indicators for FRPL, special education, and ELL status. OSS = out-of-school suspensions; FRPL = free or reduced-price lunch; ELL = English language learner. Coefficients statistically significant at the *10%, **5% and ***1% levels.
Overall, the economic significance of exposure to suspension for peers is small. Despite concerns about the negative effects of suspensions on peers, suspensions are much more salient for students who personally experience suspension than for their grade-level peers. Our analysis of the relationship between exposure to suspensions and peer outcomes suggests that greater exposure to suspensions for serious infractions is related to small declines in the peer achievement of elementary students (but not middle-grade students). These changes in peer achievement do not appear to be driven by reductions in school attendance but other mechanisms that may affect student performance in the presence of greater student misbehavior among school or grade-level peers.
Conclusion
A robust body of correlational evidence finds large, negative associations between the receipt of any out-of-school suspension and academic achievement. 11 While we find that OSS adversely affects the academic achievement of suspended students, the estimated effect, though educationally significant, is much more modest that what is found in existing research. Furthermore, while some observers have argued that reforming school discipline policies and reducing the use of suspensions will have unintended negative consequences on the school and classroom environment experienced by nonsuspended peers (e.g., Petrilli, 2016), our results suggest that greater exposure to suspensions does not benefit peers.
For suspended students, the receipt of any suspension decreases test scores and the probability that students pass standardized math exams. One might be concerned that the effects on achievement are driven by the underlying misbehaviors that lead to suspension, and not the suspension itself. If this were the case, we would expect to see differences in the effects on achievement following more serious misbehaviors compared with less serious, classroom disorder incidents. Yet we find that the magnitude of the effect of classroom disorder suspension on student achievement is similar to the effect of suspension for more serious infractions. This suggests that the effect is likely driven by the suspension, and not the severity of the underlying behavioral infraction. However, since the IV approach provides more robust identification for classroom disorder OSS than for all OSS, the similarity in estimated effect sizes may not fully capture differences in the true effect of more serious OSS compared with OSS for less serious, classroom disorder infractions.
Although the existing literature suggests mechanisms connecting suspensions to achievement—declines in achievement following suspensions may be due to missed instruction and increased disengagement from school—we acknowledge that we cannot determine whether students would experience the same decline in achievement following a misbehavior that, alternatively, was or was not followed by a suspension. Indeed, our empirical approach does not allow us to disentangle the mechanisms through which suspensions affect student outcomes.
Several factors may play a role in explaining grade-level (i.e., middle vs. elementary) variation in the effect of classroom disorder OSS on achievement. First, not only are student discipline problems more prevalent in middle than elementary school, classroom disorder infractions often increase more than other types of infractions during the transition to middle school (Theriot & Dupper, 2010). Increases in discipline problems in middle school have been linked to developmental processes that occur in early adolescence, the increasing influence of peers on individual student behavior, and stress-related transitions from elementary to middle school, all of which are correlated with student achievement. Students also report lower levels of academic, emotional, and physical self-concept and self-esteem after transitioning to middle school (Coelho, Marchante, & Jimerson, 2017). While increases in reported discipline problems in middle school may in part be due to worsening student behavior, they may also be due to shifting expectations for acceptable classroom behavior (Galván, Spatzier, & Juvonen, 2011). In elementary school, students remain in the same classroom with the same teacher all day; as a result, students and teachers may find ways to communicate and manage behavior over the course of the school year that prevents escalation of incidents to office referrals. In middle school, students change classrooms and teachers each period and are expected to exercise greater independence; as a result, teachers likely have less knowledge of specific students and differ in their expectations for behavior, resulting in more frequent use of disciplinary action for subjective incidents such as classroom disorder. The combination of higher rates of misbehavior, lower self-esteem and self-concept, and heightened teacher expectations may result in a larger effect of OSS on the achievement of middle-school students.
We also find little response to suspensions on the monthly attendance of suspended students, on average. However, elementary school students who are suspended for classroom disorder experience modest increases in absences in the following month (0.25 monthly days absent, or 90 fewer minutes of instruction time per month, on average), that do not appear to translate into declines in achievement. To put this effect size in context, a study of the impact of learning time on elementary student achievement found that a loss of 15 minutes of instruction per day over the course of a year (or about 252 minutes per month) results in a very modest 1% decrease in a school-level academic performance index (Jez & Wassmer, 2015). 12 Among a sample of fourth- and fifth-grade students in North Carolina, Gershenson, Jacknowitz, and Brannegan (2017) find that, controlling for unobserved student-level heterogeneity, an additional absence day is associated with significant (though modest) declines in math and ELA, on the order of 0.005 and 0.003 standard deviations, respectively. Based on results from Gershenson et al. (2017), the effect of classroom disorder OSS on student absences in Philadelphia would translate into, at most, a decline in math and ELA achievement of 0.013 and 0.008 standard deviations, respectively, if the monthly effect on absences was annualized (i.e., 0.25 monthly absence days annualized to equal 2.5 absences based on a 10-month academic calendar). Nonetheless, the modest increase in absences is notable because each additional day of a suspension increases the number of unexcused absences among these younger students, with increases in excused absences following the fourth (or more) day of suspension. These results might reflect disengagement from school among younger children who are suspended (via unexcused absences), and the possibility that these students’ parents may view the school as unsupportive of his or her child (via excused absences).
Given that the achievement and attendance estimates are robust to IV models leveraging the district-wide policy change in suspension use for classroom disorder infractions, our results provide rigorous evidence of the magnitude of the effect of suspensions on student outcomes. These results should prompt school administrators and policymakers to consider the utility of assigning suspensions for low-level, nonviolent infractions such as classroom disorder, given the consistent negative effects on achievement. This is in light of the increasing use of suspensions nationally for less serious, nonviolent student misconduct.
Our findings do not support the claim that greater exposure to suspensions via the removal of students from school through out-of-school suspension benefits peers. Indeed, exposure to suspensions for more serious infractions is related to declines in peer achievement, though these estimates are modest, and we find no change in peer absences. Furthermore, we find no relationship between exposure to classroom disorder OSS and peer achievement or absences. Therefore, the estimated relationship between OSS and peers likely reflect broader levels of disorder in the school or classroom that are related to the prevalence of suspensions, a finding supported by other studies that show that school-level suspension rates are related to student feelings of safety (Lacoe, 2015; Steinberg et al., 2011) and achievement (Perry & Morris, 2014). To the extent that exposure to classroom disorder OSS is capturing nonviolent misbehavior in the classroom, we find that exposure to classroom disorder infractions is not related to peer achievement, providing further evidence that the use of OSS as a consequence for low-level infractions likely harms the suspended student with no benefit to their peers.
Of course, the ways in which discipline policy is implemented at the school-level is an important factor in the perceptions, behavior, and performance of students. For instance, Way (2011) finds that schools with more rules and higher perceived strictness have more disruptive behavior, while Arum (2003) finds that students only feel safe in schools where they perceive discipline policies to be both strict and fairly implemented. Communicating the disciplinary regime clearly to the entire student body and implementing responses to misbehavior in a fair and equitable manner are approaches school administrators may use to potentially improve student perceptions of discipline and mitigate the small, negative effects of exposure to suspension on peer achievement.
Although suspensions have negative effects on student outcomes, more research is needed to investigate the effects of alternative discipline policies and practices that address student misbehavior. Promising approaches with a growing evidence base, such as Positive Behavioral Interventions and Supports (PBIS), aim both to prevent misbehavior by identifying and addressing discipline problems early and fostering school climates that promote positive behavior and fair responses to student misconduct (Bradshaw, Mitchell, & Leaf, 2010; Horner et al., 2009). Still more information is needed about how these approaches work in school settings across the country that serve different student populations, which approaches are most appropriate and effective at the elementary level compared with middle and high school levels, and how schools and districts can provide appropriate training and support for school administrators and teachers to fully implement such alternatives. Such efforts are necessary in an attempt to minimize the negative consequences of suspensions on both suspended students and their school peers.
Supplemental Material
EEPA794897_Online_appendix_CLN – Supplemental material for Do Suspensions Affect Student Outcomes?
Supplemental material, EEPA794897_Online_appendix_CLN for Do Suspensions Affect Student Outcomes? by Johanna Lacoe and Matthew P. Steinberg in Educational Evaluation and Policy Analysis
Footnotes
Acknowledgements
The authors thank Joshua Cowen and two anonymous reviewers at Educational Evaluation and Policy Analysis for detailed comments, conference participants at the Association for Public Policy Analysis and Management (APPAM) and Association for Education Finance and Policy (AEFP), and seminar participants at the University of Arkansas, Department of Education Reform Lecture Series for helpful comments and discussions, and the School District of Philadelphia for providing the data used in this article.
Authors’ Note
Authors contributed equally.
Declaration of Conflicting Interests
The author(s) declared no potential conflicts of interest with respect to the research, authorship, and/or publication of this article.
Funding
The author(s) received no financial support for the research, authorship, and/or publication of this article.
Notes
Authors
References
Supplementary Material
Please find the following supplemental material available below.
For Open Access articles published under a Creative Commons License, all supplemental material carries the same license as the article it is associated with.
For non-Open Access articles published, all supplemental material carries a non-exclusive license, and permission requests for re-use of supplemental material or any part of supplemental material shall be sent directly to the copyright owner as specified in the copyright notice associated with the article.