
Abstract
Performance funding in higher education is intended to incentivize increased degree production at American colleges and universities by linking state funds directly to institutional outcomes. However, many critics suggest that such funding arrangements create systems of “winners and losers” by rewarding some institutions over others. Using a difference-in-difference methodology, this article explores the impact of performance funding on state appropriations and investigates the heterogeneous treatment effects across institution types. I find that performance funding consistently benefits high-resource institutions and imposes financial burdens on low-resource institutions. The theory of social construction and policy design illuminates the findings.
Introduction
Declining state financial support for public higher education and the growing demand for college graduates have resulted in a resurgence of performance funding policy implementation over the past decade. Viewed as a policy solution for these two key issues in U.S. higher education, performance funding provides both a financial incentive and an accountability mechanism for postsecondary improvement by linking state appropriations directly to institutional outcomes. The underlying theory of action behind performance funding is rooted in resource dependency: Financial incentives will lead to changes in institutional behavior that will ultimately improve student outcomes. However, very little of the performance funding literature addresses the actual restructuring of state funds as a result of these incentives. Although scholars have begun to explore the impact of incentive policies on higher education resources (Hillman & Corral, 2017; Kelchen & Stedrak, 2016; Rabovsky, 2012), most of the performance funding–related research is devoted to policy development and implementation (e.g., McLendon, Hearn, & Deaton, 2006), impact on institutional behavior (e.g., Dougherty & Reddy, 2011), and overall effectiveness regarding the improvement of student outcomes (e.g., Tandberg & Hillman, 2014).
Not only does restructuring state funding constitute the underpinnings of performance funding, the primary arguments in favor of and in opposition to performance funding are rooted in potential financial outcomes that largely remain untested. For example, some argue that performance funding offers institutions the opportunity to earn new money, whereas others suggest that performance funding provides an excuse to reduce state funding for higher education (Dougherty & Reddy, 2011). Some researchers have suggested that performance funding policies create systems of winners and losers by financially favoring some institutions over others (Rabovsky, 2012). Finally, some scholars have speculated that performance funding may have little to no impact on state funding for higher education. Instead, these policies may serve a symbolic purpose by giving the appearance of accountability to appease the demands of external stakeholders without jeopardizing institutions’ resources (Rabovsky, 2012; Tandberg & Hillman, 2014). For these reasons, understanding the impact of performance funding on financial outcomes merits further attention.
This study investigates the treatment effects of performance funding policies on state appropriations per student at public, 4-year institutions. 1 It also examines the variation in treatment effects across institutional missions, levels of selectivity, student populations, and degree offerings. High-resource institutions likely fare better under performance funding policies than low-resource institutions because they typically perform well on common performance funding metrics and are better positioned to respond to performance funding policies given their access to nonstate resources, ability to attract high-achieving students, and capacity to make broad institutional changes. This study poses the following research questions:
I explore these research questions through the lens of social construction and policy design theory (Schneider & Ingram, 1993), which explains how public policy can distribute both benefits and burdens to various target populations. I utilize a difference-in-difference (DD) research design and a panel data set constructed from publicly available data sources. The data span the years 1986 through 2014 and include 428 institutions. This study contributes to the performance funding literature by establishing state funding patterns associated with performance funding implementation and determining the extent to which performance funding favors some institutions over others.
Literature Review
Performance funding for higher education is typically defined as a direct connection between institutional outputs or outcomes and state appropriations (Hearn, 2015). Policymakers assume that financial incentives will encourage institutional leaders to change behaviors (i.e., implement new programs and support services), which will then lead to improvements in outcomes tied to funding, such as retention and graduation rates, licensure exam scores, faculty productivity, and job placement (Burke, 2001).
Performance funding operation has waxed and waned considerably since the late 1970s, when the first performance funding policy was implemented in Tennessee. Following the initial wave in the early 1990s, many performance funding programs were abandoned due to insufficient state funds, turnover in state leadership, complicated formulas/metrics, inadequate data and challenges in data collection, and opposition from higher education communities (Dougherty, Natow, & Vega, 2012). A renewed interest in performance funding emerged in the mid-2000s, due in part to tightening state budgets, rising cost of higher education, and the increasing focus on improving college completion (Dougherty & Natow, 2015; Jones, 2015). Currently, there are 35 states operating performance funding policies in the United States (Hillman, Fryar, & Crespin-Trujillo, 2018).
Adoption of performance funding policies is closely related to states’ political contexts, governance structures, and higher education costs and characteristics. Adoption of the early performance funding policies was largely a product of the accountability movement and also served as a mechanism to provide new money to higher education institutions (Dougherty et al., 2014). States that adopted early versions performance funding typically had Republican-controlled state legislatures and less centralized higher education governance structures (McLendon et al., 2006). The second wave of performance funding prioritized the improvement of institutional outcomes, rather than providing new money to institutions (Dougherty et al., 2014). Governors played a more central role in advocating for performance funding in the latest iteration of policy adoption (Dougherty & Natow, 2015). Furthermore, intermediary organizations, such as Complete College America, 2 have played a significant, and largely unprecedented, part in supporting and implementing the most recent performance funding policies (Gàndara, Rippner, & Ness, 2017).
Performance funding–related research suggests that these incentive policies are marginally, if at all, effective in terms of improving the outcomes that are tied to funding. For example, little to no effect is observed for degree production or graduation rates for associate’s or bachelor’s degrees (Hillman, Tandberg, & Gross, 2014; Hillman et al., 2018; Hillman, Tandberg, & Fryar, 2015; Li & Kennedy, 2018; Rutherford & Rabovsky, 2014; Tandberg, Hillman, & Barakat, 2014; Tandberg & Hillman, 2014). However, some scholars find performance funding had led to increases in short-term certificates—credentials that are the simplest and fastest to produce (Hillman et al., 2018; Hillman et al., 2015; Li, 2018).
Alternative or unintended institutional responses to performance funding have also been a topic of interest among performance funding scholars. Researchers find that in some cases institutions become more selective under performance funding policies. For example, Umbricht, Fernandez, and Ortagus (2017) found that performance funding in Indiana led to decreased admissions rates and increased selectivity at public universities. Kelchen and Stedrak (2016) suggested that institutions subject to performance funding policies may be strategically targeting wealthier students, evidenced by declines in revenues from Pell Grants and changes in institutional expenditures on student financial aid. This strategy of becoming more selective improves outcomes such as retention, progression, and graduation by admitting students who are most likely to perform well with little institutional intervention or support. This strategy also requires institutions have the ability to become more selective and recruit high-achieving students—an option not likely available to institutions with limited resources.
Indeed, Zumeta and Li (2016), in their study of performance funding in Ohio and Pennsylvania, found that high-resource institutions are advantaged by their ability to “attract non-state resources” and their marketability to recruit students and “increase revenues from tuition” (p. 10). As such, they find differences in institutional capacity to respond adequately to performance funding demands. According to their findings, high-resource institutions not only have greater, more varied financial resources, but they also have highly qualified staff and the ability to assess and improve performance outcomes among their student population.
Similarly, Dougherty et al. (2016), in their study of 18 colleges and universities subject to performance funding, found variations in institutional responses to performance funding based on institutional type and institutional capacity (measured by per-student revenue, data-analytic resources, and portion of at-risk students). Specifically, the authors found that low-capacity institutions were much more likely to report obstacles to meeting performance funding objectives, compared with their high-capacity institution counterparts. The most often reported obstacle was student body makeup (i.e., student academic preparedness) and institutional resources (especially in terms of data analytics).
Similarly, Callahan, Meehan, and Shaw (2017) found institutional responses to performance funding policies varied widely across institution types in Tennessee, Indiana, and Ohio. For example, 4-year institutions focused resources on degree completion whereas 2-year institutions concentrated on underserved populations. Notably, highly selective institutions did not exhibit changes in behavior (e.g., program implementation, redirection of resources) in response to performance funding, likely due to the availability of other stable revenue sources and existing satisfactory performance outcomes.
Birdsall (2018) found that institutional dependency on state resources has a conditioning effect on the impact of performance funding. Institutions that are less dependent on state funding exhibited gains in graduation rates, whereas more dependent institutions did not. The author suggests that resource dependent institutions have less capacity for change or capacity to identify solutions to performance-related problems than institutions with alternative revenue sources.
This body of research suggests that under performance funding policies, high-resource institutions are indeed advantaged over low-resourced institutions in a variety of ways. High-resource institutions are able to leverage existing capacity to directly respond to performance funding as intended (i.e., targeted student success initiatives). They are able to become more selective and improve outcomes by recruiting high-ability students. High-resource institutions can also maintain the status quo by relying on nonstate revenue sources. As such, it is reasonable to expect that performance funding could exacerbate institutional funding inequities.
Jones et al. (2017) argued that performance funding policies perpetuate existing funding inequities between minority-serving institutions (MSIs) and their predominately White institution (PWI) counterparts. According to this research, many MSIs experienced declines in funding following performance funding implementation, whereas the institutions that received the greatest per-student funding from the state also had the greatest endowment and other nonstate resources. Due to historic underfunding, discrimination, and performance funding policies’ lack of consideration of the particular missions of MSIs, these institutions are often disproportionally disadvantaged relative to PWIs. Jones et al. (2017) noted that other structural disadvantages, for instance, lacking authorization to offer degrees in certain fields, also contributed to inequities in resources and capacity to meet performance funding goals.
Similarly, Hillman and Corral (2017) examined the impact of performance funding policies on state appropriations for MSIs. The authors find that MSIs are more likely to lose state funding relative to non-MSIs. In addition, MSIs subject to performance funding receive less state funding than MSIs in non–performance funding states.
Regarding the direct impact of performance funding on state appropriations, there are a few additional studies to mention. Rabovsky (2012) investigated the impact of performance funding policies on the relationship between state appropriations and institutional performance and found little connection between state-allocated funds and performance metrics. In fact, he found that even under performance funding policies, state appropriations were still strongly related to student enrollment. This is not surprising, however, as this study primarily examined the earlier types of performance funding policies, which were used in conjunction with enrollment-based funding formulas (Hearn, 2015).
Kelchen and Stedrak’s (2016) study is one of few that directly addresses the relationship between performance funding and state appropriations. These authors investigated the impact of performance funding policies on a variety of institutional revenue and expenditure patterns to determine responses to incentive policies. Most notably, the authors found that performance funding had a positive and significant impact on state appropriations, but this effect faded over time. In the year immediately following performance funding implementation, 4-year institutions subject to the policy received on average US$107 more per full-time equivalent (FTE) in state appropriations than did institutions not subject to the policy. However, employing a 2-year lag following implementation revealed negative effects or no effects on state appropriations per FTE.
This study seeks to better understand how state appropriations are restructured under performance funding policies. Given the evidence discussed above that suggests there are notable differences in institutional responses and ability to respond to performance funding, I expect to find heterogeneous policy effects on state funding across institutional types.
Conceptual Framework
Schneider and Ingram’s (1993) framework of social construction and policy design suggests that public policy will distribute benefits and/or burdens based on the social construction of target populations. The choice between distributing benefits or burdens is related to the political power and public opinion of the policy target such that politically powerful/positively viewed groups will often receive benefits, whereas politically weak/negatively viewed groups will likely incur burdens. Because performance funding policies can both reward and punish institutions, Schneider and Ingram’s (1993) framework helps explain the potential policy effects of performance funding on the redistribution of state appropriations.
There are four types of policy targets, according to the framework. At either end of the spectrum are the “advantaged” and the “deviants.” Advantaged policy targets are those that are both politically powerful and positively viewed (examples include veterans and business sectors). Conversely, deviants are politically weak and negatively viewed (examples include people who use drugs, burn flags, etc.). Policy instruments are generally chosen such that benefits are distributed to advantaged groups and burdens are distributed to the deviants. This arrangement is advantageous for policymakers because benefits for the advantaged will be well received by the group itself as well as the public, who finds the group deserving.
For target populations that are politically powerful but negatively viewed (“contenders”) or politically weak and positively viewed (“dependents”), tensions can arise for policymakers as they choose between political expediency and potentially damaging optics. Examples of “contenders” include wealthy individuals, large unions, or the “moral majority”; these groups have significant political power but are often viewed negatively by the public. Policymakers will be torn between distributing benefits to please the group and burdens to please the public. Examples of “dependents” include children, mothers, and people with disabilities. Although these groups are positively viewed by the public, they are often unorganized and unable to exercise political influence. 3 As such, policymakers will similarly experience tension between distributing benefits that will be publicly supported, but will have a difficult time gaining political momentum.
Within this framework, consider the political power and public opinion of higher education in the United States. Generally speaking, colleges and universities have been historically autonomous from legislative control. Higher education’s professional and specialized workforce, complex organizational structure and production technology, use of peer review for quality control, and diminishing reliance on state fiscal resources prevent strict oversight from the state into the affairs of higher education (Lane & Kivisto, 2008). Furthermore, scholars have shown that higher education lobbyists and interest groups are successful in securing state funding (Ness & Tandberg, 2013; Tandberg, 2006, 2007) and politically connected institutions accumulate financial benefits from their political power (McLendon, Mokher, & Doyle, 2009). However, as higher education has come under increased scrutiny (Alexander, 2000; Zumeta, 1998) and is more vulnerable to budget cuts than other state services (Tandberg, 2007), higher education may be weakening in its political power.
Regarding public perception of higher education, views tend to fall along partisan lines. The Pew Research Center (2017) finds an increasing divide: 72% of Democrats said colleges and universities have a positive effect on the county (compared with only 36% of Republicans), whereas 58% of Republicans said colleges and universities have a negative effect on the county (compared with only 19% of Democrats).
It is important to consider the potential differences in social constructions of higher education institutions of various missions, selectivity, and student bodies as higher education institutions certainly vary in their political power and public perception. Politically powerful institutions are typically those that are highly resourced and less dependent upon state funding. Such institutions include research universities; prestigious/selective institutions; and institutions with stable undergraduate enrollment, wealthier students and alumni, and larger endowments. Moreover, high-resource institutions tend to have exemplary performance outcomes like degree completion, an advantageous characteristic in the context of performance funding. Conversely, politically weak institutions are more dependent upon state resources and tend to struggle under performance funding policies, in terms of both past success rates and capacity for institutional change: institutions that are open access/nonselective, have more contingent faculty, enroll more “at-risk” students, experience unstable enrollment, and have low success rates.
The public opinion of specific institution types is less straightforward, however. Research universities may be positively viewed because they typically have higher student success rates and may be seen as more “deserving” of state funding. Alternatively, these institutions may be viewed negatively—as elitist, liberal, too expensive, and inaccessible. They may be seen as undeserving of state funds because they have less financial need. Open access institutions, on the contrary, might be negatively viewed for unsatisfactory student success rates and thus seen as undeserving of state support. Alternatively, perhaps they are positively viewed as providing access to higher education and serving underrepresented populations.
Social constructions of the student populations that institutions enroll may also play a part in how postsecondary institutions are viewed. For instance, low-income and minority students are often negatively constructed. Consider Schneider and Ingram’s (1993) example of low-income students having to jump through excessive hoops to prove they are poor to receive financial aid. Moreover, that general trends in financial aid policy have shifted to benefit middle- and upper-middle class students and families—broad-based merit-aid programs, tax credits, and expansion of federal loans to wealthier families (Dynarski, 2002; Ness, 2010)—also indicate a preference for higher income students. Finally, policies that unfavorably target undocumented students (Reich & Mendoza, 2008) and the historic mistreatment of MSIs also demonstrate negative social constructions of institutions that serve racial and ethnic minorities.
This framework suggests, in the context of the present study, both the political power and the public opinion of higher education institutions will inform the design of performance funding policies such that funding will be redistributed toward favorable institutions and away from unfavorable institutions. I expect that policymakers will use performance funding to reward high-resource institutions over low-resource institutions due to a more favorable construction of high-resource institutions as a policy target. I also expect to find differences in institutional favorability across political party lines such that performance funding redistributes state appropriations differently in Republican-led states compared with Democratic-led states.
Data and Method
I assembled a panel data set from a variety of public sources, including the Integrated Post-secondary Education Data System (IPEDS), State Higher Education Executive Officers (SHEEO), National Association of State Budget Officers (NASBO), National Association of State Student Grant and Aid Programs (NASSGAP), Southern Regional Education Board (SREB), Education Commission of the States (ECS), National Governor’s Association (NGA), U.S. Bureau of the Census, U.S. Bureau of Labor Statistics (BLS), and the Bureau of Economic Analysis (BEA). The panel consists of 47 U.S. states 4 and the public, 4-year institutions therein, and spans 1986 to 2014.
My sample consists of 428 public, 4-year institutions. I excluded medical schools, 4-year schools that granted primarily associate’s degrees, institutions that received little to no state funding (military institutions, tribal institutions), and institutions in Pennsylvania that are not a part of the Pennsylvania System of State Higher Education. 5 I excluded institutions whose state appropriations per student was below the first percentile or above the 99th percentile of the sample to prevent these outliers from influencing the findings. Finally, for the small number of institutions that reported data to IPEDS in a parent–child arrangement, institution-level data were collapsed to the parent reporting level as described by Jaquette and Parra (2014).
Dependent Variable
The primary dependent variable for this study is state appropriations per student, 6 taken from IPEDS. To determine whether or not certain types of institutions are favored financially over others under performance funding, I restricted the analysis to the following institution types: research universities and master’s and baccalaureate institutions; highly selective, less selective, and nonselective institutions; MSIs; and rural institutions.
Independent Variables
The independent variable of interest in this study is the implementation of performance funding which is equal to 1 in the states and years in which performance funding policies are funded and 0 otherwise. See Table 1 for states/years of performance funding implementation.
States With Performance Funding Policies for 4-Year Institutions, 1994–2014
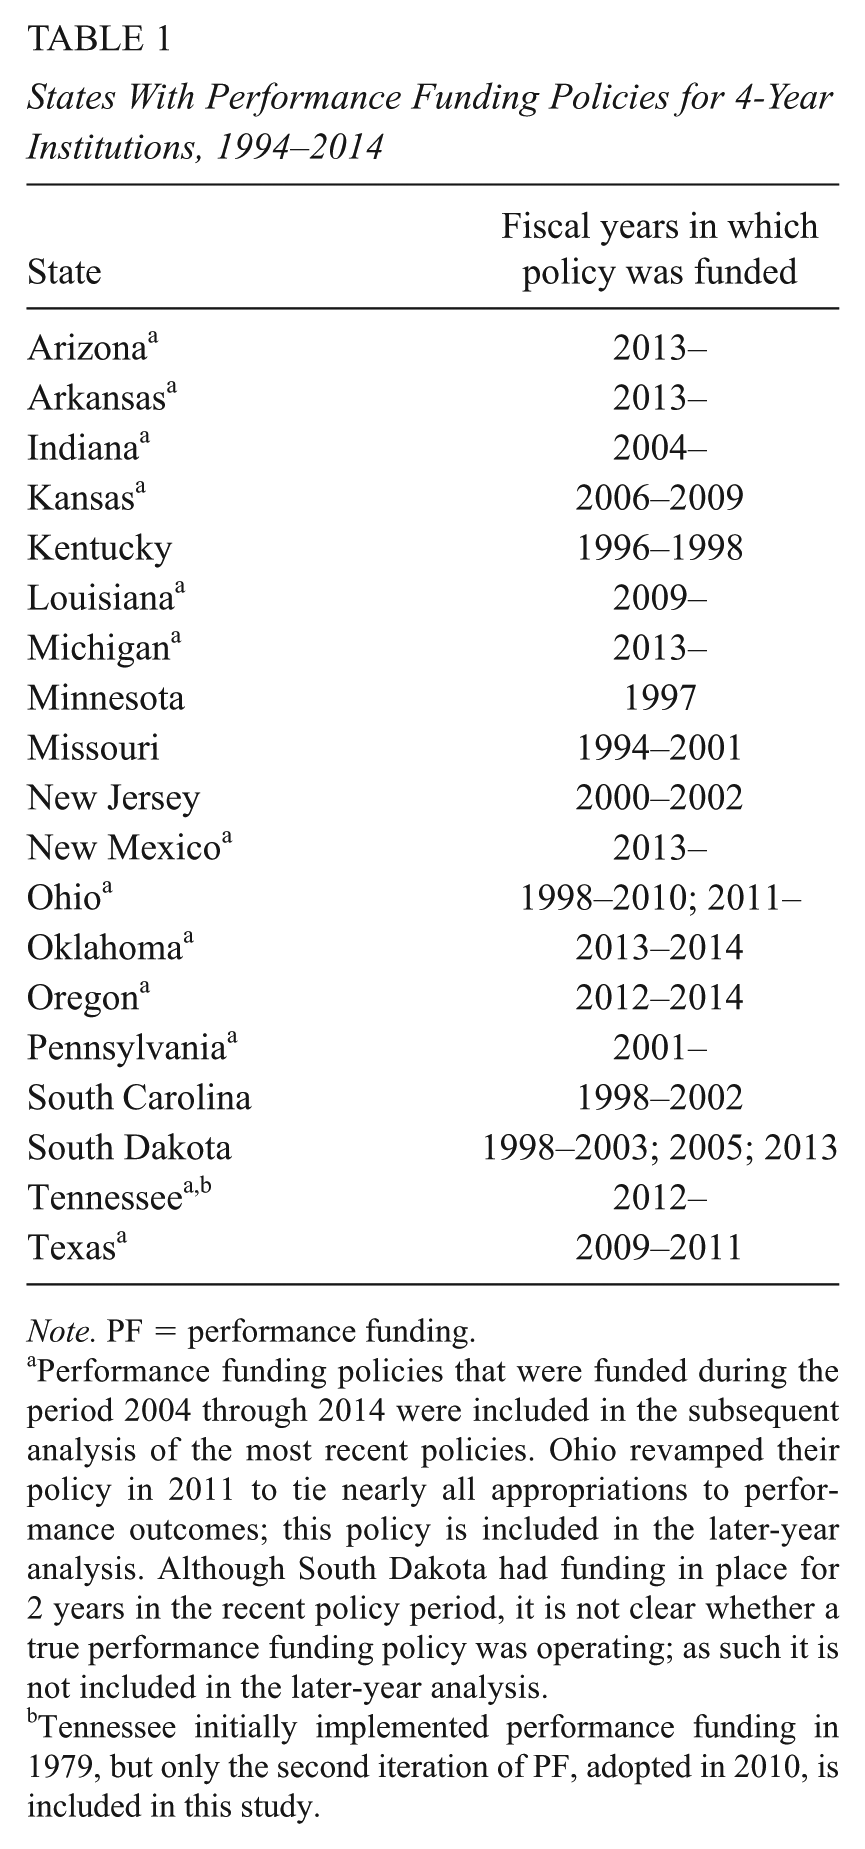
Note. PF = performance funding.
Performance funding policies that were funded during the period 2004 through 2014 were included in the subsequent analysis of the most recent policies. Ohio revamped their policy in 2011 to tie nearly all appropriations to performance outcomes; this policy is included in the later-year analysis. Although South Dakota had funding in place for 2 years in the recent policy period, it is not clear whether a true performance funding policy was operating; as such it is not included in the later-year analysis.
Tennessee initially implemented performance funding in 1979, but only the second iteration of PF, adopted in 2010, is included in this study.
State-Level Control Variables
There are a variety of state conditions and characteristics that influence funding for higher education. Accordingly, the models employed in this study control for state economic conditions, population demographics, political factors, and higher education system characteristics. Scholars have consistently shown that states with healthier economies spend more on higher education (Kane, Orszag, Apostolov, Inman, & Reschovsky, 2005; Lowry, 2001; McLendon, Hearn, & Mokher, 2009). To control for states’ economic conditions, I include unemployment rate, per capita gross domestic product (GDP), and per capita personal income as covariates.
State population demographics are also related to higher education spending. For instance, higher education participation rates are associated with the age distribution of a state’s population and the educational attainment of its citizens (Tandberg, 2010). States with greater educational attainment will not only have higher postsecondary participation rates but also greater political support for spending taxpayer dollars on higher education. The models used for this study control for the portion of the state’s population that is of traditional college age (aged 18–24 years) as well as the portion of the state’s adult population (aged 25–64 years) with a bachelor’s degree or higher.
Scholars have found that states with higher proportions of Republican-controlled states (Republican governor and/or higher proportion of Republican legislators) tend to spend less in general and spend less on higher education in particular than Democratic-controlled states (McLendon, Hearn, & Mokher, 2009). As such, I include the proportion of Republican legislators and whether or not the governor is Republican.
Characteristics of higher education systems will importantly affect state spending effort for postsecondary education. States with greater participation in the 4-year sector or the public sector will typically spend more on higher education appropriations (McLendon, Mokher, & Doyle, 2009). I include controls for the percentage of postsecondary students enrolled in public institutions and 4-year institutions. States that spend more on financial aid may spend less on higher education in the form of appropriations, so I include controls for state financial aid per college-aged person in the state as well as percentage of state financial aid that is need-based. Tuition rates typically have an inverse relationship with higher education appropriations (Koshal & Koshal, 2000). I control for net tuition revenue per FTE; this accounts for one of the largest sources of revenue for institutions, net of institutional aid. These higher education control variables are lagged by 1 year, due to the timing of state budget decisions.
Finally, given that higher education is often thought of as the “balance wheel” of state budgets (Delaney & Doyle, 2011; Hovey, 1999), I include controls for other major areas of state spending, namely, K–12 education and Medicaid. As spending in these other areas increase, states will often decrease funding to higher education to balance the budget.
Institution-Level Control Variables
I also control for a variety of institutional inputs that are known to affect state appropriations: total fall enrollment, percentage of graduate students enrolled, average faculty salary, and percentage of full-time faculty. I also control for revenue from tuition and fees as well as the percentage of institutional revenue from state appropriations to account for institutions’ dependence on state resources. In addition, student population characteristics are correlated with institutional performance and available resources. I include controls for the portion of undergraduates that are enrolled part-time (a potentially at-risk population) and the portion of undergraduate minority students. Each of these institution-level variables is lagged by 1 year to account for the timing of state budget cycles. All financial data are provided in 2014 constant dollars. See Supplemental Table A1 in the online version of the journal for a complete list of variable definitions and sources.
Method
Policy analysis or program evaluation studies often employ a DD estimation strategy, which “treats the introduction of [a policy] as a plausible source of exogenous variation” (Tandberg & Hillman, 2014, p. 230). This approach compares changes in outcomes before and after policy implementation for a treated group (exposed to treatment or subject to the policy) and for a control group (not exposed to treatment). This quasi-experimental research design removes bias that may result from permanent differences between the treated and control groups or from trends over time (Wooldridge, 2007). The DD framework assumes that the differences observed between groups and over time are caused by the policy implementation and that nothing else influenced the observed change. As such, the treated and control groups should exhibit similar trends in the pretreatment period so that changes observed posttreatment can be attributed to the policy implementation, otherwise known as the parallel trends assumption (Delaney & Kearney, 2015). This is a rather strong assumption, however, and must be tested through the utilization of well-defined control groups and a series of robustness checks.
Treated units are defined as public, 4-year institutions subject to a performance funding policy. Institutions are counted as treated (n = 219) for the years in which their states’ performance funding policy was funded. The pre- and posttreatment periods vary across states, so there is no single pretreatment or posttreatment period for this study. I created a policy variable that indicates the period(s) in which each policy is funded in each treated state.
To identify treated states and periods of treatment, I utilized existing literature (Snyder & Fox, 2016; Tandberg & Hillman, 2014), state budget documents, legislative bills, and state and system-level higher education policy briefs. In addition, I corresponded with higher education officials in various states to establish the implementation periods of the policies.
In total, 19 states implemented performance funding policies targeting 4-year institutions from 1994 to 2014 (see Figure 1). While the policies in place in the early 1990s differ from those implemented more recently, it is important to have a comprehensive understanding of how these policies have affected state appropriations. However, to determine treatment effects for the most recent and relevant policies, I conduct subsequent analyses solely for the policies in operation from 2004 to 2014.
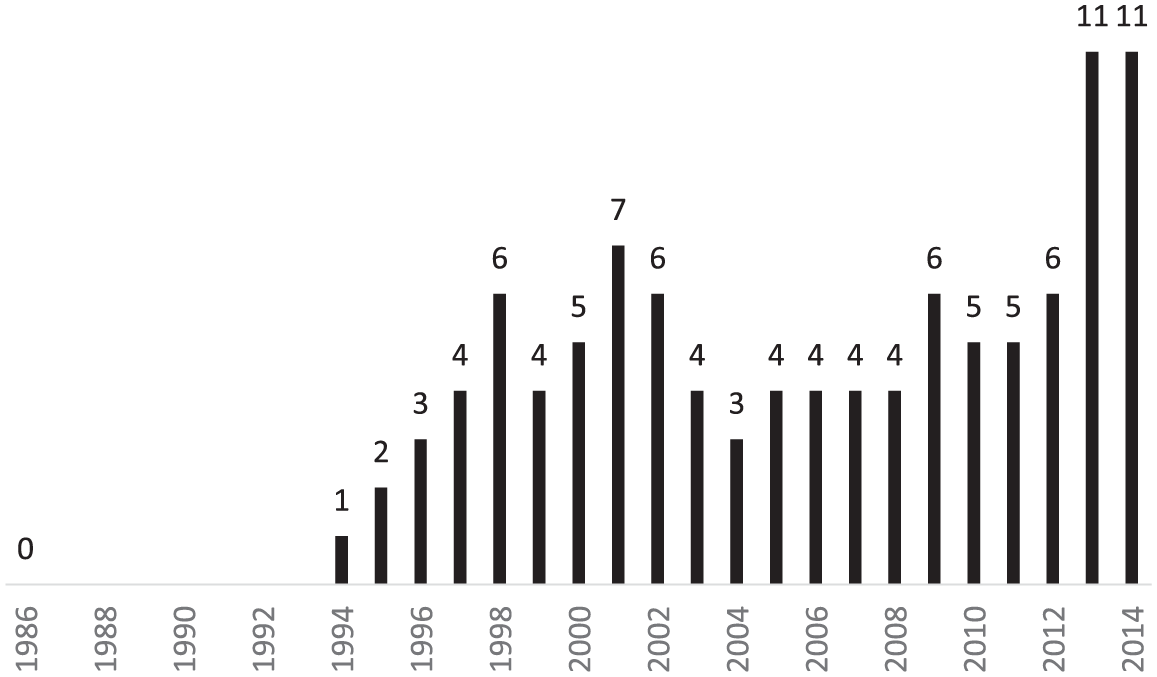
Number of states implementing performance funding policies, 1986–2014.
The control group, or the counterfactual, demonstrates what would have happened in the absence of treatment. The primary counterfactual utilized in this study includes all public, 4-year institutions never subject to performance funding policies (n = 209). Subsequently, I explore additional, more narrowly defined counterfactuals in an effort to reduce baseline differences between treated and control groups. For example, given that states with less centralized governing arrangements and Republican-controlled states are more likely to adopt performance funding policies, I compare treated and control institutions in states with consolidated governing boards and coordinating boards and in Republican-controlled and Democratic-controlled states.
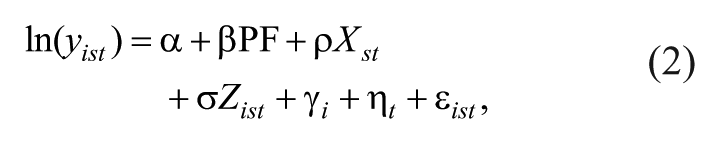
The primary model I employ is as follows:

where yist is the outcome for institution i in state s in year t. PF is the policy variable of interest that is equal to 1 for treated institutions during the period the performance funding policy was funded. The coefficient of the policy variable of interest is interpreted as the change in state appropriations per student before and after performance funding implementation for institutions subject to performance funding relative to non–performance funding institutions.
This model also controls for the state-level variables (Xst) and institution-level control variables (Zist) described above as well as institution fixed effects (γ i ) and year fixed effects (η t ). Institution fixed effects are unobserved, time-invariant characteristics that can affect the outcome variables (e.g., prestige). Similarly, year fixed effects vary over time, but do not vary across states and institutions (e.g., influence of federal policies). The institution and year fixed effects reduce biases not accounted for in the other control variables (Wooldridge, 2007).
Due to the panel design of this study, the error term (ε ist ) is serially correlated, meaning the error in Year 1 is correlated with the error in Year 2, and so on. This correlation can inflate standard errors and bias the estimates. To correct for this correlation, I cluster the standard errors at the institution level (Drukker, 2003; Imbens & Wooldridge, 2008).
I test the robustness of the models in a number of ways. First, I test the parallel trends assumption with a lead-lag analysis in which the treatment variable is replaced with a series of time dummy variables (1, 2, 3, 4, and 5+ years before and after policy implementation). Not only do these models allow me to test for preexisting trends, they also show the long- and short-term effects of performance funding. Next, I add state-specific linear time trends in the DD models, which allow the trajectory of dependent variable to vary in the pretreatment period (Angrist & Pischke, 2015). In addition, I determine whether the results of the linear models are robust to a logarithmic transformation of the dependent variable to ensure that the linear model specification is appropriate (Kahn-Lang & Lang, 2018). Finally, I employ alternative counterfactuals to reduce baseline differences between the treated and control groups, as mentioned above.
Limitations
As with all studies, there are a few limitations to mention. First, isolating the impact of the performance funding treatment is a challenge; although the approach I have outlined describes several ways in which I will account for confounding factors that influence state funding for higher education, there are still many unmeasured elements that are known to influence state appropriations for higher education. For example, these models do not account for other state-level higher education initiatives that are accompanied by new investments/divestments in higher education (i.e., Tennessee’s Promise initiative). Although the models described account for many of the known and measureable elements that influence state funding for higher education, for additional bias via state/institution and year fixed effects, and utilizes a variety of control group specifications to isolate the impact of treatment, there may be other elements unaccounted for that bias the results.
In addition, these models do not control for the portion of students receiving the Pell grant as the data are not available from IPEDS until 2008. While this is a notable omission in the models, the limited availability of the data prevents their inclusion in a meaningful way. Finally, performance funding policies vary notably from one another. Counting all policies as the same treatment may mask differential treatment effects across policy types.
Results
The findings of this analysis suggest that performance funding policies tend to benefit research universities and highly selective institutions while imposing financial burdens on nonresearch/non-highly selective institutions. These findings hold up to most alternative specifications and robustness checks. There are some notable differences in treatment effects across governing structures and political party.
Descriptive Summary
Summary statistics for the variables used in this study are presented in Table 2. On average, states spend US$6,456 per student (in 2014 constant dollars); however, performance funding states appropriate fewer dollars per student than non–performance funding states. In addition, institutions in performance funding states have slightly greater tuition and fee revenue on average, enroll a greater portion of part-time students, and have a lower average faculty salary compared with non–performance funding states. At the state level, performance funding states spend more on financial aid, have a smaller portion of need-based aid, and have greater portions of Republican state law makers compared with non–performance funding states.
M (SD) of Dependent and Independent Variables
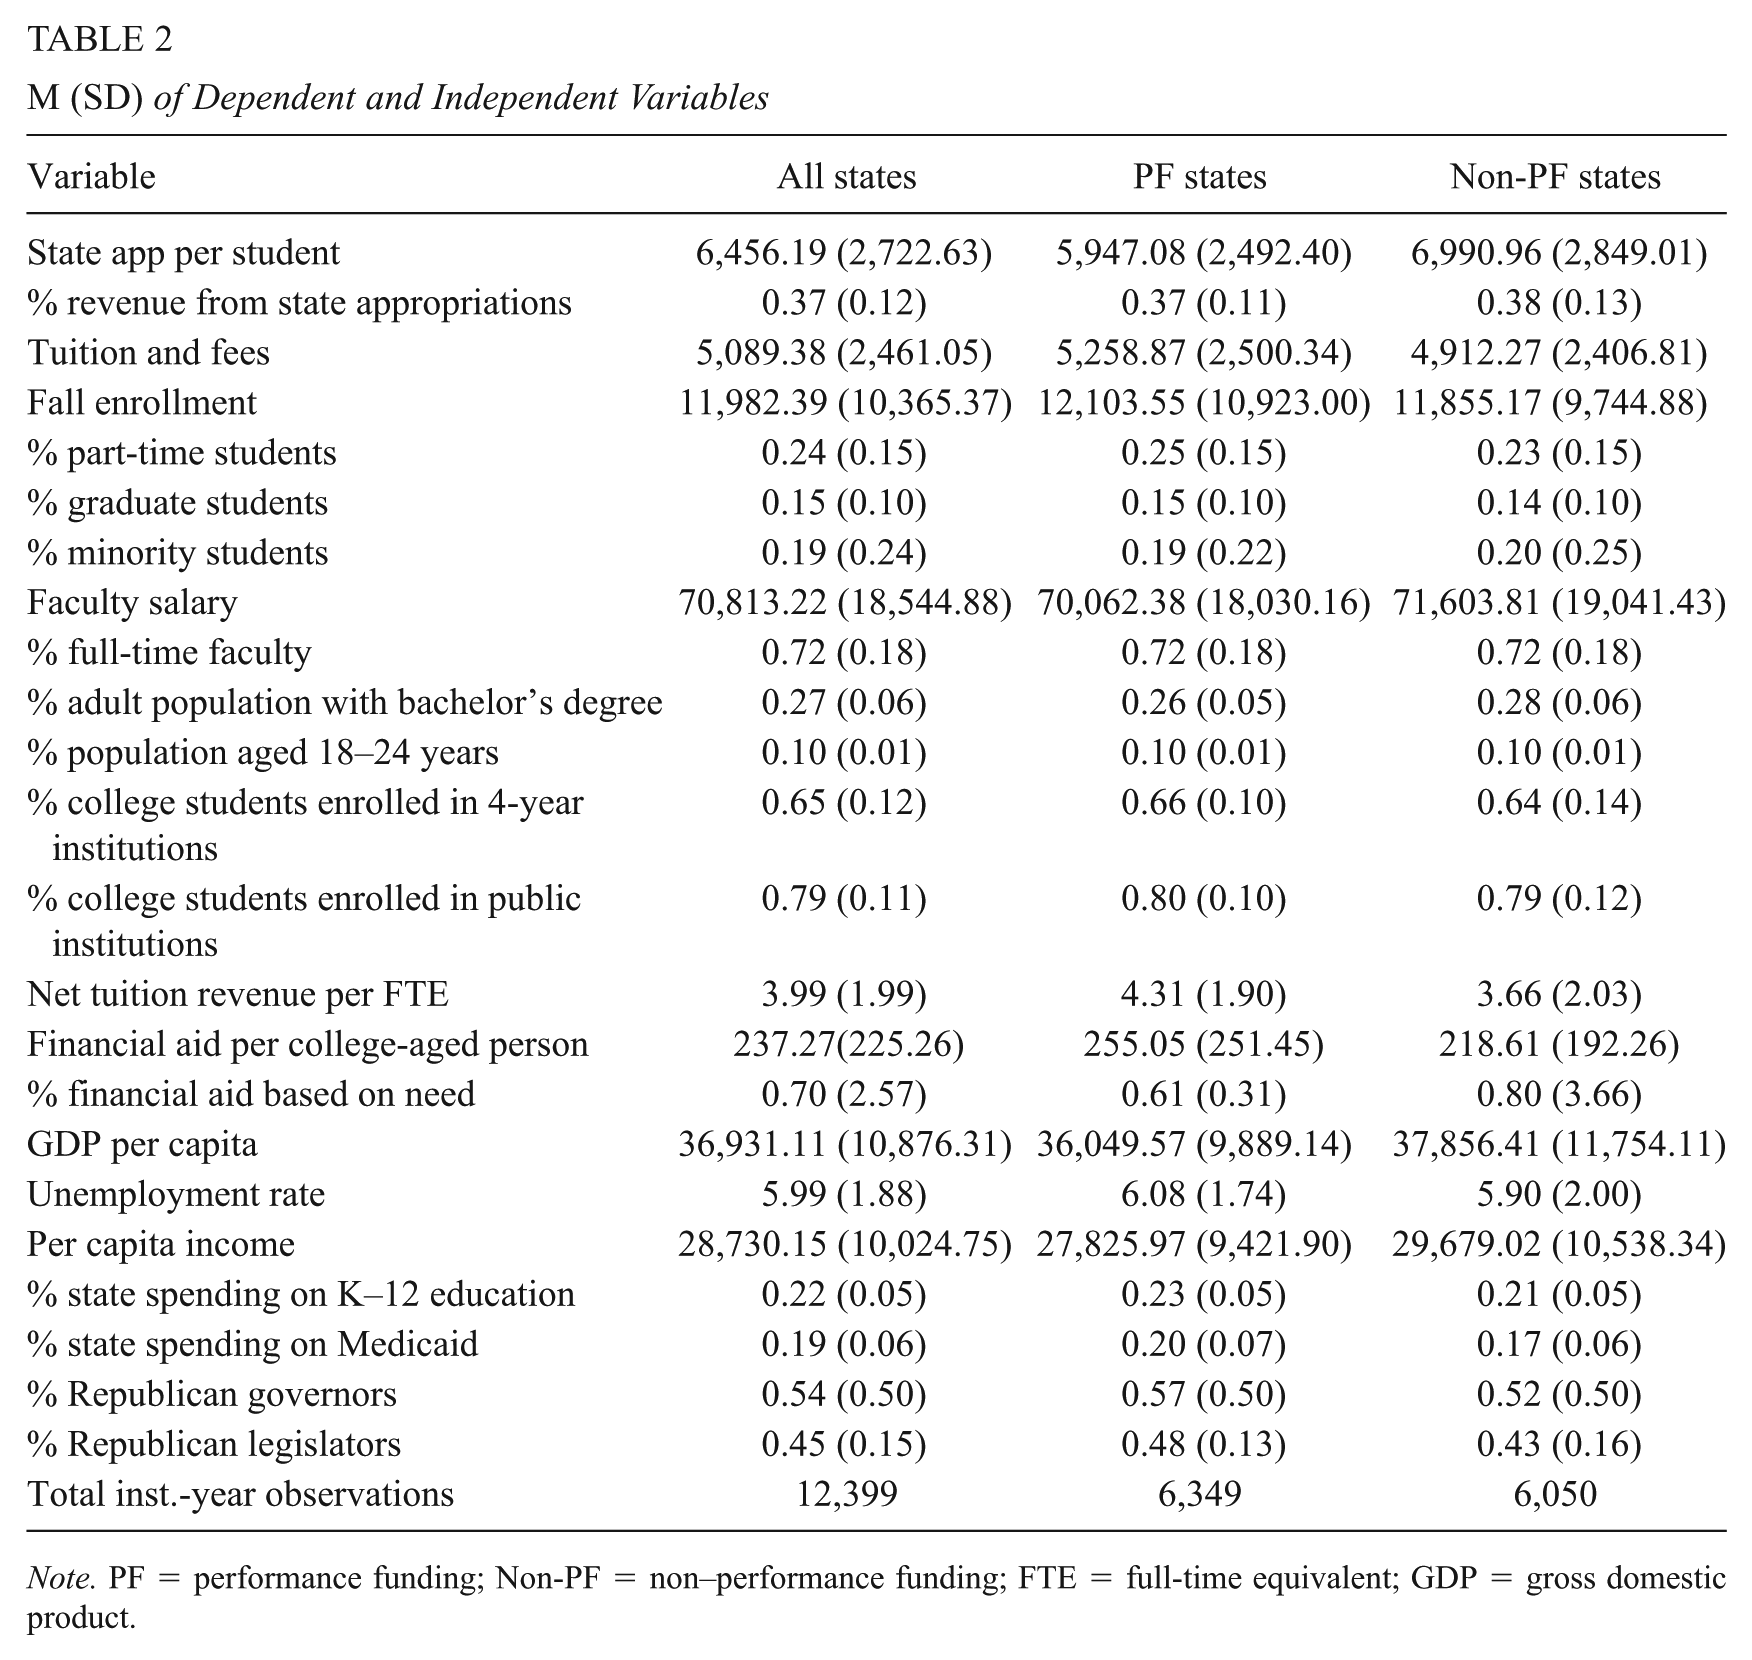
Note. PF = performance funding; Non-PF = non–performance funding; FTE = full-time equivalent; GDP = gross domestic product.
As mentioned above, when utilizing a DD estimation strategy, it is important to establish similar dependent variable trends in the pretreatment period between the treated and control groups. As such, Figure 2 illustrates average state appropriations per student over time between performance funding and non–performance funding states. On average, performance funding states have a similar trend in state appropriations per student compared with non–performance funding states, and performance funding states consistently spend less per student on average than non–performance funding states. Similar trends are also observed across institution types (see Supplemental Figure A1 in the online version of the journal). It is not surprising to see consistently less funding per student in performance funding states given that performance funding states are more likely to be Republican-led, spend more on K–12 education and Medicaid on average, and have higher average unemployment rates than non–performance funding states—all elements that are associated with lesser funding for higher education, as has been mentioned.
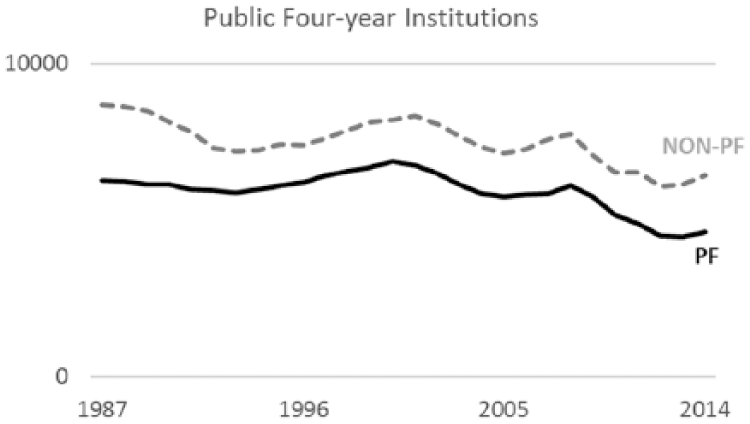
Average state appropriations per student in performance funding and non–performance funding states.
Despite differences in funding levels, it is not surprising to see that performance funding and non–performance funding states follow similar trends over time. Higher education funding across the states tends to follow the state economy rather predictably: When the economy is strong, higher education funding tends to increase or remain steady, and when the economy is weak/in recession, funding declines are often observed (Kane et al., 2005; Lowry, 2001; McLendon, Hearn, & Mokher, 2009). This is depicted clearly in Figures 2 and 3 as declines in average funding are associated with recessions in the early 1990s, early 2000s, and 2008. Although there are noteworthy differences across states, and between the treated and control group, the trends over time are quite similar.
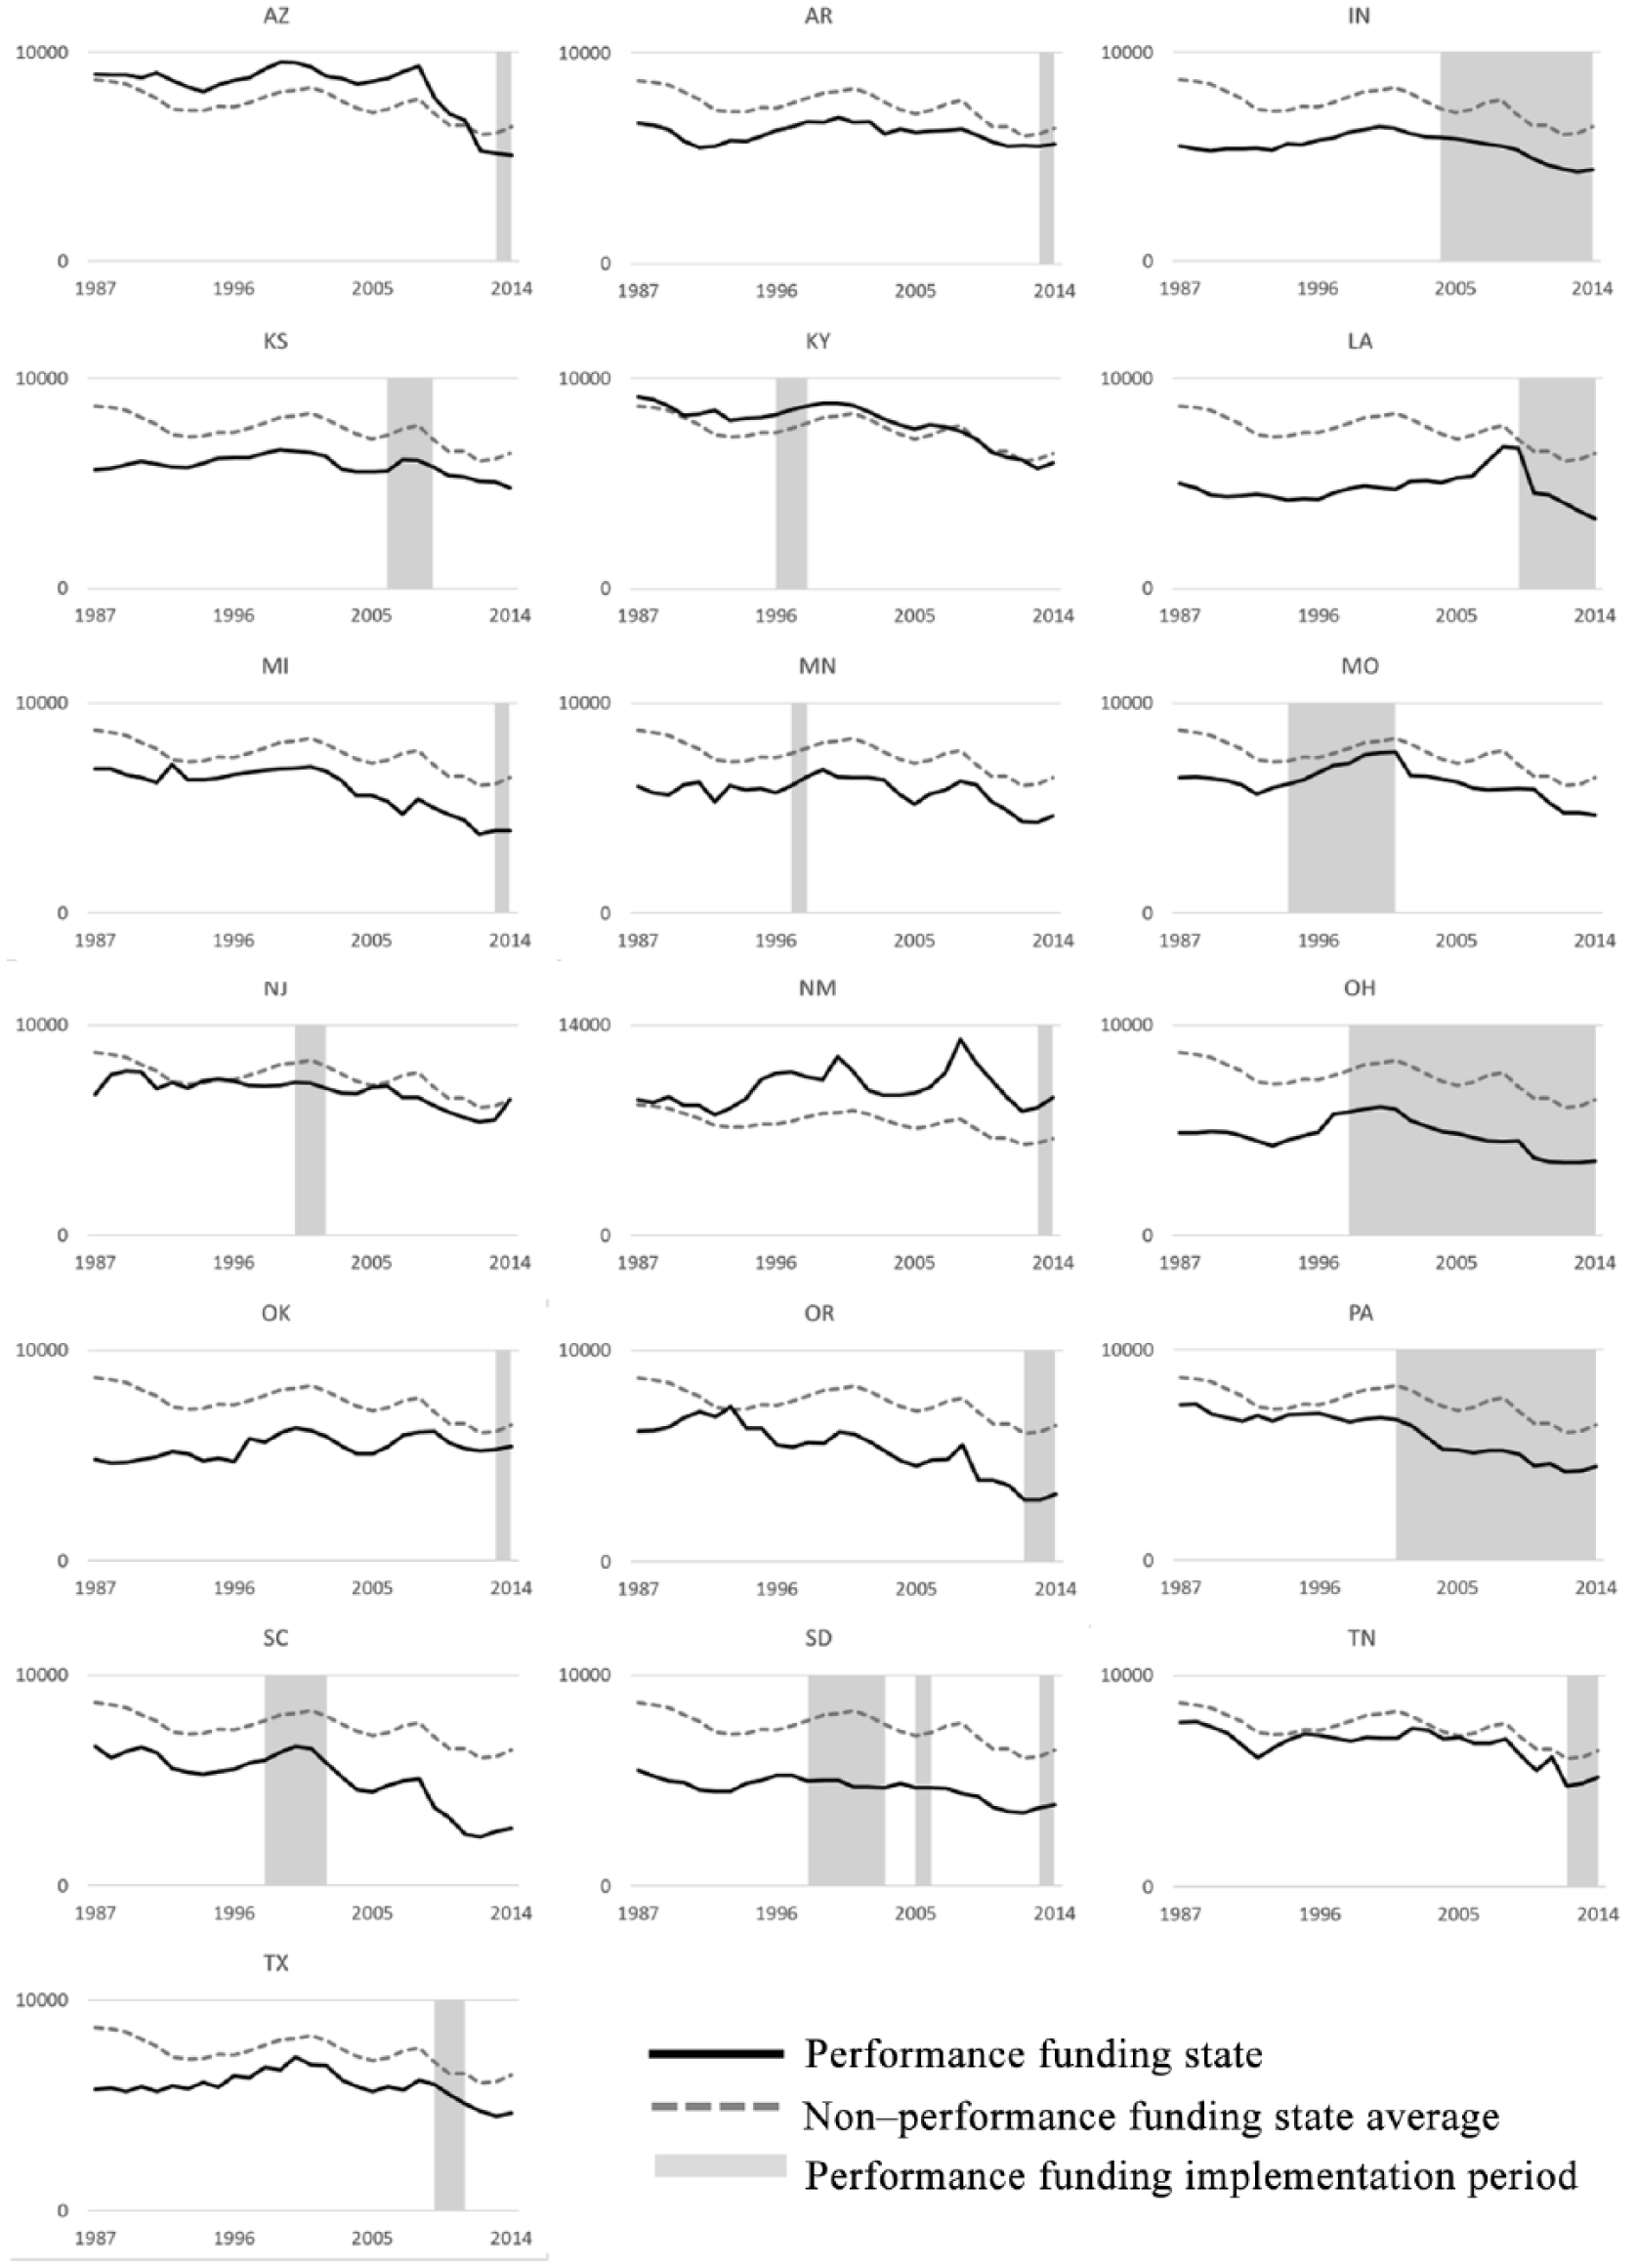
State appropriations per student in performance funding states.
Figure 3 shows state-specific trends in state appropriations per student in performance funding states (solid line) compared with the non–performance funding state average (dotted line); the area shaded in gray is the implementation period of performance funding. There is notable variation in per-student funding across performance funding states, and while not the case for all states, there are several examples of parallel trends in the pretreatment period, followed by a notable change in the implementation period. In the case of Kansas, there are similar trends in state appropriations per student in the pretreatment period, followed by a relative increase in funding following performance funding implementation (there are increases for both Kansas and the control group, but the slope is slightly greater for Kansas). This initial increase in funding is then followed by a decline at the beginning of the recession. These trends are especially notable among the highly selective institutions in Kansas: There is a large increase in funding just after performance funding is implemented, such that funding per student outpaces the non–performance funding state average (see Supplemental Figure A2 in the online version of the journal). Funding remains above the non–performance funding average even after the recession-driven decline. Among master’s institutions in Kansas, an increase is not observed during the treatment period (see Supplemental Figure A3 in the online version of the journal). These figures provide some initial evidence of treatment effect heterogeneity.
Difference in Difference Regression Results
While statistically significant effects of performance funding implementation on state appropriations per student do not emerge for all public, 4-year institutions, I do find a number of notable treatment effects across the various institution types (results presented in Table 3). Among research universities, performance funding implementation is associated with an increase of US$388.70 (p < .01) in state appropriations per student on average, relative to research universities not subject to performance funding. 7 Similarly, highly selective institutions exhibit an increase of US$508.50 (p < .01) in state appropriations per student following performance funding implementation, compared with highly selective institutions in non–performance funding states. Conversely, master’s (b = −US$223.70, p < .01), bachelor’s (b = −US$245.10, p < .05), less selective institutions (b = −US$290.30, p < .001), and nonselective institutions (b = −US$209.9, p < .05) experience declines in state appropriations per student associated with performance funding implementation, compared with like institutions in non–performance funding states. In addition, performance funding is associated with a decline of US$295.90 (p < .05) at rural institutions, relative to rural institutions not subject to performance funding. It is surprising to find no treatment effects of performance funding among MSIs, given the findings from Hillman and Corral (2017) and Jones et al. (2017). The lack of a positive effect may be interpreted as an indirect burden of performance funding since increases in funding are observed among other institution types.
Regression Results of the Impact of Performance Funding on State Appropriations per Student by Institution Type
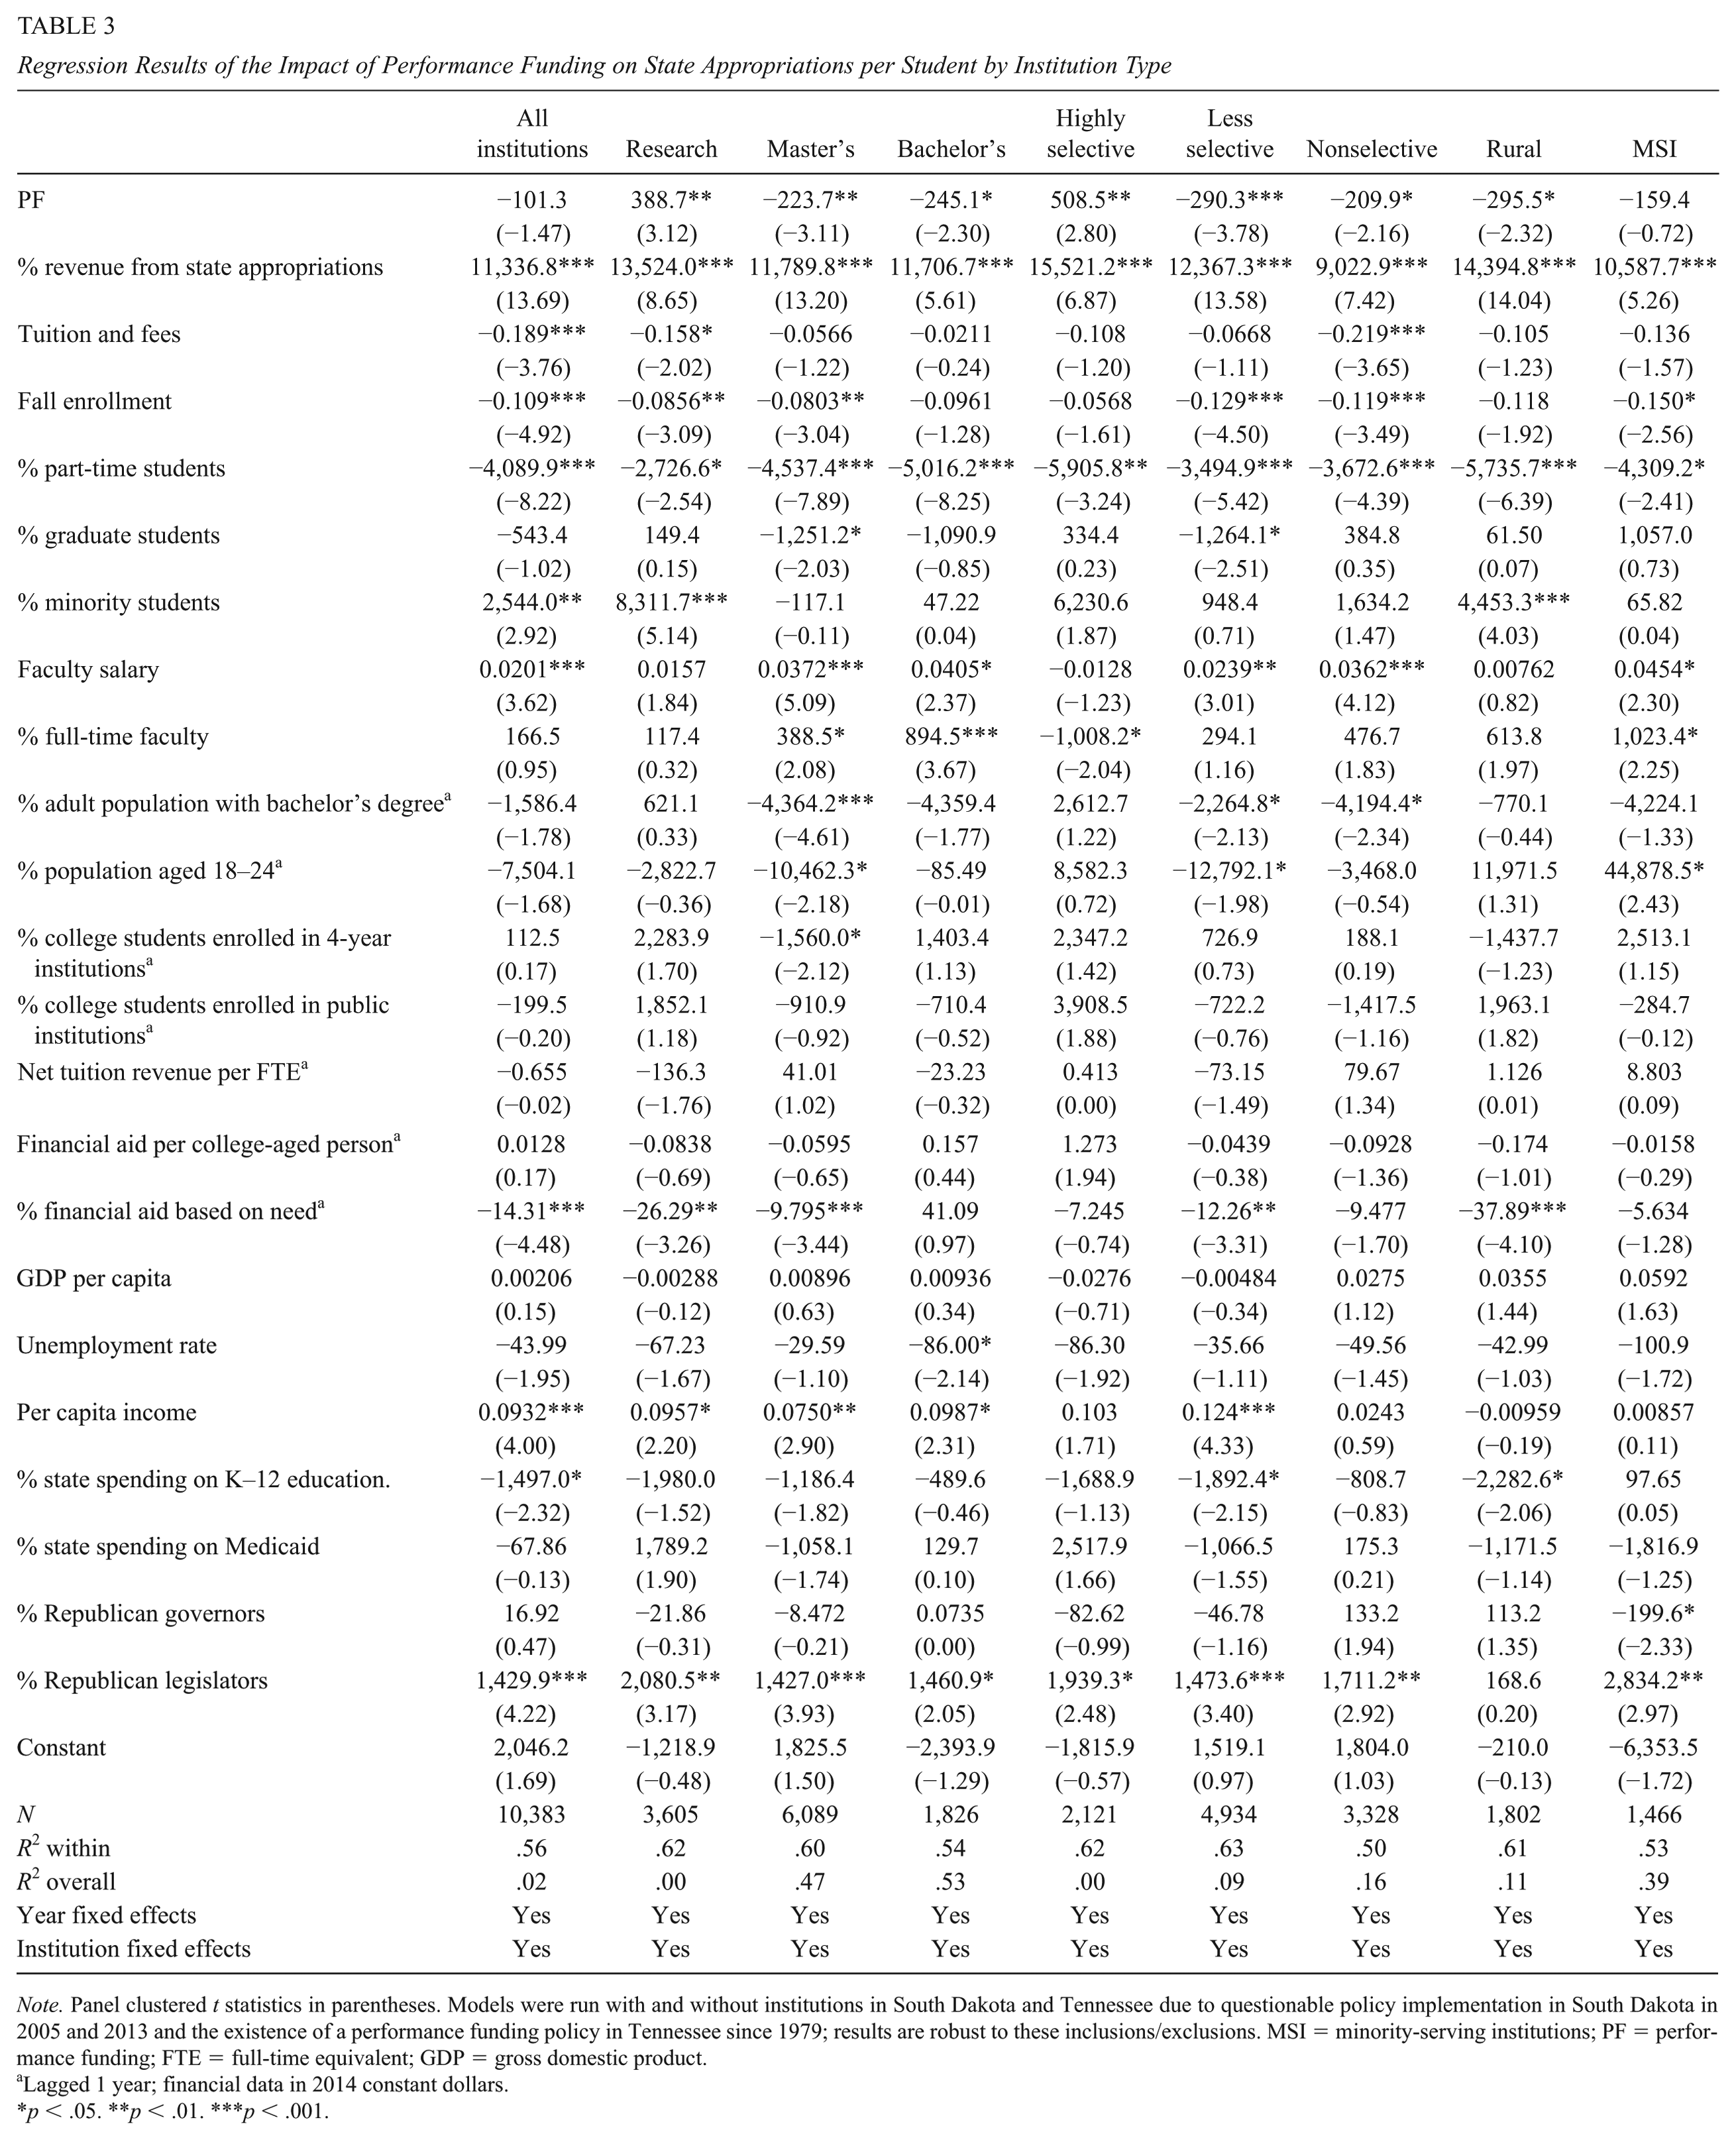
Note. Panel clustered t statistics in parentheses. Models were run with and without institutions in South Dakota and Tennessee due to questionable policy implementation in South Dakota in 2005 and 2013 and the existence of a performance funding policy in Tennessee since 1979; results are robust to these inclusions/exclusions. MSI = minority-serving institutions; PF = performance funding; FTE = full-time equivalent; GDP = gross domestic product.
Lagged 1 year; financial data in 2014 constant dollars.
p < .05. **p < .01. ***p < .001.
Lead-Lag Analysis
I ran a series of lead-lag models in which I replaced the treatment variable with a series of time dummy variables for the years leading up to and following performance funding implementation (Table 4). The time dummy variables estimate the change in state appropriations per student in the given period before or after performance funding (e.g., 2 years before), relative to 1 year before implementation. The lead-lag results provide evidence in support of the parallel trends assumption because there are no treatment effects in the years leading up to the policy implementation. In addition, the lead-lag results demonstrate that some of the treatment effects do not emerge immediately following policy implementation. For example, treatment effects for master’s institutions, highly selective, less selective, and nonselective institutions did not emerge until 1 to 3 years after performance funding was implemented.
Lead-Lag Regression Results
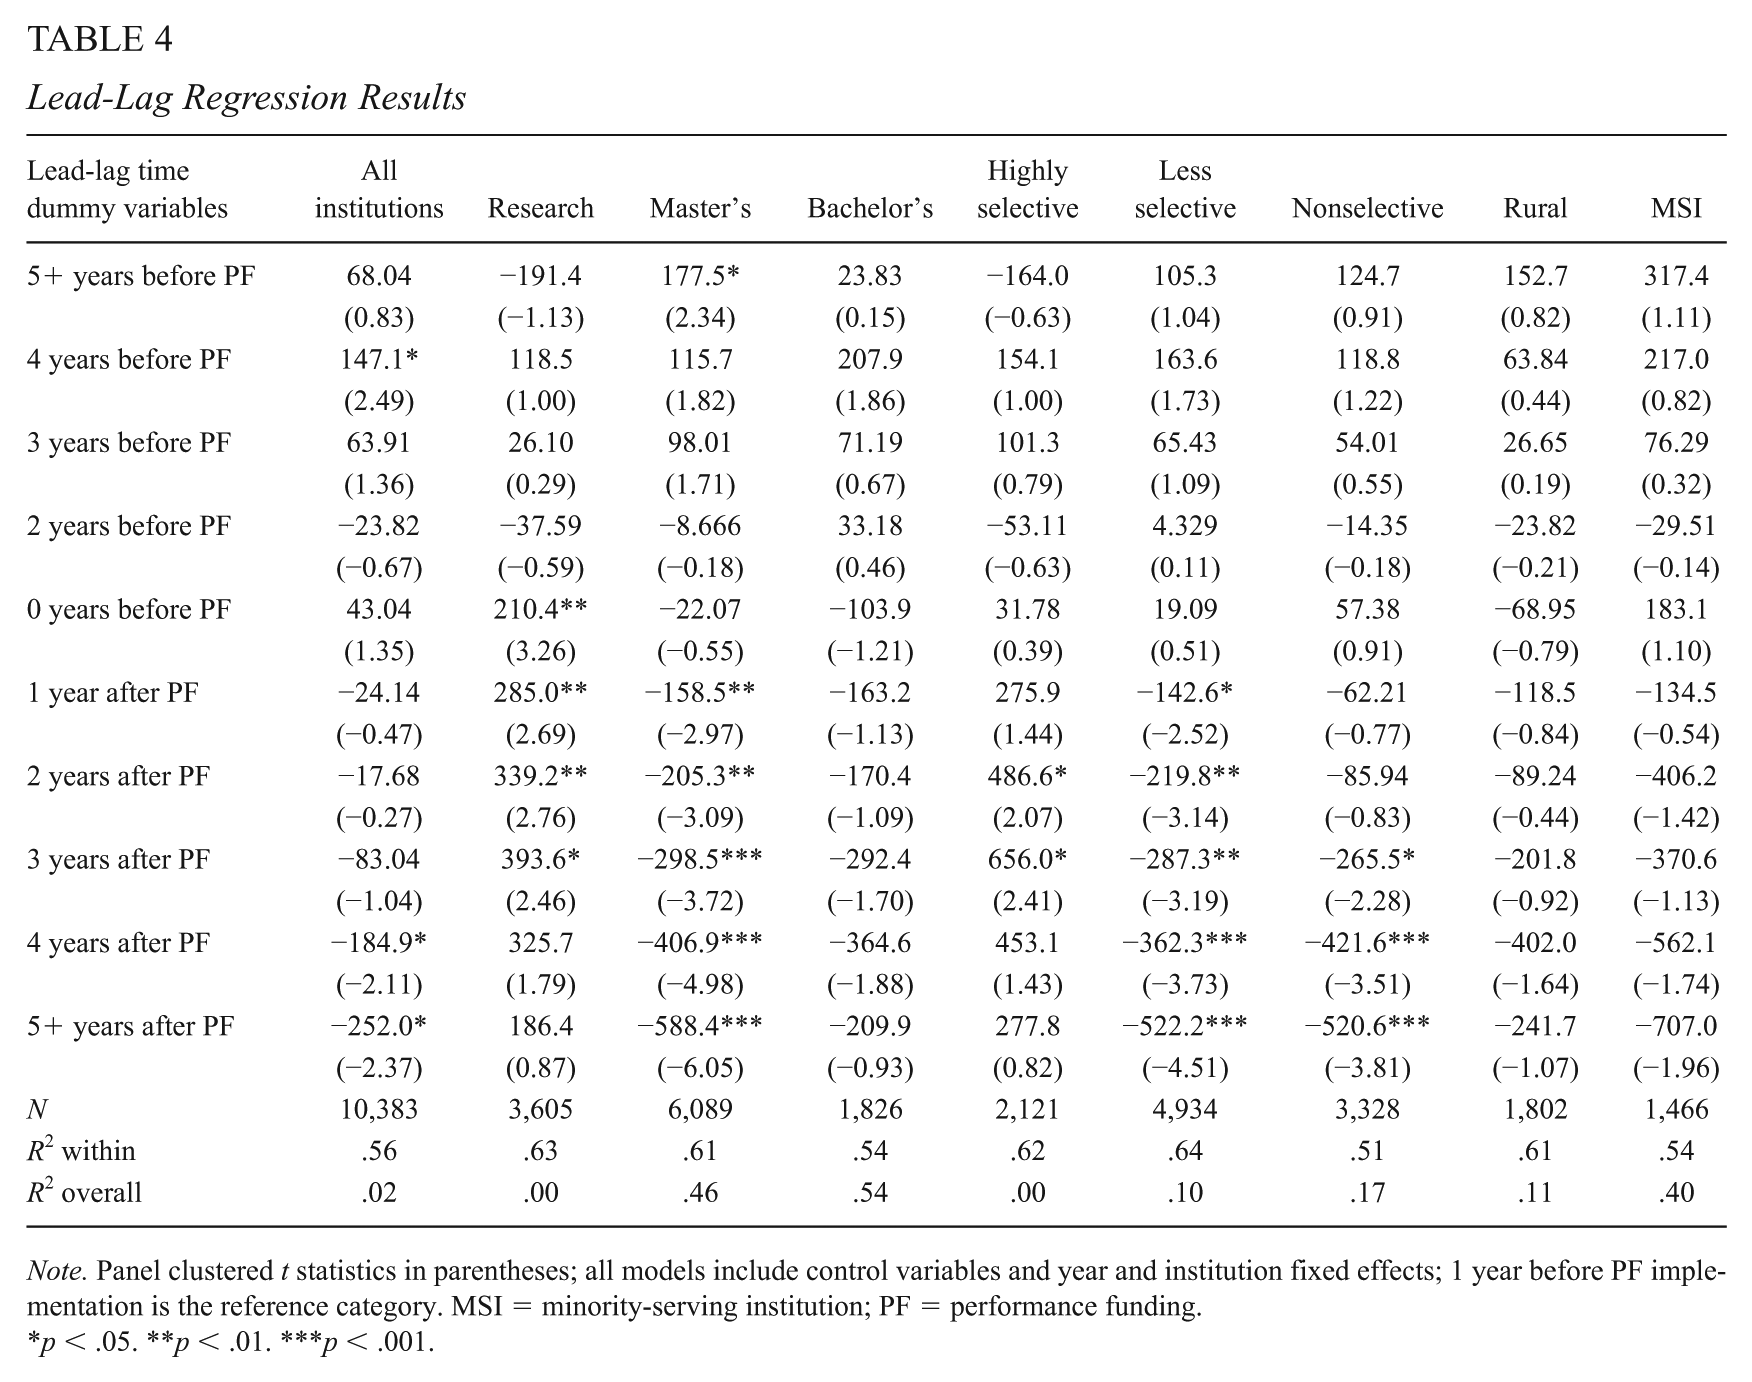
Note. Panel clustered t statistics in parentheses; all models include control variables and year and institution fixed effects; 1 year before PF implementation is the reference category. MSI = minority-serving institution; PF = performance funding.
p < .05. **p < .01. ***p < .001.
State-Specific Linear Trends
Although lead-lag analyses are helpful in understanding pretreatment trends, they do not fully confirm the parallel trends hypothesis (Kahn-Lang & Lang, 2018). As such, I incorporated state-specific linear time trends into the models as an additional pretreatment trend robustness check. The inclusion of state-specific linear time trends allows the trajectory of the dependent variable to vary in the pretreatment period (Angrist & Pischke, 2015; Kahn-Lang & Lang, 2018). The results of these models suggest that for many of the institution types, the implementation of performance funding is correlated with other trends in state appropriations per student (Pischke, 2005; results presented in Table 5). However, the findings for research universities are robust to the inclusion of the state-specific trends. These results continue to demonstrate that research universities are more likely to benefit from performance funding compared with nonresearch universities. It is important to note that the inclusion of state-specific linear time trends may not be the most appropriate model specification for this study. According to Pischke (2005), the inclusion of a state-specific linear trend requires a “sharp change in the outcome at the date of the treatment” (p. 8). Treatment effects may be difficult to discern under these conditions if they are gradual (Pischke, 2005). Taking into consideration the lead-lag estimates, many of the treatment effects emerge 1 to 3 years after performance funding implementation. The treatment effect for the research universities, however, emerges immediately, perhaps explaining why this is the only model that is robust to the inclusion of state-specific linear time trends.
Abbreviated Regression Results of the Impact of Performance Funding on State Appropriations per Student by Institution Type, State-Specific Linear Time Trends
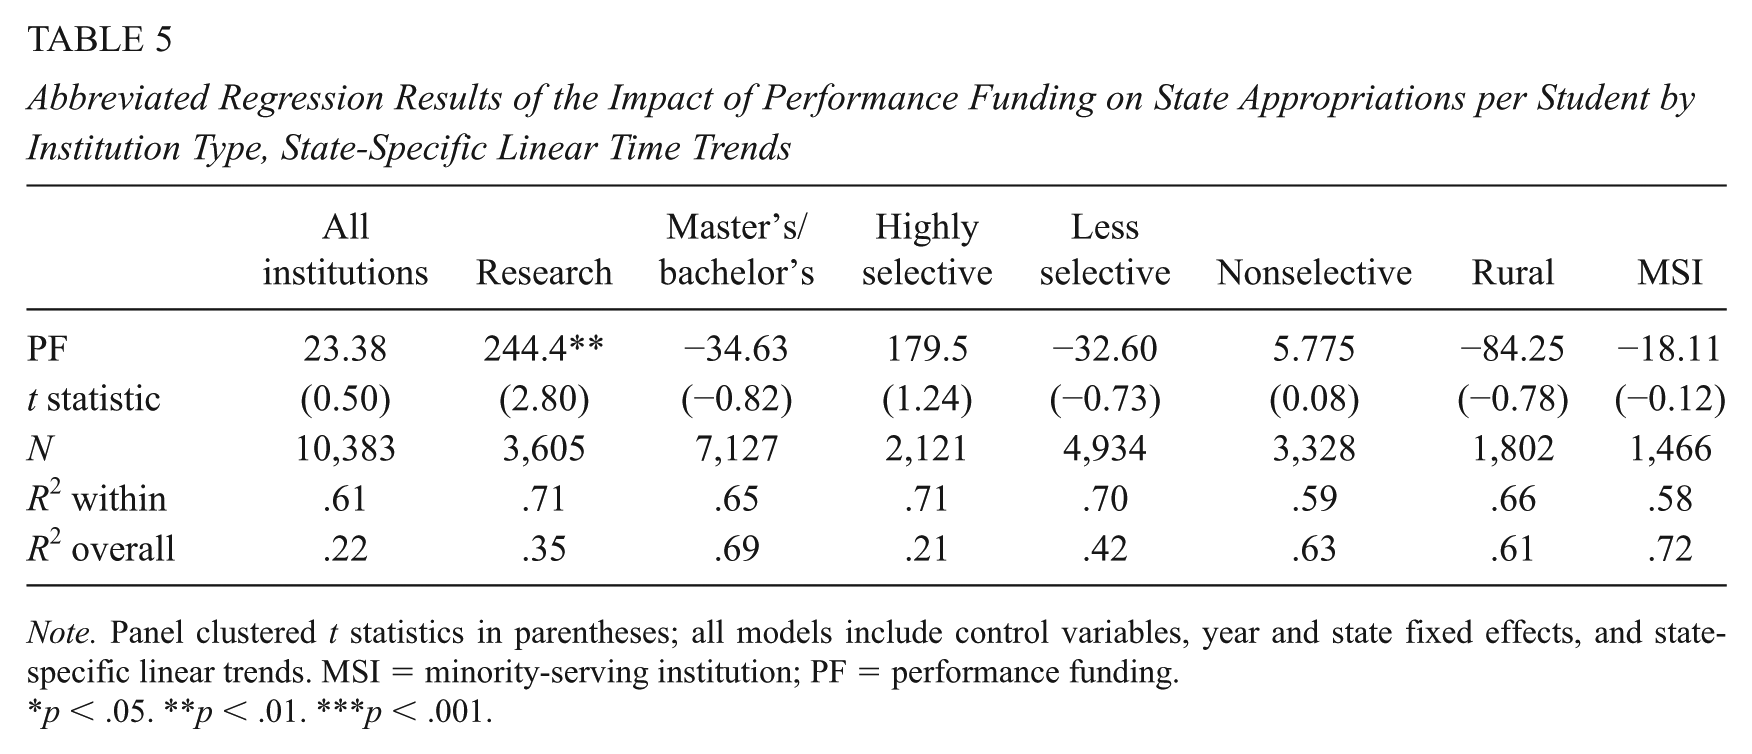
Note. Panel clustered t statistics in parentheses; all models include control variables, year and state fixed effects, and state-specific linear trends. MSI = minority-serving institution; PF = performance funding.
p < .05. **p < .01. ***p < .001.
Alternative Functional Form
The linear specification of the DD models relies on the assumption that both the treated and control groups would move by the same absolute amount in the absence of treatment (Kahn-Lang & Lang, 2018). However, the groups may move instead by the same percentage, in which case the linear model would be inappropriate. Given the trends in average state appropriations in treated and control states provided in Figure 2, this linear model specification does not seem unreasonable. Moreover, a linear functional form has been utilized in similar studies (Hillman & Corral, 2017; Kelchen & Stedrak, 2016; Rabovsky, 2012). To ensure that the linear functional form is appropriate, I tested the robustness of the findings to an alternative functional form by including models that utilize a logarithmic transformation of the dependent variable.
When specifying the model as
I find consistent treatment effects as observed in most of the preferred models described above. Masters’ institutions and less selective institutions exhibit a percent decrease in funding per student relative to similar institution types in non–performance funding states, whereas highly selective institutions exhibit a percent increase in funding per student relative to similar institutions in non–performance funding states (Table 6).
Regression Results of the Impact of Performance Funding on the Natural Log of State Appropriations per Student by Institution Type
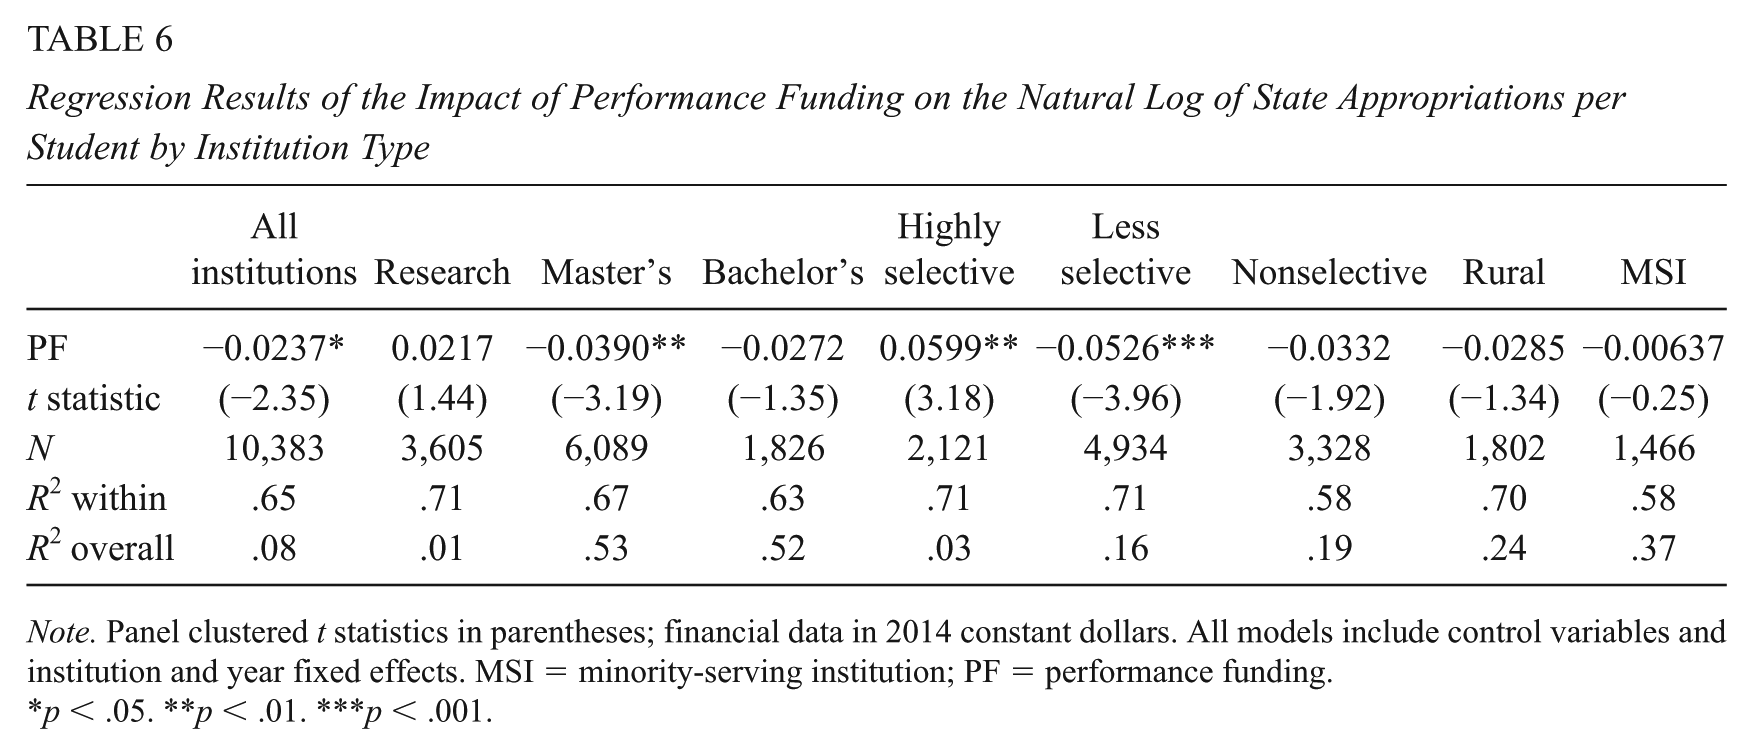
Note. Panel clustered t statistics in parentheses; financial data in 2014 constant dollars. All models include control variables and institution and year fixed effects. MSI = minority-serving institution; PF = performance funding.
p < .05. **p < .01. ***p < .001.
Alternative Counterfactuals
To reduce baseline differences between the treated and control groups, I utilized a series of more narrowly defined comparison groups. I examined treatment effects across states with similar higher education governance structures and political party leadership. Abbreviated results are presented in Table 7.
Abbreviated Regression Results for Alternative Counterfactuals
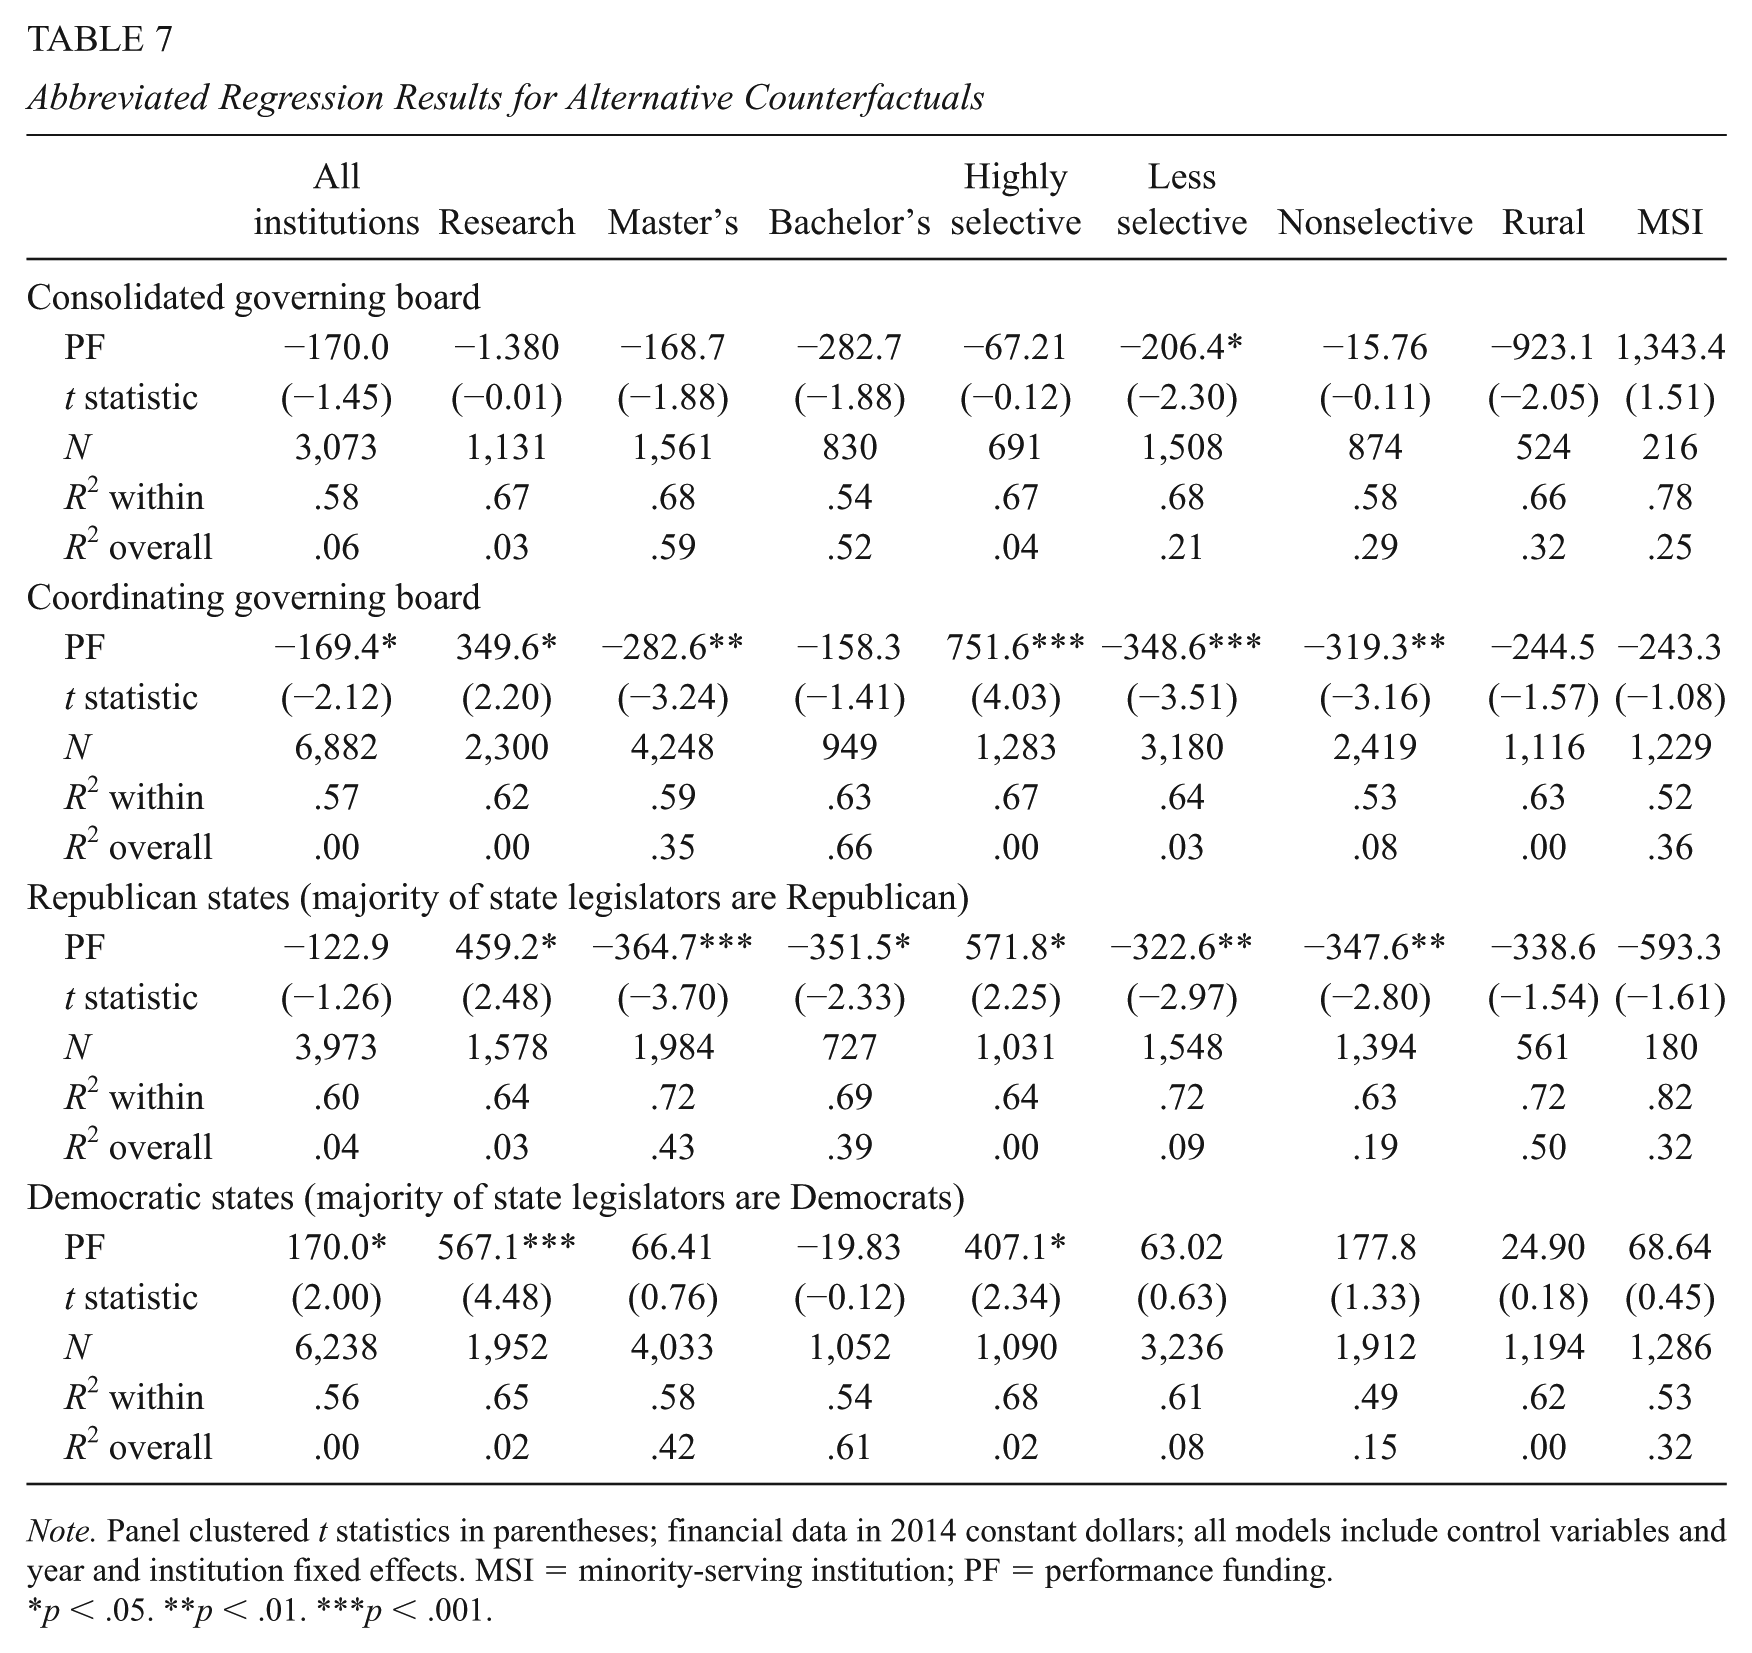
Note. Panel clustered t statistics in parentheses; financial data in 2014 constant dollars; all models include control variables and year and institution fixed effects. MSI = minority-serving institution; PF = performance funding.
p < .05. **p < .01. ***p < .001.
Institutions in states with coordinating boards exhibit the differential treatment effects described above, such that increases in state funding are observed at research and highly selective institutions, whereas declines in funding are concentrated at nonresearch/non-highly selective institutions. In the context of states with consolidated governing boards, however, only negative treatment effects are observed for less selective institutions (b = −US$206.40, p < .05). When state-specific linear trends are included in the model, no treatment effects of performance funding emerge among states with consolidated governing boards; for consolidated governing board states, a positive effect is observed only for research universities.
McLendon et al. (2006) suggest that consolidated governing boards are better positioned to advocate on behalf of institutions compared with coordinating boards. In addition, consolidated governing boards typically have more power and oversight than coordinating boards. It may be the case that consolidated governing boards are better able to mitigate the negative impacts of performance funding, through advocacy on behalf of institutions, or perhaps they are better positioned to motivate institutional change through their oversight. Among states with coordinating boards, on the contrary, performance funding seems to directly benefit the highly resourced institutions and burden the lower resourced institutions, which may be related to weaker advocacy and/or oversight.
These differences across governance types may also be related to how funding is distributed to institutions from state legislatures. For states with consolidated governing boards, legislatures typically allocate funding directly to the governing board, and the governing board then distributes the funds to the institutions (ECS, 2018). Similarly, the governing board also serves in a lobbying capacity on behalf of the institutions (Lowry, 2001; McGuinness, 2016). It may be the case that consolidated governing boards facilitate a more equitable distribution of funding than if institutions received funds directly from the state legislature. On the contrary, if the legislature allocates funds directly to institutions, institutions will have more of an opportunity and an incentive to lobby the legislature, and powerful institutions will likely be more successful in this endeavor (Lowry, 2001).
I find some notable differences across political party lines. In Republican-controlled states, research (b = US$459.20, p < .05) and highly selective institutions (b = US$571.80, p < .05) exhibit increases in funding, relative to similar institution types in Republican-controlled, non–performance funding states. Master’s (b = −US$364.70, p < .001), bachelor’s (b = −US$351.50, p < .05), less selective (b = −US$322.60, p < .01), and nonselective institutions (b = −US$347.60, p < .01) all experience declines in funding following performance funding implementation, compared with similar institution types in Republican-controlled, non–performance funding states.
In Democratic-controlled states, however, only increases in state appropriations per student are associated with performance funding implementation. These positive effects are, again, limited to the contexts of research (b = US$567.10, p < .001) and highly selective institutions (b = US$407.10, p < .05). So while Democratic-controlled states might be better at preventing performance funding policies from distributing direct financial burdens, it is still only the highly resourced institutions that benefit from the policy. When state-specific linear trends are included in the models, no treatment effects are observed in Republican states, and the positive effect for research universities in Democratic states remains.
These results are, for the most part, in keeping with the positive/negative views of higher education held by Republicans and Democrats as predicted by Schneider and Ingram (1993). It is not surprising to find reductions in funding associated with performance funding concentrated in Republican states, given the increasingly negative views of higher education held by Republicans. Although, despite the negative views of higher education among Republicans, high-resource institutions continue to benefit from performance funding in Republican states. The positive treatment effects may be related to variations in favorability across institutional types and/or the political power of high-resource institutions in Republican states.
Analysis for Most Recent Policies
To determine if the findings presented above hold up for the most recent wave of performance funding, I conducted additional analyses limited to the policies implemented from 2004 to 2014. Generally, I find that similar patterns emerge: High-resource institutions benefit from performance funding, whereas low-resource institutions are more likely to incur financial burdens (Table 8). However, positive impacts of performance funding on state appropriations per student do not emerge. Rather, the negative effects remain concentrated at the nonresearch/non-highly selective institutions, whereas statistically significant effects are not observed for research and highly selective institutions. The later years analysis holds up to the parallel trends assumption, and findings are robust to alternative counterfactual specifications; however, treatment effects are not robust to the inclusion of state-specific linear trends (results are available upon request).
Abbreviated Regression Results of the Impact of Performance Funding on State Appropriations per Student by Institution Type, 2004–2014
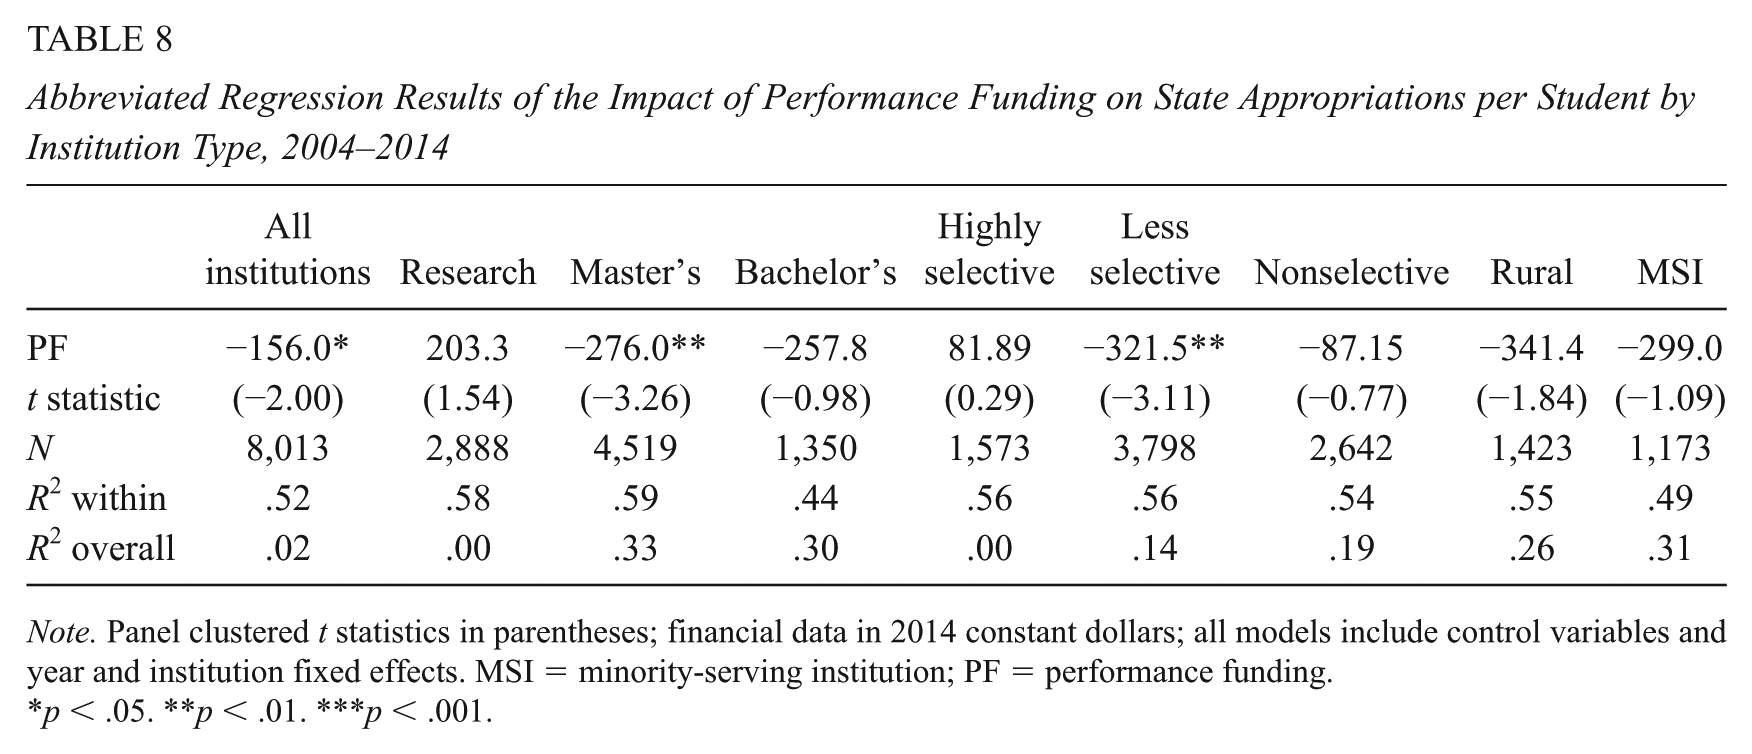
Note. Panel clustered t statistics in parentheses; financial data in 2014 constant dollars; all models include control variables and year and institution fixed effects. MSI = minority-serving institution; PF = performance funding.
p < .05. **p < .01. ***p < .001.
Although there is not a direct increase in funding for the highly resourced institutions associated with performance funding, these schools might still be considered beneficiaries as they do not lose appropriations on average. The lack of positive effects in the later years might be related to the fact that the more recently implemented policies redistribute existing funding on the basis of performance rather than rewarding institutions with new funding.
Summary of Results
The evidence presented here suggests that performance funding policies indeed favor some institutions over others, such that highly resourced institutions are more likely to benefit from performance funding whereas low-resource institutions are more likely to incur burdens. The low-resource institutions in this study are the nonresearch/non-highly selective institutions. There are a total of 251 low-resource institutions, consisting primarily of state colleges and regional comprehensive universities. Compared with the research and highly selective institutions, these schools have about US$10,000 less per student in total revenue, are more dependent upon state resources, have lower tuition and fees, lower student enrollment, employ fewer faculty and staff, and have lower faculty salaries on average (see Supplemental Table A2 in the online version of the journal).
It may be the case that some institutions benefit as a direct result of good/improved performance, as is typically the intention of the policies. Research and highly selective institutions may perform well, and subsequently receive an increase in state appropriations. To test for this possibility, I ran DD models with the number of bachelor’s degrees awarded per 100 students as the dependent variable, anticipating a positive association between performance funding implementation and bachelor’s degree production for research and highly selective institutions (Table 9). To allow enough time to observe changes in bachelor’s degree production, I lagged the policy variable by 4 years. Interestingly, I found that performance funding implementation had a positive impact on bachelor’s degree production solely at bachelor’s institutions, with no statistically significant effects observed at research or highly selective institutions. Bachelor’s institutions subject to performance funding increased bachelor’s degree production by 0.6 degrees per 100 students (p < .05). The average number of bachelor’s degrees per 100 students for this sample is 13.2; an increase of 0.6 represents about a 5% increase in bachelor’s degree production. It is notable that increases are limited to an institution type that was more likely to exhibit funding declines following performance funding implementation. For the policies implemented from 2004 to 2014, however, I did not find statistically significant effects on bachelor’s degree production.
Abbreviated Regression Results for the Impact of Performance Funding on Bachelor’s Degrees Awarded per 100 Students
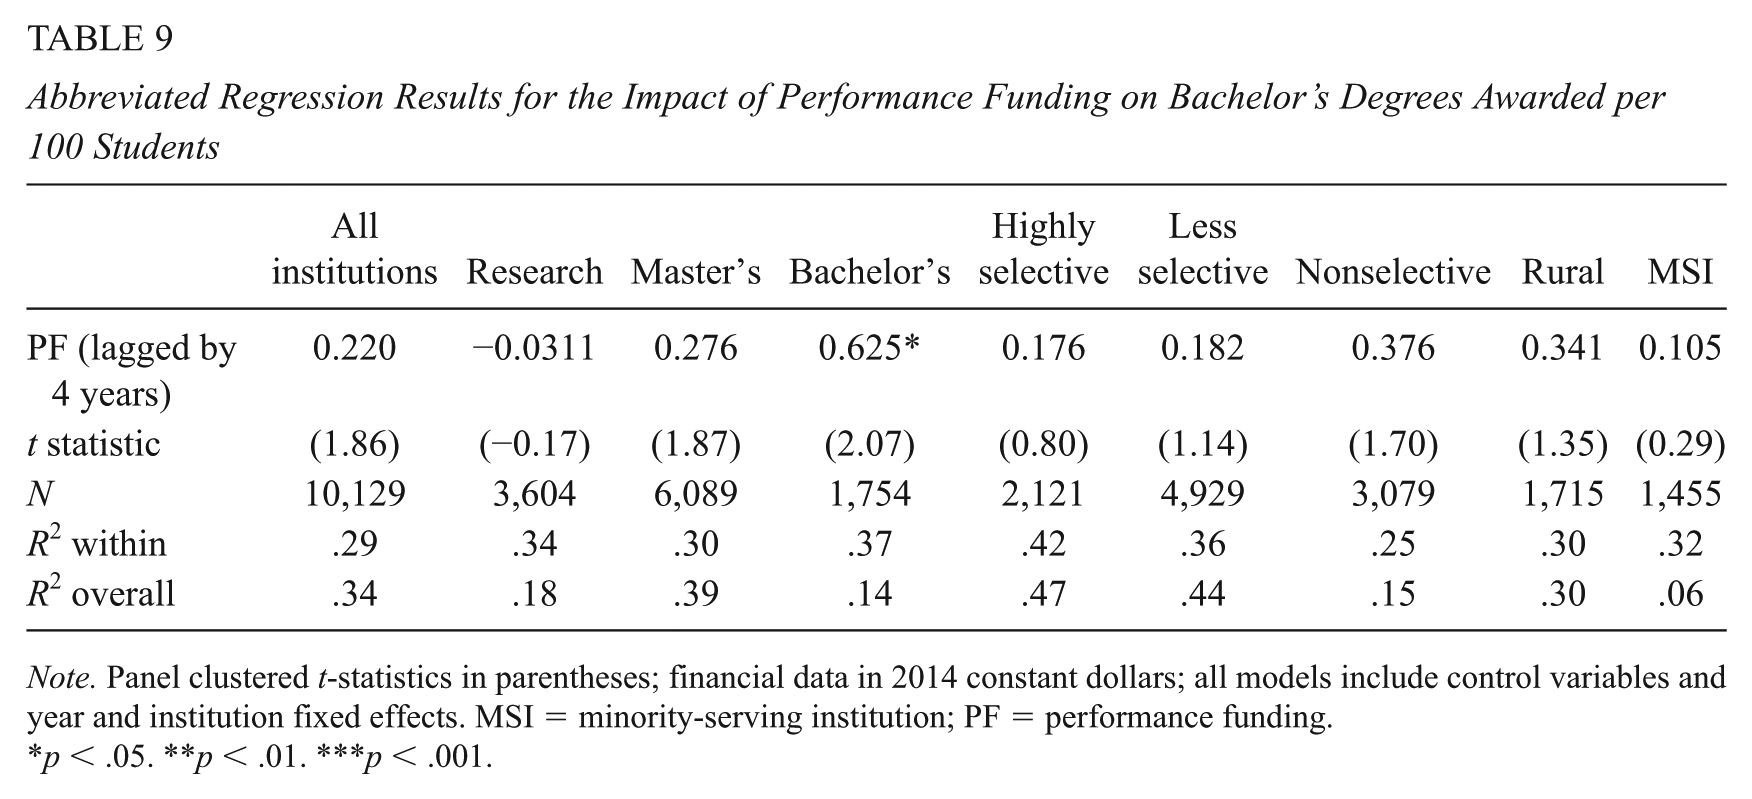
Note. Panel clustered t-statistics in parentheses; financial data in 2014 constant dollars; all models include control variables and year and institution fixed effects. MSI = minority-serving institution; PF = performance funding.
p < .05. **p < .01. ***p < .001.
It is important to note that not all performance funding policies use bachelor’s degree production as a performance outcome, although this is the most common outcome of interest. Just because bachelor’s degree production seems unaffected by performance funding implementation, this does not mean that institutions are underperforming in other areas. Second, research and highly selective institutions may have little room to improve bachelor’s degree production and may benefit from performance funding by simply maintaining current levels of production. Despite these caveats, it is troubling to see improved performance solely at the institutions that do not seem to reap financial benefits or, worse, experience direct financial burdens.
Discussion and Conclusion
The results of this study suggest that performance funding policies may in fact create systems of winners and losers across various institution types. Consistently, I find that high-resource institutions financially benefit from performance funding policies, whereas low-resource institutions tend to incur financial burdens. These findings are not necessarily surprising, but they are noteworthy.
The theory of social construction and policy design posits that benefits or burdens of public policy are distributed to policy targets based on two key factors: the political power of the policy target and how favorably the target is viewed. These two elements work together to construct the relative deservedness of the policy target in question. In the context of this study, this theory helps to make sense of which institutions are constructed as “deserving” of state funding. This positive construction manifests in the design of a performance funding policy that redistributes funding toward high-resource institutions and away from low-resource institutions.
Consistently, the institution types that are typically considered politically powerful receive direct financial benefits associated with performance funding, while those that tend to be less politically connected regularly receive direct financial burdens. The distribution of benefits and burdens may also be related to how these institutions are viewed, but this is more difficult to discern. Considering the partisan divide over the opinion of higher education in the United States, one would expect financial burdens to be concentrated in Republican-controlled states; the findings support this assumption in most cases.
Indeed, many institutions in Republican states exhibit funding declines associated with performance funding implementation; however, financial benefits are also observed in Republican states for research and highly selective institutions. Perhaps the effect heterogeneity of performance funding concentrated in Republican states is related to the political power of the institutions; it may be the case that some institutions are able to wield power to prevent funding decreases, despite a negative public opinion. In Democratically controlled states, on the contrary, no direct burdens are observed; only financial benefits are exhibited, and these are concentrated in research universities and highly selective institutions. This suggests that higher education may benefit from a positive public opinion, by not incurring direct financial burdens, whereas the most powerful institutions continue to benefit directly.
It is especially interesting to consider these results in light of the impact of performance funding on bachelor’s degree production. Findings suggest that the schools that frequently exhibited declines in funding associated with performance funding policies were the same institutions most likely to demonstrate gains in bachelor’s degree production, whereas institutions most likely to benefit from performance funding exhibited no change in bachelor’s degree production. This further suggests that performance funding policies are designed to benefit high-resource, politically connected institutions and burden low-resource, politically weak institutions. Because performance funding policies are often designed with the wealthiest institutions in mind (Gàndara, 2016; Jones et al., 2017; Ness, Deupree, & Gàndara, 2015), the policy process may result in policies that reward high-resource institutions for maintaining the status quo, but are not sensitive enough to detect improvements/successes for low-resource institutions. For example, some policies require institutions to meet certain thresholds of performance or even outperform other institutions to be rewarded. Perhaps low-resource institutions are making progress but are not rewarded due to the specifications of the policy.
Consider the findings of Callahan, Meehan, and Shaw (2017). They found that while most institutions in Tennessee, Ohio, and Indiana responded to performance funding policies with robust activity, highly selective institutions were much less likely to change any behavior. High-resource institutions may not need to restructure programs and reroute resources to improve degree attainment. If high-resource institutions are funded based on what they are already doing well—requiring no change, innovation, or new efforts—and financially benefiting solely by the merits of the historical funding preferences of state legislators, then performance funding does not constitute an effective incentive.
Ultimately, rewarding the most highly resourced institutions while punishing those with the least resources via performance funding is not a promising strategy to improve college completion. According to the findings presented here, performance funding policies distribute resources to institutions that are less dependent upon state appropriations and have less room for increasing degree production and away from institutions that have the most potential for contributing to states’ credentialing efforts. A more equitable distribution of state funding—one that takes into consideration institutions’ total available resources when making allocation decisions and expands the capacity of underfunded institutions—would be a more effective and strategic approach to higher education finance for the purposes of improving degree attainment.
Supplemental Material
DS_10.3102_0162373719837318 – Supplemental material for The Financial Benefits and Burdens of Performance Funding in Higher Education
Supplemental material, DS_10.3102_0162373719837318 for The Financial Benefits and Burdens of Performance Funding in Higher Education by Lori Prince Hagood in Educational Evaluation and Policy Analysis
Footnotes
Acknowledgements
The author thanks the following people for their helpful comments on earlier versions of this manuscript: Rachana Bhatt, Jim Hearn, Robert Kelchen, Erik Ness, Robert Toutkoushian, and two anonymous reviewers.
Author’s Note
The views and opinions expressed in this article are those of the author and do not necessarily reflect the views of the Board of Regents of the University System of Georgia.
Declaration of Conflicting Interests
The author(s) declared no potential conflicts of interest with respect to the research, authorship, and/or publication of this article.
Funding
The author(s) received no financial support for the research, authorship, and/or publication of this article.
Notes
Author
References
Supplementary Material
Please find the following supplemental material available below.
For Open Access articles published under a Creative Commons License, all supplemental material carries the same license as the article it is associated with.
For non-Open Access articles published, all supplemental material carries a non-exclusive license, and permission requests for re-use of supplemental material or any part of supplemental material shall be sent directly to the copyright owner as specified in the copyright notice associated with the article.