




Abstract
States that receive federal waivers to the No Child Left Behind Act were required to implement reforms in designated “Focus Schools” that contribute to achievement gaps. We examine the performance effects of such “differentiated accountability” reforms in Louisiana. These Focus School reforms emphasized school-needs assessments and aligned technical assistance. These reforms may have also been uniquely high-powered because they were linked to a letter-based school-rating system. We examine the impact of these reforms in a sharp regression-discontinuity (RD) design. We find that, over each of 3 years, Louisiana’s Focus School reforms had no measurable impact on school performance. We discuss evidence that these findings reflect policy reform fatigue and poor quality of implementation at the state and local level.
Keywords
In this article, we examine Focus School reforms conducted under the NCLB waiver in Louisiana. Louisiana’s implementation of this signature federal achievement gap reform is uniquely interesting because it coincided with a state-level consequential accountability mechanism that has been shown to be effective elsewhere (i.e., school letter grades). The treatment contrast that we study in Louisiana is a simultaneous combination of both Focus School and letter grade reforms, which is arguably a stronger treatment than the waivers themselves required. Indeed, by incorporating the use of a letter grade system already being developed at the state level into its fulfillment of the waiver requirements, Louisiana effectively created a Focus School treatment that appeared distinctly meaningful relative to Focus treatments in other states. Louisiana is also unusual in that their reforms identified Focus Schools based on an overall performance measure rather than subgroup specific measures; however, the high levels of school segregation by race, ethnicity, and income in the state effectively maintained that the policy was equity-focused.
We use a regression discontinuity (RD) for our analysis, leveraging the sharp discontinuity in Louisiana’s assignment of schools to Focus School status based on a baseline performance measure, and we focus our analysis on traditional public schools. 1 Our identification strategy allows us to make a causal estimate of the effect on school outcomes of being identified as a Focus School and receiving the corresponding interventions, in combination with the impact of receiving a low letter grade. 2 The sharpness of the assignment to Focus status that we study is relatively unusual among waiver states and affords us increased statistical power to detect effects of the Focus School “treatment.” We find no evidence that being assigned to this “treatment” led to improvements in student test scores or schools’ performance rating relative to other low-performing schools. 3 In fact, 3 years after the start of the intervention for the first cohort of Focus Schools, these schools appear to be doing somewhat worse relative to other low-performing schools, though these effects are largely not statistically significant.
Our findings are particularly interesting given the fact that the recently passed reauthorization of the Elementary and Secondary Education Act (ESEA), the “Every Student Succeeds Act” (ESSA), provides guidelines on school accountability systems that closely mirror those in the NCLB flexibility waivers. Rather than being simply a short-term, stopgap measure, the waiver era provides a preview of the types of differentiated accountability systems that may develop under the newest iteration of the federal government’s education policy and how they may interact with state-specific contexts. A core contribution of this analysis is that it provides causally credible evidence on the impact of these reforms on Louisiana’s lowest performing schools in the context of the state’s particular implementation and policy environment. Ex ante, we would have predicted that Louisiana’s Focus School treatment, if anything, would have led to stronger positive responses from low-performing schools, compared with other states, due to the fact that these reforms were coupled with letter grades. The evidence that these reforms were ineffective raises questions we cannot answer definitively in the absence of detailed information on the implementation of these reforms. However, we do discuss the evidence from varied sources (e.g., Federal monitoring reports, descriptions of state actions, and their public perception), which suggests these reforms suffered from both weak public buy-in and poor implementation. In combination with other recent research on waiver reforms, our findings provide clear evidence that the success of top-down accountability reforms can vary widely across states and that the ability of such reforms to lead to the intended results depends on the alignment of federal goals with the goals and implementation at the ground level. Our findings also offer new insight into the role that local policy context can play in moderating the effectiveness of reforms found to work elsewhere.
The article is organized as follows: The section “Prior Literature and Theoretical Considerations” will describe the policy background context and literature relevant to our research questions. The section “Waivers and Accountability in Louisiana” will discuss details of the accountability system and waiver reforms in Louisiana. The section “Data and Specifications” discusses our data and identification strategy. The “Results” section presents our results and describes robustness checks. We conclude with a discussion of our results and how they relate to findings from other states.
Prior Literature and Theoretical Considerations
The reforms we study in Louisiana are situated in both the literature on school accountability and the literature on whole school reform. The reforms as they were implemented in Louisiana combined a system of public accountability (i.e., explicit school letter grades and public identification as a Focus School) with supports in the form of technical assistance intended to be personalized to the unique school needs. Unlike many other waiver states, the Focus School reforms in Louisiana had a whole-school character in that the state classified schools based on an overall low level of performance rather than because of the low performance of any particular subgroup within schools. As a practical matter, this whole-school reform approach could still reduce overall achievement gaps by race and income because of the high levels of segregation across public schools in Louisiana, where the median school-level percentage of Black students in the first Focus School cohort was 93% and the median percentage of free and reduced-price lunch (FRPL) students was 95%.
There are several broad theoretical motivations for school accountability policies generally. For example, it may be that well-intentioned district and school staff lack full information on the true character of their school’s performance relative to public expectations and that accountability policies convey this information emphatically. Alternatively, the performance of school and district staff in chronically underperforming schools may suffer from coordination problems that are attenuated by accountability incentives. Another possibility is that school and district staff may not undertake the desired behaviors or pursue key goals because their objectives differ from those of the public (i.e., a type of moral hazard problem). In this scenario, the incentives created by accountability reforms may also improve school effectiveness. A variety of studies have empirically examined the effectiveness of accountability reforms. In 2011, the National Research Council released a comprehensive research survey on the impact of incentives and test-based accountability in which the panel concluded that test-based incentive programs tend to result in positive, though not necessarily transformational, changes in achievement, especially in fourth-grade math. In a separate survey, Figlio and Loeb (2011) similarly cite evidence from studies of NCLB (Dee & Jacob, 2011; M. Wong, Cook, & Steiner, 2015) and studies of pre-NCLB accountability policies (Hanushek & Raymond, 2005) indicating that accountability policies that articulate consequences for low-performing schools improve their performance. Interestingly, pre-NCLB reforms that publicized information on school performance but did not articulate any labels or sanctions (i.e., “report card” accountability) appeared to be ineffective (Hanushek & Raymond, 2005).
This element of public sanction is particularly relevant in the case of Louisiana, where a critical component of the school accountability system—which we discuss in more detail in the following section—is the merging of the Focus School label with a well-publicized and intuitive “F” letter grade. Although we are not aware of any school accountability system that completely mirrors Louisiana’s, previous research on Florida’s A+ Plan accountability system is relevant as context for our own findings. Starting in 1999, the A+ Plan called for Florida to issue school letter grades based on student achievement on annual curriculum-based tests. Schools with high grades earned rewards while low-performing schools (those with an F) received both assistance and sanctions. Research on Florida’s A+ Plan has generally shown positive impacts (Chiang, 2009; Figlio & Rouse, 2006; Rouse, Hannaway, Goldhaber, & Figlio, 2013; West & Peterson, 2006). In addition, New York City’s school accountability system, although not statewide, is similar to Louisiana’s in that the district’s Department of Education issues annual letter grades to every school. Rockoff and Turner (2008) found that receiving a low letter grade led to significant improvements in both math and reading test scores, as soon as one year following the policy’s implementation.
The potential impact of a system of public accountability is, of course, the result not just of external pressure but also of the support and interventions that are made available to districts and schools. Under NCLB, schools failing to meet adequate yearly progress (AYP) were treated with one or more of a set of increasingly strict and prescriptive interventions mandated by the legislation. However, NCLB waivers provided states with the flexibility to bring any relevant evidence-based reforms to its identified Focus Schools. Whether and when this more flexible approach to accountability is successful is an important and open empirical question.
Because Louisiana’s Focus School reforms identified whole schools rather than targeted subgroups for intervention, this research should also be situated in the broad body of literature on comprehensive school reform (CSR). This earlier approach to school improvement, in contrast to targeted interventions such as pull-out programs or other piecemeal Title I–funded programs, gained momentum in the late 1990s when Congress legislated millions of dollars to support evidence-based CSR. The U.S. Department of Education identified 11 necessary elements to qualify for CSR. Unsurprisingly, a large number of CSR models were developed, ranging from home-grown models to those developed by universities or research centers and packaged for national distribution. Some of the most well-known models, such as Direct Instruction and Success for All, have been the subjects of dozens of studies (e.g., Brent & DiObilda, 1993; Madden, Slavin, Karweit, Dolan, & Wasik, 1993; O’Brien & Ware, 2002; Slavin & Madden, 2000). A 2003 meta-analysis of the CSR research found that the research base was limiting but that overall the effects of CSR appeared to be promising, with the Direct Instruction, Success for All, and School Development Program standing out as having the strongest evidence of effectiveness with respect to student achievement (Borman, Hewes, Overman, & Brown, 2003). The authors also concluded that the heterogeneity in the effectiveness of CSR models was likely due to the challenges of consistent high-fidelity implementation across multiple schools.
The case of Louisiana’s Focus School reforms therefore sits at the intersection of two approaches to school improvement that have been thoroughly examined and have shown potential for impact: school accountability and CSR. However, the reforms we study here also represent a new approach to achieving school improvement. The accountability system developed in Louisiana is characterized by a built-in flexibility, coupled with high stakes accountability. Rather than relying on a prescribed set of interventions, or even a packaged model of whole-school reform, the state provides a catalyst for school improvement while leaving the specific strategies up to districts and schools. Whether this new type of reform model is effective in leading to improved achievement for low-performing schools is an empirical question that we turn to now in this article.
Our research into this question is particularly relevant given the recent reauthorization of ESEA, now known as ESSA, which formally ended the NCLB era. President Obama signed the new legislation into law on December 10, 2015, and although it also officially ended the era of waivers, key elements of the waivers still remain. In particular, the new law requires states to identify a set of schools needing “comprehensive support” that, among other things, make up the lowest performing 5% of Title I schools—comparable to the waivers’ Priority Schools—as well as a set of schools needing “targeted support” that have consistently underperforming subgroups of students—comparable to Focus Schools (National Association of Secondary School Principals, n.d.). With regard to the latter set of schools modeled after Focus Schools, states are required to tailor interventions based on unique school needs and to couple these interventions with support and oversight but are otherwise given flexibility. Examining the impact of the reform models that developed in different states under waivers offers us an important opportunity to inform the in-progress implementation of ESSA.
Waivers and Accountability in Louisiana
In this section, we provide an overview of NCLB flexibility waivers and Louisiana’s waiver in the context of the state’s existing accountability system, as well as discuss what this means for the particular treatment contrast examined in this article.
NCLB Flexibility and Differentiated Accountability
In September 2011, the U.S. Department of Education announced that states could apply for flexibility waivers from the toughest requirements of NCLB, in particular, the requirements that they reach 100% student proficiency on math and reading standards by 2014 and that they respond in a number of specified ways toward Title I schools that failed to meet their determined AYP for 2 years in a row. In exchange for this and other forms of flexibility, states had to make plans to adopt a number of new educational policies. Chief among these was the adoption of “college- and career-ready” content standards (which the majority of applying states fulfilled through the adoption of the Common Core), and the development of a system of differentiated recognition, accountability and support.
Under this new differentiated accountability system, states would be required to identify two categories of low-performing schools and implement particular interventions in them. The lowest performing group, those identified as “Priority Schools,” would be made up of at least 5% of the state’s Title I schools and would receive multifaceted and prescriptive interventions consistent with federal turnaround principles. The second group, “Focus Schools,” would be Title I schools that were contributing to the state’s achievement gaps, or Title I high schools with a graduation rate below 60% for multiple years. The Focus Schools had to constitute at least 10% of the Title I schools in the state. Focus School interventions were less prescribed; instead, states were required to implement evidence-based interventions in these schools that were based on assessments of their particular needs (U.S. Department of Education, 2012). Importantly, unlike some federal policies that dictated interventions for struggling schools, such as School Improvement Grants (Dee, 2012), the waivers’ accountability requirements were not attached to any additional funding, requiring states to find ways to use existing Title I funds to pay for their assessment and intervention systems.
The Context of Accountability in Louisiana
Louisiana had been on a trajectory of increased school accountability prior to the enactment of NCLB. In the late 1990s, public criticism over the performance of Louisiana’s schools pushed the state to revamp its testing and accountability structures. The Louisiana Educational Assessment Program (LEAP), the state’s existing standardized tests, had set a low bar for passing and were not attached to any consequences for schools. So the state developed new LEAP tests with math and English rolling out in 1998 and science and social studies in 1999. These tests were used until the 2014–2015 school year, when they were replaced by new exams aligned with the Common Core State Standards. 4
The new LEAP tests were accompanied by a new policy of publicly issuing School Performance Scores (SPS) based primarily on students’ test results. SPS—the calculation of which we discuss in the “Analytical Sample and Variables” section—fell on a scale of 0 to 200 and were intended to bring increased accountability and transparency. Initially, schools that earned fewer than 30 points were labeled as academically unacceptable schools (AUS); this threshold for AUS status gradually increased over time. With each additional year that a school was labeled an AUS, it was required to implement certain strategies meant to spur improvement, such as required reporting, limited school choice, and supplemental education services (SES), in accordance with NCLB requirements. Sanctions on AUS also included the threat of takeover by the state-run Recovery School District, which was created in 2003 and originally was intended as a last resort to turn around failing schools. 5
In the late 2000s, in an attempt to make SPS more meaningful, the state created performance labels corresponding to the numbers: In addition to AUS labels for low performers, schools received stars if they earned 60 or higher—from one star up to five for scores 140 and above. Despite this effort, the state continued to face complaints that the system was unintuitive and a poor representation of schools’ actual performance. The state legislature responded by passing Act 718 in 2010, which mandated that the state assign annual letter grades to schools based on their SPS and publicly announce them every fall. In October 2011, the state announced the first set of A through F school letter grades. In this first year, the cutoff for receiving an F was an SPS less than 65, and 115 schools received an F-letter grade based on their 2010–2011 data.
Louisiana’s Introduction of NCLB Waivers
In February 2012, Louisiana Department of Education (LDOE) submitted its NCLB waiver application. To fulfill the waiver’s requirements regarding a differentiated accountability system, Louisiana aligned its existing school accountability system with the waiver’s guidelines with some modifications. Instead of using the Focus and Priority School definitions that the U.S. Department of Education had prescribed, Louisiana created its own definitions: Under the waiver, Priority Schools would be all schools in Louisiana’s state-run Recovery School District, and Focus Schools would be all remaining schools that either (a) received F-letter grades or (b) were high schools with graduation rates below 60%. Under these state-specific definitions, Louisiana’s Focus Schools were the lowest overall performing schools, based on their SPS, without particular consideration for achievement gaps or Title I status.
The U.S. Department of Education approved Louisiana’s waiver in May 2012. In October 2012, the state released its first official list of Priority and Focus Schools and letter grades for each school along with the baseline SPS on which these designations were based. According to the LDOE’s timeline, the implementation of waiver reforms began at this time (i.e., at the start of the 2012–2013 school year). The first cohort of Priority Schools consisted of the 80 schools in the Recovery School District. The first cohort of Focus Schools consisted of 135 schools. 6
Louisiana also implemented a new policy around teacher tenure at this time, suggesting a potentially relevant contextual mediator of the accountability reforms we study. Starting in the 2012–2013 school year, tenure for both new and experienced teachers became contingent on teacher performance according to their new statewide evaluation system called Compass, effectively making tenure both more difficult to attain and more difficult to keep for lower rated teachers. Descriptive evidence has shown that following this policy change, the overall teacher exit rate increased and that the increase was highest among tenured teachers, retirement-eligible teachers, and teachers in lower rated schools (i.e., in F-grade schools relative to A-schools; Strunk, Barrett, & Lincove, 2017). Because the policy was statewide and implemented in all schools, it does not affect the internal validity of our RD analysis. We have no evidence that teacher turnover varied significantly among lower performing schools near the D-/F-grade threshold. However, if it did, it would suggest teacher turnover as a potential mediator of the accountability reforms and our null findings.
The 1-year lag between the timing of the first school-letter grades (i.e., October 2011) and the first Focus School designations (i.e., October 2012) merits further commentary. In particular, it should be noted that our RD design relies on the baseline SPS used to determine the first cohort of Focus Schools but the second cohort of F-rated schools. As a practical matter, there is considerable overlap between the first and second cohorts of F-rated schools. Of the 115 schools that received an F in the first year of the letter grade system, only five advanced to D grades in the following year while 68 retained F status in both years. Of the remaining 42 schools, 38 closed and four were taken over by charter organizations during the 2011–2012 school year or the summer of 2012. Importantly, these closures and charter transitions took place prior to the start of the 2012–2013 school year and due to their closure or transition, were not assigned 2011–2012 SPS. Therefore, these schools are not part of our “intent to treat” (ITT) population. In other words, the attrition due to closures and restarts preceded Focus School designation and so is not an internal validity threat in terms of evaluating the Focus School impact.
The timing of the first school-letter grades and the first Focus School designations could, however, conceivably complicate the interpretation of our findings if the first year of letter grades improved Louisiana’s lowest performing schools to such an extent that they limited the margin for Focus School interventions to have an impact. The advancement of only five schools from an F to a D in the first year (as noted above) suggests that this scenario is unlikely. To further test for this possibility, however, we estimate RD specifications that use 2010–2011 SPS as a forcing variable to estimate the impact of an F rating on 2011–2012 SPS (i.e., the effect of an original F rating in the 1 year prior to Focus Schools). We find that an F rating had small and statistically insignificant effects. To further scrutinize the possibility that the first year of letter grades had an effect, we also use RD specifications to estimate the impact of the initial rating on an additional performance score measure calculated in 2011–2012 known as the “growth SPS.” This measure did not determine Focus School assignment or 2012 letter grades; however, it was more sensitive to single-year changes in performance. 7 We again find no evidence that the first year’s F rating improved schools’ performance. Finally, to test whether our estimates of the first letter grade’s impact are sensitive to missingness caused by the school closures (or transitions) that occurred prior to the announcement of the 2011–2012 SPS, we estimate models in which we impute both the standard 2011–2012 SPS and the 2011–2012 “growth SPS” for these schools using two different methods: the “last observation carry forward” approach (Krueger, 1999) and the conventional multiple-imputation procedure (Rubin, 1987). 8 Across different RD specifications and imputation methods and for both types of SPS measures, we consistently affirm our finding that there is no evidence of a pre-intervention letter grade effect. The results of all models described here are available on request.
The closure (or transition) of some low-performing schools prior to the Focus School determination does provide a modest external validity caveat to our findings. Specifically, our estimates of the Focus School impact may not be applicable to those low-performing schools that respond to an F grade by opting to close or become a charter. However, it should also be noted that the threshold used to determine the first cohort of Focus Schools (and, correspondingly, the second cohort of F-rated schools) was increased from 65 to 75. This newly ambitious accountability standard introduced with Focus reforms implies that our ITT population includes a number of schools that had a D rating in the prior year and that the threshold defining our local average treatment effect (LATE) estimate is considerably higher than the original F-grade threshold.
It is also worth considering what the likely implications would be if the pre-Focus intervention closures had not occurred. It is reasonable to suppose that the closed schools had a propensity for continued low achievement. Had they remained open, we would expect impact estimates to be more negative than those we report. In other words, if the earlier closure of these struggling schools were to introduce a bias in our estimates, it would most likely be a positive bias. This possibility therefore does not confound our finding that Focus reforms were ineffective, though it does raise the possibility that they in fact had a negative effect.
We discuss the treatment contrast created by the assignment rule and the corresponding Focus reforms and ratings below.
The Focus School Treatment Contrast
The aim of this article is to identify the causal impact of the federally mandated Focus School designation on schools’ student outcomes in Louisiana. But what exactly does it mean for a school to be designated a Focus School in this particular state? Because Louisiana built its waiver reform policies on its existing school accountability system, the answer is twofold. Being a Focus School meant receiving specific types of attention under the state’s waiver reforms, as well as being labeled a failing school via well-publicized letter grades, both of which are determined by earning a low SPS.
We consider the former component of the treatment contrast first: interventions established under Louisiana’s existing accountability system, which they aligned with their NCLB waiver. In its waiver application, the LDOE outlined the supports offered to Louisiana schools. These reforms had two distinctive features. One was a comprehensive data review and needs assessment to help schools diagnose problems and to determine necessary programs/interventions. The second was a coordinated system of support through the LDOE’s technical assistance network, which serves all schools but prioritizes the needs of Focus Schools and focuses primarily on the implementation of Common Core and teacher evaluation systems. The state also indicated that students in Focus Schools would be given the option of transferring to another school with a higher grade, with costs covered by the district. In our analyses, we examine whether such mobility occurred and whether it constitutes an internal validity threat.
Because Focus School interventions were intended to address schools’ specific needs, the interventions were only broadly defined and relied heavily on effective processes for identifying needed supports. However, the available implementation evidence suggests that the state may not in fact have had the systems in place to adequately assess the needed supports and implement effective solutions. In August 2013, the U.S. Department of Education conducted a monitoring review and found Louisiana’s implementation of supports for Focus Schools to be “not meeting expectations.” The evaluation report noted that no evidence had been provided to show that targeted interventions were being implemented in the Focus Schools (U.S. Department of Education, 2014). In December 2014, Louisiana was granted a waiver extension from the federal government, but the letter granting the extension warned that the waiver’s renewal was contingent on improving its plans for implementing and monitoring school improvement interventions for Focus Schools.
This fairly limited view into the state of Louisiana’s waiver implementation indicates that the Focus School interventions as stated in their application may have been subject to weak implementation, at least during their first 2 years. Anecdotally, our review of state documents suggests that the set of treatments and support offered to Focus Schools resemble those offered to all other schools, with the exception of particularly harsh sanctions, suggesting that the special interventions described in the waiver application were not clearly distinctive nor well implemented. If this is indeed the case, then the primary treatment contrast between Focus and non-Focus Schools that we are identifying may be more so the impact of being publicly labeled an F school and less the impact of receiving a standard set of “Focus interventions.” Although there was little press coverage in Louisiana of the Focus and Priority School designations once the waiver reforms were put in place, the annual release of SPS is regularly covered in the news and the introduction of their newly associated letter grades was widely discussed. The letter grade designation is itself a mechanism for accountability and arguably a strong source of motivation for schools and their districts. Moreover, Louisiana’s letter grades formed the basis for the state’s differentiated accountability system required under federal waiver policy, making F grades a meaningful component of the Focus treatment regardless of the strength of additional interventions.
Data and Specifications
In this section, we discuss details on our data and analytical sample as well as the basic econometric specifications we use in this article.
Analytical Sample and Variables
For our analysis, we use publicly available school-level data provided annually by the LDOE on SPS, the underlying state standardized test scores, and Focus School assignments from 2012 to 2015. We supplement this with data on Louisiana schools from the National Center for Education Statistics (NCES) Common Core of Data (CCD), which provides information on schools’ Title I eligibility status, the demographic composition of students, the share of students eligible for FRPLs, and student–teacher ratios.
Our analytical sample consists of traditional primary and secondary public schools. According to LDOE data, there were 1,303 primary and secondary schools in Fall 2012 with valid baseline SPS (i.e., the assignment variable in our RD design). To maintain a focus on traditional public schools that were not already implementing federally prescribed reforms, we drop special education schools (n = 4), vocational schools (n = 3), alternative schools (n = 20), schools with prior School Improvement Grants (n = 12), and charter schools (n = 84). These edits collectively reduce our sample to 1,182 schools. We retain magnet schools in the sample. 9 In addition, because all schools in the Recovery School District are designated as Priority Schools and are ineligible for Focus School assignment, we drop all remaining Recovery School District schools (n = 10), bringing our sample to 1,172 schools.
In this article, we leverage a RD design (discussed in more detail in the following subsection) to identify causal impacts of Focus School assignment. Schools were assigned to Focus School status based on two rules: whether they (a) fell below the SPS threshold for an F-letter grade or (b) were a high school with a graduation rate below 60%. We also eliminate the small number of remaining high schools that had a graduation rate of 60% or below in 2011–2012 (n = 14). 10 This allows us to isolate the treatment effect of assignment across our primary “frontier” of interest, the SPS threshold. We privilege this assignment variable because the vast majority of Focus Schools were identified as such due to their SPS rather than their graduation rate. Our final analytical sample is made up of 1,158 schools, of which 94 are Focus Schools. These 1,158 schools include 681 elementary schools, 217 middle schools, and 260 high schools. 11 The 94 Focus Schools are all school-wide Title I schools. Table 1 provides descriptive statistics of our analytical sample.
Descriptive Statistics for Analytical Sample
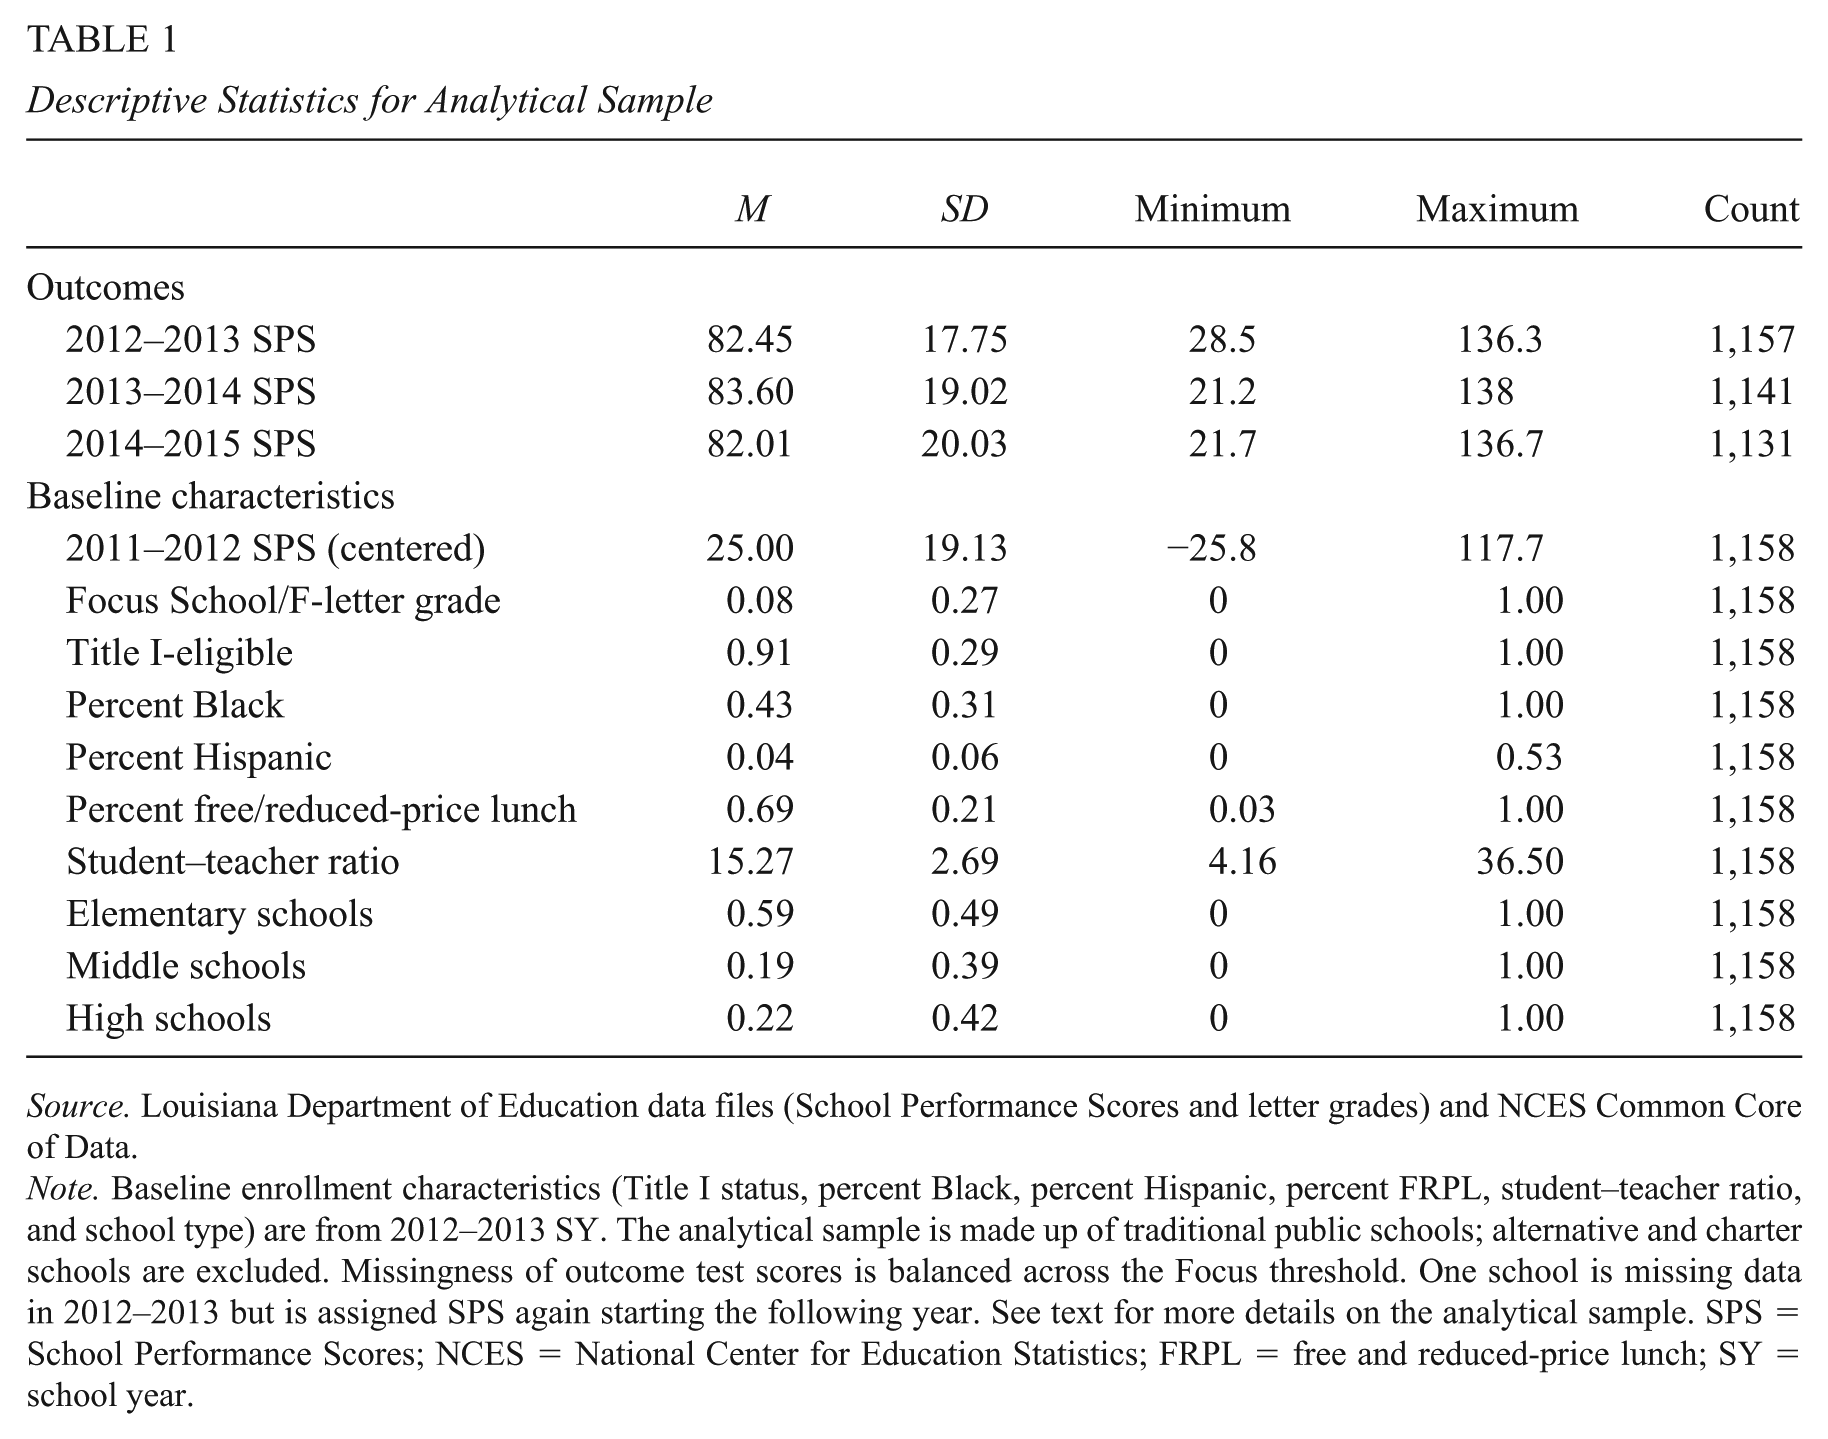
Source. Louisiana Department of Education data files (School Performance Scores and letter grades) and NCES Common Core of Data.
Note. Baseline enrollment characteristics (Title I status, percent Black, percent Hispanic, percent FRPL, student–teacher ratio, and school type) are from 2012–2013 SY. The analytical sample is made up of traditional public schools; alternative and charter schools are excluded. Missingness of outcome test scores is balanced across the Focus threshold. One school is missing data in 2012–2013 but is assigned SPS again starting the following year. See text for more details on the analytical sample. SPS = School Performance Scores; NCES = National Center for Education Statistics; FRPL = free and reduced-price lunch; SY = school year.
Our three main dependent variables of interest are SPS in each of the 3 years following the implementation of the Focus School reforms (i.e., their 2012–2013, 2013–2014, and 2014–2015 SPS). The SPS measures vary by the grades a school serves and, during this period, have a maximum value of 150. For schools serving grades from prekindergarten through sixth grade, the SPS is an index based on student performance on state standardized tests in each of the four core academic subjects (LEAP and integrated LEAP [iLEAP]). 12 For schools serving grades from prekindergarten through eighth grade, 95% of the SPS consists of the test score index while the remaining 5% is based on the success of the school in supporting its students’ transition to high school (i.e., based on dropout behavior and credit accumulation). For schools serving Grades 9 through 12, the SPS reflects equal 25% weights on ACT scores, end-of-course exams, a diploma index based on Advanced Placement and International Baccalaureate exams, and a cohort graduation rate. The SPS for schools serving a combination of grades is a weighted average of the grade-appropriate SPS. There is a modest amount of missingness in the SPS over the first three years of Focus School reforms (i.e., one school in 2013, 17 in 2014, and 27 in 2015). These missing data are due almost exclusively to school closures. 13 However, auxiliary RD estimates indicate that this missingness is balanced across the Focus School threshold and, therefore, does not appear to constitute an internal-validity threat. These results are available upon request.
Our focus on the SPS as an outcome is sensible in that it is the performance measure that both determined Focus status and whether a school would be seen as improving. However, to focus specifically on student learning (and possibly heterogeneous effects by subject), we also use as a dependent variable school proficiency rates on LEAP/iLEAP exams by subject in Grades 3 to 8 for the 2012–2013 and 2013–2014 school years. Unfortunately, neither the SPS nor the available test data provide information on the cognitive performance of student subgroups. However, we strongly suspect that a subgroup analysis would not yield significantly different results from the school-level analysis given that the racial and socioeconomic compositions of schools near the threshold are fairly homogeneous. Around the cutoff, the average school share of Black students in 2012–2013 was about 0.8 and the average share of FRPL-eligible students was around 0.9, which suggests to us that drawing different conclusions from subgroup analyses is unlikely.
Finally, the covariates we include in our analysis are schools’ percentages of Black and Hispanic students, the percent of students eligible for FRPL, student–teacher ratio, and fixed effects for grade level (primary, middle, or high). These data come from the 2012–2013 NCES CCD to reflect the year the implementation of the Focus School policies began. In cases where schools are missing 2012–2013 data, we use their previous year’s data from the 2011–2012 CCD. We privilege the 2012–2013 covariates because by including them in our models, we control for characteristics of the school and student population whose academic performance determines our first outcome variable (i.e., the 2012–2013 SPS outcome). However, it is possible that mid-year student mobility could alter the 2012–2013 data—which does not have to be reported until January to March 2013—making them inaccurate measures of the true baseline. To account for this possibility, we alternatively estimate our models using 2011–2012 covariates, which necessarily precede the Focus announcement and control for the characteristics of the students who determined the assignment variable. These alternative models arrive at consistent results. When we examine covariate balance, we do so using both the 2012–2013 and 2011–2012 covariate data.
RD Design and Assignment to Treatment
In this study, we use a “sharp” RD specification to estimate the causal impact of Focus School designation on the performance of Louisiana schools. This estimation strategy leverages the fact that Focus School assignment is determined by whether a continuous rating variable—here, the baseline SPS—is above or below an arbitrary threshold value. As mentioned previously, we eliminate all high schools with a graduation rate of 60% or below from our sample, to conduct a “frontier RD” analysis that focuses specifically on schools for which the SPS assignment rule applies (i.e., the vast majority of Focus Schools). 14 The resulting assignment scenario creates a sharp and plausibly exogenous assignment between treatment and control groups among those schools with SPS very close to the threshold. It is important to note, however, that alternative specifications where we do not drop these high schools, thus making the discontinuity “fuzzy,” arrive at consistent results (we discuss this in more detail in our “Results” section). Our straightforward RD design allows us to determine the effect of the combined Focus School and accountability labeling for those schools local to the “failing” threshold in their 2011–2012 SPS.
We use the following general model to identify the estimated treatment effect

Here,
Before estimating treatment effects, there are multiple key assumptions that are necessary to examine. One assumption is that there is no manipulation of the underlying continuous forcing variable—in other words, that SPS scores are independent of the cut point and that falling on one side of the threshold versus the other is as good as random for those schools near to it. Although it is reasonable to think that schools would have a strong motivation to score just above the cutoff point for an F-letter grade, there is little evidence to suggest that they would be able to systematically manipulate their SPS to do so. SPS are based primarily on standardized test scores, which would be difficult for schools to manipulate outside of outright cheating (e.g., changing student answers). In addition, 2011–2012 was only the second year that the state assigned letter grades based on SPS. Although the components of each school’s SPS were clearly stated, it was likely not clear to schools how their day-to-day actions would translate into a score that was just high enough to keep them from avoiding F status. Such anticipatory responses on the schools’ part seems even more implausible given that in 2011–2012, the threshold for F grades was raised to 75 or below, up from 65 or below the previous year. Even though schools knew in 2011–2012 that this shift would be coming, the change in threshold gave schools little experience of what “just good enough” educational practices would look like on the ground.
Figure 1 shows the density of the 2011–2012 SPS, centered at the cut score of 75, which throughout the article we will refer to as the forcing variable. The SPS are calculated to the 0.1 decimal place. The density test introduced by McCrary (2008) examines the null hypothesis that the distribution of observations is smooth at the threshold. A rejection of this hypothesis would indicate that observations cluster on one side of the threshold (i.e., possibly due to manipulation). Figure 1 shows that there are no significant jumps in density at the cut score. Figure 2 shows histograms of the forcing variable, to give us a better perspective on whether there is any abnormal heaping of the forcing variable that may not be apparent in an estimated density. While the full histogram suggests potential evidence of heaping on the right-hand side of the cut score, a zoomed-in version with a smaller bin width (Figure 2b) shows little evidence of abnormal heaping. 15 Overall, this graphical evidence collectively suggests that there is no evidence of manipulation of the forcing variable.
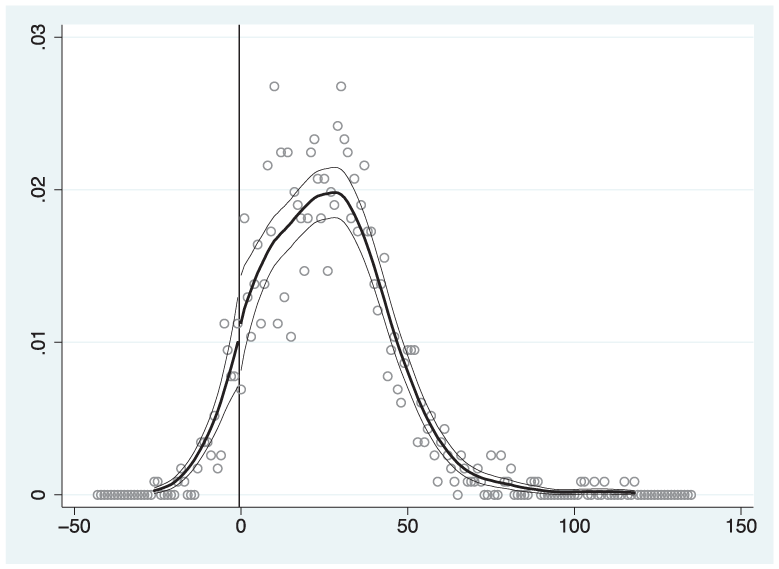
Density of the forcing variable.

Histograms of the forcing variable: (a) Full analytic sample. (b) Restricted bandwidth Si ≤ 40.
Another key consideration for an RD estimation is determining whether the RD in question is sharp or fuzzy. In other words, to what extent do schools in our sample fully comply with their Focus School treatment assignment determined by their SPS? Figure 3 shows the probability of a school being a Focus School based on their 2012 school performance score, centered at the cut score of 75. We can see that at the cut score, the probability jumps sharply from 0 to 100. Indeed, once we limit our sample to the “frontier” sample by eliminating all high schools with graduation rates of 60% or below, the RD is completely sharp. However, it should be noted that, over our 3-year study window, a small number of schools (n = 25) newly entered Focus status. This would introduce some fuzziness in our first-stage relationship if one chose to define treatment as ever being in Focus status rather than as being in the first large Focus cohort. Our analysis emphasizes the reduced-form effects of the ITT, which allows us to examine potentially heterogeneous dynamic treatment effects after the first, second, and third year. However, comparisons across years should rely on “treatment on treated” (TOT) rather than ITT estimates so that the causal estimands being considered are comparable.
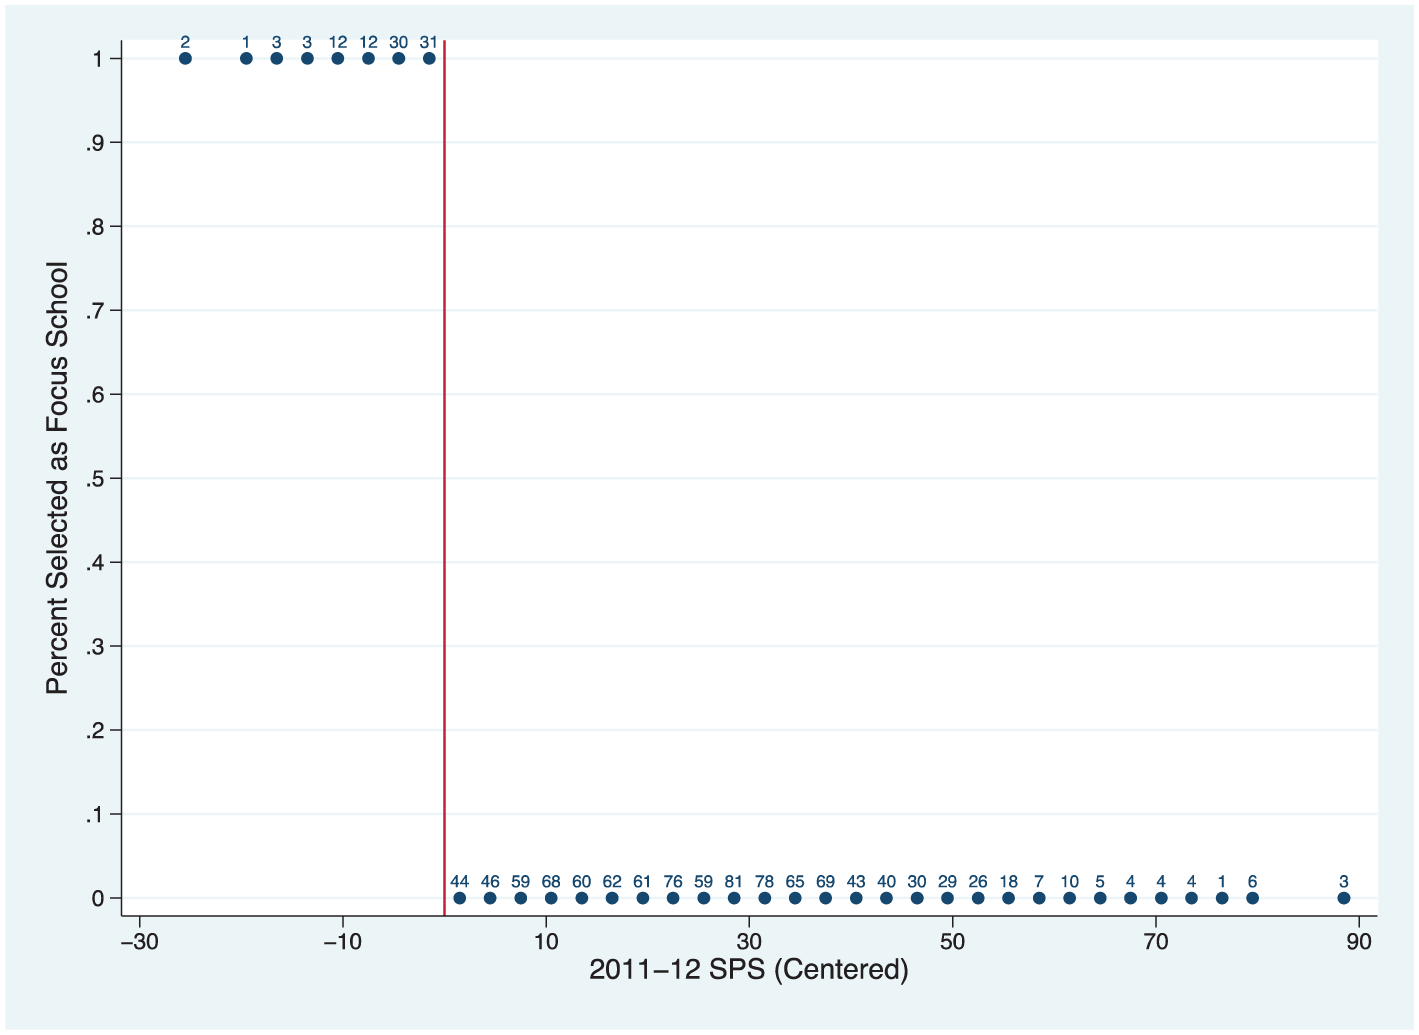
Focus School assignment.
Finally, we have the assumption that schools in a close neighborhood to the cut score are not systematically different depending on which side of the threshold they are on. To test the validity of this assumption, we consider whether there is any evidence that these schools differ based on observables by analyzing whether the observable covariates included in our analysis—school type (elementary, middle, or high), student–teacher ratio, and percentages of Black, Hispanic, and FRPL eligible in both the 2011–2012 and 2012–2013 school year—are continuous across the threshold. Our findings suggest that the schools are not observably different on either side of the threshold, which supports our assumption that they are no different on unobservables either. 16 We also test for imbalance in missing outcome data across the threshold out of concern that school closures or other causes of missing data might be more likely for failing schools, but we find no evidence of imbalance. 17 As mentioned in the section “The Focus School Treatment Contrast,” a considerable number of schools that received Fs in 2011—38 in total—are closed prior to the start of the 2012–2013 school year. It is possible that in the first year of the letter grade system, an F grade induced the worst schools to close and effectively weeded out the very bottom, so that by the following year when Focus reforms began, an F grade did not disproportionately induce schools to close. Finally, we test for imbalance in the log of total student enrollment. It is possible that the aforementioned school closures could result in a disproportionate influx of new students to schools above or below the threshold. Again, however, we find no evidence of an imbalance. See the appendix for more details on covariate balance.
Results
We first illustrate our findings graphically by showing the subsequent school-performance measures as a function of the baseline SPS that determined a school’s Focus status (and whether it received an F label). First, Figure 4a shows the SPS for our full analytical sample in 2012–2013 (i.e., the first treatment year). Figure 4b shows the same data but only within a bandwidth of 20 points relative to the threshold value that determined treatment status. Figures 5 and 6 similarly illustrate SPS for 2014 and 2015, respectively. These figures suggest that the relationship between current and baseline SPS scores exhibits mild curvature over the full range of data but is more clearly linear over tighter bandwidths of the data. More critically, this visual evidence does not show any notable jumps in school performance at the threshold for any year with the possible exception of a modest decrease after 3 years (i.e., the 2015 SPS in Figure 6).
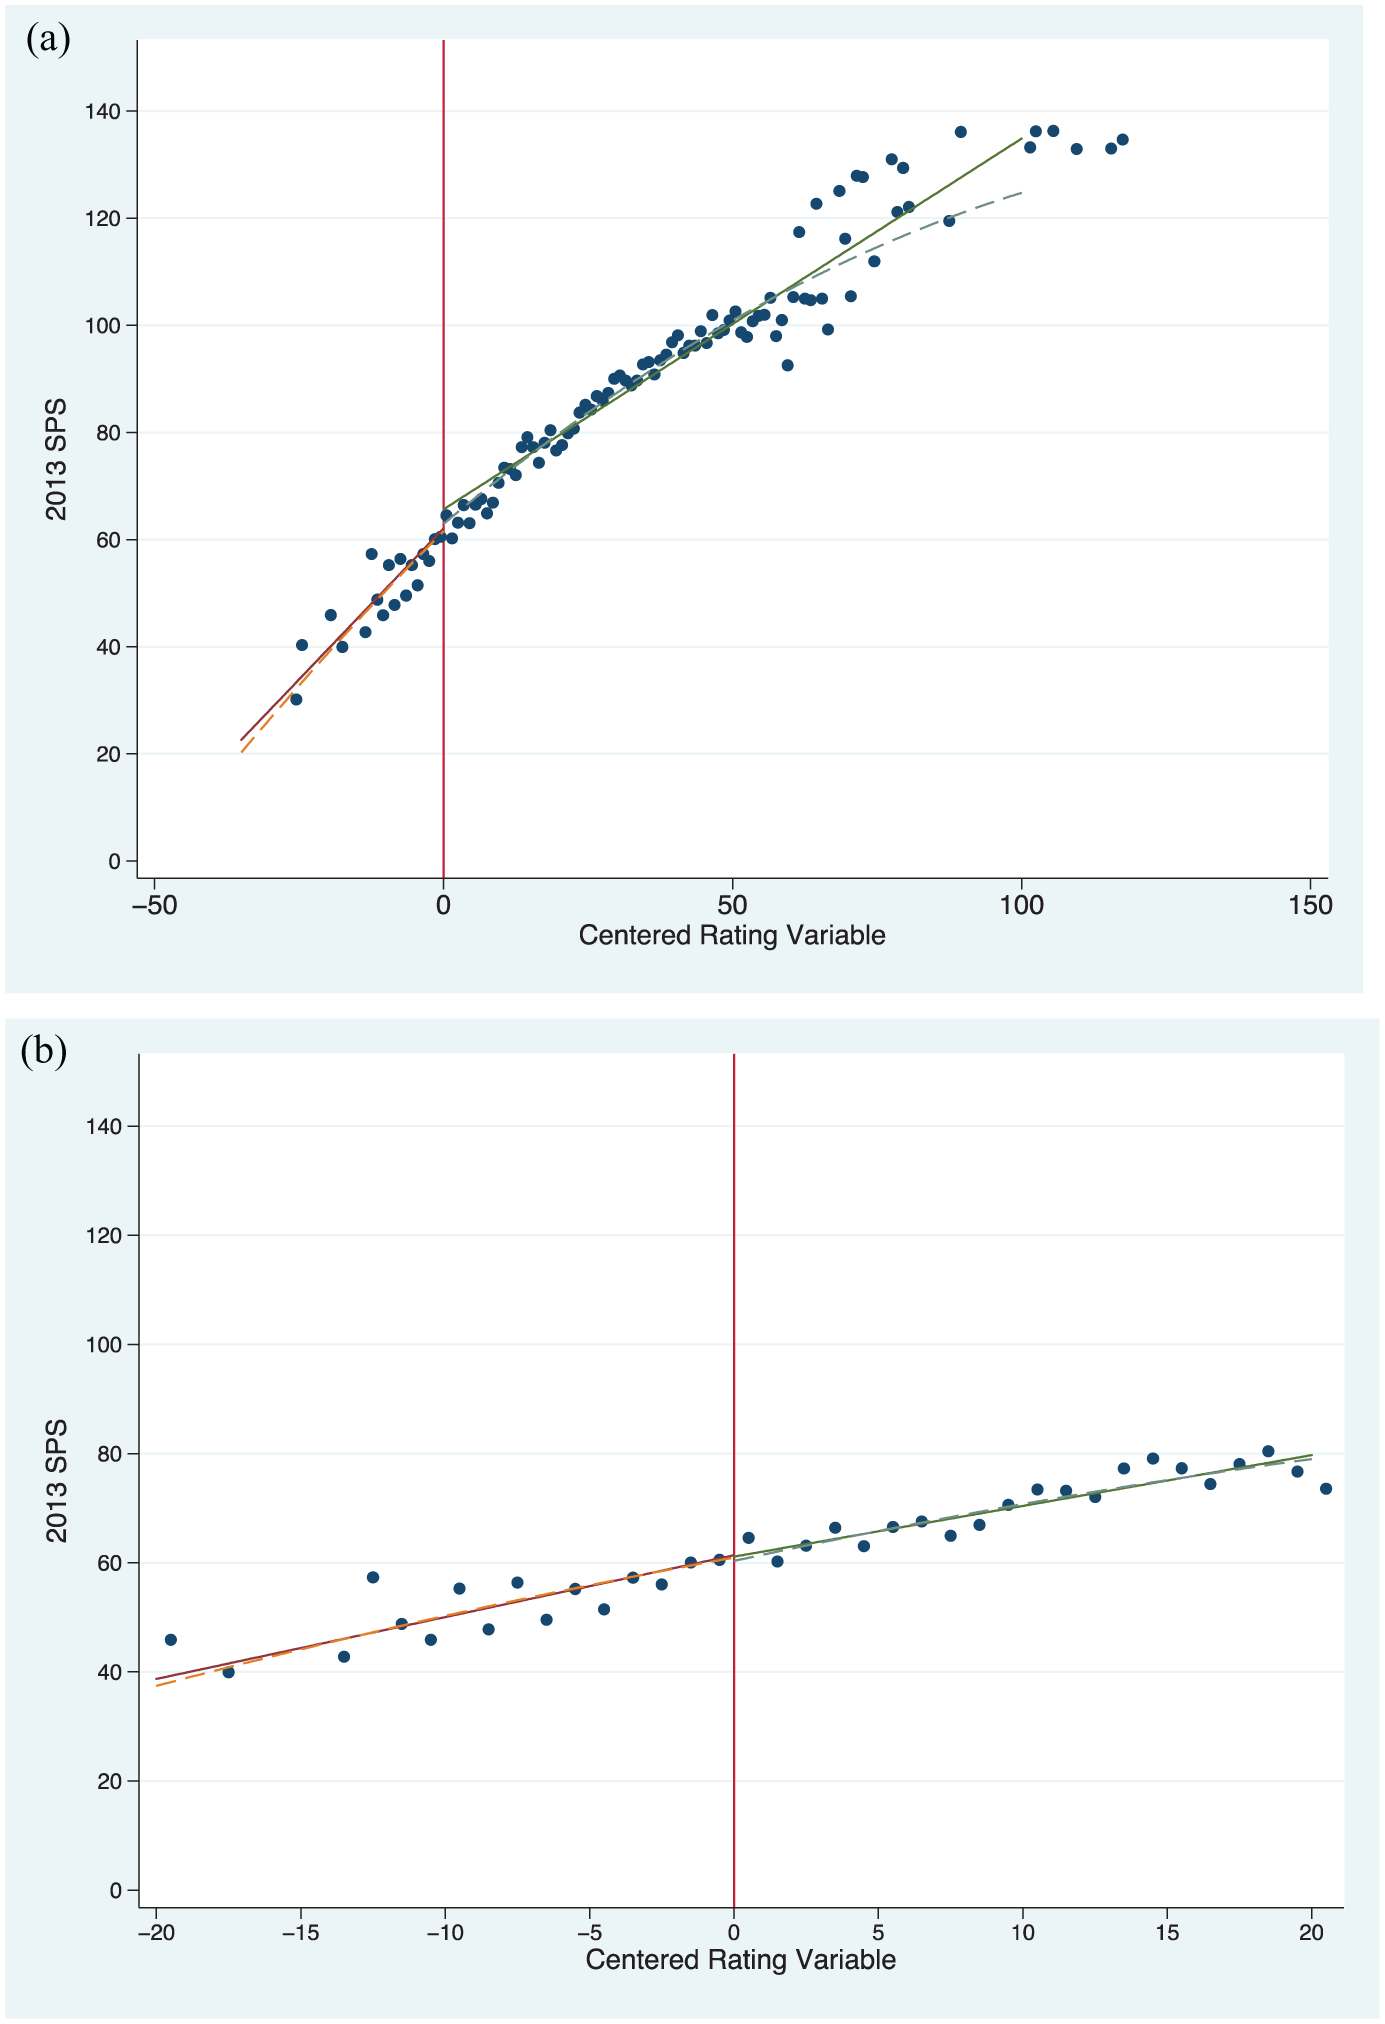
2013 School Performance Scores by centered rating variable: (a) 2013 School Performance Scores, full sample. (b) 2013 School Performance Scores, restricted bandwidth Si ≤ 20.
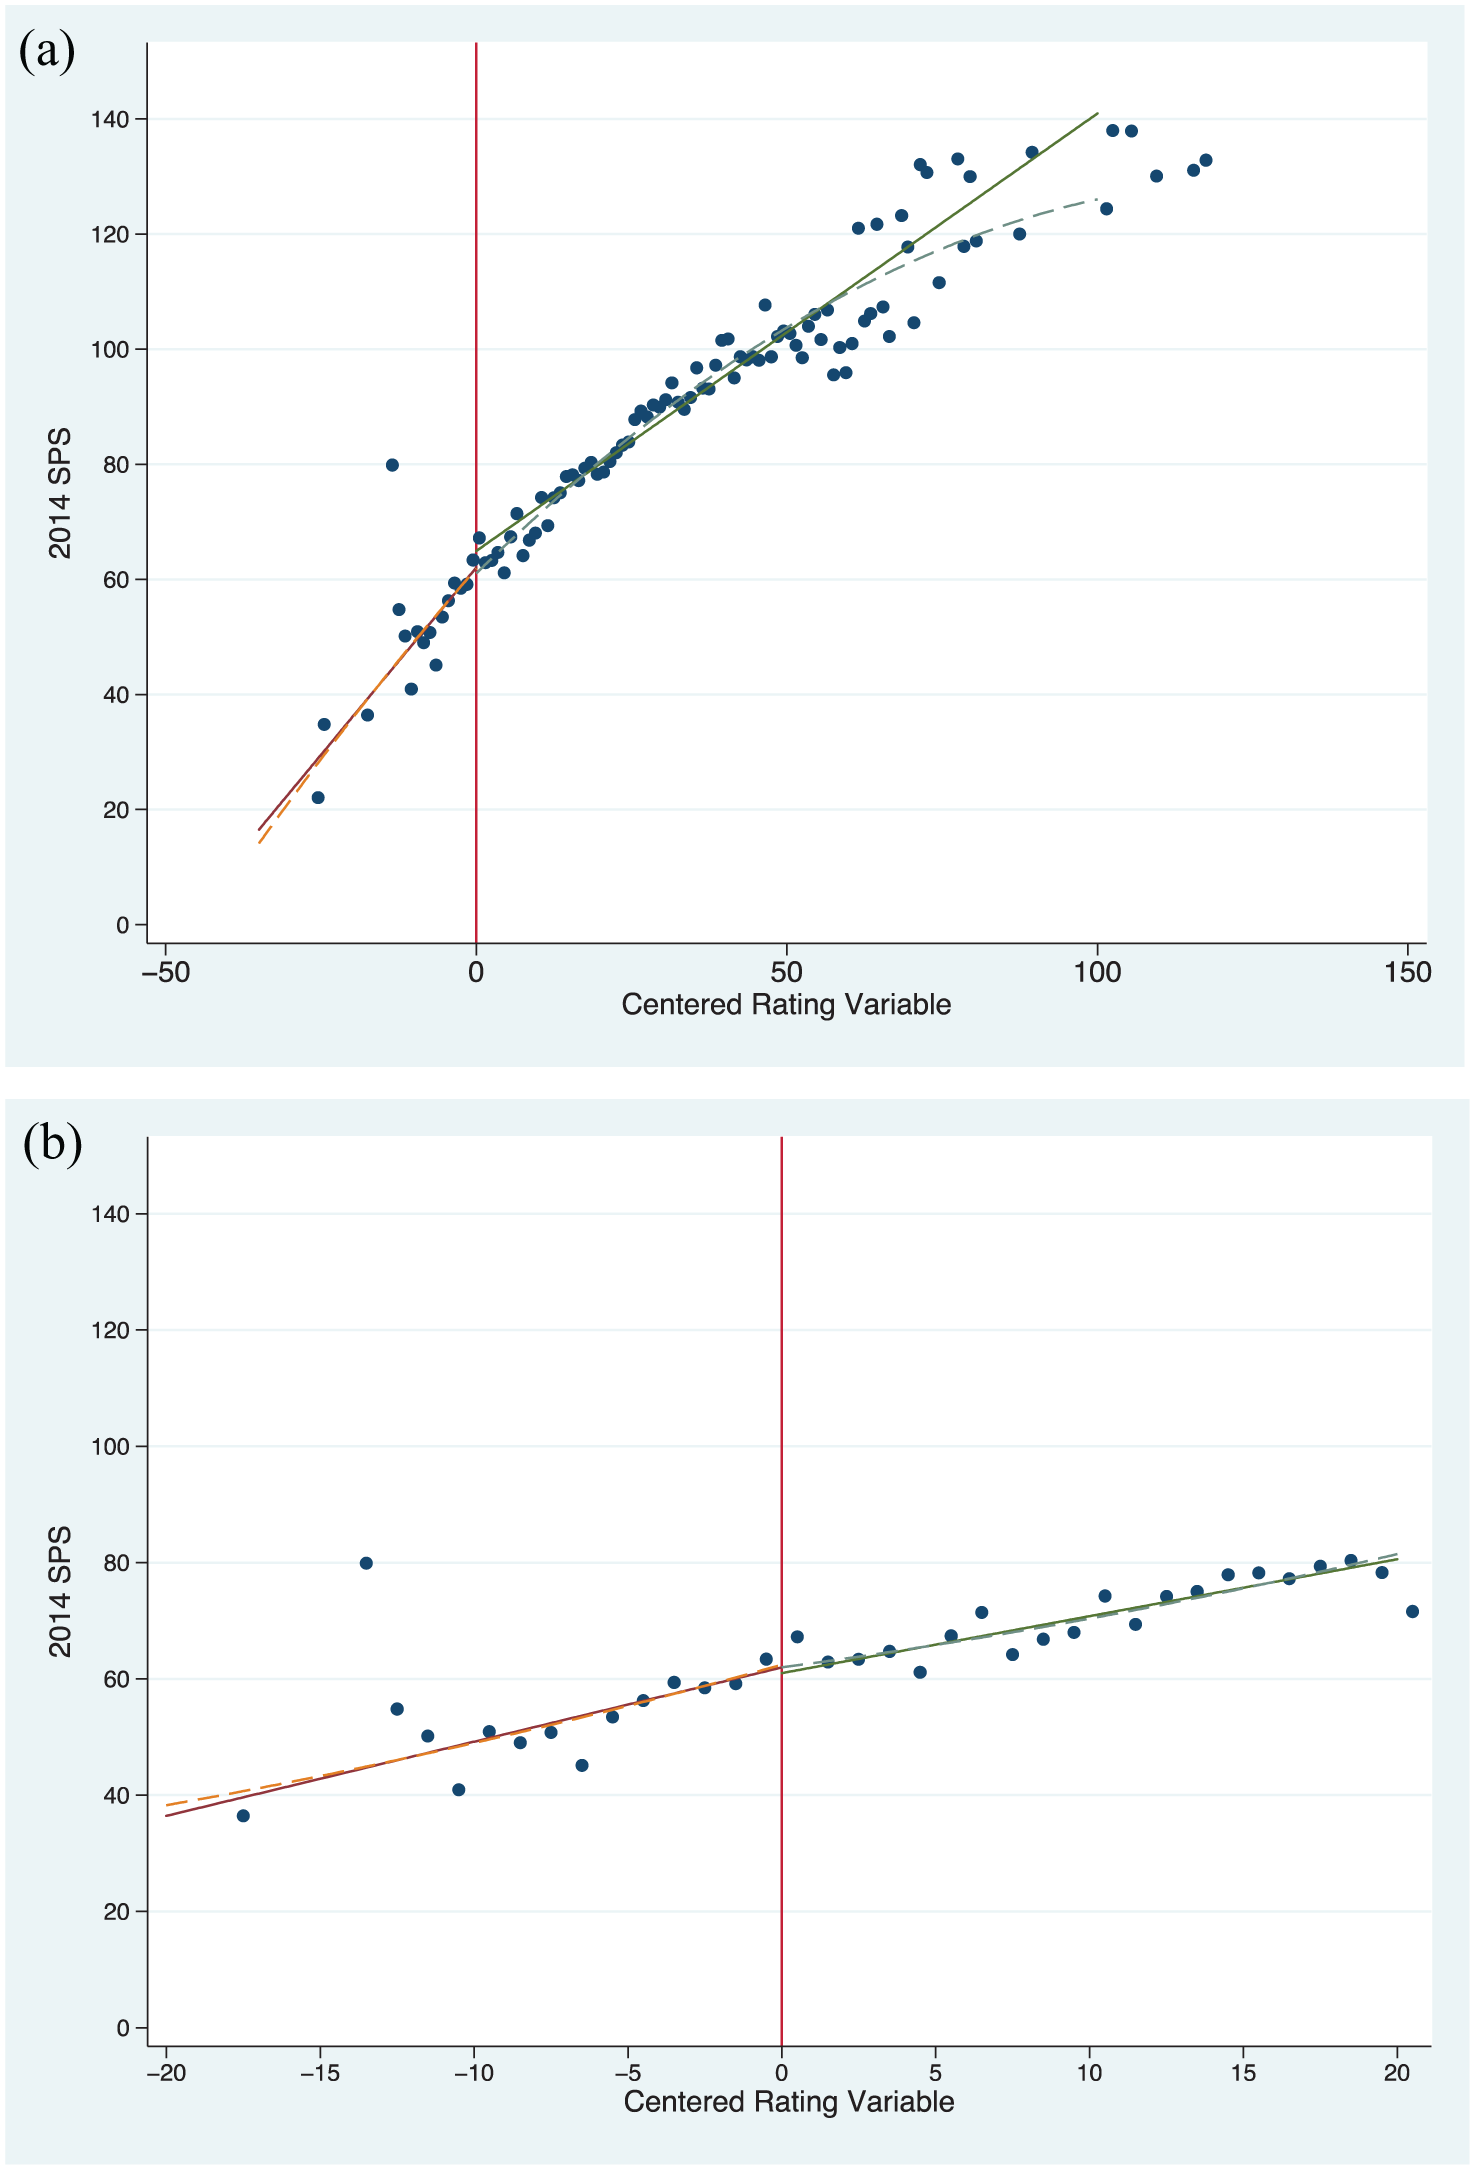
2014 School Performance Scores by centered rating variable: (a) 2014 School Performance Scores, full sample. (b) 2014 School Performance Scores, restricted bandwidth Si ≤ 20.

2015 School Performance Scores by centered rating variable: (a) 2015 School Performance Scores, full sample. (b) 2015 School Performance Scores, restricted bandwidth Si ≤ 20.
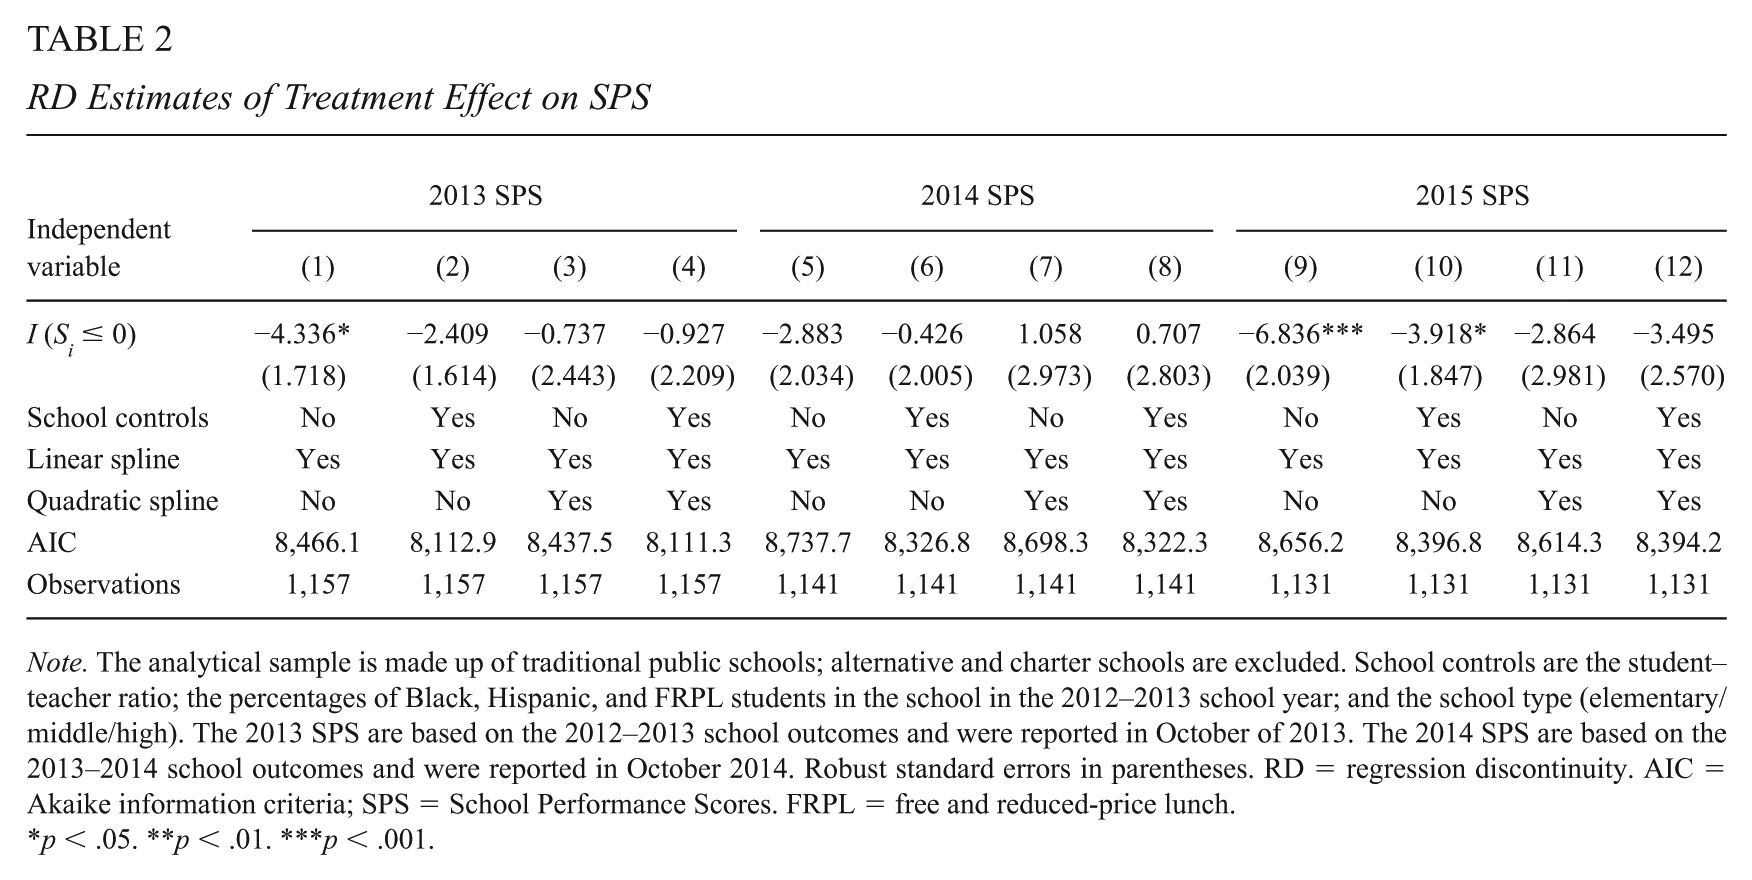
In Table 2, we present the key regression results for versions of Equation 1 that correspond to these figures. The estimated parameter of interest, α, identifies the jump in future SPS measures at the threshold that defines Focus School (and F) status. The first two columns for each outcome measure show results for a linear spline model, where the slope can change on either side of the threshold. The second two columns for each outcome measure show results for a quadratic spline model, where both the slope and the curvature can change on either side of the threshold. School-level controls are included in the even-numbered columns in the table.
RD Estimates of Treatment Effect on SPS
Note. The analytical sample is made up of traditional public schools; alternative and charter schools are excluded. School controls are the student–teacher ratio; the percentages of Black, Hispanic, and FRPL students in the school in the 2012–2013 school year; and the school type (elementary/middle/high). The 2013 SPS are based on the 2012–2013 school outcomes and were reported in October of 2013. The 2014 SPS are based on the 2013–2014 school outcomes and were reported in October 2014. Robust standard errors in parentheses. RD = regression discontinuity. AIC = Akaike information criteria; SPS = School Performance Scores. FRPL = free and reduced-price lunch.
p < .05. **p < .01. ***p < .001.
The results for the most part suggest that being part of the first cohort of Focus Schools did not have a significant impact on the performance of those schools. There are few exceptions, the first of which is in column (1), where we see a statistically significant (and negative) effect when the outcome variable is 2013 SPS. However, this specification includes no school controls and when controls are added, the point estimate is cut in half and the statistical significance goes away. In addition, we see significant negative point estimates in columns (9) and (10) for the linear specifications of the 2015 SPS outcomes. The significance remains even when controls are added. This suggests that in the third year following the start of the schools’ Focus treatment, this first cohort of schools was actually performing significantly worse than other low-performing schools.
We do not take this finding at face value, however. Referring back to Figures 4a, 5a, and 6a, we consistently see that the distribution of performance outcomes when ranked by the centered rating variable has considerable variance in the tails, particularly the upper tail. It is straightforward to see that a linear spline model using the full sample of data does not fit the data particularly well. To assess this observation more formally, we also calculate the Akaike information criteria (AIC) for these full sample models and include them in Table 2. A smaller valued AIC indicates a better fit of the model to the data and, as the table shows, the information criteria indicates that, when using the full sample, a quadratic spline model is a more appropriate specification for all 3 years of SPS outcomes. Given this, our estimates suggest that there was no significant impact—positive or negative—of Focus School assignment on the first cohort of schools.
The results in Table 2 are reduced-form ITT results for the first cohort of Focus Schools in each of 3 years following the reforms. However, it should be noted that a small number of new schools entered Focus School status during Years 2 and 3 and a number of initial Focus Schools exited that status, particularly in Year 3. Specifically, using a quadratic specification with controls, the first-stage estimates for the effect of being just below the 2012–2013 SPS threshold (i.e., the forcing variable we use throughout the paper) on Focus status in Years 2 and 3 are 0.93 and 0.21, respectively, instead of being sharp. These estimates can easily be used to convert the ITT estimates reported in Table 2 to “treatment on treated” estimates of the impact of the Focus School reforms. As a practical matter, these TOT estimates imply similar conclusions. For example, dividing the relevant ITT estimate from the same quadratic specification by the corresponding first-stage estimates implies that the effect of being in the second year of Focus status was approximately 0.760 and statistically insignificant.
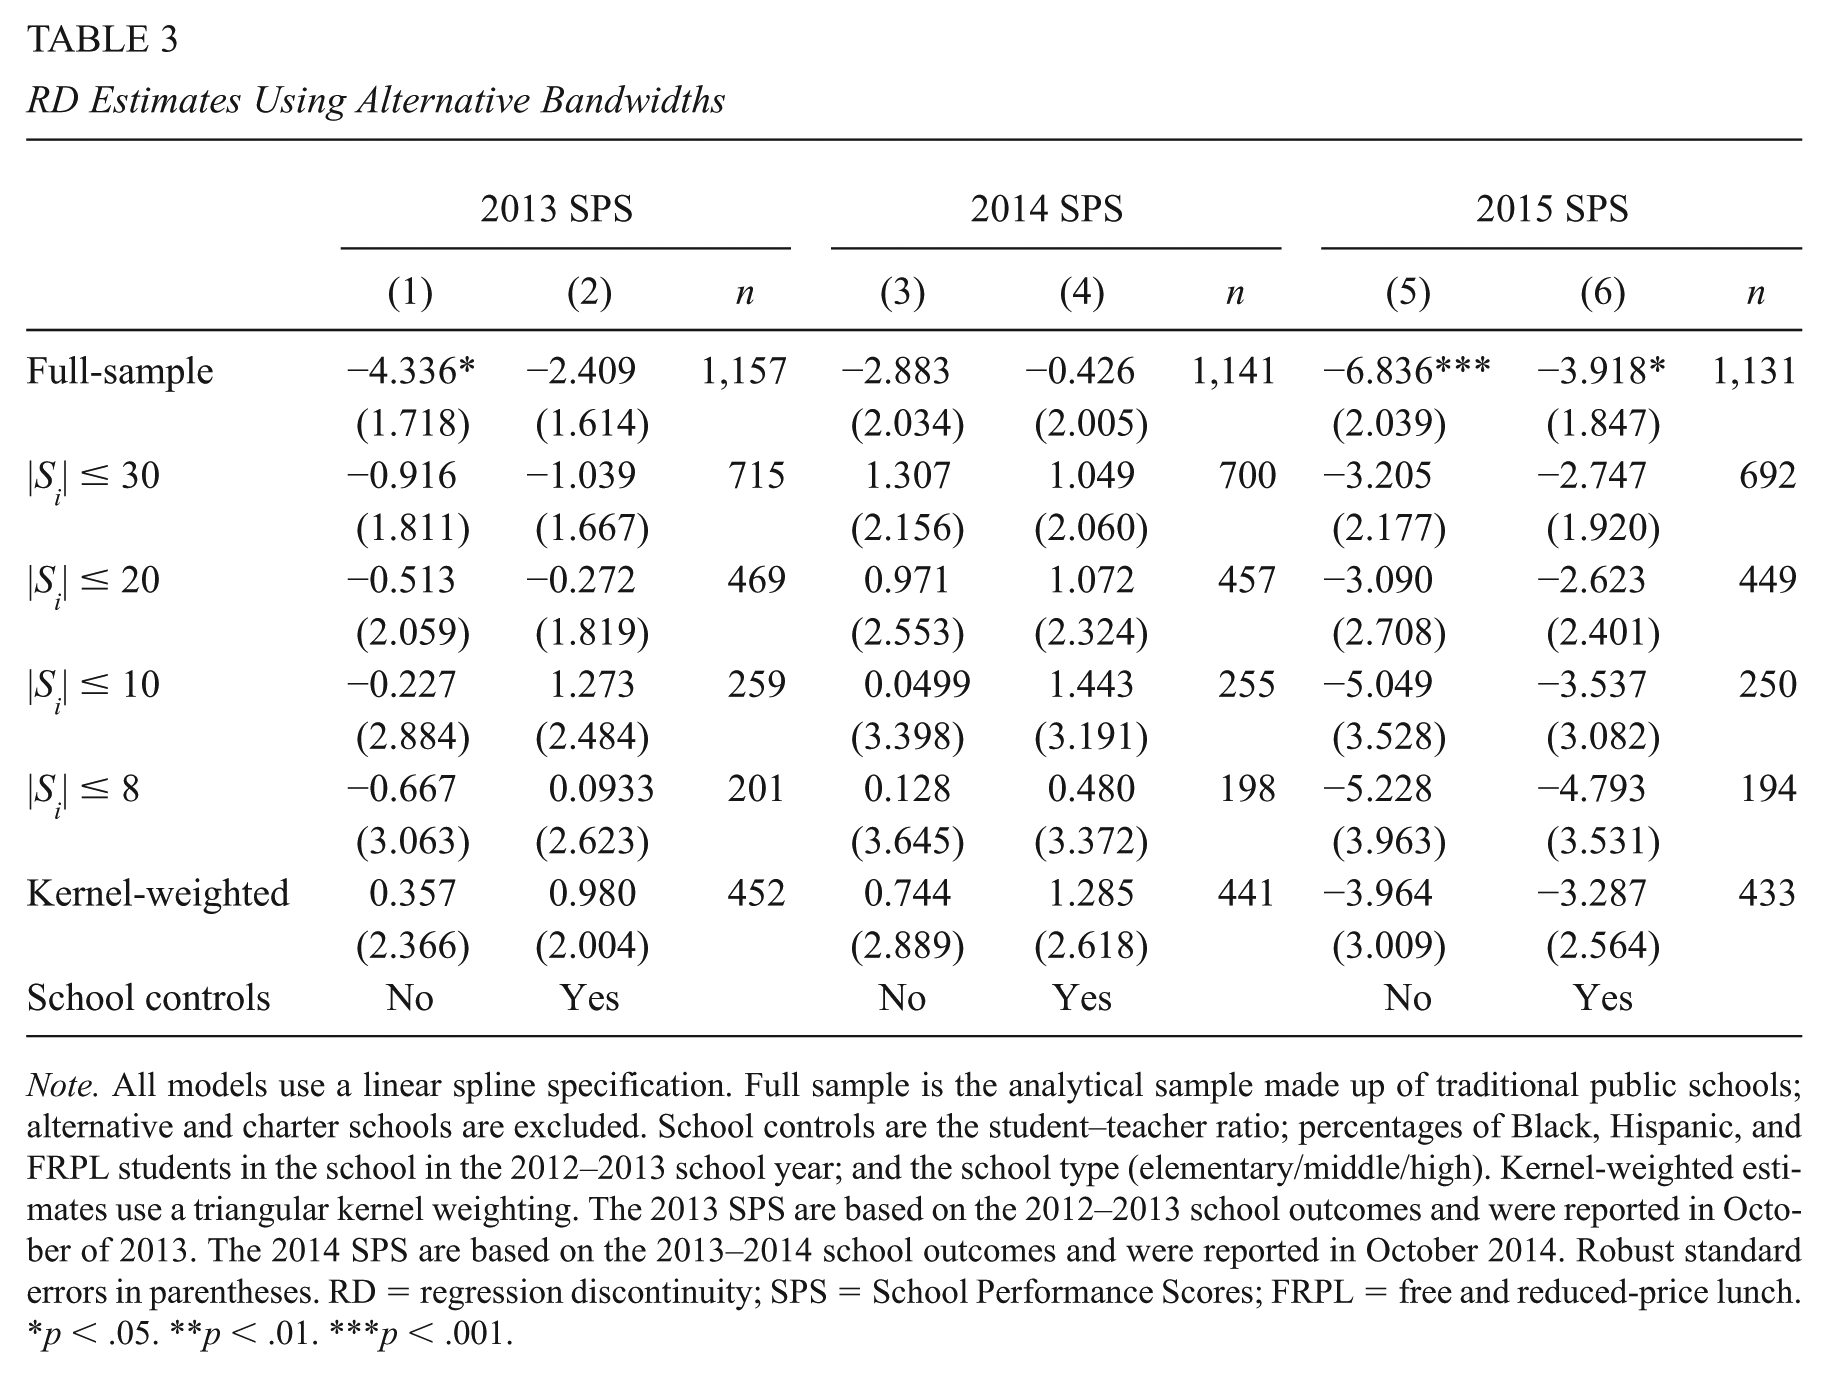
To test the robustness of our main results, we examine the main reduced-form results described above in specifications that rely on alternative bandwidths, as discussed in the “Data and Specifications” section. Table 3 shows our results for our estimated α coefficient using the full sample as well as results for local linear regressions using subsamples defined by bandwidths of 30 points down to 8 points. For context, the suggested bandwidth that is calculated using the Calonico, Cattaneo, and Titiunik (2014) procedure ranges from 7.4 for the models with 2015 SPS as the outcome to 9.3 for models with 2014 SPS as the outcome. The optimal bandwidth according to the Imbens and Kalyanaraman (2012) algorithm ranges from 15.0 when 2013 SPS is the outcome to 26.7 when 2014 SPS is the outcome. And the bandwidth suggested from a cross-validation procedure that aims to minimize mean squared error ranges is estimated to be 25.6, regardless of the outcome year. In addition to varying the bandwidths, we also estimate the α coefficient using a triangular kernel-weighted subset of data, where we weigh data points by decreasing amounts the further they are from the threshold. With the exception of the spurious full-sample evidence for negative effects noted above, none of the alternative specifications yield a significant estimate for the treatment effect for 2013, 2014, or 2015 results. 18
RD Estimates Using Alternative Bandwidths
Note. All models use a linear spline specification. Full sample is the analytical sample made up of traditional public schools; alternative and charter schools are excluded. School controls are the student–teacher ratio; percentages of Black, Hispanic, and FRPL students in the school in the 2012–2013 school year; and the school type (elementary/middle/high). Kernel-weighted estimates use a triangular kernel weighting. The 2013 SPS are based on the 2012–2013 school outcomes and were reported in October of 2013. The 2014 SPS are based on the 2013–2014 school outcomes and were reported in October 2014. Robust standard errors in parentheses. RD = regression discontinuity; SPS = School Performance Scores; FRPL = free and reduced-price lunch.
p < .05. **p < .01. ***p < .001.
One potential concern readers may have with our estimation is that the relatively small sample size of first cohort Focus Schools (n = 94) may give us insufficient power to detect results. However, our null results are estimated fairly precisely, implying that, at best, the reforms had only a modest impact on the state’s most challenged schools and that we can reject effects in terms of student-level standard deviations. Using the estimates from column (4) in Table 2, the 95% upper confidence limit for the impact estimate is approximately 3.5 points on the SPS scale, an effect size of nearly 0.20 SD at the school level. Using a variance-components framework and assuming an intra-class correlation of .10, it is straightforward to show that a school-level effect size is roughly 3 times larger than a conventional student-level effect size. Thus, the implied upper bound estimate is less than 0.07 standard deviations at the student level.
To increase our statistical power, however, we also examine models in which we stack our three school years of outcome data to see whether they offer additional insights. Specifically, we run regressions for both full-sample linear and quadratic splines, as well as local linear regressions with restricted bandwidths, for models where the unit of observation is school by year and our controls include year fixed effects. Because additional schools gain Focus status in the second and third year of the reform, estimating the effect of ever being a Focus School requires a “fuzzy” RD specification. Estimating a TOT effect using two-stage least squares (2SLS) on these pooled data, we similarly find no evidence that these reforms led to statistically significant increases in school performance, despite having smaller standard errors. For example, the quadratic model with controls estimates a TOT effect of −1.4 with a standard error of 1.7, suggesting a 95% confidence interval of approximately −0.3 to 0.1 standard deviations. We also examined stacked school-year ITT models that allow for separate jump parameters for each of the three outcome years. For this analysis, we find that the 2015 α coefficient is negative and statistically significant for the full-sample linear specification and the full-sample quadratic (with point estimates of approximately −3.2 and standard errors of approximately 1.6 for both functional forms). However, an F test of the equivalence of the three treatment effects in both the linear and quadratic models indicates that we cannot reject the null that the treatment effect is the same across years, so we again conclude that the evidence around the 2015 outcomes is only suggestive. These and all other supplemental results are available upon request.
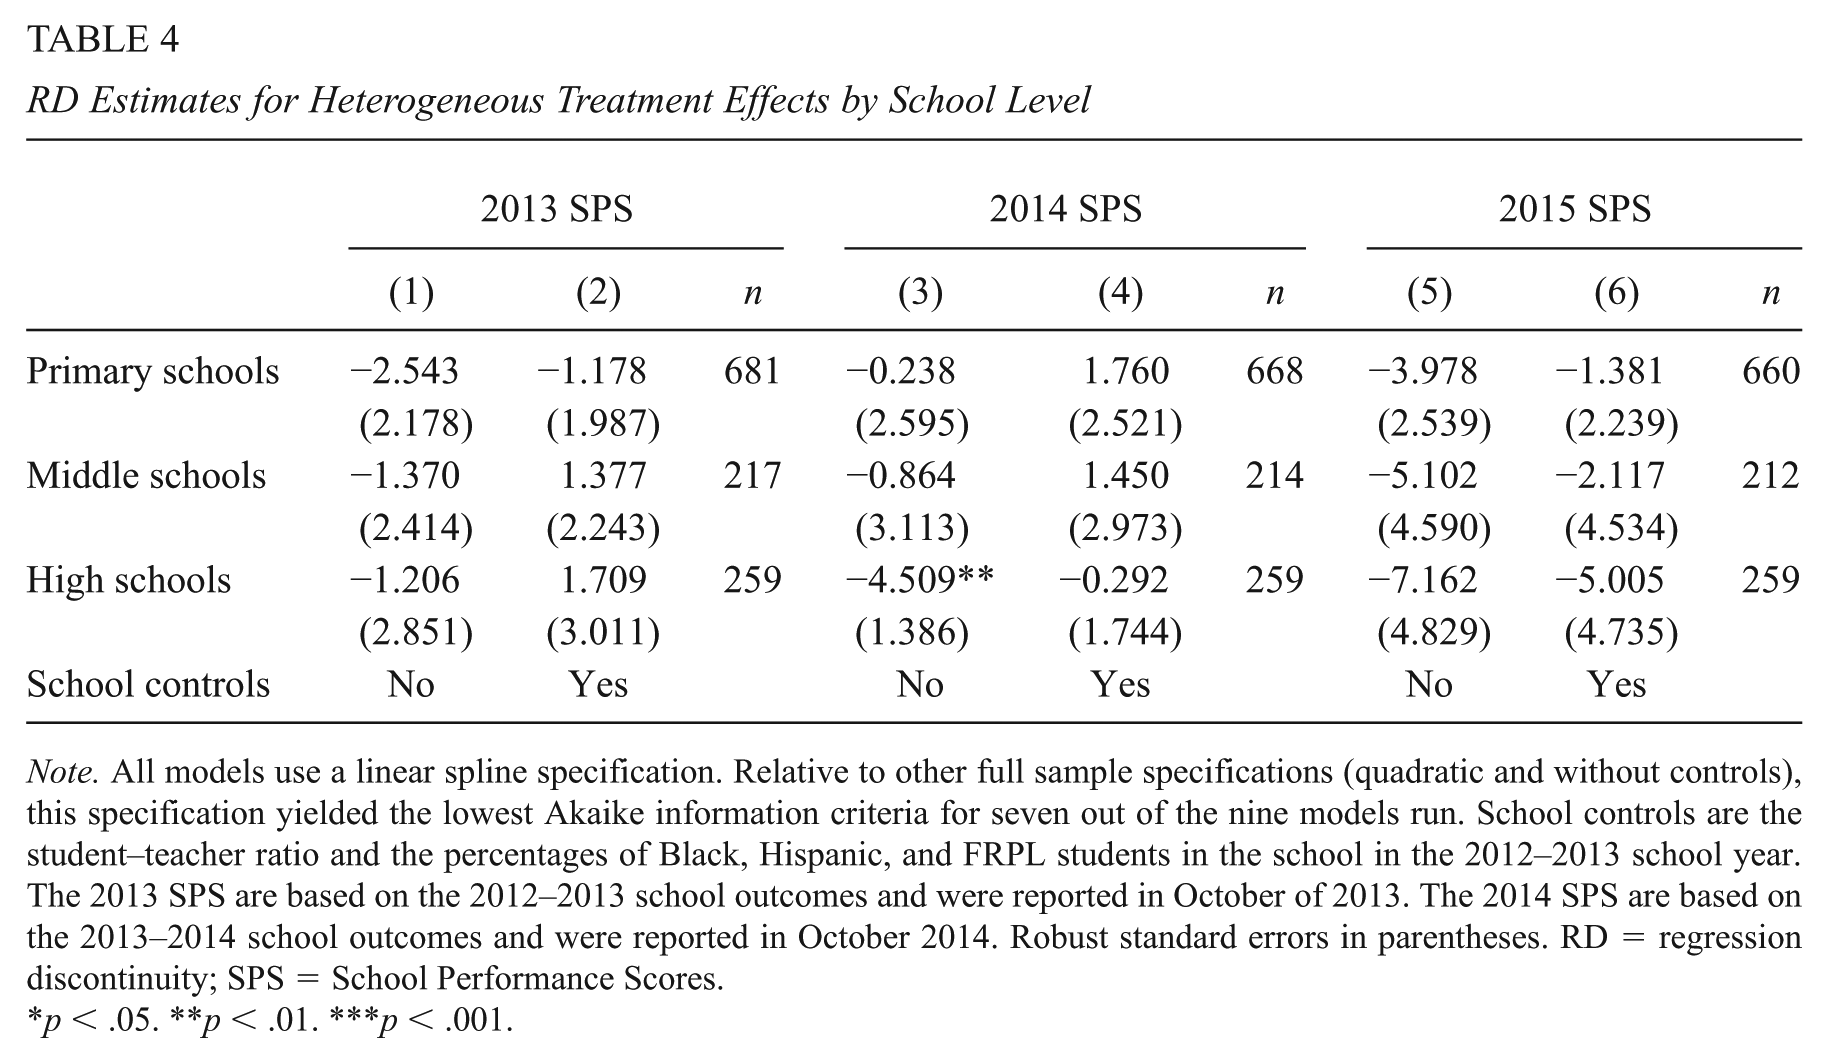
It is possible that all of these aggregate models may be masking heterogeneous effects of Focus School assignment that differ by type of school. More specifically, it is reasonable to think that the types of interventions and responsiveness to interventions may differ depending on whether a school is a primary, middle, or high school. In addition, because the components of SPS differ by school level, it is possible that some components are more responsive to the treatment than others. To examine these possibilities, we estimate separate regressions for primary, middle, and high schools. The results for full sample, linear spline specifications are shown in Table 4. 19 These models do not yield significant treatment effects for primary, middle, or high schools. The one exception is the estimate for the effect on 2014 SPS outcomes for high schools. However, when school controls are added the point estimate changes significantly and the statistical significance goes away. The large change in estimates with and without controls is likely because there are only five Focus high schools, making the estimates for the impact on their performance fairly imprecise. Although not included in Table 4, the results for heterogeneous effects (elementary, middle, and high) are robust to alternative models that limit the data to narrower bandwidths around the threshold.
RD Estimates for Heterogeneous Treatment Effects by School Level
Note. All models use a linear spline specification. Relative to other full sample specifications (quadratic and without controls), this specification yielded the lowest Akaike information criteria for seven out of the nine models run. School controls are the student–teacher ratio and the percentages of Black, Hispanic, and FRPL students in the school in the 2012–2013 school year. The 2013 SPS are based on the 2012–2013 school outcomes and were reported in October of 2013. The 2014 SPS are based on the 2013–2014 school outcomes and were reported in October 2014. Robust standard errors in parentheses. RD = regression discontinuity; SPS = School Performance Scores.
p < .05. **p < .01. ***p < .001.
Our preferred sample restrictions, as described previously, include dropping all high schools that would be eligible for Focus status because of their low graduation rate, thus creating a sharp RD across the SPS threshold. However, to check whether limiting our sample in this way affects our estimates, we also estimate our main results for an analytical sample with all high schools included (using 2SLS instrumental variable regression, as this becomes a fuzzy RD) and with no high schools included. These alternative specifications do not substantively affect our results.
We also consider the possibility that using the composite School Performance Score as an outcome measure may obscure effects on test scores in particular subjects (i.e., LEAP and iLEAP). We therefore run our regression models using the available 2013 and 2014 grade-level data from each school on proficiency rates in Math, English language arts (ELA), Science, and Social Studies tests as our outcome variables, stacking the data and including grade fixed effects. Because the unit of observation is school grade, the sample size in each subject is larger than in our main school-level models, with 3,178 to 3,179 observations in the full sample for 2013 and 3,137 to 3,139 in the full sample for 2014 (depending on subject). The missingness for LEAP/iLEAP scores for each subject in each year is balanced across the threshold. Following Louisiana’s own definition of “proficient,” we calculate the percent proficiency as the percent of students scoring Advanced, Mastery, and/or Basic on the state tests, across all grades in the school that take the LEAP or iLEAP in the subject of interest. 20 Our results using both the full sample and a subsample limited to a bandwidth of 20 points are shown in Table 5. We additionally show results for specifications that stack the 2013 and 2014 proficiency data and incorporate year fixed effects to increase our statistical power. Consistent with our other models, we find no evidence of significant impacts on test performance. For example, if we use the same method of estimating treatment effects at the student level as we described earlier, our stacked year models suggest that the upper bound for student-level effects is less than 0.07 SD (using the +/–20-point bandwidth specification). Our results do not change when we examine effects on scores for LEAP and iLEAP separately.
RD Estimates of Effect on 2013 and 2014 Subject-Level LEAP/iLEAP Test Score Outcomes, Grades 3 to 8
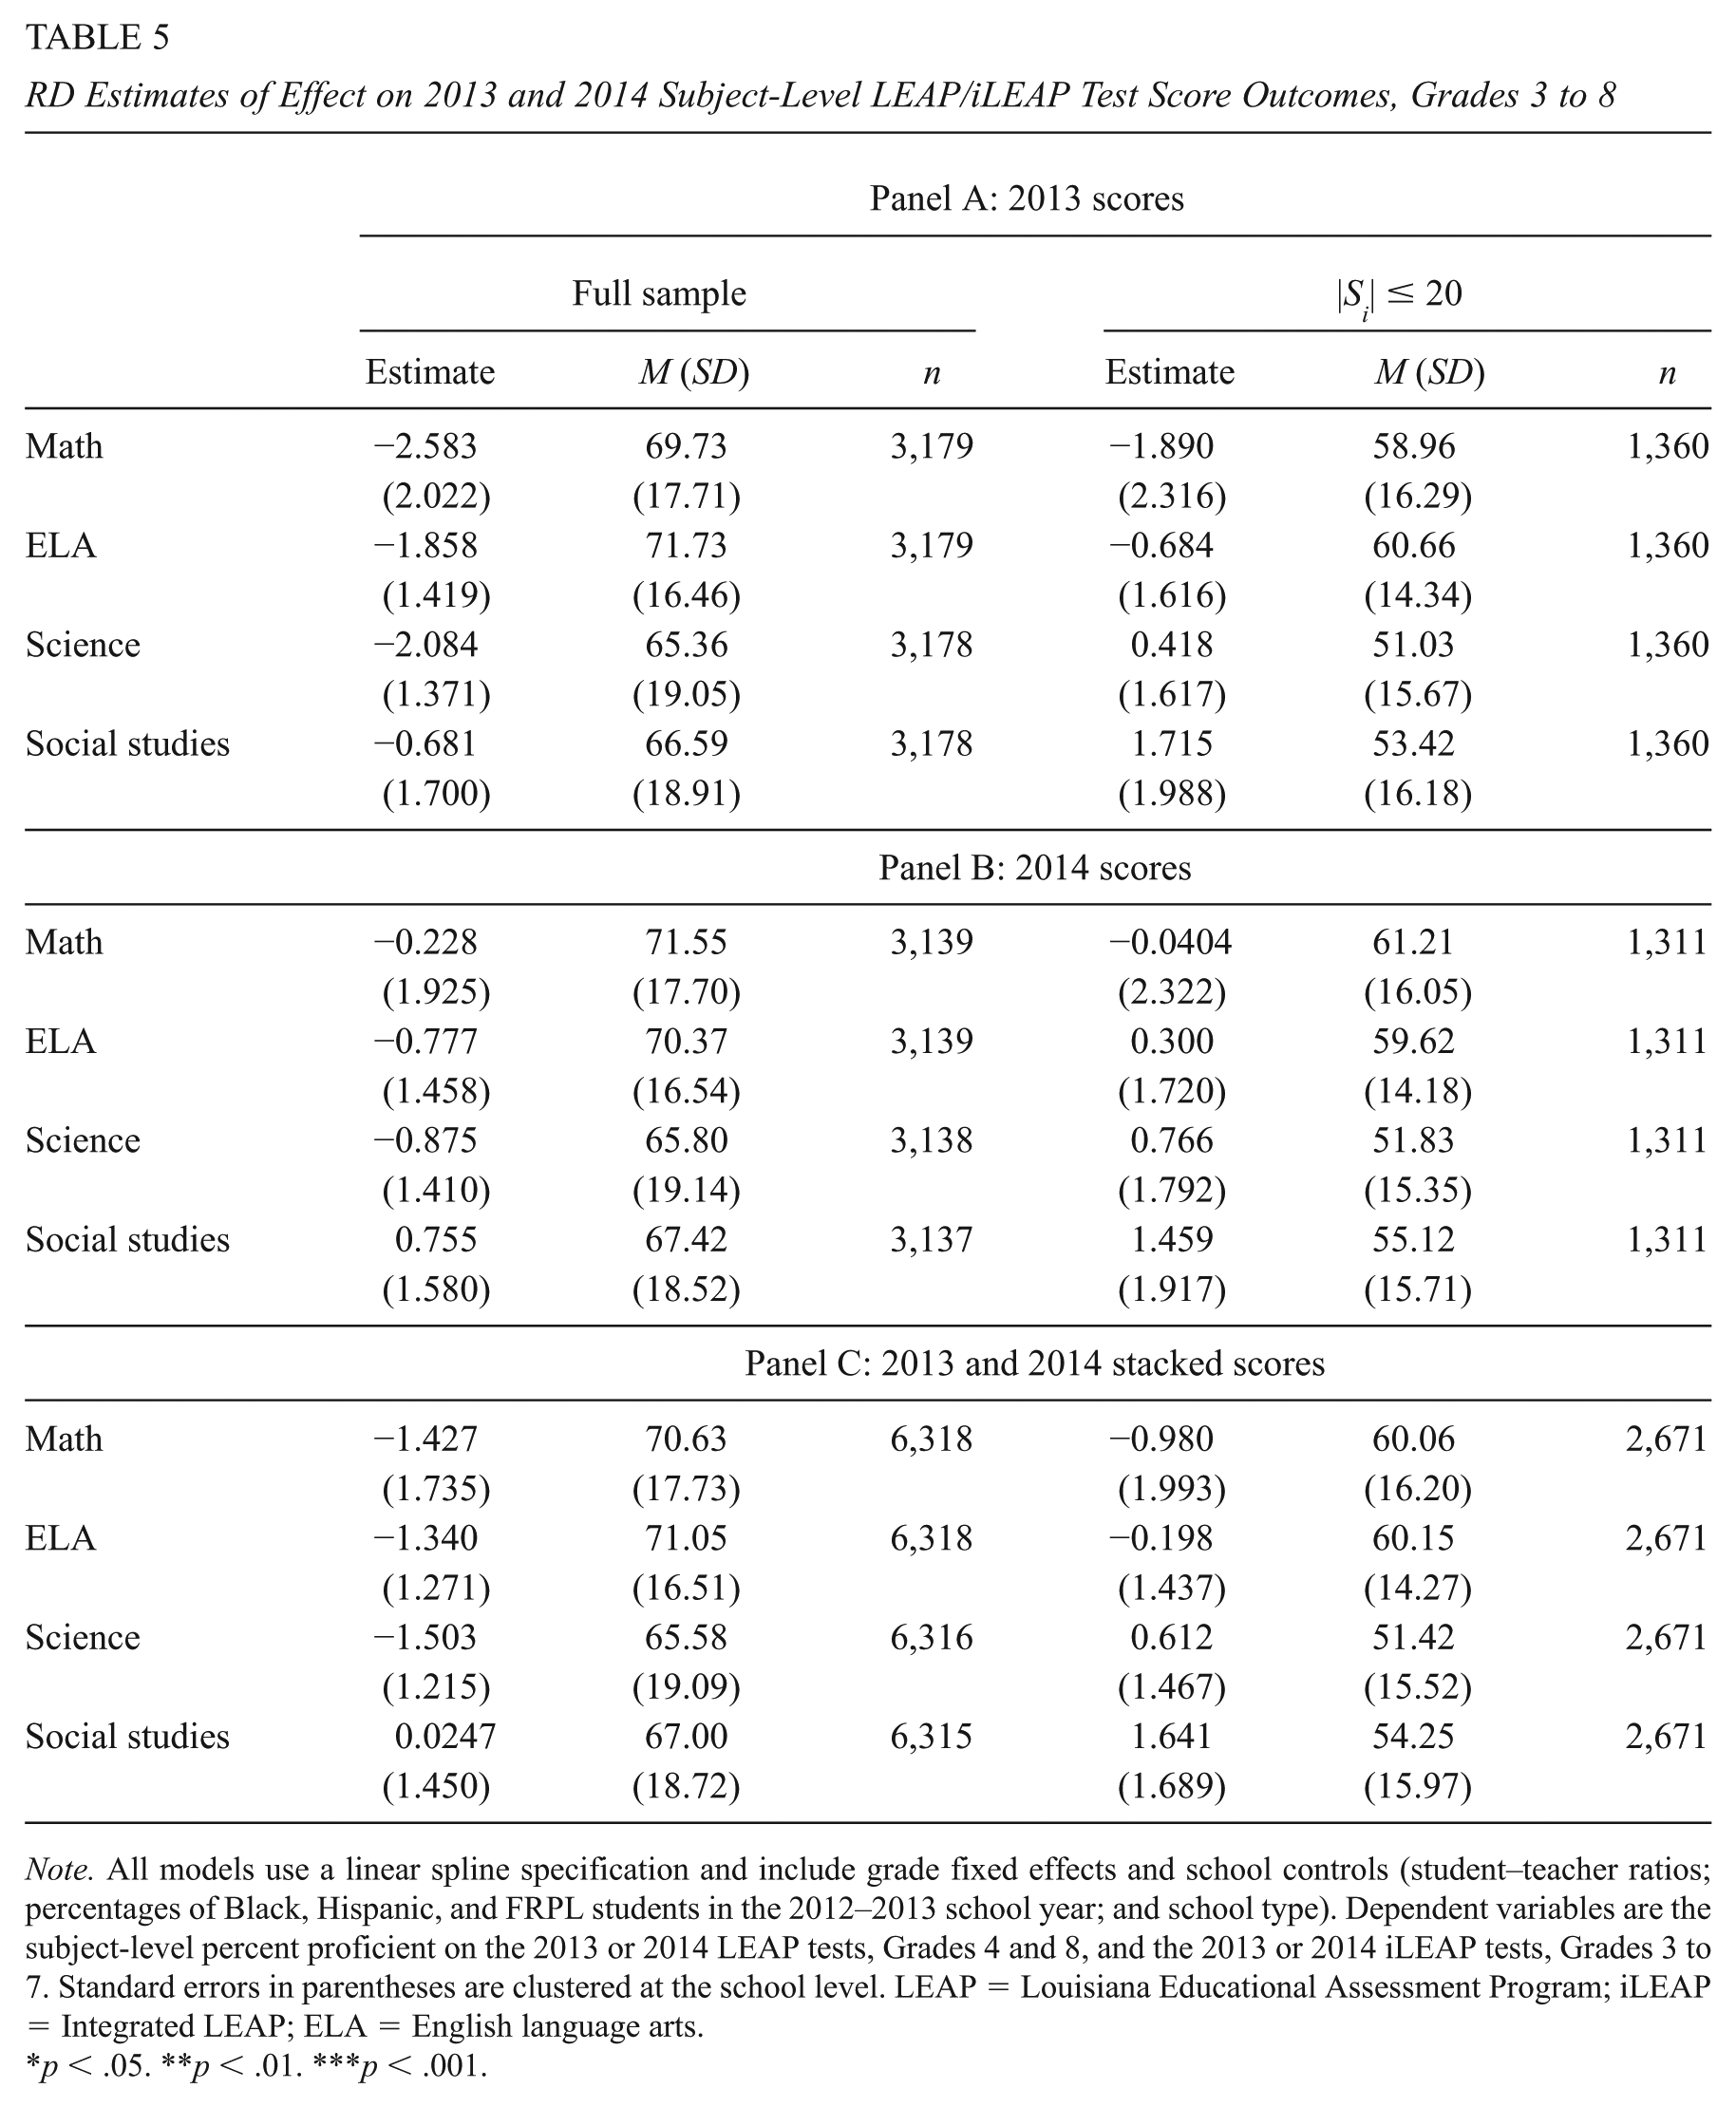
Note. All models use a linear spline specification and include grade fixed effects and school controls (student–teacher ratios; percentages of Black, Hispanic, and FRPL students in the 2012–2013 school year; and school type). Dependent variables are the subject-level percent proficient on the 2013 or 2014 LEAP tests, Grades 4 and 8, and the 2013 or 2014 iLEAP tests, Grades 3 to 7. Standard errors in parentheses are clustered at the school level. LEAP = Louisiana Educational Assessment Program; iLEAP = Integrated LEAP; ELA = English language arts.
p < .05. **p < .01. ***p < .001.
It is possible that Focus Schools improve student academic performance in ways that are not reflected in the primary components of the composite SPS score, or even in the proficiency rates on the LEAP/iLEAP. To assess whether this is the case, we analyze models where the outcome—“Progress Points”—is a measure of growth among struggling students who score below “Basic” on the standardized exam, or among high school students who score above a certain level on their ACT exams. These Progress Points, which range from 0 to 10, effectively serve as bonus points that can be added to a school’s SPS. We also analyze models that assess whether the distribution of student scores on the LEAP/iLEAP changed in ways that would not be reflected in the overall proficiency rate. Specifically, we estimate models in which the outcomes are the percent of students scoring at or above Approaching Basic, Basic, Master, and Advanced. For both sets of models described here, we consistently arrive at null results, suggesting that any student growth or academic gains made are not apparent in the accountability systems’ metrics. See Supplemental Appendix C (in the online version of the journal) for more detail.
Finally, in any study that examines the effect of a treatment on school-level outcomes, there is the concern that any impacts detected are not the result of a true treatment effect on the school but rather are the result of shifts in the student population. Because we are not working with student-level data, we cannot define the ITT at the student level. However, we examine the number of students enrolled; the percentages of students who are FRPL eligible, Black, Hispanic, and White; and the student–teacher ratio at schools in the years following Focus School Assignment (2013–2014 and 2014–2015). 21 Using these measures, we do not find evidence that Focus Schools’ student enrollment changed within the first 2 to 3 years after their assignment, relative to any changes that occurred at other schools close to the SPS threshold. These findings are consistent with those from research on the impacts of the school grade accountability systems in Florida (Chakrabarti, 2007; Chiang, 2009; Figlio & Rouse, 2006), New York City (Winters & Cowen, 2012), and of differentiated accountability in Michigan (Hemelt & Jacob, 2017), all of which do not find evidence that changes in student composition were drivers of the patterns of school performance they found.
Discussion
This article provides evidence on the effect of a new differentiated and flexible accountability system implemented in Louisiana in the era of ESEA waiver reforms; specifically, the effect that the system had on low-performing schools identified as Focus Schools. The impact of the accountability systems states established under waivers is particularly interesting given the recent passage of ESSA, which offers guidance around school accountability for low-performing schools that closely mirrors the requirements outlined for Priority and Focus Schools under waivers. Our estimates indicate that low-performing schools identified as Focus Schools that were close to the identification threshold did not significantly improve relative to comparable low-performing schools not put in the Focus group after the first, second, or third year of the reform. Our results suggest that, at least with regard to Focus Schools, Louisiana’s accountability system has not been effective in catalyzing reforms in its most challenged schools that successfully improve their performance and their students’ outcomes. It is important to note, however, that these inferences cannot be extended to schools distant to the threshold we leverage.
An important caveat to our findings is that we only have visibility into the primary performance metrics that Louisiana uses in its accountability system. Our research design does not allow us to assess whether Focus Schools improved because of the intervention in ways that are not reflected in these metrics. For example, students’ socio-emotional health, student learning in subjects and topics not represented on state exams, and teacher satisfaction are all outcomes worthy of examination. Unfortunately, under the accountability system in place under waiver reform, these outcomes did not play a direct role in the ratings that schools were ultimately given.
We do not have rich implementation data that would allow us to explicate in detail the seeming failure of Louisiana’s Focus School reforms to improve student outcomes. However, several forms of descriptive evidence—the interventions described in the waiver, federal monitoring reports, news accounts, and conversations with state officials—point to both weak treatment design and weak implementation. First, the interventions described in Louisiana’s waiver application are vague. The application states that the treatments to be implemented in Focus Schools were instead to be determined by needs assessments that would determine the challenges schools faced and supports they needed, thus making the needs assessments a critical component of the intervention.
LDOE also noted that its capacity was “extremely limited” and that the effectiveness of turning around the performance of the schools would rely heavily on building capacity in the districts to take on the effort. In addition, the state’s descriptions of the technical assistance provided to districts and supports by the LDOE suggest that they are not targeted to the needs of Focus Schools. The primary mechanism for offering state technical assistance to districts and schools is the network of support teams (District Network Teams) employing education specialists that focus on six areas of school improvement. 22 Although Focus Schools are described as “a high priority” for these supports, the purpose of the teams is to support all schools and there are, by and large, no resources dedicated solely to the Focus Schools. One of the few examples we could find of Focus Schools getting particularly targeted attention was in 2013–2014 when, according to the state’s updated waiver application, all Focus Schools worked with District Network Teams to analyze student-level data and set goals for the upcoming school year, followed by planning meetings to create strategy toward those goals. Throughout the school year, the schools and teams continued to meet to monitor and trouble shoot progress. However, as noted above, monitoring reports written by the U.S. Department of Education and the contingencies outlined in Louisiana’s waiver renewal state multiple times that the state’s plan for monitoring the process of supporting Focus Schools needed improvements, and that there was limited to no evidence that interventions for Focus Schools were taking place.
One possible explanation for our null findings is that Louisiana’s state system of technical assistance directed broad attention to all low-performing schools and perhaps improved the performance not just of F schools, but also D and C schools. The available information on Louisiana’s waiver implementation suggests that this is highly unlikely. However, we can also speak indirectly to this possibility by noting the broad changes in SPS results over this period. Between 2012–2013 and 2014–2015 school years, the mean SPS does not increase for the set of F schools, for the set of F and D schools, or for the set of F and D and C schools. This suggests that an improvement across all low performing schools does not explain our findings unless the relevant counterfactual was one of broad declines in school performance. The overall mean of the SPS across all schools in our sample has similarly not been increasing, suggesting that if there is broad improvement across a larger set of low-performing schools, it is not being reflected in the key metric of the state’s accountability system.
In our view, there is limited generalizability of our findings on Louisiana’s Focus School experience to that of other states. Every state made multiple unique decisions on assignment rules and intervention design under the flexibility of the Federal guidance. Nonetheless, considering our findings in the context of the results of waiver reforms in other states offers the potential for broader takeaways. Our null findings resemble those found in Michigan (Hemelt & Jacob, 2017) and Rhode Island (Dougherty & Weiner, 2017), but differ from results found in Kentucky (Bonilla & Dee, 2017). Michigan’s Priority Schools were similar to Louisiana in that the assignment rules were based on school-level composite scores (though Michigan included a measure of achievement gaps in its composite score) and Priority Schools were the lowest performers based on that score. In an analysis focused on K–8, noncharter, traditional public schools, the authors found little to no effect of Priority status in Michigan. Rhode Island also used a composite score comparable to Michigan’s; however, they identified three categories of schools: Priority, Focus, and Warning, the first two of which were prescribed a number of clearly defined interventions while the third was offered more flexibility in selecting its set of reforms. In an analysis focused on K–8 public schools, the authors found a negative effect for Focus Schools but a null effect for Warning schools, whose treatment more closely resembled that of Louisiana Focus Schools (although, compared with Louisiana Focus, they were more moderately performing relative to other schools in their state). Contrastingly, Kentucky Focus Schools were identified based on the performance of their traditionally low-performing subgroups, that is, FRPL students, students with disabilities, limited English proficient, and Black, Hispanic, or American Indian students. For Kentucky, the authors found positive impacts as a result of Focus School assignment in both math and reading for the targeted “gap group” students in K–8 public schools. Although the key drivers of these impacts are unknown, the authors found suggestive evidence that comprehensive school planning and higher quality professional development were key mediators of these effects. One possible interpretation of these collective findings is that schools that have low-performing subgroups but are not necessarily the lowest performing overall, as is the case in Kentucky, may be better equipped to effectively implement reforms. Alternatively, it is possible that an explicit focus on subgroup performance could be a helpful element of an accountability system. However, such conclusions are only speculative.
Regardless of the specifics of the Focus School treatment, our findings of null effects on this group of schools in Louisiana are fairly surprising given the evidence that exists around the effectiveness of consequential accountability in the form of publicized school letter grades. In both Florida and New York City, researchers have found that receiving a low letter grade led to school performance improvement both in the short-term and sustained over time (Chiang, 2009; Figlio & Rouse, 2006; Rockoff & Turner, 2008; Rouse et al., 2013; West & Peterson, 2006; Winters & Cowen, 2012). Coverage in the local Louisiana news and the reactions of local policymakers to the letter grade system provide some perspective on their usefulness as a mechanism for improvement. In 2011, Louisiana Federation of Teachers President Steve Monaghan publicly voiced criticism of the letter grade system, calling the letter grades a solution to a “complex problem… that’s simple, that’s neat, and that’s wrong” (Vanacore, 2011). He later referred to the letter grades as a “political device” that fails to reflect a holistic view of school quality (Sentell, 2015). In addition, the grading system received criticism from policymakers. In 2013–2014, the state began modifying the school letter grades out of concern that they would go down as a result of the challenges of implementing the Common Core State Standards. Thus, the cutoffs were adjusted so that the distribution of letter grades that year mirrored the distribution of the previous year. The same was done in 2014–2015 and the state requested that this “curve policy” be extended to 2015–2016. In 2015, gubernatorial candidates stated that, until the methodology behind the grades was established, the policy should be put on pause (Sentell, 2015). This sentiment was echoed in 2016 in a document put together by the Transition Team for the newly elected Governor John Bel Edwards, which advised that stakeholders were skeptical of the grades, particularly with regard to the lack of stability in the calculations across years. The document went on to recommend that accountability ratings be put on hold until new curricula, assessments, and accountability measures could be aligned (Onward Louisiana, 2016).
According to the research on accountability, and examples of effective school letter grade systems, the effectiveness of such policies hinge on public buy-in of their meaningfulness as well as available supports for struggling schools to improve their performance. On the surface, it seems that the lack of buy-in and the contextual churn of the letter grades may be part of the explanation for why they were less effective than expected in driving improvement. Moreover, outside of the technical assistance through District Network Teams that the LDOE describes in its waiver application, it is unclear whether—in practice—there were special interventions or supports available for F schools. We are not suggesting that Louisiana was disingenuous in its stated intent for supporting Focus Schools; instead, Louisiana appears to be an example of a planned intervention that suffered in terms of execution, perhaps because of limited resources. If the state subsequently relied on the public pressure of letter grades to motivate districts and schools to seek out extra assistance and support, it appears that the lack of buy-in regarding the meaningfulness of such grades may have hurt the state’s ability to drive improvement in its lowest achieving schools. Indeed, the policy context that appears to have given rise to skepticism and accountability reform fatigue potentially played an important moderating role in the Focus treatment’s impact, and may have contributed to our null findings independently of any other implementation challenges.
In conclusion, our analysis suggests the uncontroversial but sometimes underappreciated fact that, when it comes to policy efforts to improve our nation’s underperforming schools, local implementation and contextual details are highly relevant and an accountability system that may have proved effective elsewhere can still fail if the local infrastructure and public attitudes do not support it. This may be particularly true when the reform impetus begins with the federal government rather than through efforts initiated within state and local communities. As the United States moves toward a period that is likely to see increased flexibility for states in responding to federal education policy, this insight has implications for the role of federal oversight and the possibly heterogeneous effects of national initiatives across different states.
Supplemental Material
DS_10.3102_0162373719849944 – Supplemental material for School Performance, Accountability, and Waiver Reforms: Evidence From Louisiana
Supplemental material, DS_10.3102_0162373719849944 for School Performance, Accountability, and Waiver Reforms: Evidence From Louisiana by Thomas S. Dee and Elise Dizon-Ross in Educational Evaluation and Policy Analysis
Footnotes
Appendix
Acknowledgements
The authors express appreciation for comments provided by seminar participants at Stanford University and by participants at the Association for Education Finance and Policy (AEFP) and Association for Public Policy Analysis and Management (APPAM) research conferences.
Declaration of Conflicting Interests
The author(s) declared no potential conflicts of interest with respect to the research, authorship, and/or publication of this article.
Funding
The author(s) disclosed receipt of the following financial support for the research, authorship, and/or publication of this article: The authors would like to acknowledge the financial support from the Spencer, Walton, and WT Grant Foundations and the Institute for Education Sciences (R305B140009).
Notes
Authors
References
Supplementary Material
Please find the following supplemental material available below.
For Open Access articles published under a Creative Commons License, all supplemental material carries the same license as the article it is associated with.
For non-Open Access articles published, all supplemental material carries a non-exclusive license, and permission requests for re-use of supplemental material or any part of supplemental material shall be sent directly to the copyright owner as specified in the copyright notice associated with the article.
