




Abstract
Many schools and districts have considerable discretion when hiring teachers, yet little is known about how that discretion should be used. Using data from a new teacher screening system in the Los Angeles Unified School District (LAUSD), we find that performance during screening, and especially performance on specific screening assessments, is significantly and meaningfully predictive of hired teachers’ evaluation outcomes, contributions to student achievement, attendance, and mobility. However, applicants’ performance on individual components of the screening process are differentially predictive of different teacher outcomes, highlighting challenges and potential trade-offs faced by districts during screening.
Keywords
Because teachers vary considerably in their effectiveness, how administrators use their hiring discretion can have important implications for students’ learning in the short term as well as for their adult outcomes in the long term (e.g., Chetty, Friedman, & Rockoff, 2014a, 2014b; Hanushek & Rivkin, 2012). Successfully identifying and hiring teachers who will remain in the classroom can also prevent staff turnover that can be costly for districts (e.g., Milanowski & Odden, 2007) and disruptive for schools (Hanushek, Rivkin, & Schiman, 2016; Ronfeldt, Loeb, & Wyckoff, 2013). In addition, it will often be easier to exercise discretion when selecting teachers during the hiring process than to navigate employment protections that can make removing ineffective teachers from the classroom difficult (e.g., Griffith & McDougald, 2016; Painter, 2000).
However, little is known about how teachers are—or should be—screened and hired (Strunk, Marsh, & Bruno, 2017). Many easily observed teacher characteristics (e.g., certification or advanced degrees) are at most weakly predictive of teacher effectiveness (e.g., Angrist & Guryan, 2008; Buddin & Zamarro, 2009; Chingos & Peterson, 2011; Clotfelter, Ladd, & Vigdor, 2007; Kane, Rockoff, & Staiger, 2008), making it difficult to know what characteristics to screen teachers for prior to hire. This challenge is compounded by the fact that little existing research linking teacher attributes to their outcomes employs data collected and used in screening and hiring. It is thus difficult to know whether measures of teacher attributes would have different predictive power when incorporated into hiring processes. For example, teachers may respond differently to interview or survey questions if they believe their answers will have implications for their employment. If prehire teacher characteristics, such as performance in a job interview or during a sample teaching demonstration, are predictive of future success in the classroom, then districts can adopt related screening devices to inform their selection and hiring decisions.
Even without empirical support, many districts have adopted screening devices that are intended to be more rigorous, such as structured interview protocols or standardized batteries of assessments, and are providing principals with measures of past performance for transfer applicants or requiring principals to justify hiring decisions (Cannata et al., 2017). These reforms are appealing for their potential to collect information about applicants that might otherwise be difficult to observe and to ensure that that information is used when making hiring decisions. However, search models of matching in the labor market emphasize that such screening may also entail trade-offs if, for example, it is costly to implement or changes for the worse the composition of the applicant pool (e.g., Delfgaauw & Dur, 2007; Oyer & Schaefer, 2011). Understanding these hiring processes is therefore of both theoretical and practical importance.
Using detailed applicant data from a new district-level teacher screening system, entitled the Multiple Measures Teacher Selection Process (MMTSP), in the Los Angeles Unified School District (LAUSD), as well as teacher-level and student-level administrative data on the outcomes of teachers who are hired and the students they teach, we investigate the manner in which teachers are hired in the second largest school district in the country. These data capture many applicant characteristics that are often difficult to observe and allow for novel analyses of the potential for improving teacher quality through predictive screening.
Results indicate that LAUSD’s MMTSP captures useful information about applicants; performance during screening is often significantly and meaningfully predictive of teachers’ later outcomes, including their attendance, contributions to student achievement, evaluation ratings, and retention. However, individual components of screening are differentially predictive of these outcomes, implying that districts may face trade-offs in terms of the attributes of teachers they eventually hire and that it may be possible to improve the ability of a screening system to predict specific teacher outcomes even while using fewer screening assessments.
The remainder of this article proceeds as follows. First, we summarize the existing literature on teacher screening and hiring. We then describe the screening and administrative processes in the district, followed by a discussion of the data we employ and our empirical strategies. Next, we present our results and then conclude with a discussion of their implications for school district human resource operations and our understanding of teacher quality.
Previous Literature
To date, there is relatively little research linking information collected during screening to student and teacher outcomes after hire. For example, Metzger and Wu (2008) conduct a meta-analysis of 24 studies of a commonly used teacher screening instrument—Gallup’s Teacher Perceiver Interview (TPI)—intended to assess a range of applicant values and beliefs about education and teaching (e.g., empathy and commitment). However, only 12 included studies are of districts that use TPI ratings to make actual hiring decisions, and only one of those comes from a peer-reviewed journal. Although they find that aggregate TPI ratings are weakly or moderately predictive of some teacher outcomes, especially attendance and ratings by administrators, correlations are substantially weaker among the studies employing TPI ratings used in hiring. This suggests that predictors of teacher effectiveness will not always generalize to prospective teachers during screening.
Two recent studies are most like our own in linking districts’ batteries of assessments for prospective teachers to the outcomes of hired teachers. Goldhaber et al. (2017) examine data from Spokane, Washington, where applicant teachers are assessed first by district human resources staff and then at the school level, typically by a principal. They find mixed evidence that these screening assessments are sensitive to teacher quality. Applicants who are rated more highly during screening at either the district or school level have significantly lower attrition, but only the school-level screen is predictive of teachers’ contributions to student achievement growth (value-added measures) in math, and neither score is significantly predictive of value added in reading or teacher attendance.
In a similar study in Washington, D.C., Jacob et al. (2018) find that, despite being no more likely to be hired, applicants with higher undergraduate grade point averages (GPAs) or college entrance exam scores, who attended more competitive schools, or who have a master’s degree have superior subsequent performance once hired, as measured by a composite multiple-measures evaluation outcome. Applicants who perform better during screening on a written assessment of teaching knowledge, during an interview, or during a teaching audition also have better outcomes.
Estimated relationships between applicant characteristics and teacher effectiveness may be biased by relationships between unobserved applicant attributes and the probability of being hired. Both Goldhaber et al. (2017) and Jacob et al. (2018) address these selection concerns by exploiting plausibly exogenous variation in applicants’ hiring probabilities that arises from idiosyncrasies in their respective screening systems. This allows relationships to be estimated for applicants whose hiring was essentially random and thus not subject to selection on unobservable applicant attributes. In both cases, results suggest that the magnitude of such bias is very small; Goldhaber et al. (2017) find no statistically significant differences between estimates with and without bias corrections, and of 13 applicant characteristics considered by Jacob et al. (2018), only one—performance during a teaching audition—appears sensitive to such corrections, losing roughly 30% of its uncorrected magnitude.
More recently, Sajjadiani et al. (2019) use machine learning techniques to discern aspects of prospective teachers’ work history from resumes (e.g., self-reported previous job titles or job descriptions) submitted during the application process. They find that the measures they produce, although not used in the hiring process, are predictive of subsequent work outcomes. Moreover, they estimate that the quality of teachers hired in the district they study would be improved by incorporating these machine-learned measures into the hiring process. Collectively, these studies point to potential gains from acquiring and using additional information about applicants during screening and hiring.
Although these studies yield important information about districts’ abilities to screen potential teachers for quality, there is a need for more research—in new contexts and using different screening methods—to identify applicant attributes that are predictive during screening, and to determine whether and how they can be used to improve hiring outcomes in practice. We contribute to this literature using data from LAUSD’s recently adopted MMTSP, a highly standardized battery of assessments, each scored according to rubrics aligned to district goals. In addition to potentially changing the quality distribution of teachers who are eventually hired, these reforms result in the capture of many applicant characteristics that are not typically quantified in administrative data. We are thus able to identify which of these applicant characteristics, as measured during screening, are predictive of teachers’ outcomes.
LAUSD’s MMTSP
In LAUSD, rather than applying to specific positions or schools, prospective teachers apply directly to the district office to be placed into a district-wide hiring pool known as the “eligibility list.” School principals then draw from this list when they have open positions and may conduct any additional screening of those candidates if they so choose. The district estimates that it receives approximately 10,000 applications for approximately 1,250 certificated positions each year. Applicants are screened by human resources (HR) specialists, and applications are eliminated during the screening process in stages. Until recently, this occurred in two stages, with applicants first being eliminated if they failed to submit completed applications or did not meet minimum certification requirements (i.e., an undergraduate degree and teaching certification). Applicants who were not eliminated at this first stage then would be invited in for an interview with the district based on district hiring needs. These applicants were interviewed by district hiring specialists using questions loosely aligned to state teaching standards and then scored by those specialists on a scale from 75 to 100. Applicants would be eliminated if they received a score below 80 on their interview or if a review of their professional references indicated serious concerns about their past performance, though these criteria were not assessed using formalized rubrics. Applicants not eliminated in these ways advanced to the eligibility list given to school principals.
In an effort to collect more information about prospective teachers, to better align screening criteria to district priorities, and to help ensure that screening criteria were applied consistently across applicants, the district began piloting a new process, the MMTSP, in the 2013–2014 school year. The new system was fully adopted for hiring in 2014–2015. This new sequence, which essentially replaced the old central office interview, is shown in Figure A1. In the first stage applicants are, as before, removed from the potential hiring pool if they had incomplete applications (automatically checked by the district’s digital application platform) or if a manual review by HR staff uncovered that applicants did not meet minimum (unscored) certification criteria (e.g., possession of an undergraduate degree). The district estimates that the first stage of screening excludes as many as two thirds of all applications, most commonly because applications are incomplete or because applicants do not hold required credentials or have applied to positions for which there are no vacancies.
In the second stage, the remaining applicants are then scored on eight separate assessments, outlined in Table 1. The assessment scores sum to a possible total of 100 points, and to be eligible for employment, applicants must obtain minimum passing scores on several of these assessments as well as a total score of at least 80. These assessments are scored according to rubrics, many of which are explicitly aligned to the districts’ Teaching and Learning Framework (TLF, see Figure A2), the criteria by which teachers are evaluated during classroom observations. Based on their initial applications, each applicant receives up to 10 points for their undergraduate GPA. Another 10 points are awarded for subject matter preparation, which is determined by applicants’ scores on their subject-specific licensure exams or, when the exam requirement has been waived, again based on their GPAs. Unlike most of the other assessment scores, which can be as low as zero or one, the lowest possible subject matter score is eight. A small number of points are also granted for meeting any of several miscellaneous criteria that the district considers desirable. These points are awarded such that applicants receive either all the points or none of them. In particular, three background points are given to candidates who have certain prior LAUSD (nonteaching) experience (e.g., serving as a teaching assistant), have specific prior leadership (e.g., military) experience, possess a graduate degree, or are recruited through Teach for America. Finally, two preparation points can be given to applicants who attended a school highly ranked by U.S. News & World Report, who can show evidence of prior teaching effectiveness (e.g., achievement data) or who majored in their credential field (or, if multisubject, majored in a core academic subject or liberal studies). We observe only whether applicants received background or preparation points, not why they did so.
Eligibility Criteria for Prospective Teachers in LAUSD
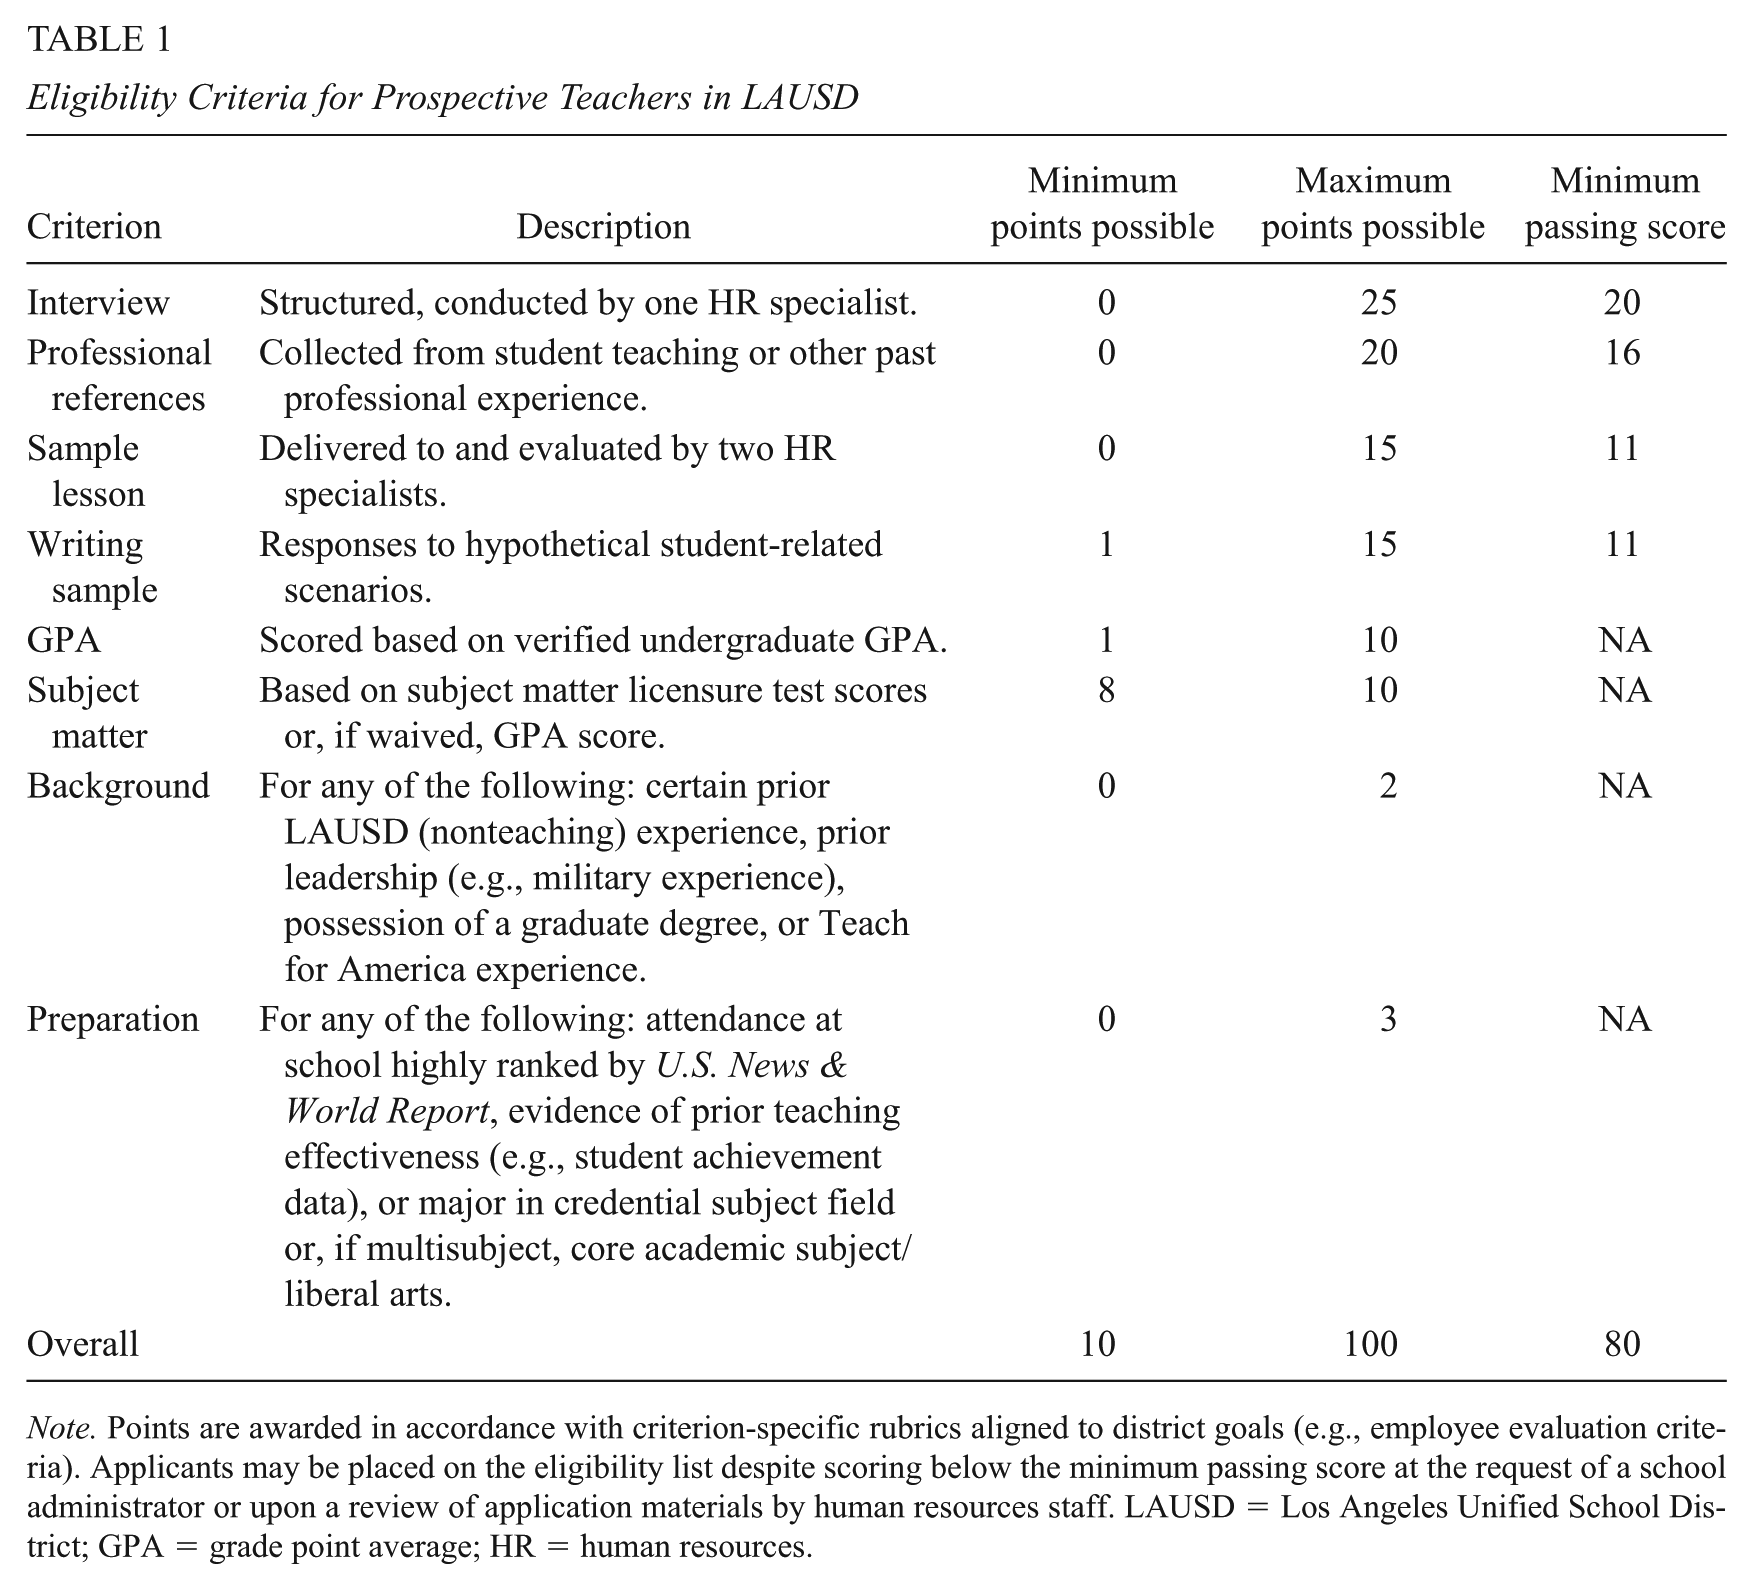
Note. Points are awarded in accordance with criterion-specific rubrics aligned to district goals (e.g., employee evaluation criteria). Applicants may be placed on the eligibility list despite scoring below the minimum passing score at the request of a school administrator or upon a review of application materials by human resources staff. LAUSD = Los Angeles Unified School District; GPA = grade point average; HR = human resources.
Applicants who meet minimum eligibility requirements in Stage 1 are also screened in a two-part “preinterview” stage. The first component is the solicitation of standardized electronic professional references, worth up to 20 points, and applicants receiving any “ineffective” rating from a reference are given a score of zero and disqualified. Applicants also complete, offsite, an online writing task in which they respond to a series of vignettes describing how they would navigate situations they might face as teachers. The resulting writing sample is given a score of up to 15 points, and applicants with a score below 11 are automatically eliminated.
After the preinterview stage, applicants are invited in to the district to complete the final stages of the screening process. LAUSD administrators estimate that at least one third decline to come in for this last stage, most commonly because they are pursuing or have obtained positions in other districts. This leaves between 2,000 and 3,000 applicants per year who are brought in to the district office for interviews and to give sample lesson demonstrations. The interview is structured and is worth up to 25 points, with scores below 20 resulting in disqualification. The sample lesson demonstration is administered to two HR specialists playing the scripted roles of students and is worth up to 15 points, and applicants are disqualified by scores below 11. Additional detail about these screening procedures can be found in Appendix A.
The district accepts and screens applications on a year-round basis. Applicants who receive a total score of at least 80 and the minimum required scores on each scored screening assessment are placed on the district’s eligibility list, which is then given to personnel specialists and school administrators who have related vacancies to fill. Site administrators continue to have considerable flexibility in how, if at all, eligible candidates will be further screened at the school site (e.g., through onsite interviews). Importantly, actual screening scores are never provided to personnel specialists or school administrators, just whether applicants are eligible for hire (and thus appear on the eligibility list). 1
There are two exceptions by which applicants can be placed on the eligibility list despite failing to obtain a minimum overall or screening component score. First, although all candidates must be assessed by HR, a school principal can request that a candidate receive an exception to the score requirements and is then free to hire that candidate if she so chooses. Second, applicants who fail to meet one of the individual assessment cut points, or fail to achieve an overall score of 80, are given a blind review by a panel of HR specialists incorporating the full range of submitted application materials. Following this review, applicants whom the panel deems sufficiently high quality are added back to the eligibility list. 2 Approximately 200 applicants each year are granted exemptions through one of these two avenues. Applicants remain on the eligibility list for up to 1 year, and if they are not hired, they may reapply and be screened again.
Data and Method
Ultimately, an average of approximately 1,700 applicants are placed on the eligibility list each year (where they can remain for up to 1 year), and approximately three quarters of applicants placed on the eligibility list are subsequently hired by the district. Importantly, for our study, over the course of 4 years (July 2013–June 2017), we observe only those individuals who are placed on the eligibility list and their hiring outcomes in LAUSD, or 6,228 applications in total, approximately 10% of whom are present despite the applicant failing to meet a minimum score requirement. 3 In most analyses, screening scores are standardized to have a mean of zero and standard deviation of one across all applications on the eligibility list.
The top panel of Table 2 summarizes the characteristics of applicants on the eligibility list who are eventually employed by LAUSD and those who are not. The average score of both groups exceeds the baseline cut point of 80, but employed applicants score approximately 1.2 points (23% of a standard deviation) higher, and the standard deviations suggest less variability in the assessed quality of employed relative to unemployed applicants (also seen by the minimum score of 30 for the latter group). The same patterns generally hold for subscores. Consistent with their having higher scores on average, applicants who are eventually hired are less likely to have received a score exception than those who are not. Teachers certified to teach special education are more likely, and those certified to teach social studies or elementary are less likely, to be employed, likely reflecting demand in LAUSD.
Summary Statistics for Newly Screened Teachers
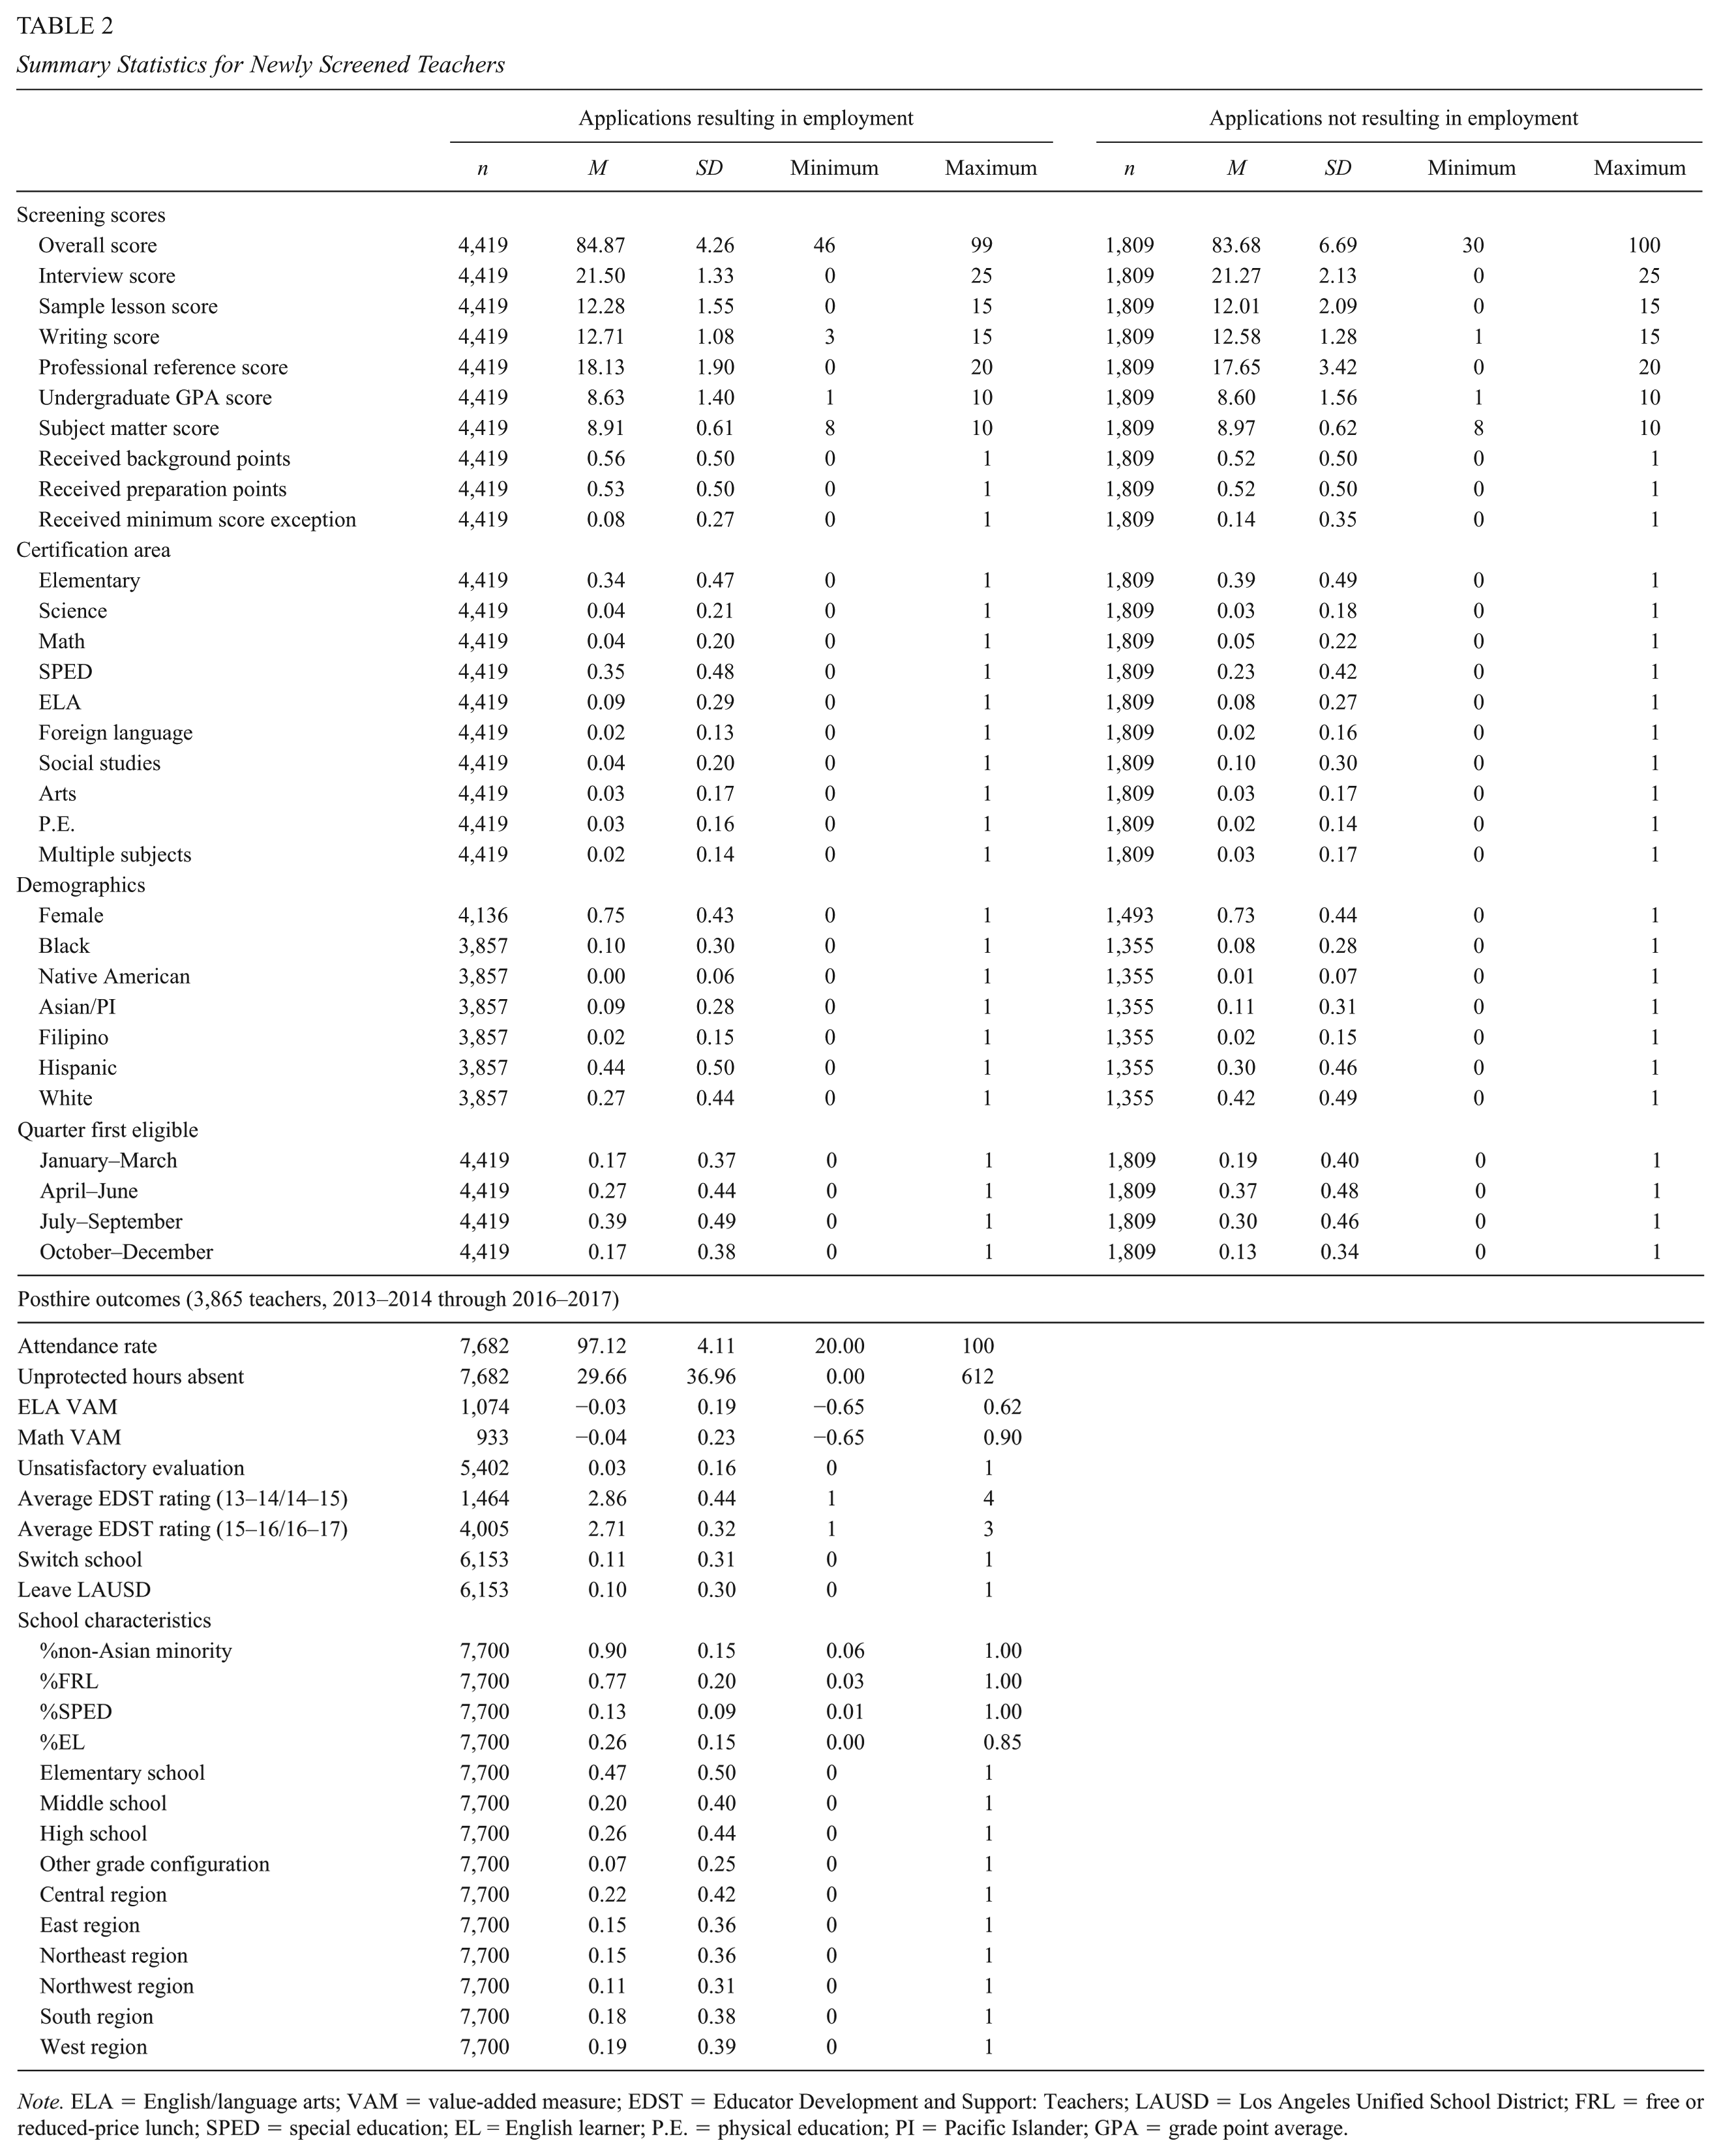
Note. ELA = English/language arts; VAM = value-added measure; EDST = Educator Development and Support: Teachers; LAUSD = Los Angeles Unified School District; FRL = free or reduced-price lunch; SPED = special education; EL = English learner; P.E. = physical education; PI = Pacific Islander; GPA = grade point average.
Individual assessment scores are generally weakly correlated with one another, with no correlation between any two screening assessment scores greater than r = .37 (see Table A1). This suggests that the different screening assessments capture distinct information and are not heavily redundant with one another. It also previews the fact that results presented below do not change substantially if the assessment scores are used to predict teachers’ outcomes individually rather than jointly.
Data on Hired Teachers
We merge MMTSP scores of individuals who are hired by the district with other administrative data linking teachers to schools and students, allowing us to consider teacher outcomes through the 2016–2017 school year. Evaluation data come from the district’s Educator Development and Support: Teachers (EDST) program, by which teachers are evaluated based on a combination of classroom observations, pre- and post-observation conferences, and other work products (e.g., student work samples). During these years, EDST evaluations were required for all nonpermanent (i.e., nontenured) teachers, as well as a subset of permanent teachers. 4 As part of their EDST evaluations, teachers receive ratings on between seven and 15 priority elements of the TLF (depending on the year), which address teachers’ planning and preparation of instruction, classroom environments, delivery of instruction, and professional growth. Teachers also receive a final summative rating, though the details of these ratings differ across the 3 years we utilize here. 5
We focus on two outcomes from these evaluations. First, we consider the probability that a teacher receives a final summative rating of “below standard performance.” Second, we average teachers’ ratings across the TLF elements for which they received ratings by converting their ratings to numeric values of one to four, then standardizing across all teachers each year. The availability of the higher rating category appears to increase differentiation primarily among higher rated teachers; the share of focus area ratings receiving a three or four in 2014–2015 (77%) is very similar to the share receiving a three in 2015–2016 (75%). 6
Teacher mobility data come from annual district-wide employee records associating teachers with school sites at the beginning of the year. Because employee identifiers link teachers over time in these data, it is possible to observe whether a teacher has changed sites or left district employment between one year and the next. We identify teachers as switching schools if in the next year in which they are observed, they are at a different LAUSD school and as leaving the district if we do not observe them in LAUSD in any subsequent year.
HR records provided by the district also include attendance records for all staff. For each teacher, we observe the number of assigned work hours for their certificated position they missed for legally protected reasons (e.g., jury duty or military leaves) as well as those that were missed for unprotected reasons (e.g., regular illness days, bereavement leaves, or personal necessity days), with 6 hours representing a full teacher workday for administrative purposes. We focus below on unprotected absences, which are more discretionary from a teacher’s point of view. The district also constructs an overall attendance rate for each teacher, defined as the percentage of contracted work hours for which a teacher was present.
We construct value-added measures (VAMs) of teachers’ contributions to student achievement using student-level test score and demographic data. We link teachers to students using annual report card data, and students are linked to all teachers from whom they are indicated as receiving instruction in math or English/language arts (ELA), with each student–teacher link weighted in proportion to the share of the year for which the student was in the teacher’s class. We then estimate the following model for each subject (math or ELA), level (elementary or secondary), and year:

where Ach is either math or ELA achievement, standardized within test and year, for student i with teacher j in school s in year t. X is a vector of student demographic characteristics (viz., indicators of student race, gender, free or reduced-price lunch [FRL] eligibility, special education status, English learner status, and grade level), and teachers’ VAMs are represented by the coefficients on a set of teacher fixed effects (T), which we mean-center across all teachers in the district. ε is an error term. We estimate heteroskedasticity-robust standard errors and use standard Empirical Bayes shrinkage methods on the resulting estimates (Koedel, Mihaly, & Rockoff, 2015). (See the Appendix, available in the online version of the journal, for more details on VAM construction.) Teacher outcomes are summarized in the bottom panel of Table 2.
Empirical Strategy
To evaluate whether the information collected during screening is predictive of subsequent teacher performance, we estimate,

Here outcome is a measure of teacher i’s value-added contribution to student achievement in school s in year t, or, alternatively, teacher i’s attendance outcomes or average EDST ratings as defined above. To predict teachers’ relative probabilities of receiving a below standard evaluation rating, or of staying in their schools relative to switching schools or leaving the district, we use logistic and multinomial logistic specifications, respectively. The predictors of interest are teacher standardized screening scores and are contained in S, though we include the background and preparation points only as indicators for whether the points were received. 7 X is a set of teacher characteristics, including for all models an indicator of whether the teacher was hired despite failing to meet minimum eligibility requirements and indicators of the number of years since hire. Similar to Goldhaber et al. (2017), when predicting evaluation and mobility outcomes we also include in X indicators for teachers’ race, gender, and certification subject area to control for differences in evaluation standards or labor market opportunities. 8
Model 2 also includes D, a set of school characteristics that may be associated with teacher outcomes including grade level and district region indicators, and the share of students in the school who are neither White nor Asian, who are English learners, or who are eligible for FRL or special education services. To allow for the possibility that teachers have systematically different outcomes in different years, we include a set of dummy variables indicating school years (
As discussed above, an important consideration in the estimation of Model 2 is the possibility that teachers’ selection into employment in LAUSD or into specific kinds of schools may bias the estimated relationships between screening scores and eventual outcomes. Although both Goldhaber et al. (2017) and Jacob et al. (2018) find little evidence of selection bias in studies of similar processes in Spokane, Washington, and Washington, D.C., we nonetheless perform two checks to assess the plausible magnitude of bias in our estimates. First, we assess the threat of bias from selection into employment by following Frank, Maroulis, Duong, and Kelcey (2013) to consider the extent to which replacing hired applicants with nonhired applicants from the eligibility list would alter our inferences if screening performance and outcomes were completely unrelated among nonhired applicants. Second, our estimates may be biased if hired teachers sort into placements (e.g., into easier assignments) in ways related to their screening performance. Concerns about such sorting are mitigated by the fact that principals cannot observe applicants’ screening scores and therefore cannot directly select applicants based on their screening performance. However, principals may nevertheless select applicants, or teachers may select schools, on the basis of characteristics associated with screening performance. We therefore also consider a variant of Model 2 that replaces controls for observable school characteristics with a school-by-year fixed effect. By comparing only teachers with different screening scores but working at the same sites at the same time, this effectively eliminates concerns that differing outcomes for teachers reflect unobserved differences between school sites.
Scoring and Hiring Patterns
Before turning to our primary analyses, we briefly consider scoring and hiring patterns in the MMTSP for different kinds of applicants. These patterns highlight important considerations for districts during the hiring process, as well as important features of the LAUSD hiring context. Simple regressions predicting screening scores with and without applicant demographic controls are presented in Tables A2 and A3, respectively. Applicants with special education certifications have overall scores that are 18% of a standard deviation lower than those of elementary teachers, and lower subscores on most of the individual assessments. Relative to applicants who apply over the summer (July–September), winter (January–March) and spring (April–June) applicants have higher screening scores overall, whereas fall applicants (October–December), who effectively add to the “late hire” pool after the school year starts, have significantly lower overall and subarea scores. This is consistent with previous work (e.g., Levin & Quinn, 2003; Papay & Kraft, 2016) finding that teachers hired after the school year has begun are often lower quality on average. In addition, relative to applicants with elementary certifications, special education teachers are more likely to be on the eligibility list with a minimum score exception, as are applicants in the winter relative to other times of year.
A diverse supply of teachers is a growing priority for many districts, so it is noteworthy that even net of their subject area and quarter of first eligibility the screening performance of male applicants is substantially weaker than that of female applicants, as is the performance of Black, Asian/Pacific Islander, and Hispanic applicants relative to that of White applicants. Moreover, because applicants’ race and gender are correlated with their certification areas, in many cases, these score gaps compound. For example, applicants with special education certifications are disproportionately likely to be Black or Hispanic, and applicants with math certifications are disproportionately male. As shown by comparing Tables A2 and A3, the overall score gap between special education teachers and elementary teachers increases by more than one fifth when applicants’ race and gender are not controlled for, and the gap between math teachers and elementary teachers increases by 50% and becomes statistically significant.
These score gaps are sufficiently large that they may have substantial implications for the composition of the teacher workforce in the district by disproportionately excluding from the eligibility list teachers of certain races. However, applicants’ employment prospects are not determined entirely by their screening scores, and many low-scoring groups of applicants are also disproportionately likely to receive exceptions to minimum scoring requirements, which may tend to diversify the eligibility list. For example, Black teachers are significantly more likely to have received minimum score exceptions than similar White teachers (see Table A2).
In addition, because screening scores are not provided to school administrators, hiring from the eligibility list cannot be directly driven by screening performance. Linear probability models (shown in Table A4) indicate that although screening scores are not given to administrators, applicants with higher scores are nevertheless more likely to be hired; a standard deviation increase in screening performance is associated with an increase in the probability of being hired of about 4 percentage points across all applicants. However, other factors appear to drive hiring probabilities more strongly than screening performance. For example, conditional on screening score, certification area, and time of year, Black, Asian/Pacific Islander, and Hispanic applicants are 5 to 14 percentage points more likely than White applicants to be hired, particularly among elementary and math teachers. Similarly, although special education teachers fare poorly during screening, they are much more likely to be hired from the eligibility list, by at least 10 percentage points relative to similar elementary teachers. The composition of the final teacher workforce thus reflects not only the composition of the eligibility list but also subsequent hiring patterns.
Because we do not observe applicants who do not advance to the eligibility list, or counterfactual hiring outcomes, we cannot definitively assess whether and to what extent differences in scoring patterns between groups of teachers impact the final composition of the teacher workforce in LAUSD. However, these score differences nevertheless highlight potential trade-offs between the rigor of screening and the supply of available teachers, particularly when high-need teachers perform relatively poorly during screening. Districts concerned about the diversity of their teacher workforces need to think carefully about the implications of screening standards for teachers of different backgrounds. 10
Results
VAMs
Results considering teachers’ VAM outcomes are provided in columns 1 through 8 of Table 3. Several components of the MMTSP are significantly predictive of teacher VAMs. In ELA, a one standard deviation increase in sample lesson score or receipt of preparation points are each associated with an increase in student achievement of 3% of a standard deviation (roughly 16% of a teacher-level standard deviation in value-added), and a standard deviation increase in interview score predicts an increase in student achievement of 2% of a standard deviation. As preparation points are frequently rewarded for evidence of prior teaching effectiveness, both they and the sample lesson assessment may serve as relatively direct evidence of teaching skill. Coefficients on individual screening scores are qualitatively similar, though mostly smaller in magnitude, for math. Differences between subject areas may be due to the relatively greater importance of verbal communication abilities (as measured by interview and sample lesson performance) for ELA instruction, making the screening process more effective at detecting differences in quality (as measured by VAMs) for ELA than for math; quantitative abilities may often be assessed only indirectly by GPA and subject matter scores.
Regressions Predicting Teacher VAMs and Evaluation Outcomes
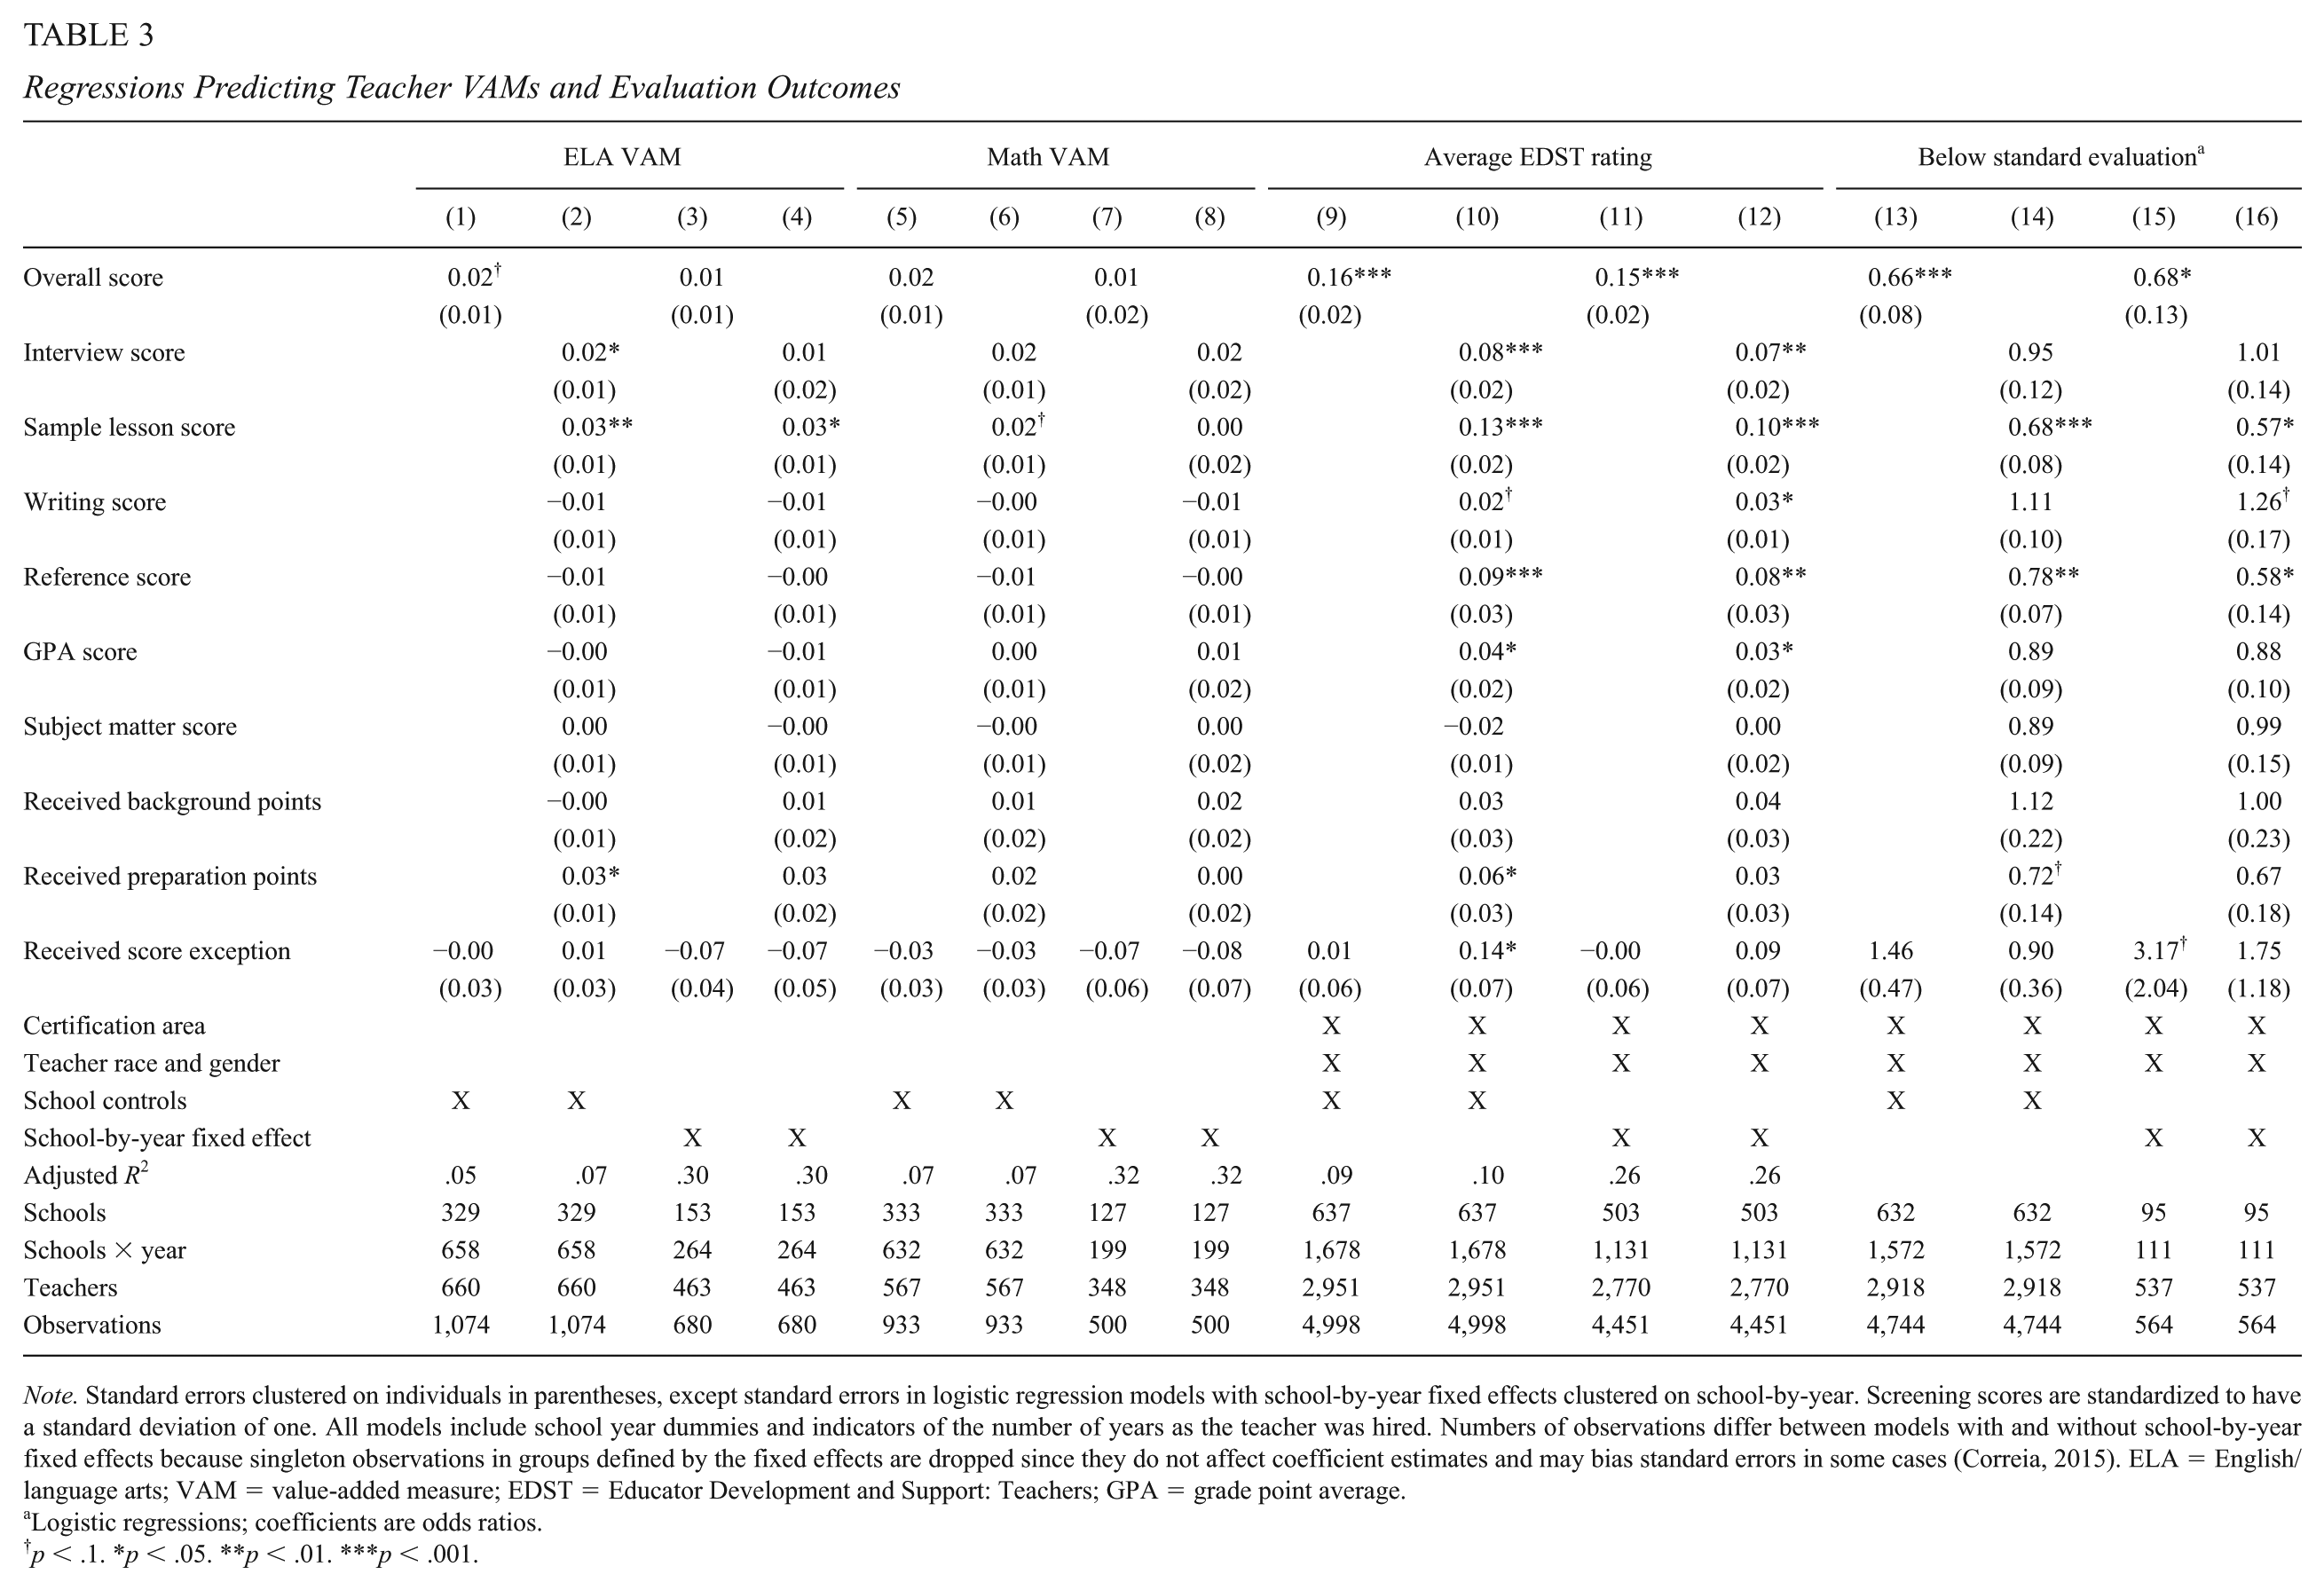
Note. Standard errors clustered on individuals in parentheses, except standard errors in logistic regression models with school-by-year fixed effects clustered on school-by-year. Screening scores are standardized to have a standard deviation of one. All models include school year dummies and indicators of the number of years as the teacher was hired. Numbers of observations differ between models with and without school-by-year fixed effects because singleton observations in groups defined by the fixed effects are dropped since they do not affect coefficient estimates and may bias standard errors in some cases (Correia, 2015). ELA = English/language arts; VAM = value-added measure; EDST = Educator Development and Support: Teachers; GPA = grade point average.
Logistic regressions; coefficients are odds ratios.
p < .1. *p < .05. **p < .01. ***p < .001.
No other screening measure is significantly positively associated with teacher VAM, and for several scores, the coefficients are in fact slightly negative. This is not because screening components are redundant; recall that correlations between the individual screening assessment scores are generally weak. In results not shown but available upon request, we find that coefficients on screening component scores change very little whether they are entered into the model individually or simultaneously.
Because the components of the MMTSP vary in their predictive power, applicants’ overall scores are imprecise measures of this aspect of teacher effectiveness and do not significantly predict teacher value-added in math. However, a one standard deviation increase in overall screening score is associated with a 0.02 standard deviation increase in student achievement in ELA (p = .063), reflecting the greater predictive power of MMTSP subscores in ELA. This variation is meaningful; back-of-the-envelope estimates suggest that an applicant with the minimum passing screening score of 80 would require roughly 2 years to be as effective at raising ELA achievement as an applicant with the average score (roughly 85). 11
Estimates are sensitive to the choice of how to control for teachers’ school contexts, becoming smaller and losing significance when school controls are replaced with a school-by-year fixed effect (which, again, we include to help alleviate bias due to applicant sorting). However, because VAMs can often be estimated only for one teacher per school in a given year, including these fixed effects reduces the number of teachers (schools) from which we can estimate screening score relationships by at least 30% (53%) in both math and ELA. Results including these fixed effects are thus less precise, but the coefficients on sample lesson scores and preparation points remain relatively large when predicting ELA VAMs. Thus, it is possible that estimates without these fixed effects may be biased, but our sample sizes make this difficult to know definitively.
Applicants teaching in the district despite failing to meet a minimum screening score requirement might be expected to be more effective once hired because they have been actively identified by either school administrators or HR staff for an exemption. However, we find no evidence that this is the case with respect to teachers’ contributions to student achievement; coefficients on the dummy variable indicating exceptions are insignificant even after controlling for the fact that that these applicants tend to have lower screening scores on average. We do not observe why these individuals received an exception, but to the extent that such exemptions are particularly discretionary, these results are consistent with prior work indicating that subjective or relatively unstructured assessments during job screening are often unreliable predictors of employee performance (e.g., Delli & Vera, 2003).
Teacher Evaluation Ratings
Columns 9 through 16 of Table 3 show that many aspects of screening performance are significantly and positively related to teachers’ evaluation outcomes. Given that LAUSD developed its MMTSP scoring rubric in large part to align with its Teaching and Learning Framework, this finding suggests that districts can, in fact, at least partially screen for the qualities they value during classroom observations. Sample lesson performance and professional references appear to be particularly predictive of both outcomes considered here, with interview, GPA, and writing scores additionally predictive of average EDST ratings. Coefficients on these subscores generally do not change substantially in the school-by-year fixed effect specification.
The ability of several, often heavily weighted, screening subscores to predict these evaluation outcomes is reflected in applicants’ overall screening scores. A one standard deviation increase in overall screening score is associated with average EDST ratings across all rated TLF elements that are higher by 16% of a standard deviation, and with one third lower odds of receiving an unsatisfactory final summative rating. 12 That represents approximately the difference between first and second year teachers in the probability of receiving an unsatisfactory final rating, and roughly half the difference in average EDST scores. Unlike VAM results above, evaluation-related estimates are highly robust to the inclusion of school-by-year fixed effects, suggesting minimal bias arising from the sorting of applicants who perform better during screening into schools where teachers tend to be evaluated more favorably. 13 As with VAMs, applicants receiving score exceptions do not have better evaluation performance than would be expected based on their overall screening scores; coefficients on the indicator for exceptions suggest worse evaluation outcomes as frequently as they suggest better outcomes.
Teacher Attendance
As shown in Table 4, columns 1 through 4, GPA scores and the receipt of preparation points are significantly and substantially predictive of teachers’ attendance rates. A standard deviation increase in GPA scores predicts an increase in the share of potential (i.e., contracted) hours for which a teacher is present at work of nearly 0.2 percentage points, or roughly an additional one third of a day in a 182-day work year; receipt of the preparation points predicts increases of nearly 0.3 percentage points, or half of a day. The coefficient on professional reference scores, although not significant, is similarly large. Unsurprisingly, these results are driven entirely by teachers’ unprotected absences (columns 5 to 8); a one standard deviation increase in reference or GPA scores is associated with a teacher taking more than two fewer hours of unprotected absence in a year, and being granted the preparation points is associated with three fewer hours of unprotected absence from the administratively defined 6-hour workday. These results may indicate that these assessments capture aspects of teachers’ conscientiousness or work ethic, though we cannot rule out other possibilities (e.g., that they are proxies for applicants’ physical health). This is consistent with previous research indicating that screening applicants for their attitudes toward work can help to select workers who are less likely to shirk (e.g., Huang & Cappelli, 2010).
Regressions Predicting Teacher Attendance and Mobility Outcomes
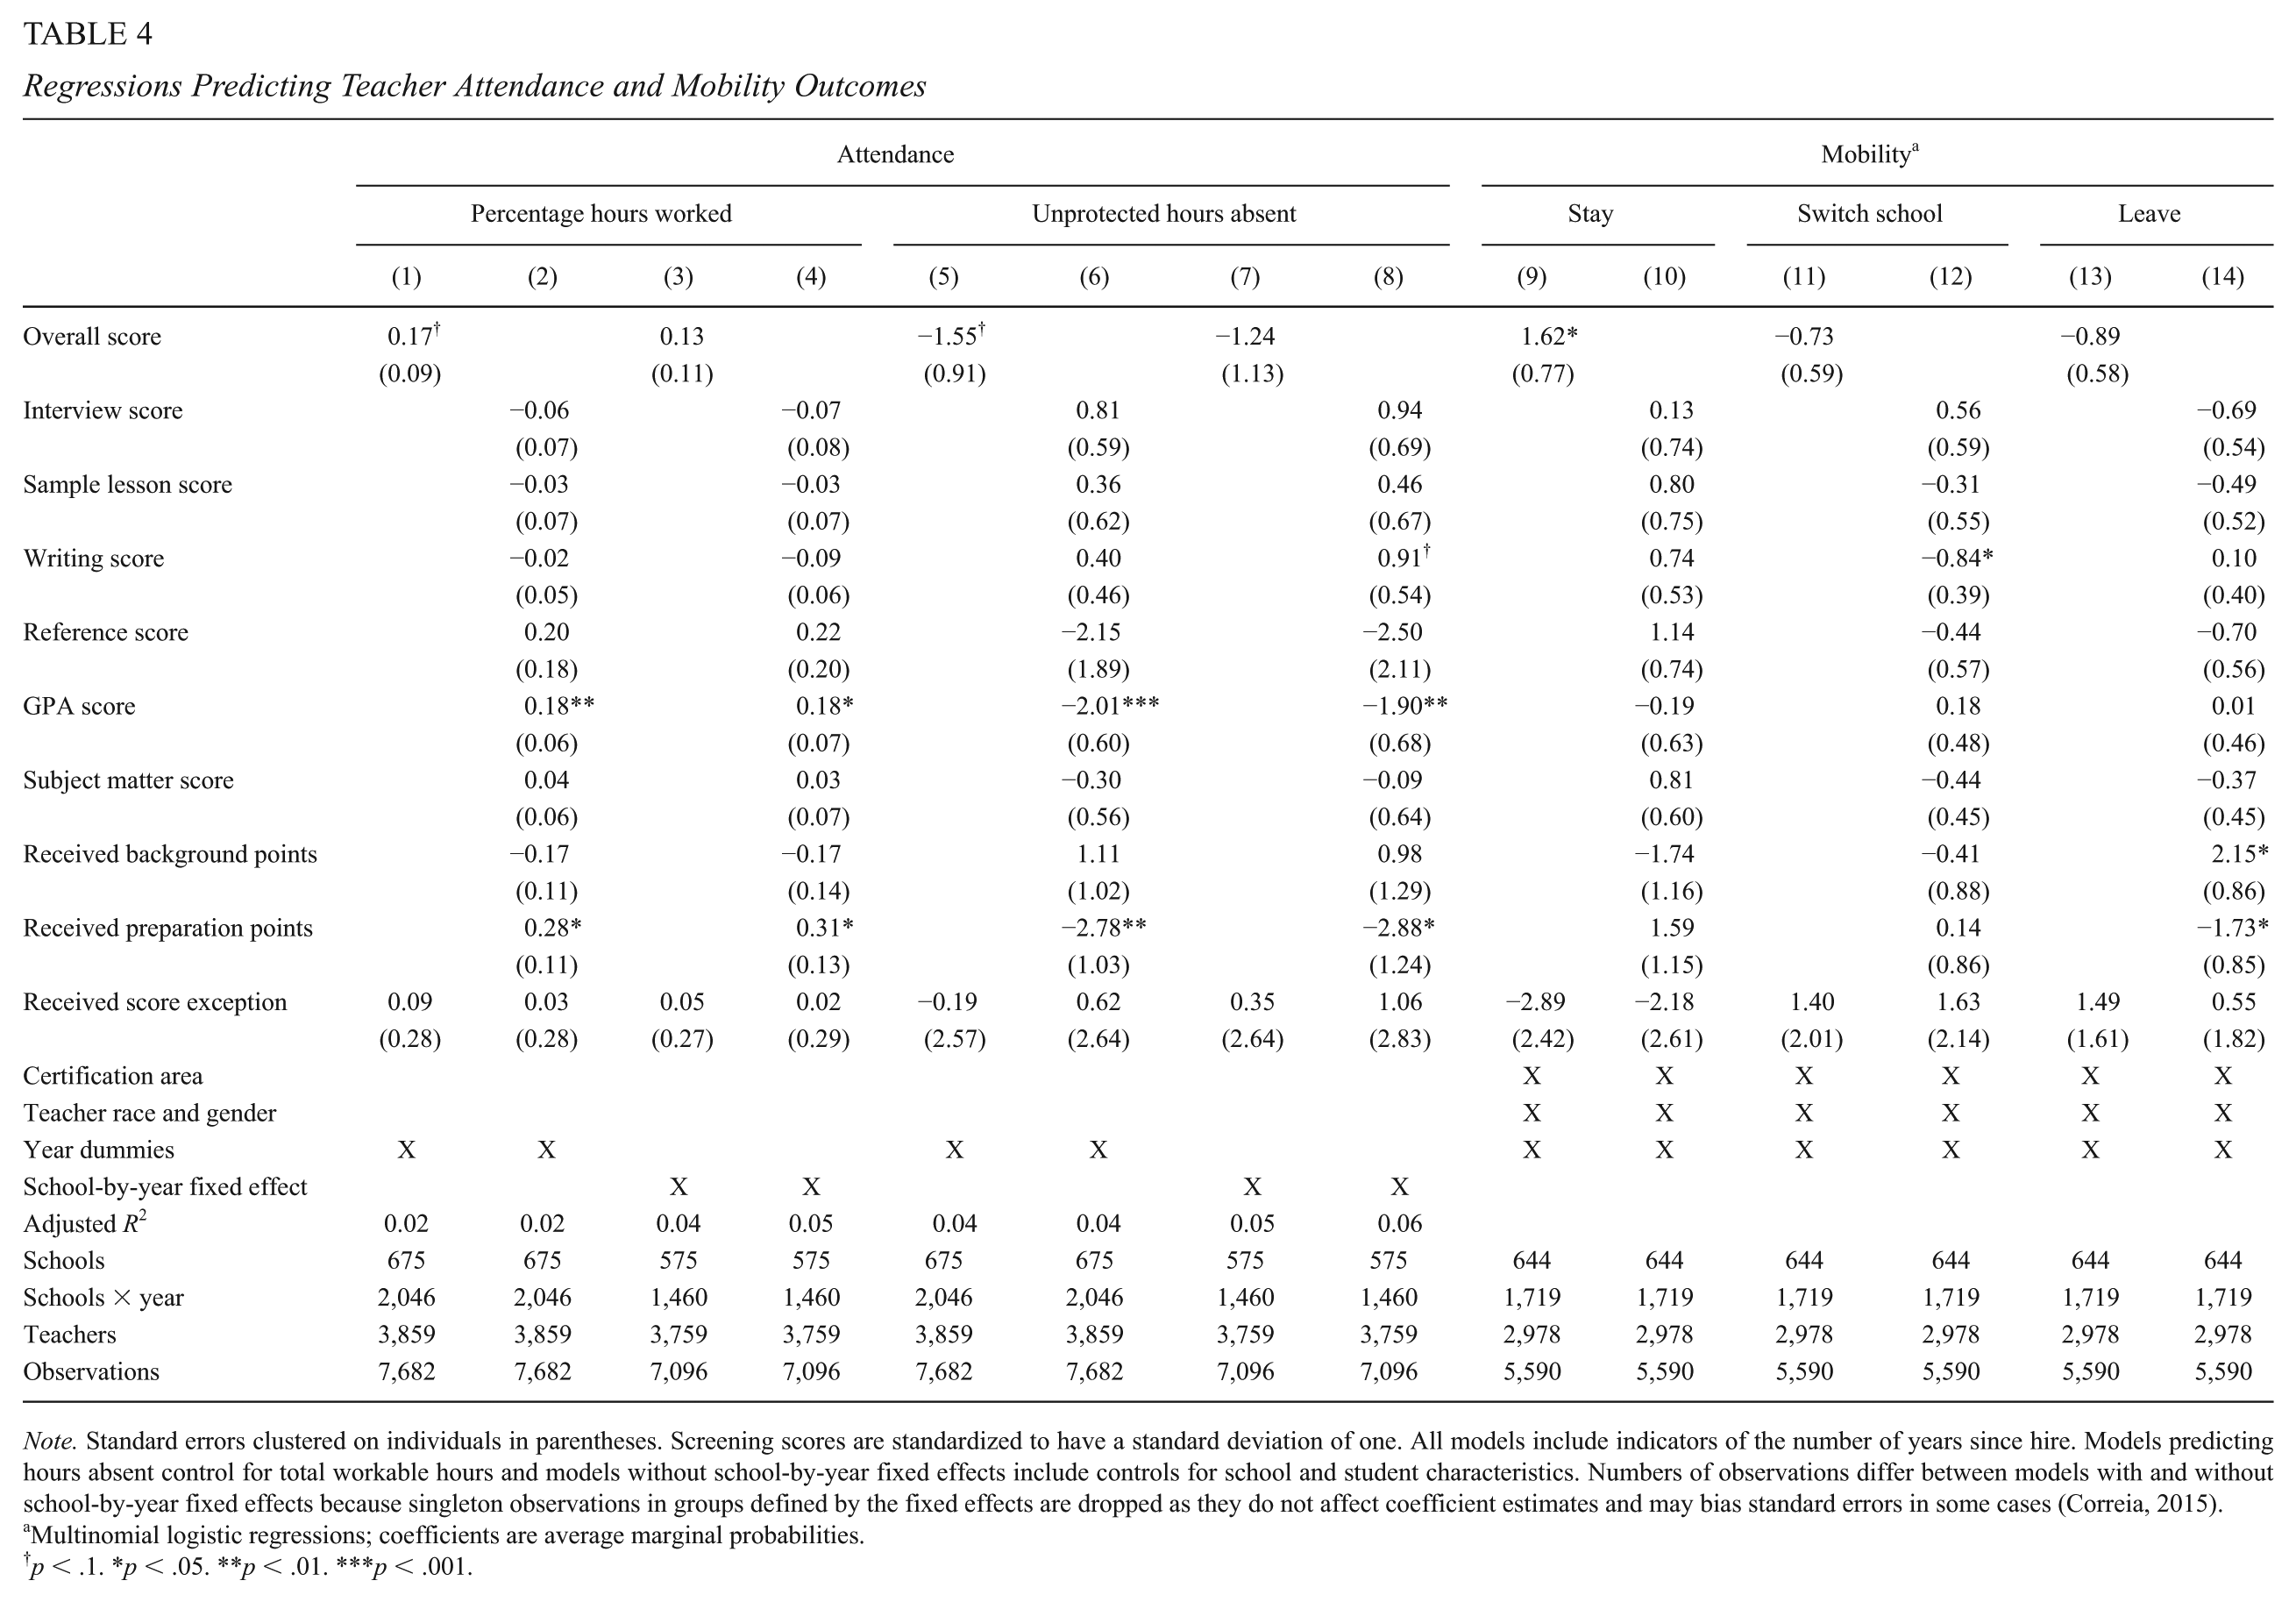
Note. Standard errors clustered on individuals in parentheses. Screening scores are standardized to have a standard deviation of one. All models include indicators of the number of years since hire. Models predicting hours absent control for total workable hours and models without school-by-year fixed effects include controls for school and student characteristics. Numbers of observations differ between models with and without school-by-year fixed effects because singleton observations in groups defined by the fixed effects are dropped as they do not affect coefficient estimates and may bias standard errors in some cases (Correia, 2015).
Multinomial logistic regressions; coefficients are average marginal probabilities.
p < .1. *p < .05. **p < .01. ***p < .001.
Back-of-the-envelope calculations suggest that these relationships are practically significant. Had the undergraduate GPAs of the approximately 2,000 employees screened under the MMTSP in 2014–2015 been higher by half of a standard deviation—roughly two tenths of a GPA point, raising average undergraduate GPAs from 3.2 to 3.4—our results imply that those teachers would have collectively missed roughly 348 fewer days of work, a decline of 4%. Hiring an additional 10 percentage points of teachers who receive the preparation points would be expected to have reduced absences by another 97 days. Moreover, because the number of MMTSP-screened teachers in the district grows over time, so too does the absolute number of additional days of work attended in this hypothetical; by 2016–2017, replacing teachers in this way would be predicted to reduce unprotected days of absence by 585 and 162 days, respectively. These additional teacher work days can be important both for student learning and for district budgets. Previous work has found that an additional day of teacher absence can reduce the achievement of affected students by as much as 0.3% of a standard deviation (Clotfelter, Ladd, & Vigdor, 2009; Miller, Murnane, & Willett, 2008), and the minimum daily pay rate for teachers working as substitutes in LAUSD in 2016–2017 was US$191.
Other screening measures, including the receipt of a score exception, are not predictive of attendance rates or unprotected absences, and as with VAMs, the inclusion of these measures dilutes the ability of applicants’ overall screening scores to predict their subsequent attendance; the coefficients on overall scores are only marginally significant and are smaller in magnitude than those on preparation points, reference scores, or GPA scores. They are also more sensitive than those subscores to the inclusion of school-by-year fixed effects. Although estimates become less precise and the coefficient on overall screening score shrinks somewhat in the school-by-year fixed effect specification, GPA and preparation points remain significant predictors, and the coefficients on reference and preparation points increase slightly in magnitude.
Teacher Retention
Columns 9 to 14 of Table 4 provide results from multinomial logistic regressions predicting teachers’ propensities to switch schools within the district or exit the district altogether, relative to staying in the same school. 14 Individual subscores are generally not predictive of mobility; only writing scores and the receipt of preparation points are predictive of remaining in the same school or district, respectively, between one year and the next, and background points predict greater odds of leaving the district. Overall screening performance is thus only modestly (though significantly) predictive of teachers’ probabilities of staying in their school from one year to the next; a standard deviation increase in overall screening score is associated with a 1.6 percentage point increase in the probability that a teacher remains in her school. Rough estimates using these results imply that had all of the approximately 1,300 employees screened under the MMTSP in 2016–2017 with overall scores below 85—roughly the mean on the eligibility list—been replaced with applicants scoring 85, those teachers would have been 1.1 percentage points more likely to stay in their schools the following year, from a baseline of 79.6%. This would not only have saved the district the cost of replacing teachers but likely have had academic benefits for both the teachers’ own students and the other students at their schools (Milanowski & Odden, 2007; Ronfeldt et al., 2013).
Correspondingly, overall screening scores are associated with lower probabilities of both switching schools and leaving the district, though neither relationship is significant. These results align with earlier work by Goldhaber et al. (2017), which found that in Spokane, teacher screening ratings predicted teachers’ propensities to remain in their districts.
Sensitivity to Bias
We are not overly concerned with the possibility that screening performance is associated with unobserved applicant attributes related to teacher outcomes because the primary purpose of employee screening is predictive (rather than causal) inference. In addition, principals do not observe applicants’ screening scores, and our estimates are generally robust to the inclusion of school-by-year fixed effects. This substantially mitigates concerns that hired applicants are sorting into placements in ways that are associated with both their performance on screening assessments and their outcomes (e.g., because some assignments are easier than others or have lenient administrators). 15
However, a remaining concern when interpreting these results is that, regardless of the schools in which they ultimately work, applicants’ probabilities of being hired off of the eligibility list are correlated with unobservable factors that are also associated with both screening performance and future outcomes. As discussed above, previous studies that have been able to isolate plausibly exogenous variation in hiring probabilities have found the magnitude of bias resulting from this kind of selection to be very small.
In addition, to the extent that selection into employment changes the observed relationship between MMTSP scores and teacher outcomes, we suspect that such bias would tend to attenuate our estimates on average, making them somewhat conservative. Applicants hired despite lower scores may thus have other attributes, not discernible during screening, that site administrators view as compensatory. If those other attributes are also predictive of the outcome measures we use here, this would tend to attenuate relationships between screening scores and outcomes for hired applicants, relative to the eligibility list as a whole. Similarly, if the minimum score requirements of the MMTSP exclude the very worst applicants, the observed relationship between MMTSP performance and quality will be attenuated on the eligibility list and, in turn, among hired teachers.
Because we only observe outcomes for hired teachers, we cannot rule out this kind of selection bias. However, as shown in Table 2, applicants on the eligibility list who are hired and those who are not are very similar on average in terms of screening performance. This alleviates to some extent concerns that there is substantial selection of applicants into employment on the basis of unobservable characteristics correlated with MMTSP scores.
As an additional check, we follow Frank et al. (2013) in estimating the extent to which our inferences would be sensitive to the replacement of hired teachers with nonhired eligible applicants for whom screening performance is unrelated to the outcomes we consider here. As shown in Table B2, in models in which we find a significant relationship between screening scores and teacher outcomes, between 3% and 79% of hired teachers would have to be replaced with applicants for whom screening performance was unrelated to our outcomes to invalidate our inferences at the 10% level.
The fact that some of these figures are small indicates that some of our results should be interpreted with caution. For example, the relationships between sample lesson scores and math VAMs, writing scores and average EDST ratings, and overall scores and attendance rates would all lose significance even if fewer than 10% of hired teachers were replaced by teachers for whom these relationships were null.
However, in other cases, our results are considerably more robust to this kind of hypothetical replacement of hired teachers. For example, the relationships between sample lesson performance and ELA VAMs, average EDST ratings, and summative evaluation ratings would be invalidated only if a majority of hired teachers were replaced in this way. Although we cannot prove that such a counterfactual is implausible, we consider it unlikely that school administrators are hiring so heavily on the basis of unobservable applicant attributes that relationships of these magnitudes would be observed among hired teachers, but not among the eligibility list as a whole.
Moreover, Frank et al. (2013) emphasize that potential bias quantified in this way can only be interpreted with respect to the way in which such bias would arise in practice. In our context, the potential bias is limited by the fact that the large majority of applicants on the eligibility list are already hired into LAUSD. This means that even when relatively small shares of hired teachers would have to be replaced to invalidate our inferences, such replacement would in most cases require a larger share of the remaining eligibility list. Thus, for example, although the relationship between within-school teacher retention and overall screening score would lose significance with the replacement of only 23% of teachers, this would represent more than one third (37%) of the remaining eligibility list. In some cases the entire remaining eligibility list would be insufficient. 16
We cannot fully rule out that our results are biased by the way applicants are hired off of the eligibility list, particularly when our estimates are small in magnitude or marginally significant. However, given the size of the eligibility list and previous findings that such bias is very small in other contexts, most of our inferences are unlikely to be substantially affected by biases arising from applicant hiring.
Reweighting Screening Assessments
Because some screening subscores are more predictive than others or contribute more to applicants’ overall scores, and because applicants’ overall scores are often less predictive of outcomes than their subscores, a natural question is whether screening performance could be used differently to better predict these outcomes. We approach this question by considering four of the outcomes above—ELA value-added, attendance rate, receipt of an unsatisfactory final evaluation rating, and retention in the teacher’s school—and reweight applicants’ overall screening scores in several ways. We then rerun the models above for each of these outcomes, replacing applicants’ scores with each of the reweighted (and restandardized) scores. The resulting coefficients on applicants’ overall scores are presented in Table 5. The first column provides the original coefficients presented above for comparison. Reading from left to right across the table shows how the predictive validity of applicants’ overall scores varies as scores are reweighted.
Coefficients Using Reweighted Overall Scores
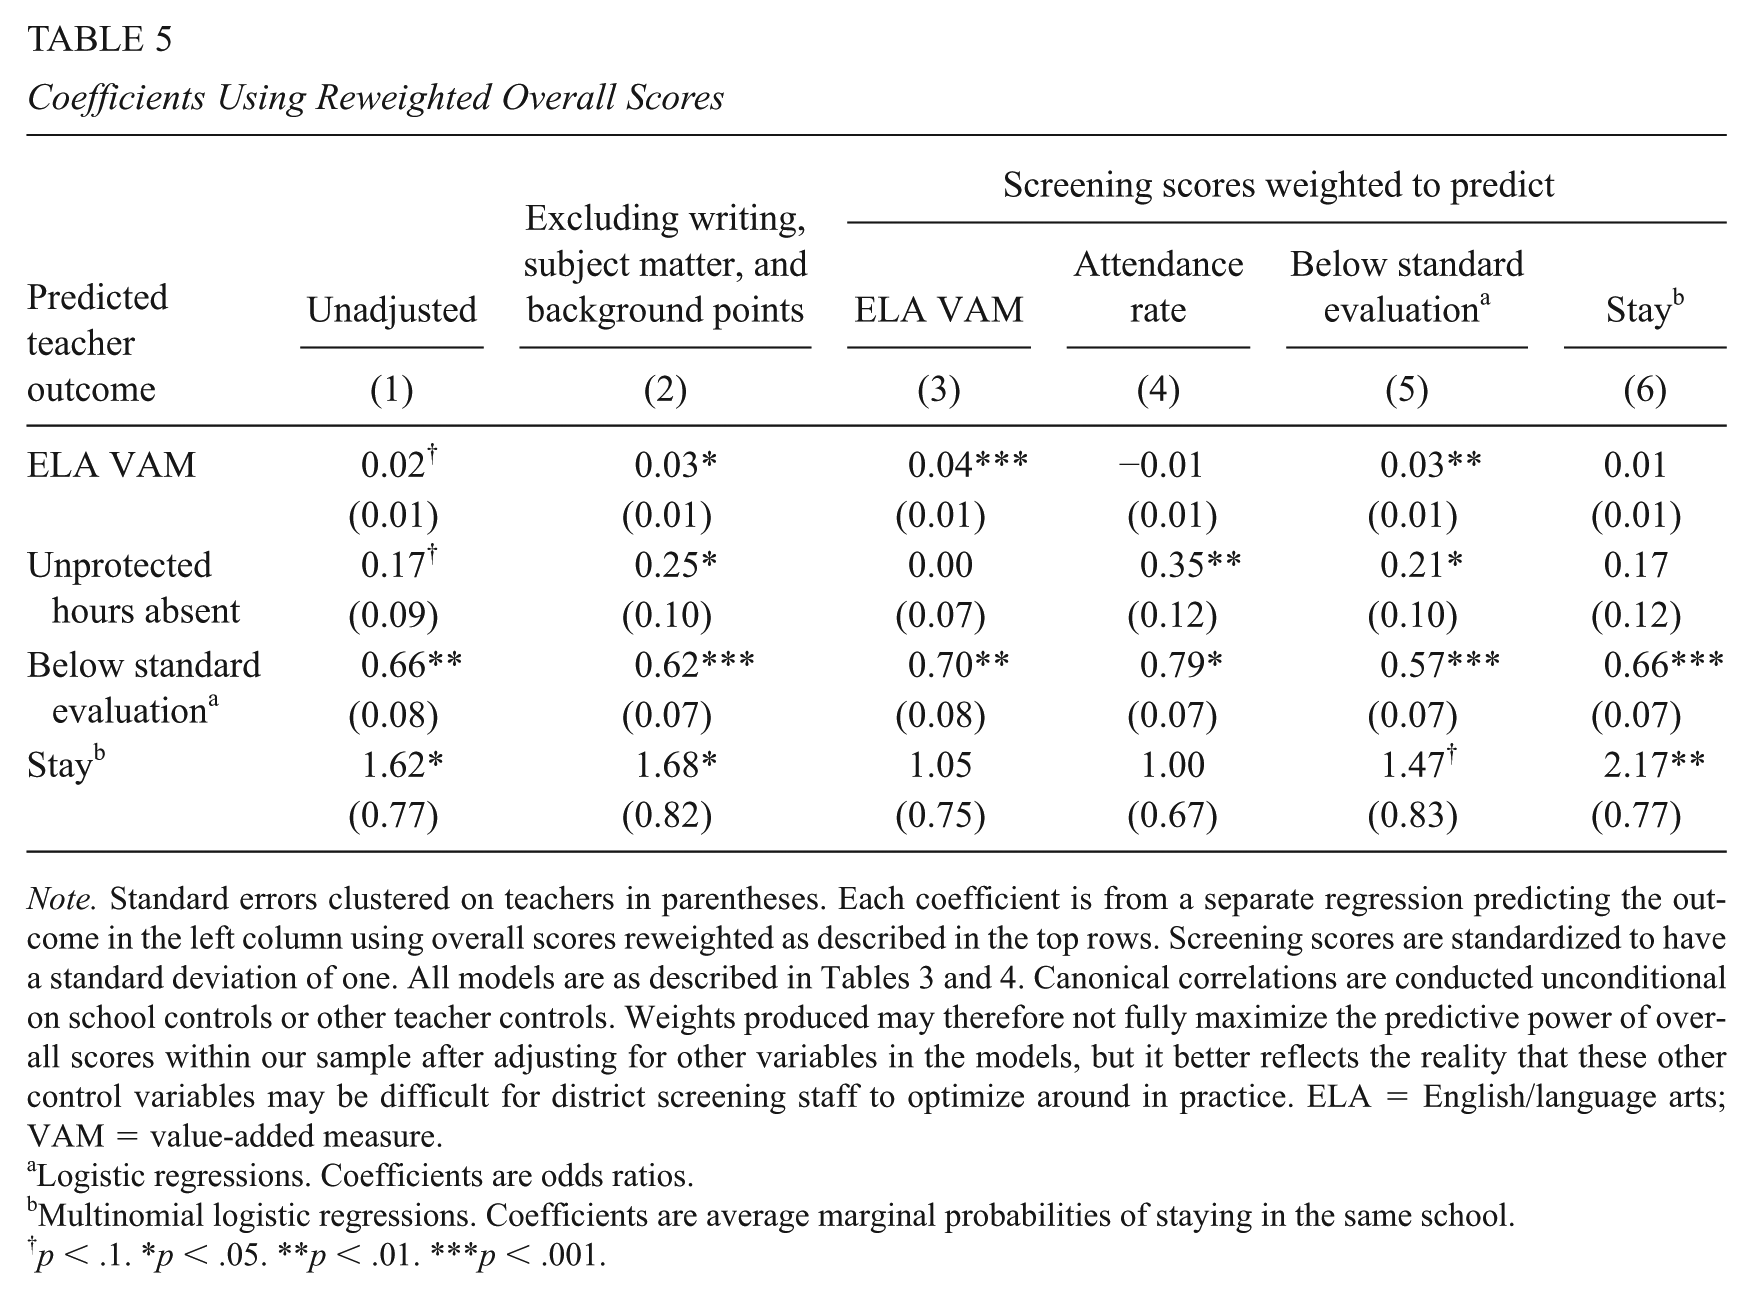
Note. Standard errors clustered on teachers in parentheses. Each coefficient is from a separate regression predicting the outcome in the left column using overall scores reweighted as described in the top rows. Screening scores are standardized to have a standard deviation of one. All models are as described in Tables 3 and 4. Canonical correlations are conducted unconditional on school controls or other teacher controls. Weights produced may therefore not fully maximize the predictive power of overall scores within our sample after adjusting for other variables in the models, but it better reflects the reality that these other control variables may be difficult for district screening staff to optimize around in practice. ELA = English/language arts; VAM = value-added measure.
Logistic regressions. Coefficients are odds ratios.
Multinomial logistic regressions. Coefficients are average marginal probabilities of staying in the same school.
p < .1. *p < .05. **p < .01. ***p < .001.
First, because applicants’ writing and subject matter scores, and whether they receive the background points, are at best only weakly and infrequently predictive of the outcomes we consider here, applicants’ overall screening performance might be more usefully predictive if those screening elements were omitted. In addition, because the writing assessment is time and labor intensive for both applicants and screeners, excluding it may be more efficient. We therefore recalculate applicants’ overall scores without these subscores and present the resulting coefficients in column 2 of Table 5. All four coefficients increase slightly in magnitude when scores are reweighted in this way, suggesting again that the predictive power of many MMTSP subscores is diluted by the presence of these three elements in applicants’ overall scores.
Alternatively, it may be that even seemingly weak predictors of teacher outcomes provide some useful information and that districts are interested in maximizing specific outcomes. To assess this possibility, we next retain all screening assessments, and similar to Goldhaber et al. (2017), for each outcome, we use canonical correlation to identify weights for each screening subscore that maximize the correlation between overall screening scores and that outcome, producing four new (i.e., reweighted to maximize each of the four outcomes) overall scores for each applicant. The resulting weights for each MMTSP score are presented in Table A5.
Coefficients from models using these scores are presented in columns 3 to 6 of Table 5.
Weighting screening scores to better predict ELA VAMs increases the coefficient on the (standardized) overall score, from 0.02 to 0.04, and in so doing brings the coefficient to statistical significance (p < .001). Looking down the columns, however, shows that this gain comes with a trade-off; reweighting scores in this way (i.e., to predict ELA VAM) reduces the coefficients when predicting both absence rates and probability of teachers staying in their schools in the following year. This is a recurring pattern across all four teacher outcomes considered here; in each case, it is possible to increase the magnitude of the coefficient predicting one outcome, in some cases substantially, by reweighting scores to predict that outcome, but in every case, doing so reduces the magnitude of the coefficients predicting at least one other outcome.
Despite the existence of such trade-offs, such reweighting may be desirable for districts, especially if some teacher outcomes are more amenable to improvement after hiring. For example, reweighting applicants’ scores to better predict teachers’ final evaluation ratings (column 5 of Table 5) improves the prediction of their attendance and ELA value-added as well, and the slight decrement to the ability to predict teacher retention may be worthwhile given evidence that such retention is closely related to the working conditions of the schools into which teachers are eventually placed (e.g., Ladd, 2011). The evidence presented here suggests that districts need to think carefully not only about the attributes they value most highly in teachers generally but also about which attributes are most important to identify during initial selection.
Summary
In sum, many aspects of screening performance are predictive of applicants’ subsequent outcomes as teachers, including their contributions to student achievement, evaluated performance, attendance, and mobility, and these relationships are not obviously explicable in terms of the way teachers are hired from the eligibility list or sort to schools. However, individual screening assessments often do not predict all outcomes equally well, suggesting that districts face trade-offs when prioritizing outcomes during the hiring process. Moreover, the magnitudes of these relationships vary between screening subscores such that applicants’ overall screening performance is often more weakly predictive of the same outcomes. Nevertheless, even these weaker relationships are often statistically significant and nontrivial in magnitude, and the predictive power of many individual screening assessments suggests that teacher quality may be more discernible ex ante through more intensive screening than has often been assumed. Of course, raising screening standards in this way may not be practical, especially for hard-to-staff teaching positions, but districts may nevertheless benefit from doing so when possible. 17
Discussion and Policy Implications
Despite widespread agreement that teacher quality is important for school systems, very little is known about how school districts should hire teachers. We contribute to this literature using screening data from LAUSD and newly hired teacher outcomes for as many as 4 years of employment after screening.
LAUSD’s new teacher screening assessments appear to accurately discern several aspects of teacher quality. Applicants’ overall performance during screening is positively, significantly, and meaningfully associated with their subsequent contributions to student achievement, attendance, evaluation, and mobility outcomes. These relationships do not appear to be driven to a large extent by selection during hiring or by the differential sorting of teachers into classroom placements, though such factors cannot be definitively ruled out. The district may therefore benefit from its policy of excluding most low-performing applicants from employment eligibility.
We do not have specific information about the costs of applicant screening in LAUSD, either for the MMTSP or for the previous system, so we cannot assess whether the benefits of the MMTSP exceed its costs. Correspondence with district officials suggests that the MMTSP does require more resources than the previous screening system, primarily due to the additional time required for HR specialists to score materials that were either not utilized in the past, or which were not formally scored. However, these costs also appear to have been mitigated to some extent by the concurrent adoption of better electronic systems for soliciting, collecting, and organizing application materials. As with the use of machine learning techniques to evaluate applicant materials (Sajjadiani et al., 2019), this suggests that technological advancements may facilitate the collection of information about prospective teachers that would previously have been prohibitively costly.
There is important variation in which components of screening are predictive of different teacher outcomes. For example, a sample lesson assessment is meaningfully predictive of effectiveness in terms of contributions to student achievement and classroom-observation-based evaluation ratings. Professional references are predictive of teacher evaluation ratings, and applicant GPAs predict both teachers’ evaluation ratings and their attendance. Preparation points, although difficult to interpret given their complicated composition, are predictive of nearly all of the teacher outcomes considered here and deserving of further study.
Similarly, differences between our results and those obtained in similar studies in D.C. and Spokane highlight the extent to which different screening assessments may differ in their ability to predict various teacher outcomes. Our results are most similar to those of Jacob et al. (2018), who find in D.C. that teachers’ observation-based evaluation ratings can be predicted by both applicants’ academic backgrounds (e.g., undergraduate GPA) and their performance during screening tasks (e.g., interviews and sample lesson demonstrations) as assessed by district officials but that those same measures predict teachers’ mobility or value-added contributions to student achievement more weakly, if at all. In contrast, Goldhaber et al. (2017) find that teachers’ math value-added and mobility are predicted not just by composite screener ratings at the school and district levels, but by principals’ ratings of applicants on many specific attributes (e.g., training and flexibility), whereas teacher attendance is not. These differences may reflect differences of context (e.g., if teachers or students in Los Angeles and D.C. differ from those in Spokane). However, because Spokane’s screening scores are assigned using different criteria and prior to administering performance tasks to applicants (i.e., primarily by inferring specific applicant skills from standard application materials, such as a resume and cover letter), they also likely reflect differences in screening system design. Given the paucity of research on these issues, additional research linking specific screening assessments to teachers’ outcomes will be important for understanding whether and why screening systems differ in their predictive validity.
This variation in predictive validity across teacher outcomes points to likely challenges for districts attempting to screen teachers more rigorously; consistent with prior work finding that teacher quality is not easily measured along a single dimension (e.g., Kraft, 2017), we find that selecting teachers more deliberately to achieve one outcome frequently entails trade-offs with other outcomes. Districts will therefore need to carefully consider their priorities when determining what elements to include in screening systems and how much weight to give them. In addition, districts should think carefully about which screening assessments are worth performing, since nonpredictive assessments can dilute the predictive power of other assessments when combined into composite measures of applicant performance.
Much remains to be learned about how best to hire teachers, including how to differentiate hiring processes based on subject area, grade level, and labor supply. Further research should help to illuminate ways in which these hiring processes can be improved. For example, it may be useful to lower screening requirements during times of year or for specific subject areas when the availability of applicants is low or their performance is unusually weak. District-level screening may also be able to improve hiring outcomes by prioritizing applicant attributes that tend to be underrated by administrators hiring at the school level. Similarly, if applicants are already screened at the district level, providing more detail to administrators about screening performance—rather than a simple list of eligible applicants—may help school administrators to make more informed hiring decisions at little additional cost.
In addition, virtually nothing is known about the longer term implications of potential teacher screening and hiring reforms, including whether and under what circumstances they produce net improvements to hiring outcomes and whether they have dynamic effects on the quality of prospective teachers entering the labor market. At the same time, we contribute to a small but growing body of literature suggesting that it is possible to collect information about prospective teachers prior to hire that can be used to inform and improve hiring by schools and districts. Given that many administrators appear to have substantial discretion when making hiring decisions, perhaps more so than after teachers have been hired, and that teacher quality has important consequences for students and schools, new teacher screening may prove to be an important lever for improving educational quality in many settings.
Supplemental Material
DS_10.3102_0162373719865561 – Supplemental material for Making the Cut: The Effectiveness of Teacher Screening and Hiring in the Los Angeles Unified School District
Supplemental material, DS_10.3102_0162373719865561 for Making the Cut: The Effectiveness of Teacher Screening and Hiring in the Los Angeles Unified School District by Paul Bruno and Katharine O. Strunk in Educational Evaluation and Policy Analysis
Footnotes
Appendix A
Appendix B
Acknowledgements
We are grateful to the Los Angeles Unified School District for providing the data necessary to conduct this research, and in particular to Vivian Ekchian, Sergio Franco, Leanne Hannah, Bryan Johnson, Cynthia Lim, Emily Mohr, and Lydia Stephens for their partnership in developing the research agenda, and Inocencia Cordova, Joshua Klarin, Jonathan Lesser, Jacob Guthrie, and Kevon Tucker-Seeley for their assistance in obtaining and understanding the data. In addition, this paper has benefited from helpful feedback from Edward Cremata, Dan Goldhaber, Jason Grissom, Ayesha Hashim, Brad Marianno, T.J. McCarthy, Morgan Polikoff, Matt Kraft, and two anonymous referees.
Declaration of Conflicting Interests
The author(s) declared no potential conflicts of interest with respect to the research, authorship, and/or publication of this article.
Funding
The author(s) disclosed receipt of the following financial support for the research, authorship, and/or publication of this article: This research was supported by the National Center for the Analysis of Longitudinal Data in Education Research (CALDER), which is funded by a consortium of foundations. All opinions expressed in this paper are those of the authors and do not necessarily reflect the views of our funders or the institutions to which the authors are affiliated.
Notes
Authors
References
Supplementary Material
Please find the following supplemental material available below.
For Open Access articles published under a Creative Commons License, all supplemental material carries the same license as the article it is associated with.
For non-Open Access articles published, all supplemental material carries a non-exclusive license, and permission requests for re-use of supplemental material or any part of supplemental material shall be sent directly to the copyright owner as specified in the copyright notice associated with the article.
