



Abstract
English learners (ELs) lag behind their peers in academic achievement and attainment, partly due to limited exposure to academic content. Prior studies that examine high school course-taking find significant course access gaps between ELs and non-ELs but provide little information on the relation between course-taking and time spent as an EL. This study improves upon previous research by addressing this dimension of heterogeneity and reporting detailed by-subject analyses. I use student-level data (N = 41,343) from a unique district in California with a large number of Chinese and Spanish ELs. I find substantial heterogeneity in general and advanced course-taking based on time spent as an EL. But differences disappear once eighth grade test scores are taken into consideration.
There is a rich literature on socioeconomic and racial disparities in high school course-taking (e.g., Conger, Long, & Iatarola, 2009; Gamoran, 2010; Klopfenstein, 2004), but research focused on English learners (ELs) is recent and developing. At the high school level, ELs needing language service comprise 6.4% of the student population nationwide and as much as 19% in states like California (ED Data Express, 2017). Middle school ELs face both leveled and exclusionary tracking (Umansky, 2016). That is, ELs enter high school having less experience with academically challenging material compared with non-ELs. The courses ELs take in high school can close, maintain, or exacerbate this preexisting academic preparation gap between ELs and their peers.
Prior large-scale studies on course-taking pooled all high school ELs in their analyses (e.g., Callahan & Shifrer, 2016; Callahan, Wilkinson, & Muller, 2010). Variations within the current EL population remain largely unexplored. This is problematic because current ELs are a culturally, linguistically, and socioeconomically diverse population. They differ vastly in family background and prior schooling experiences and, as a result, academic preparation and literacies, all of which might affect access to high school curricula. Compared with ELs who have had interrupted schooling and ELs who struggle with literacy in any language, ELs who have had consistent schooling and exposure to rigorous academic material in their home countries are likely to have very different course-taking patterns and achievement outcomes. Pooling current ELs as one group can lead to findings that overlook important variations in the population. The implications of these findings subsequently fail to address ELs’ diverse linguistic and academic needs.
This study is the first in course-taking research to disaggregate data on a large sample of current ELs to make distinctions about their academic course-taking. Leveraging longitudinal student-level data from a large, urban school district in California, I describe course-taking patterns of three subgroups of current ELs (Newcomers, Mid-term, and Long-term) and former ELs who exited language service before high school. I compare the outcomes of these Ever-ELs to students whose home language is only English or students who speak a language other than English at home but entered U.S. schools fully proficient in English.
This study provides a more precise estimation than earlier research, reporting the relation between current EL subgroup status (as defined by years as an EL) and both the quantity and the quality of high school courses taken. I show that pooling current ELs as one group results in findings that mask substantial variation among current EL subgroups. This study also adds to the EL literature, which has focused largely on Spanish-speaking ELs, by examining a context with a large group of Chinese ELs. I discuss policy implications on curriculum, instruction, and accountability for increasing academic content exposure and access for each EL subgroup.
Access to High School Courses
Placement in academic courses is a major factor determining opportunities to learn. Courses with high and low academic intensity differ in curriculum quality, classroom discourse, teacher expectations, and student motivation (Burke & Sass, 2013; Clotfelter, Ladd, & Vigdor, 2010; Goldhaber & Brewer, 2000; Hoxby, 2000; Raudenbush, Rowan, & Cheong, 1993). Rigorous high school courses help students acquire skills and signals for college and career readiness (Spence, 2002). But ELs have very little access to them.
Even net of ethnicity and family income, EL status is still negatively associated with the rigor of high school courses taken (e.g., Callahan, 2005; Callahan & Shifrer, 2016). Intended by federal law to enable a “meaningful opportunity to participate in the public educational program” (Lau v. Nichols, 1974), EL classification and services have been shown to carry unintended consequences. A well-developed line of qualitative research has documented ELs’ experiences with secondary school courses, pointing to multiple and substantial barriers to EL college preparation aside from English proficiency, including academic tracking policies and low self-efficacy (e.g., Faltis & Wolfe, 1999; Valenzuela, 1999). Recent quantitative studies corroborate these findings. Within schools that offer advanced curricula, ELs are overrepresented in the low tracks, underrepresented in the high tracks, and excluded from taking courses in certain subjects altogether (Callahan, 2005; Callahan & Shifrer, 2016; Estrada, 2014; Umansky, 2016). ELs who receive language service in high school are less likely to complete graduation requirements and less likely to take college-preparatory classes than native English speakers and other language minorities not receiving language service (Callahan & Shifrer, 2016).
EL access to academic content is shaped by several factors. First, ELs tend to enroll in low-resource schools that offer fewer advanced academic courses (U.S. Department of Education [U.S. DoE], 2018). Second, some states require ELs to enroll in designated English Language Development (ELD) courses that take up two or more class periods per day. Arizona, for example, enrolls ELs in up to 4 hours of ELD (Lillie, Markos, Arias, & Wiley, 2012). School-level practices, such as block scheduling used in the context of this study, can also result in the exclusion of math, science, and other content courses from ELs’ course schedules. Third, ELs can be placed in lower track classes because school administrators perceive linguistic demand to be lower in these courses and try to “protect” ELs from more difficult academic materials (Kanno & Kangas, 2014). Finally, teacher staffing can be a challenge. Although states like California have embedded EL preparation in teaching credentials (California Commission on Teacher Credentialing, 2018), many have not (e.g., Alaska Department of Education & Early Development, 2018; Education Commission of the States, 2014; Hawaii Teacher Standards Board, 2017). In some cases, when teachers teaching high-track classes lack the required EL certification, EL students cannot be placed into their classrooms. On a national level, an even bigger issue is that many teachers are still not sufficiently prepared for working with ELs, regardless of EL preparation requirements in their local context (National Academies of Sciences, Engineering, and Medicine, 2017).
Taken together, the literature provides ample evidence that ELs, as a group, face limited academic course access. Less is known about course-taking patterns of subgroups based on the amount of time spent in EL status prior to high school. Callahan’s (2005) landmark study was the first in course-taking research to distinguish between recent immigrants and long-term ELs (LTELs) who stay classified as EL even after attending U.S. schools for several years. Although its small sample (N = 355), based in one rural high school, poses limitations on the generalizability of the findings, the study highlighted the demographic and academic heterogeneities within the EL population. Several subsequent studies have reemphasized the importance of identifying and devising strategies to meet the different needs of EL subgroups based on years spent as EL (Callahan & Shifrer, 2016; Jaquet & Fong, 2017; Thompson, 2017). However, no study has provided evidence for high school course-taking by EL subgroups in multiple academic subjects.
EL Subgroups
High school students who were ever classified as EL are diverse in terms of cultural and educational background and linguistic and academic needs. Their educational experience in the United States can differ based on factors including but not limited to the quality and consistency of prior schooling, length of residency in the United States, the types and quality of EL services received in the United States, and time spent in EL status. Although there is likely substantial heterogeneity in EL academic achievement along each of these dimensions, previous studies have done little to investigate it. Detailed data on prior schooling, U.S. residency, and EL services are often inaccurate or altogether unavailable. In this study, I report variations in high school course-taking based on time previously spent in EL status. In addition to presenting new evidence, I hope this study will catalyze the reporting and analysis of richer data on EL subgroups.
Prior research documents three large subgroups within the Ever-EL population: Newcomer, LTELs, and Reclassified ELs (Olsen & Jaramillo, 1999; Saunders & Marcelletti, 2013; Thompson, 2017). Reclassified ELs are former ELs who no longer receive language services. Newcomer and LTELs are current ELs characterized by years spent as ELs (described in detail below). Current ELs who are no longer Newcomers but not yet Long-term are not explicitly defined or addressed by research as a subgroup. I refer to this small subgroup as Mid-term throughout the remainder of this article.
Newcomers
Newcomers are foreign-born immigrant students who have recently moved to the United States (U.S. DoE, 2016). It is estimated that between 2010 and 2014, about 154,100 new immigrant ELs entered U.S. schools annually (Sugarman, 2017). Students are commonly designated as Newcomers and are eligible to participate in the Title III Immigrant Student Subgrant Program until they have lived in the United States for 3 years (Every Student Succeeds Act [ESSA], 2015). Newcomers all face the challenges of adjusting to living in a new country, building a new social network, and using English in a new academic environment (Short & Fitzsimmons, 2007). However, Newcomers are far from homogeneous. They arrive from a wide range of countries, languages, cultures, and schooling backgrounds (Umansky et al., 2018). Many have developed literacy in another language as well as advanced math and science proficiency through continuous schooling in their country of origin; some might even be fluent in academic English. We might expect these students to place into and succeed in advanced classes in subjects that require relatively less extensive academic reading and writing, such as math. Other Newcomers are students with interrupted formal education (SIFE) and may or may not be literate in any language or behind grade level in math and other subjects (DeCapua & Marshall, 2010; Olsen & Jaramillo, 1999). The Newcomer subgroup can also include refugees or unaccompanied youths seeking asylum or family reunification. To help a diverse Newcomer population transition to U.S. public education, schools are faced with the task of providing linguistic, academic, emotional, social, and sometimes health and nutrition support.
LTELs
The definition of Long-term EL (LTEL) status has varied over time and across policy contexts (Olsen, 2010). Some states and districts assign long-term status to students who have not been reclassified after 5 or more years, others use 6 or 7 years as the threshold (Freeman, Freeman, & Mercuri, 2002; Menken & Kleyn, 2009; Olsen, 2010). ELs are expected to gain academic English proficiency in 4 to 7 years (Hakuta, Butler, & Witt, 2000). Educators are especially concerned about LTELs because they seem to be “stuck” at intermediate or lower levels of academic English after several years, have very little access to academic content, and underperform in academic subjects (Callahan & Shifrer, 2016; Olsen, 2014). Across the United States, between 25% and 50% of ELs classified at school entry become LTELs; in California, LTELs comprise about 60% of all ELs in Grades 6 to 12 (Olsen, 2014).
Research attributes the large number of ELs’ becoming LTELs to inadequate or inappropriate language services in early grades and express concern for the lack of designated LTEL support at the secondary school level (Olsen, 2010, 2014). The academic and linguistic needs of LTELs are diverse and different from those of Newcomers. Some research has suggested that LTELs can be indistinguishable from other American young adults in their functional English oral communication but struggle with academic vocabulary, reading, and writing (Flores, Kleyn, & Menken, 2015). Some LTELs report that their classes, including ELD, are too easy and fail to challenge them (Kim & Garcia, 2014). Many are neither proficient nor literate in their home language; for these students, instruction in their home language would not be an effective approach for academic support. In some districts, a substantial percentage of LTELs also need accommodations for speech or learning disabilities (e.g., Thompson, 2015). Given the variation within the LTEL group, supporting their academic progress requires accurate needs identification and a combination of academic English development, rigorous curriculum, and special education services.
Reclassified ELs
Once classified as EL, students are typically assessed annually until they demonstrate a level of English proficiency needed to exit language support services. California is one of the states in which ELs become Reclassified Fluent English Proficient (RFEP) after scoring above thresholds on the state’s designated English proficiency and the standardized English language arts (ELA) tests (Linquanti, Cook, Bailey, & MacDonald, 2016). In the context of this study, ELs needed to obtain an overall English proficiency of Early Advanced with scores of Intermediate in the listening, speaking, reading, and writing sections, as well as a score of Mid-Basic on the California Standardized Test (CST)–ELA section to qualify for reclassification. Like many other districts in California, this district also takes teacher and parent recommendation into consideration when making reclassification decisions. As a result, some ELs who did not meet the test score thresholds were reclassified, and some others who did meet the test score thresholds were not reclassified (Estrada & Wang, 2018). Unsurprisingly, RFEPs tend to perform better than ELs in subsequent grades. Pooling RFEPs with ELs would lead to underestimation of the gaps in access and achievement, while pooling RFEPs with native English users would lead to overestimation. Thus, recent research recommends reporting RFEP outcomes as its own group, separate from current ELs and never ELs (Saunders & Marcelletti, 2013; Thompson, 2017).
Aggregating the academic outcome of New-comer, Mid-term, Long-term, and Reclassified ELs can cause researchers to overlook important and interesting patterns, even produce misleading inferences. To uncover more intricate relationships between EL subgroup status, access, and achievement, this line of research desperately needs the strength of rich administrative records on large student samples.
Current Study
This article addresses an important gap in the EL academic access literature using transcript data on 41,343 students across 17 high schools, over half of whom have been classified as EL at some point during Grades K to 12. My research questions are as follows:
My data come from a large urban school district in California that serves a diverse immigrant population that speaks more than 60 languages. About 27% of the sample primarily use Chinese (Cantonese or Mandarin) at home, and about 15% use Spanish. By focusing on this unique context, this study makes a contribution to the literature, which has mostly addressed Spanish-speaking ELs. Prior EL course-taking studies focused on cumulative course completion and the highest level achieved by the end of high school. I am able to expand on these analyses by reporting not only the courses taken but also the timing of course enrollment and completion. I describe students’ progression toward fulfilling graduation requirements from fall semester in 9th grade to spring semester in 12th grade. By doing so, this article provides more details than previous studies on ELs’ academic pathways and identifies viable points of intervention and access gaps that policymakers need to address.
Data and Methods
During the time span of my data, the district used a home language survey and the California English Language Development Test (CELDT) for ELs’ classification. For reclassification, the district used annual CELDT and CST-ELA scores, as well as teacher and parent recommendations. For students classified as ELs, the district provided a variety of language programs at the elementary, middle, and high school levels. ELs in eighth grade participated in one of three programs: General Education, Newcomer, or Dual Language. General Education was available at all middle schools and included sheltered content courses and 30 minutes of designated ELD instruction. The Newcomer program was designed to support recent immigrants at the emergent English level through sheltered content courses and 45 to 90 minutes of ELD per day. The Dual Language program served a combination of ELs, bilingual students, and native users of English who were grade-level proficient in the program language (Cantonese, Korean, Mandarin, or Spanish) and included two courses taught in the program language. Newcomer and Dual Language programs were offered at select middle schools. Middle school enrollment was determined through a family-rank and assignment system, in which students eligible for and participated in the same language program in elementary school had priority. Some families might have ranked schools based on the language programs offered, but other factors such as distance from home and school hours are also likely to have affected preferences.
Using students’ U.S. entry, district entry, and EL classification dates, I follow the district’s documentation and prior literature (e.g., Callahan & Shifrer, 2016; Freeman et al., 2002; Menken & Kleyn, 2009) to divide ninth grade students ever classified as ELs in four distinct subgroups. They are (a) Newcomers (0–3 years in the United States as EL), (b) Mid-term (entered U.S. school during or after second grade and remained ELs for more than 3 but less than 8 years), (c) Long-term (attended U.S. schools since kindergarten or first grade and remained EL for 8 or more years 1 ), and (d) Reclassified (demonstrated proficiency and exited language service prior to high school). This way of dividing ninth grade Ever-ELs into subgroups reflects both the amount of time they have spent in the U.S. school system and the number of years they have remained in EL status.
Using 11 years of administrative data, I compare the course-taking outcomes of Newcomer ELs (“Newcomers”), Mid-term ELs (“MTELs”), Long-term ELs (“LTELs”), and ELs who are Reclassified Fluent English Proficient (“RFEPs”) to one another and to students who have never been classified as EL (“Never-ELs”). The Never-EL group includes students whose home language is English and students whose home language is another language but who demonstrated fluent English proficiency upon entering the district (“Initially Fluent English Proficient [IFEP]”). My data include students who attended high school in the district between school years 2005–2006 and 2015–2016. The administrative records provide students’ gender, date of birth, ethnicity, home language, U.S. entry date, district entry date, special education status, high school course enrollment and grades (year, semester, course title, final grade, credits earned, district graduation requirement category, UC/CSU A-G entrance requirement category), language status (EL status, date first classified as EL, reclassification date), annual English proficiency test (CELDT) scores, and state standardized test scores in math and ELA.
I look at the total number of courses taken in students’ first 4 years of high school, as well as their credit accumulation by semester. I perform analyses on five core academic subjects required for entrance to California’s public 4-year college: ELA, math, science, social science, and world language. ELs bring different strengths to but also encounter different challenges in each academic subject. A couple of practices unique to this study context are worth noting. First, many ELs in the district take ELD in addition to sheltered ELA courses during each academic year. In this district, most ELD classes at intermediate or advanced proficiency meet ELA requirements; these are coded as ELA classes. I expect ELs to have higher numbers of ELA course enrollment compared with Never-ELs. Second, students in the district who demonstrate proficiency in another language are eligible for world language graduation requirement waivers. According to district administrators, most Newcomers apply for and receive the waiver. Therefore, I expect Newcomer enrollment in world language courses to be low. As these practices are unique to the district, the findings on ELA and world language course-taking may not be generalizable to other contexts. I highlight findings on math, science, and social science course-taking and include ELA and world language findings in the Appendix, available in the online version of the journal.
Cumulative Analysis
I use panel data to look at total course-taking in each academic subject and indicators for having attempted advanced classes in a series. I only include students who had the opportunity to complete 4 years of high school within the time window, or the graduating classes of 2009 to 2016. Students in earlier and later cohorts are excluded because incomplete data may lead to bias in estimation.
My sample includes a total of 41,343 students, classified by their subgroup status at high school entry (see Table 1, Panel A). Approximately half of the sample were Never-ELs, 11.7% were Newcomers, 3.3% were MTELs, 9.2% were LTELs, and a quarter were RFEPs. LTELs had the lowest proportion of girls (39.7%) and RFEPs had the highest (51.3%). Never-ELs and RFEPs were younger than the other groups. A larger fraction of Newcomers, MTELs, and RFEPs are Chinese speakers compared with Spanish speakers; the opposite is true for LTELs. Special education students form 28% of the LTELs and only 11% of the whole sample. Eighth grade math achievement for Newcomers is comparable to Never-ELs, and LTELs lag behind Never-ELs by about 0.8 standard deviations in math achievement.
Summary Statistics for Sample
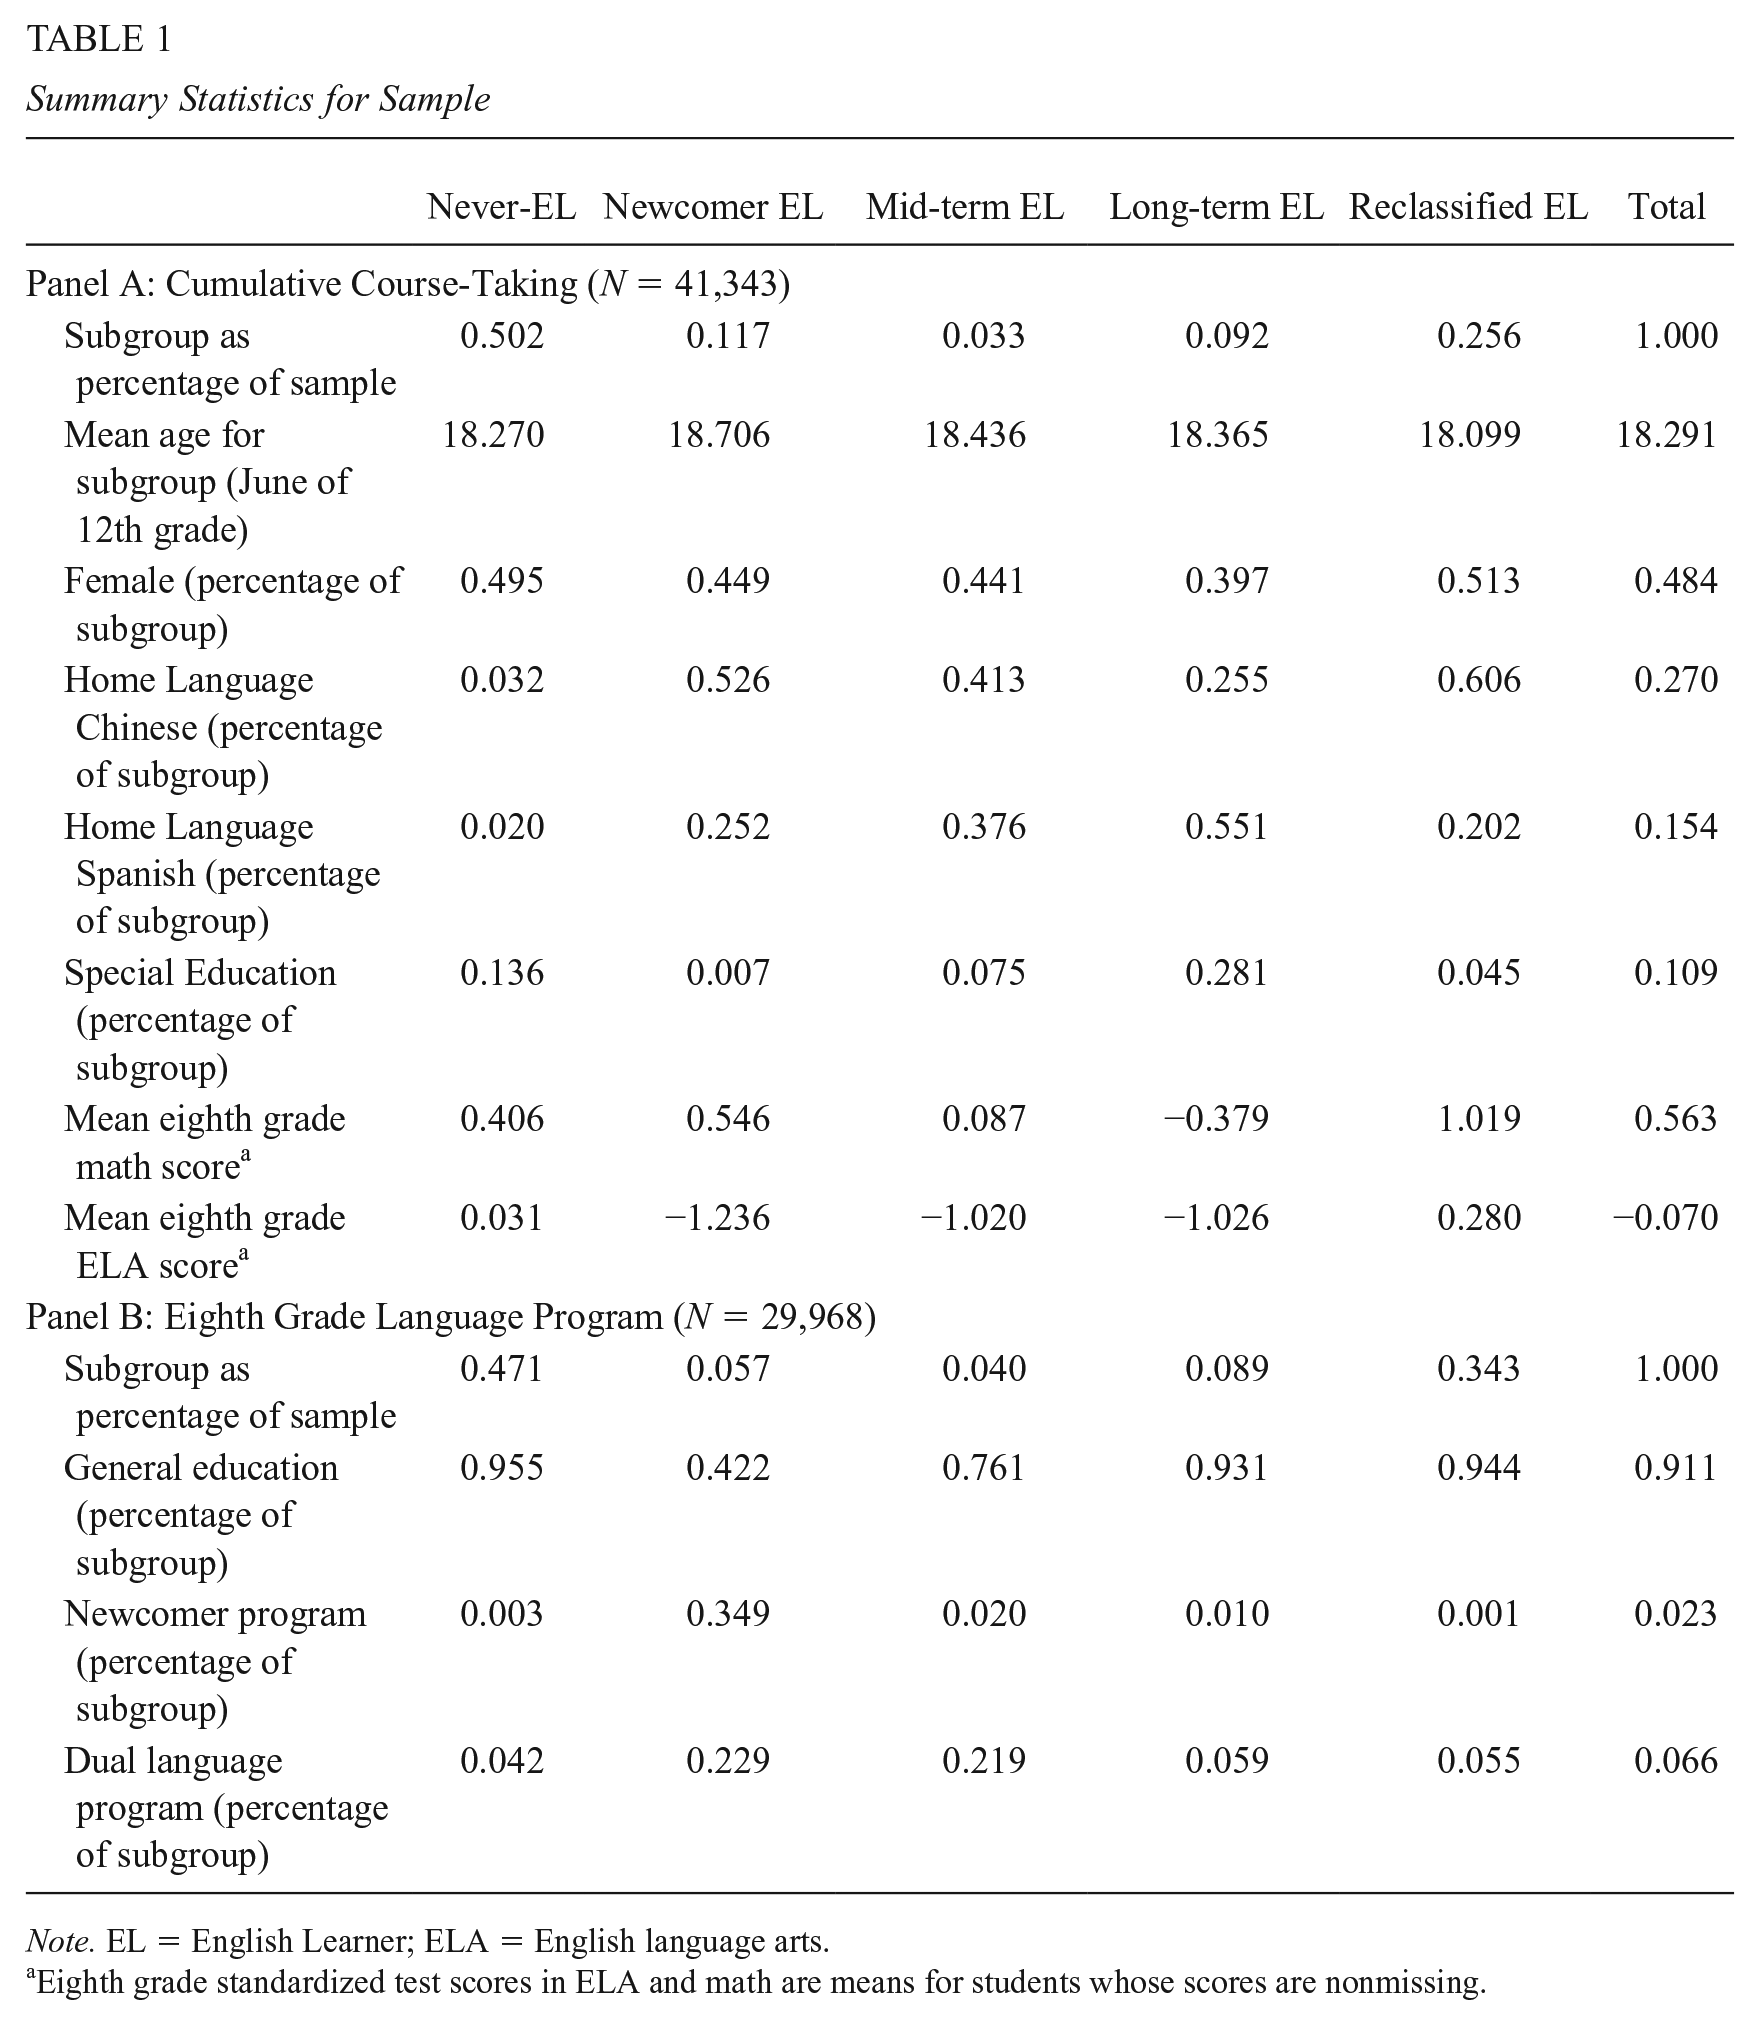
Note. EL = English Learner; ELA = English language arts.
Eighth grade standardized test scores in ELA and math are means for students whose scores are nonmissing.
The sample is unique in that students who use variations of Chinese at home outnumber Spanish users. This makes the sample not representative of the EL population in California (82% Spanish) and the nation (71% Spanish; California DoE, 2017; Migration Policy Institute, 2015). 2 As Chinese and Spanish users might differ in unobserved characteristics such as socioeconomic status or prior schooling, I also perform the main analysis for the two groups separately.
I look at course-taking and credit accumulation over 4 years of high school based on students’ EL subgroup upon entering high school. For each student, I examine the total number of courses in each subject taken and completed during the first 4 years of high school. Only first-time enrollment in each course is counted. This allows me to estimate each subgroup’s probability of accessing high school graduation requirements and public 4-year college entrance requirements after 4 years. In credit completion analyses, credits completed upon repeating courses are counted. The number of courses taken, regardless of completion or grades, serves as a measure of access while the number of courses completed serves as a measure of preparation and performance. Following prior course-taking research, I also examine access to advanced courses, or ever taking physics or chemistry, precalculus or higher math, and third year or higher world language (Callahan & Shifrer, 2016; Long et al., 2012).
Models and Controls
Following prior literature, I use Never-ELs as the reference group and compare each EL subgroup’s course-taking to this omitted category (Umansky, 2016). I also test for equivalence between pairs of EL subgroups and report the p values resulting from those tests. To estimate the relationship between EL subgroup and number of courses taken in each subject, I regress each outcome on EL subgroup status. I apply two sets of models to each outcome: ordinary least squares (OLS) and Poisson for course count outcomes and OLS and logistic for binary dependent variables such as indicators for having taken physics or precalculus. Results are substantively similar. I report OLS estimates for ease of interpretation. Standard errors are clustered at the cohort-by-high-school level to account for potential error correlations. First, I estimate a baseline model using only the categorical EL subgroup as the predictor. Then I progressively add two groups of controls: (a) student demographic information plus cohort-by-high-school fixed effects, and (b) eighth grade standardized test scores. I report findings from (a) and (b) as my main results. Findings from the baseline model are included in the online Appendix.
The purpose of controlling for eighth grade test scores in the last model is to see whether EL subgroup status is associated with course-taking for students who enter high school with similar academic preparation. I use standardized math and ELA test scores as a proxy for academic preparation. The scores likely reflect a combination of subject-matter competency and English language proficiency. In the absence of better measures of academic preparation, I use these scores as controls to get a sense of how much variation in course-taking still remains. To facilitate interpretation, I standardize CST scores using the grade-level and math subject state mean and standard deviations from the 2010 administration. I use the mean and standard deviation from a single year for each test because I want to compare scores not only within but also across test years. A substantial number of students are missing eighth grade ELA and math scores due to movement out of the district. Math and ELA standardized test scores are available only for students who attended eighth grade in the district. Students who transferred into the district after eighth grade are missing these scores. Students who are missing eighth grade test scores are different from students who have scores on several covariates (see online Appendix Table A1). For estimation that use standardized test scores as controls, I drop students who are missing scores. I test the sensitivity of my results by estimating the models without eighth grade test score controls for the subsample that has eighth grade test scores.
To explore the extent to which EL subgroup status still makes a difference after controlling for eighth grade English proficiency, I perform additional analyses further controlling for CELDT scores and report the results in the online Appendix. About 46% of high school ELs in the sample are missing eighth grade CELDT scores. This analysis, enabled by some exploratory imputation, is only meant to add descriptive information. For students who were ever classified as ELs, I also test the robustness of my results using CELDT scale scores standardized using the grade-level mean and standard deviations from the 2010 administration instead of overall placement scores.
Eighth Grade Language Program Interaction
To see if the association between EL subgroup status differs by middle school language program (General Education, Newcomer, or Dual Language), I examine the interaction of EL subgroup and eighth grade language program. Table 1, Panel B, shows participation in eighth grade language program as a percentage of each ninth grade EL subgroup for students with eighth grade enrollment data. More than 90% of Never-ELs, LTELs, and RFEPs, 40% of Newcomers, and 76% of MTELs took General Education. About 4% of Never-ELs and 6% of RFEPs, as well as 23% Newcomers, 22% of MTELs, and 6% of LTELs were in Dual Language. Selection into eighth grade language programs may reflect students’ background characteristics. This analysis is intended to provide additional descriptive information and not causal evidence.
Robustness Checks
To test the sensitivity of my results to sampling, I run a series of checks on restricted samples. The percentage of students in each EL subgroup retained in the restricted samples are reported in the online Appendix Table A2. As the sample shrinks substantially in the models controlling for eighth grade achievement, one might worry that achievement and missing eighth grade scores would be correlated, and that dropping students missing scores from my sample would bias the results. To check if this is the case, I restrict the sample to students with eighth grade achievement, run the same set of stepwise regressions (baseline, demographic control plus cohort-by-school fixed effects, and test scores) on this smaller sample, and compare the estimates to those obtained from the full sample.
Most prior studies on high school course-taking restricted their analytic sample to students who enrolled for at least 2 or 3 years (e.g., Callahan & Shifrer, 2016; Long et al., 2012). I chose not to do this in the main analysis because years of enrollment may be endogenous to treatment, which is EL subgroup status. For example, some research suggests that LTELs drop out of high school at higher rates than other groups (Olsen, 2010). If this is the case, then omitting students who enrolled for 1 or 2 years would bias my estimate on LTELs in the positive direction. So rather than dropping short-term enrollees from the main analysis, I perform an additional set of analyses using a restricted sample as robustness check. In this estimation, I only include students who enrolled in at least one high school class during each of 3 or more academic years.
Students whose home language is not English but demonstrated fluent English proficiency upon entering U.S. schools (IFEPs) may be systematically different from students whose home language is English. I test the sensitivity of my results by dropping IFEPs from the Never-EL group and using only students whose home language is English as the comparison group.
Some education agencies and prior studies define Long-term status as having been an EL for 5 or more years and Newcomer status as 0 to 4 years. As a final robustness check, I rerun my analyses using this two-subgroup system.
Semester Progress Analysis
Most prior studies measure cumulative course-taking at 1, or at most 2 points in time (10th and 12th grade). This article extends this line of research by tracking the academic progress of a subset (N = 34,685) of students from the cumulative course-taking sample from 9th to 12th grade. Examining academic trajectories in this more comprehensive manner will be informative to the development of early warning indicators and potential interventions for ELs at risk of falling off-track.
I focus on students who entered high school in ninth grade. First, I calculate and plot each subgroup’s completed courses at the end of each semester in high school (see online Appendix Figures A1–A5). Second, I compare students’ earned credits to expected academic progress. The district has established overall and by-subject benchmarks for expected credit earnings at the end of each spring. I generate credit deficit measures by subtracting these credit benchmarks from students’ actual credits earned, in total and by academic subject. The overall credit deficit measure only reflects progress in terms of total credits across subjects and does not represent eligibility to graduate. To graduate, students must also earn a specific number of credits in each subject. Subject-specific credit deficits are reported in the online Appendix.
Negative values denote credit deficit. Where actual credit earned exceeds expected credits, the deficit is recorded as 0. In other words, students’ credits earned in excess of the benchmark do not count toward a credit “surplus.” Every subgroup has an average credit deficit because the credit deficits of students who are off-track cannot be offset by students who are accumulating more credits than required.
I follow students who started in 9th grade to the spring of their 12th grade to see how each EL subgroup’s total and by-subject credit deficits develop over time and compare with Never-ELs. To do this, I regress credit deficit outcomes on EL subgroup status, demographic controls, and cohort-by-school fixed effects. In an additional model, I add eighth grade achievement scores as controls. Students who have ninth grade enrollment data but are missing data in at least one of the later years are considered attriters in the corresponding years. Attriters are assigned the credit deficits from the previous year. All regressions of 10th, 11th, and 12th grade outcomes include a dummy for missing data in the corresponding year.
Findings
There are substantial differences in the course-taking patterns of the four Ever-EL subgroups. The online Appendix tables (Tables A3–A14 and A20–A35, columns 1 and 2) demonstrate the difference between pooling all current ELs as one group and disaggregating into three subgroups (Newcomer, MTEL, LTEL). Compared with Never-ELs, Newcomers take fewer courses overall but just as many advanced math and advanced science classes. MTELs take a similar number of courses as Never-ELs in most subjects. LTELs enroll in significantly fewer advanced courses than Never-ELs. RFEPs take significantly more general and advanced academic courses than Never-ELs. Differences among Newcomers, MTELs, and LTELs are significant. To illustrate these differences, Figure 1 plots the unconditional means for the number of general courses taken and the probability of taking advanced courses for Newcomers, MTELs, and LTELs. However, current EL disadvantages relative to Never-ELs disappear after accounting for eighth grade math and ELA achievement. Across EL subgroups and academic subjects, students who enrolled in the Dual Language program in eighth grade took fewer overall and advanced courses in high school (online Appendix Table A19).

Unconditional course-taking averages by years as EL: (a) total enrollment and (b) probability of ever enrolling in advanced courses.
Tables 2 to 4, Panel A, show the results for cumulative first-time course enrollment by the end of 12th grade for the whole sample, for Chinese users, and for Spanish users. The odd-numbered columns present findings from models that con-trol for demographics and cohort-by-high-school fixed effects. The even-numbered columns additionally control for 8th grade ELA and math test scores.
Math Enrollment by End of 12th Grade
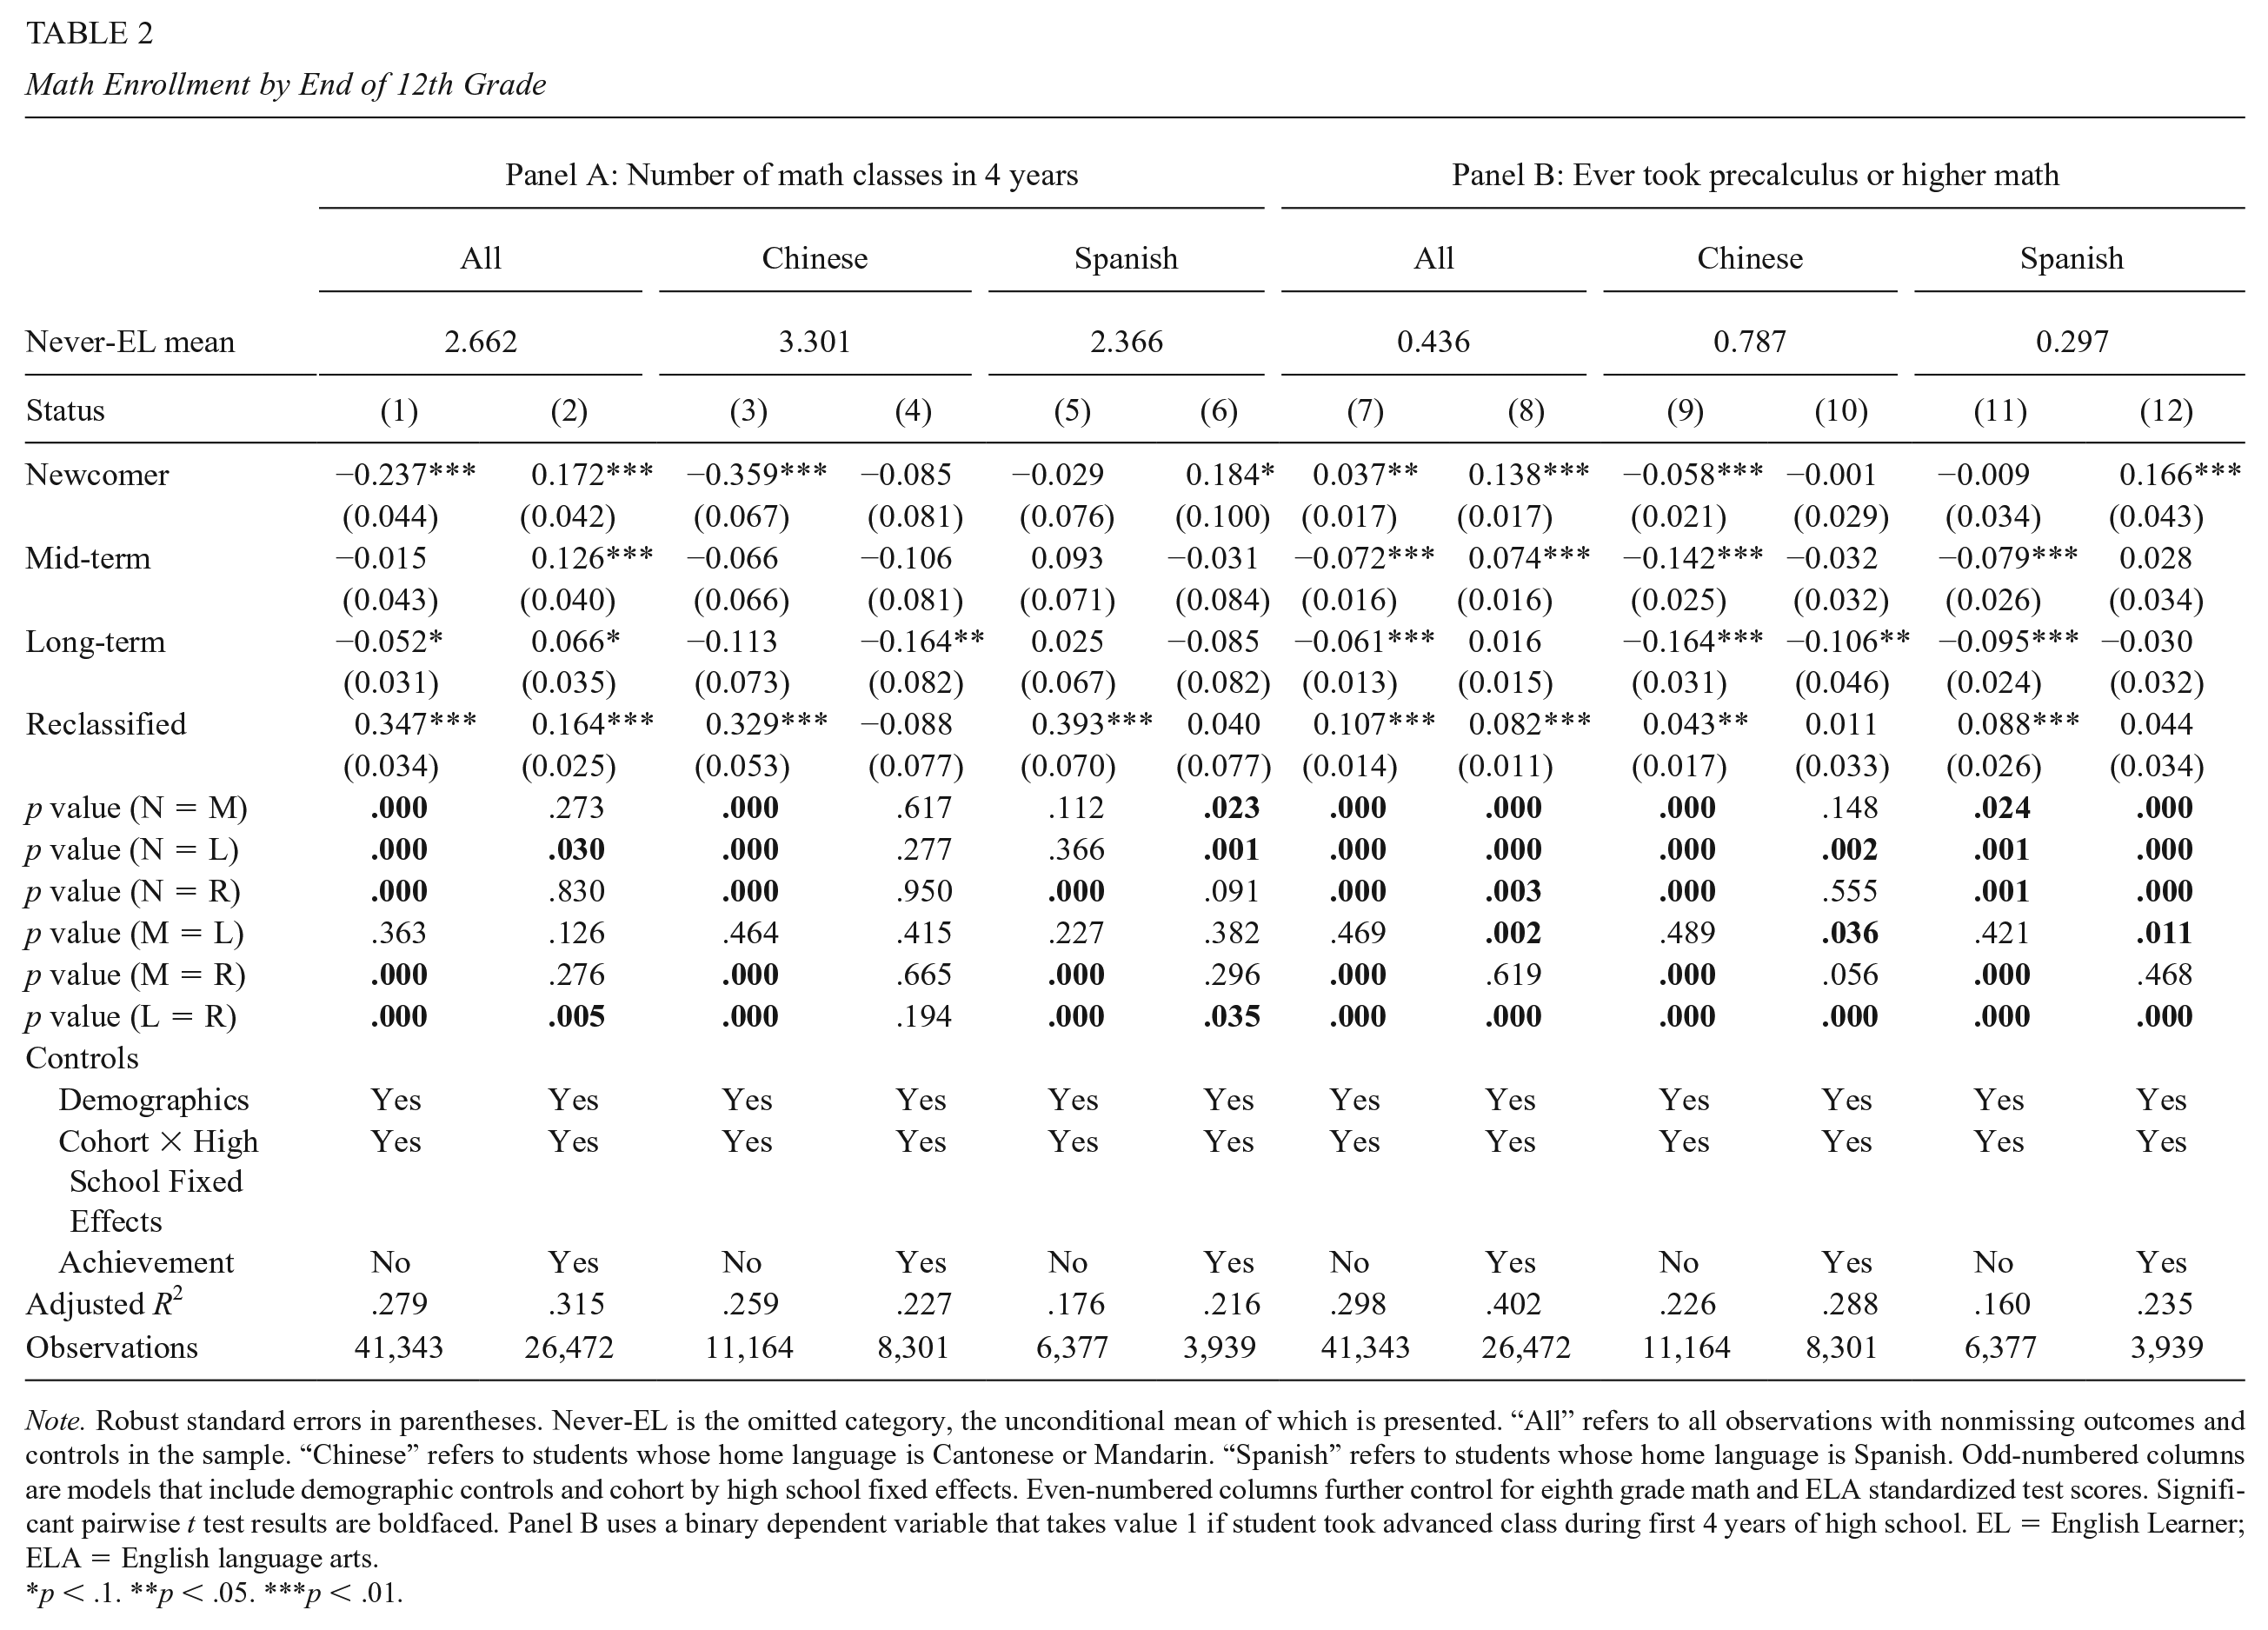
Note. Robust standard errors in parentheses. Never-EL is the omitted category, the unconditional mean of which is presented. “All” refers to all observations with nonmissing outcomes and controls in the sample. “Chinese” refers to students whose home language is Cantonese or Mandarin. “Spanish” refers to students whose home language is Spanish. Odd-numbered columns are models that include demographic controls and cohort by high school fixed effects. Even-numbered columns further control for eighth grade math and ELA standardized test scores. Significant pairwise t test results are boldfaced. Panel B uses a binary dependent variable that takes value 1 if student took advanced class during first 4 years of high school. EL = English Learner; ELA = English language arts.
p < .1. **p < .05. ***p < .01.
When all home language groups are pooled, Newcomers take fewer courses compared with Never-ELs in math, science, and social science while RFEPs enjoy significant advantage (Tables 2–4, Panel A, column 1). This could be partly due to Newcomers’ arriving after ninth grade, which shortens the amount of time they have to take courses. In math, for instance, Newcomers took 0.24 fewer courses and LTELs took 0.05 fewer courses, and RFEPs took 0.35 more than Never-ELs (Table 2, Panel A, column 1). Differences are largely driven by Chinese users (column 3); for Spanish users, gaps are small and mostly nonsignificant (column 5).
However, after further controlling for eighth grade achievement, current EL subgroups took significantly more courses in math, science, and social sciences than Never-ELs. For example, the advantage in science access was 0.17 for Newcomers, 0.13 for MTELs, and 0.18 for LTELs (Table 3, Panel A, column 2). In math and social science, EL subgroups also have significantly more access than Never-ELs when prior test scores are taken into account (Tables 2 and 4, Panel A, column 2). When Chinese and Spanish users are examined separately, differences between the EL subgroups and Never-ELs become nonsignificant (Tables 2–4, Panel A, columns 4 and 6).
Science Enrollment by End of 12th Grade
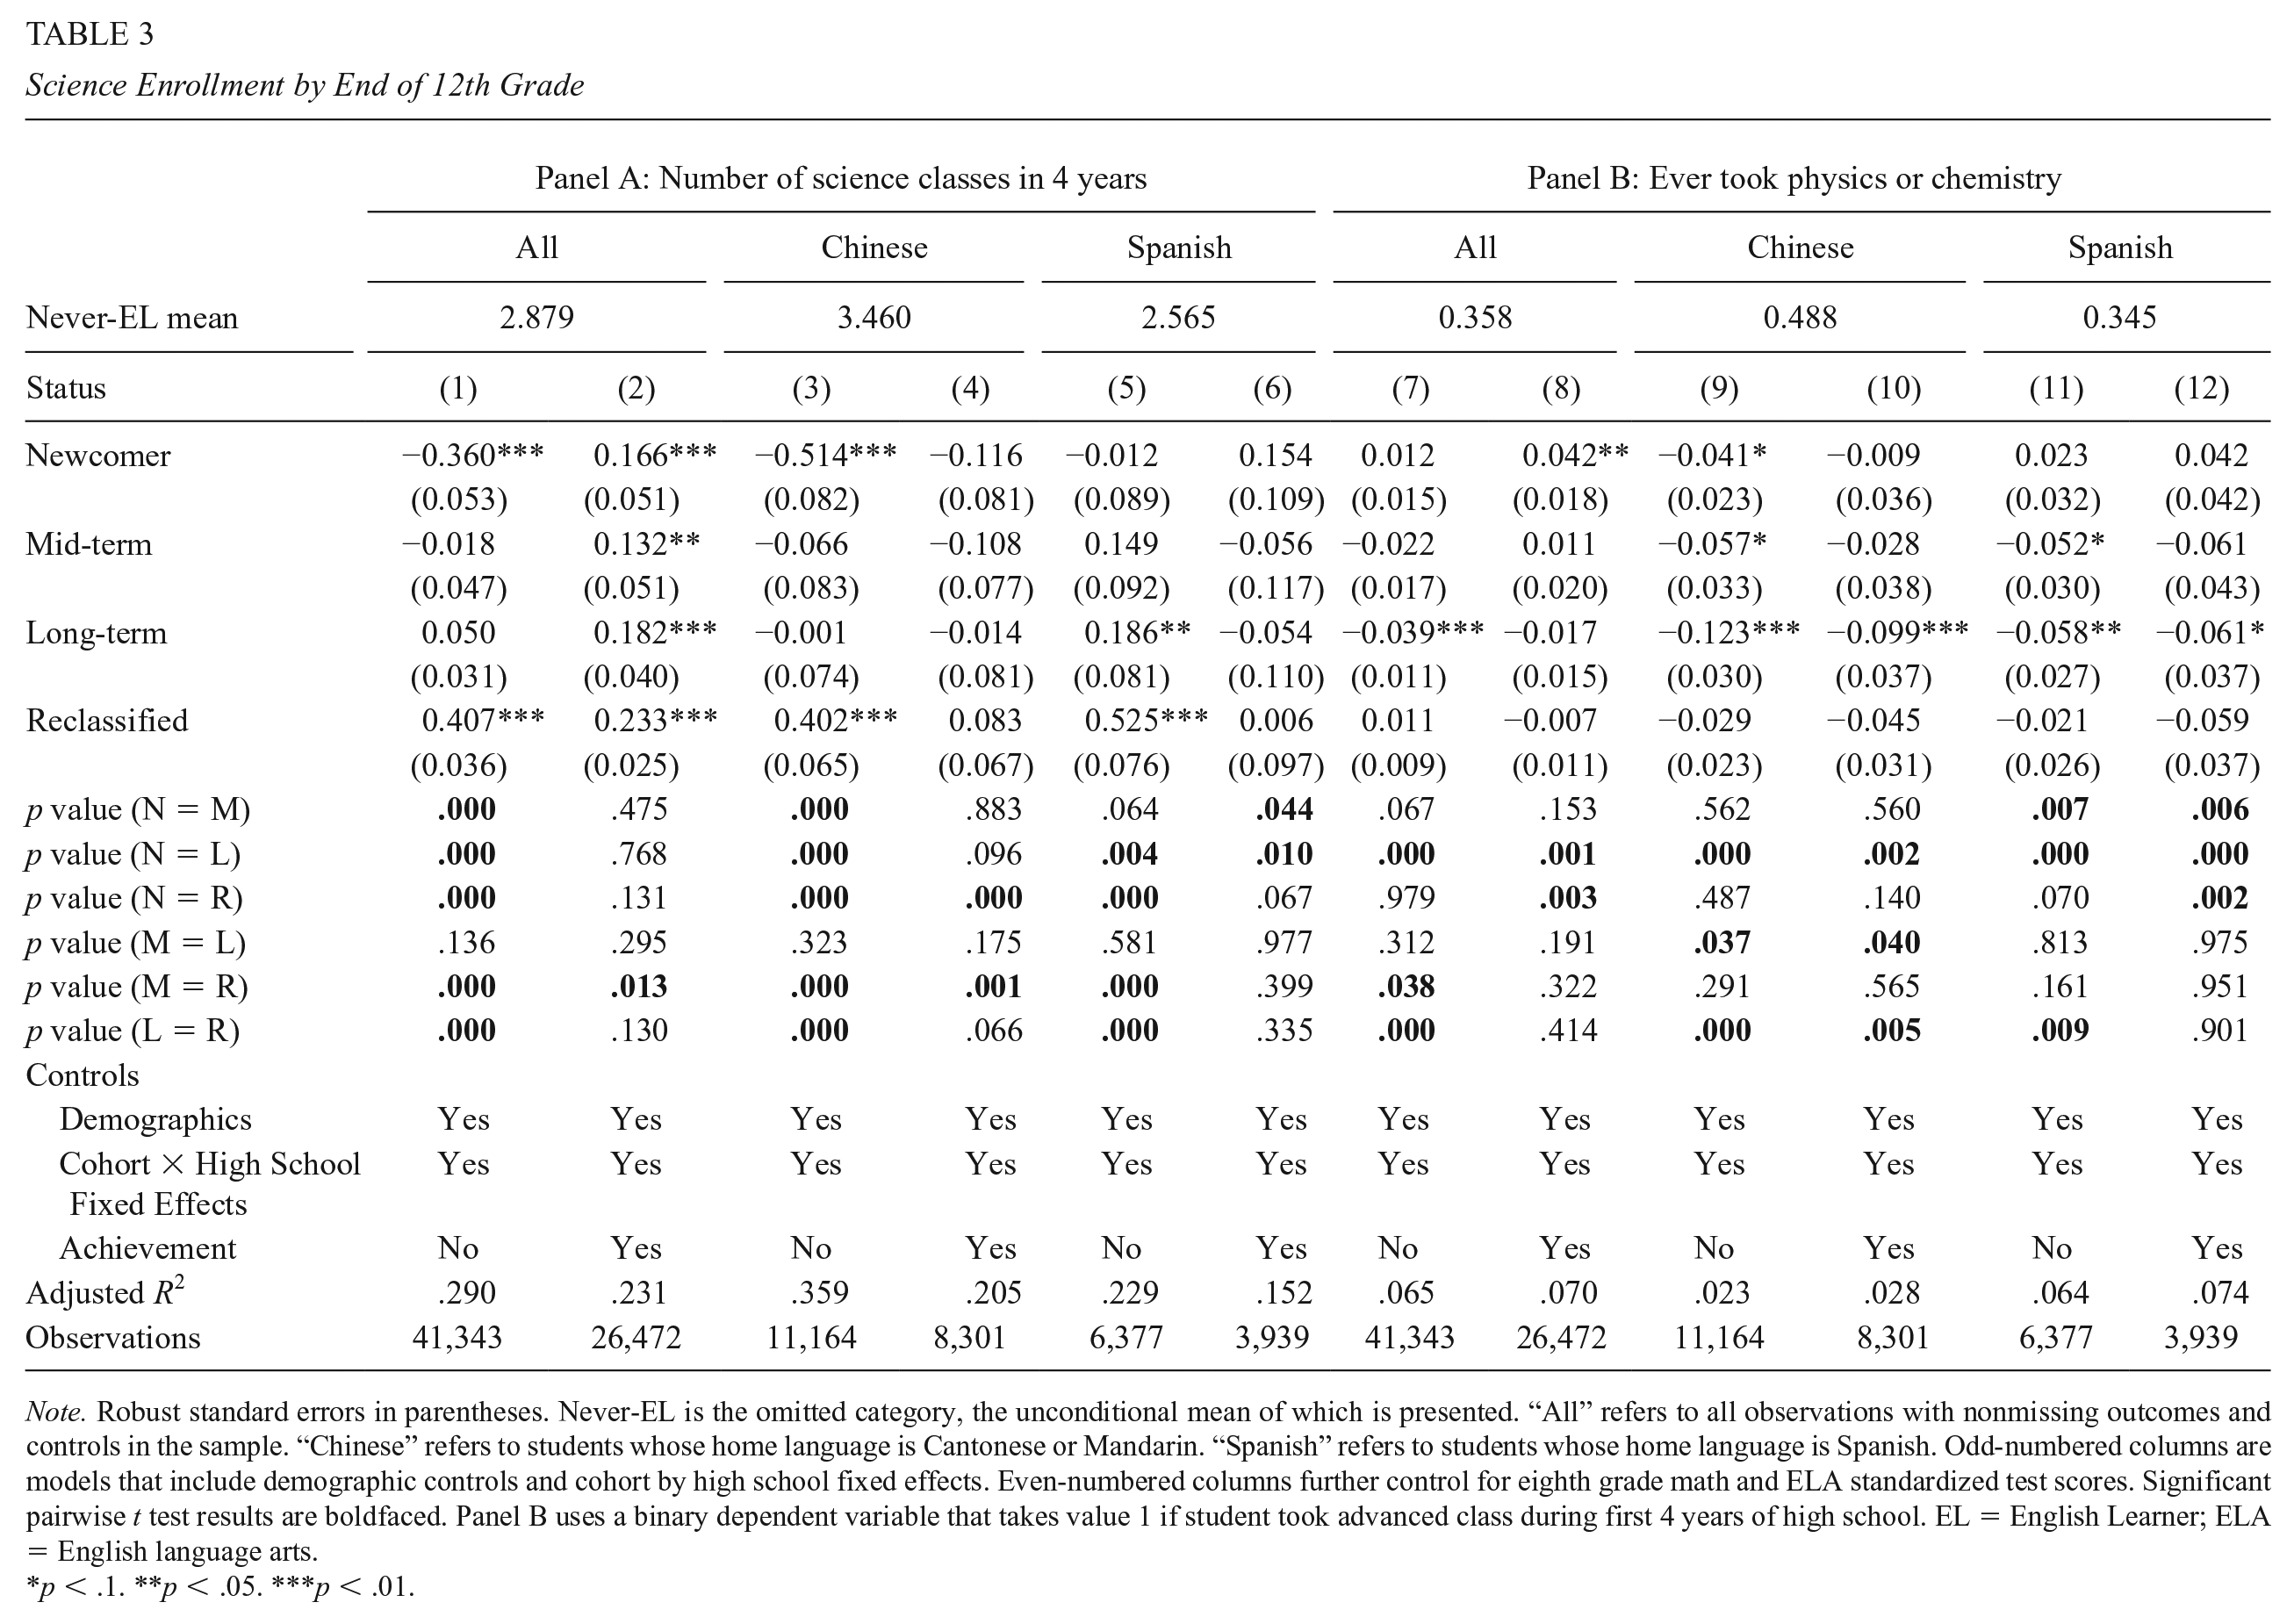
Note. Robust standard errors in parentheses. Never-EL is the omitted category, the unconditional mean of which is presented. “All” refers to all observations with nonmissing outcomes and controls in the sample. “Chinese” refers to students whose home language is Cantonese or Mandarin. “Spanish” refers to students whose home language is Spanish. Odd-numbered columns are models that include demographic controls and cohort by high school fixed effects. Even-numbered columns further control for eighth grade math and ELA standardized test scores. Significant pairwise t test results are boldfaced. Panel B uses a binary dependent variable that takes value 1 if student took advanced class during first 4 years of high school. EL = English Learner; ELA = English language arts.
p < .1. **p < .05. ***p < .01.
Social Science Enrollment by End of 12th Grade
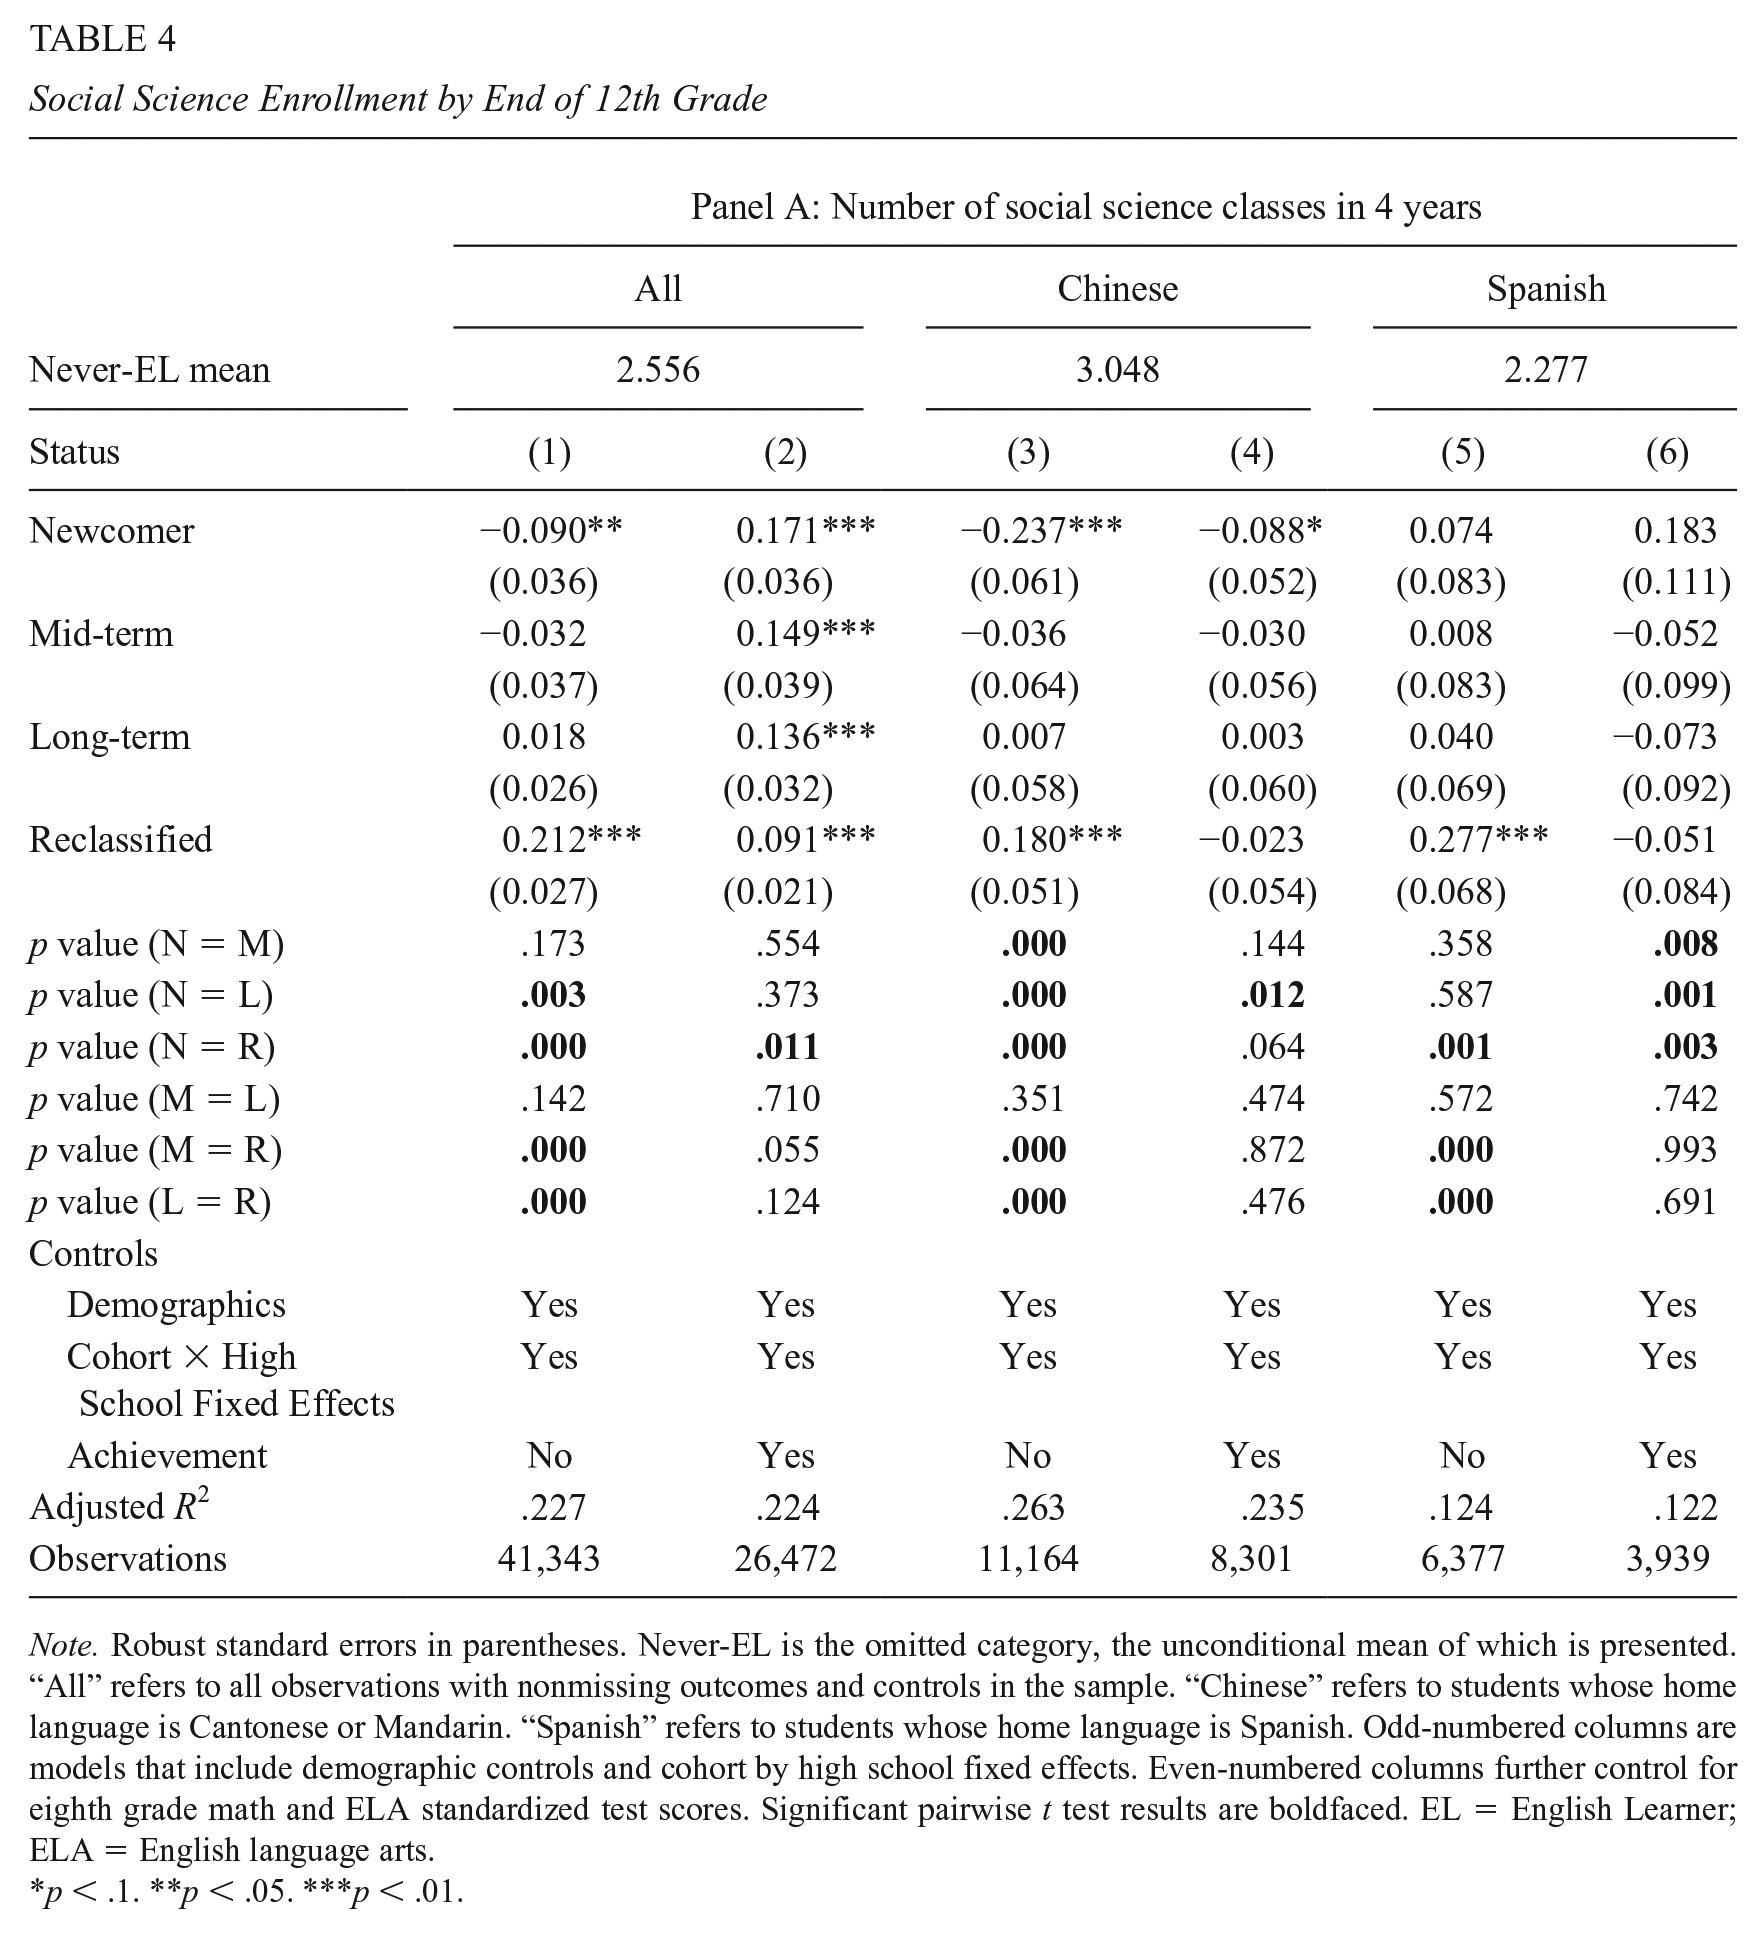
Note. Robust standard errors in parentheses. Never-EL is the omitted category, the unconditional mean of which is presented. “All” refers to all observations with nonmissing outcomes and controls in the sample. “Chinese” refers to students whose home language is Cantonese or Mandarin. “Spanish” refers to students whose home language is Spanish. Odd-numbered columns are models that include demographic controls and cohort by high school fixed effects. Even-numbered columns further control for eighth grade math and ELA standardized test scores. Significant pairwise t test results are boldfaced. EL = English Learner; ELA = English language arts.
p < .1. **p < .05. ***p < .01.
Without controlling for prior achievement, there is substantial variation among the three current EL subgroups in access to all subjects, as shown by the boldfaced p values from F tests of equivalence. Once achievement is taken into account, however, most between-subgroup differences disappear for math, science, and social science.
Enrollment in Advanced Courses
Panel B in Tables 2 and 3 show the results for taking precalculus or higher math and taking physics or chemistry. For advanced math, models that do not control for achievement show substantial MTEL and LTEL disadvantage and RFEP advantage. This applies to the full sample, Chinese users, and Spanish users (Table 2, Panel B, columns 7, 9, 11). Estimates on Newcomers are positive and significant in the full sample but negative for Chinese and Spanish users examined separately. Once controlling for achievement, Newcomers and MTELs have significantly higher probabilities (0.14 and 0.07, respectively) of taking advanced math compared with Never-ELs (Table 2, Panel B, column 8). Differences among these three current EL subgroups are statistically significant. A similar pattern is observed for Newcomers in science (Table 3, Panel B)—controlling for achievement increases the magnitude of the positive significant estimates for the full sample and for Spanish users while decreasing the magnitude of the negative estimates for Chinese users. Estimates on MTELs are not different from zero across all models.
Course Completion
Associations between EL subgroup status and course completion are similar to enrollment (online Appendix Tables A20–A24). RFEPs complete more academic courses than Never-ELs in all subjects across models. Once controlling for achievement, all current EL subgroups complete more math, science, ELA, and social science compared with Never-ELs.
Advanced Placement (AP) and Honors Enrollment
Compared with Never-ELs, the three current EL subgroups enroll in significantly fewer AP and Honors courses while RFEPs take more, but differences for Newcomers disappear after controlling for eighth grade achievement (online Appendix Tables A21–A23). In math, however, even after controlling for achievement, the LTEL disadvantage remains significant. For AP and Honors science, all EL subgroups lag behind Never-ELs in models that do not control for achievement. For AP and Honors social science, disadvantages for all current EL subgroups disappear after controlling for achievement, and there is no difference among the subgroups.
Robustness Checks
I rerun my cumulative analyses using a few restricted samples. Estimates obtained using (a) students with 3 or more years of high school enrollment data and (b) students with complete eighth grade achievement data are similar to the full sample results reported above (see online Appendix Tables A28–A35). Dropping IFEPs from my sample or reassigning ELs into LTELs and Newcomers groups based on alternative definitions also does not introduce substantive changes to the results. These findings are available upon request.
Between-subgroup differences in course completion develop during the first few semesters of high school and widen with time (see online Appendix Figures A1–A5). LTELs fall behind the other subgroups early and never catch up.
There is also considerable variation among Newcomers, MTELs, and LTELs in credit deficit development between 9th and 12th grade. Credit deficit is defined as the difference between actual and expected credit earned by the end of each grade. In total credits, as well as in math, science, and social science, Newcomers accumulate significantly smaller credit deficit compared with Never-ELs at the end of each year. MTELs, a smaller group, perform similarly to Never-ELs. LTELs, however, accumulate larger credit deficits than Never-ELs in all subjects across all years. For every outcome and model, RFEPs have significantly small credit deficits than Never-ELs. But all Ever-EL subgroups accumulate smaller credit deficits than Never-ELs after controlling for 8th grade test scores.
Table 5 shows estimates for the relationship between subgroup status and total credit deficit. Odd-numbered columns show results from regressions that include subgroup status, demographic information, and cohort-by-school fixed effects. Even-numbered columns additionally controls for eighth grade ELA and math achievement scores. Positive estimates signify smaller credit deficit while negative estimate denote larger deficit. By the end of ninth grade, Never-ELs were on average 7.30 credits short of being on track to graduate. This deficit grew by a few credits every year. But the end of 12th grade, Never-ELs were on average 23 credits, or about 10%, short of the graduation requirement. Without controlling for test scores, the newcomer total credit deficit in ninth grade is 1.30 credits smaller than the Never-EL deficit and statistically significant (column 1). After controlling for test scores, the magnitude of the between-group difference more than doubles (columns 2). MTEL and LTEL total credit deficits are larger but not significantly different from Never-EL deficit without controlling for test scores; but with test score control, both MTELs and LTELs have significantly smaller deficits than Never-ELs. RFEPs’ deficit is about 2 credits smaller than Never-ELs’. As students move from 9th to 12th grade, all the between-group differences become larger. By 12th grade, Newcomer and RFEP deficits are 3.95 and 7.26 credits smaller than Never-EL without controlling for prior achievement (column 7). MTEL deficit is 2.33 credits larger than Never-EL and marginally significant (column 7). LTEL deficits grew to 3.32 credits larger than Never-EL (column 7), though once controlling for test scores these differences disappear or turn into EL advantages (column 8).
Cohorts 2009–2016 Off-Track Status (Credit Deficits)
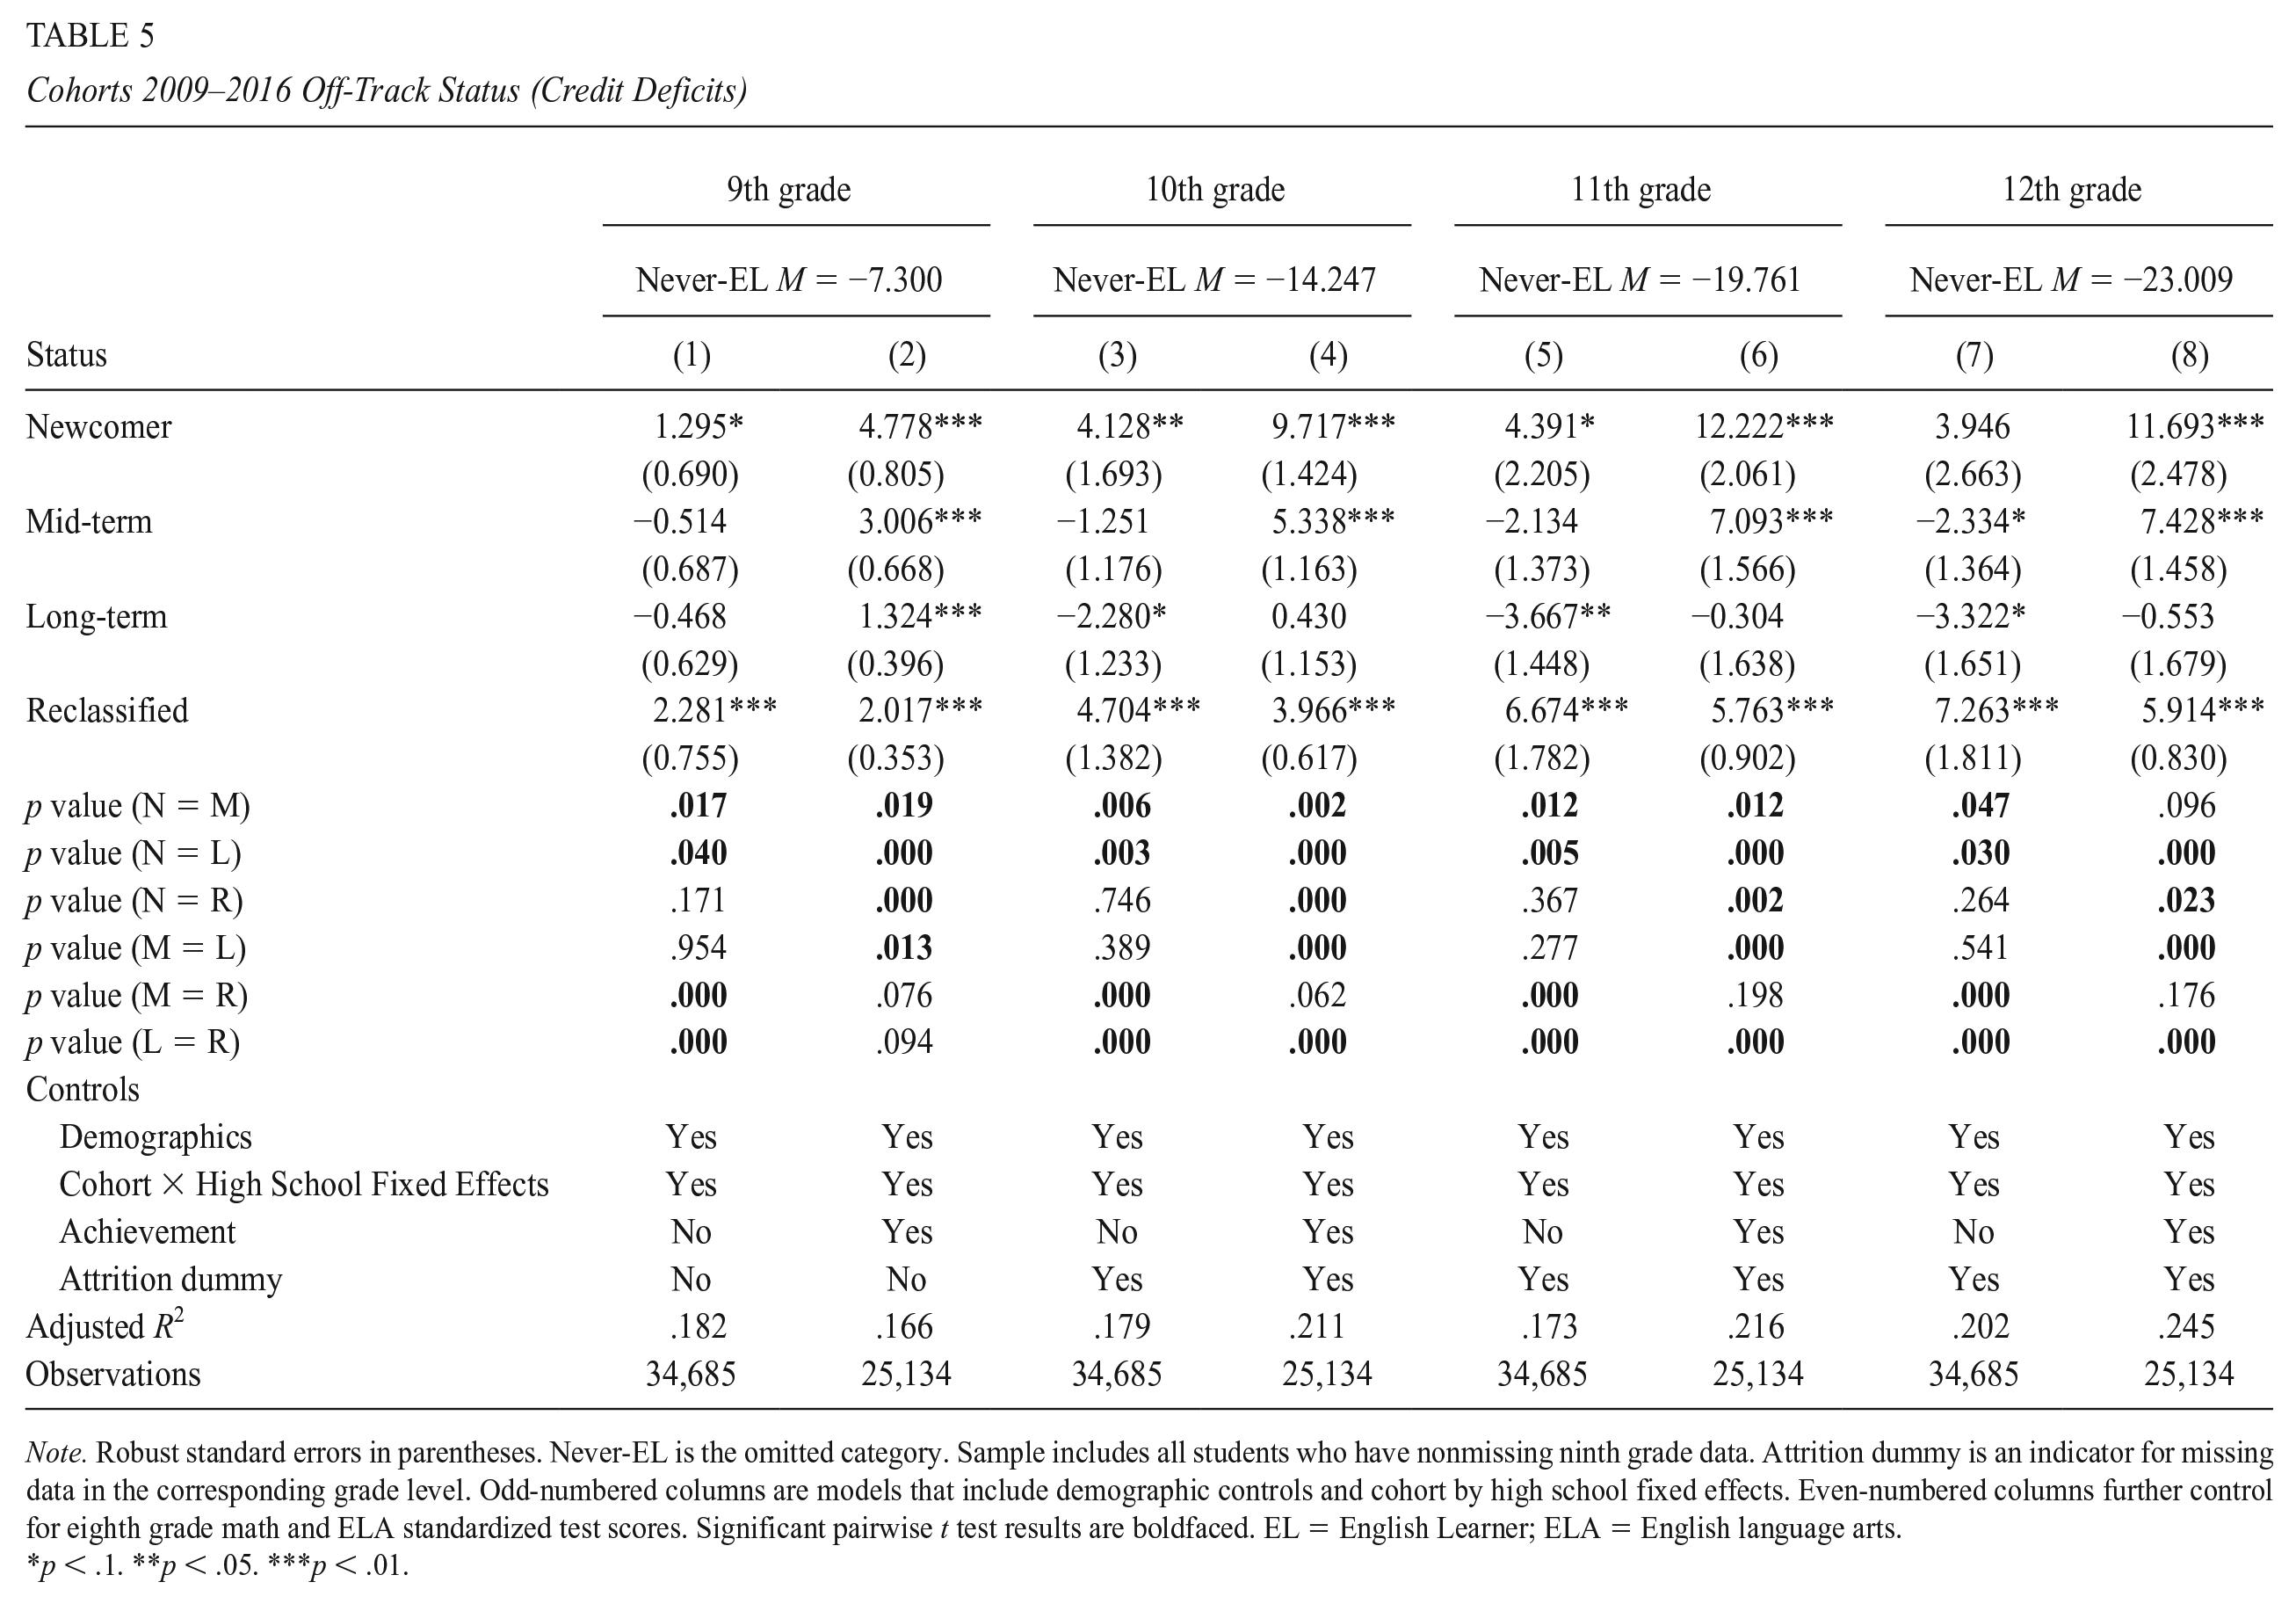
Note. Robust standard errors in parentheses. Never-EL is the omitted category. Sample includes all students who have nonmissing ninth grade data. Attrition dummy is an indicator for missing data in the corresponding grade level. Odd-numbered columns are models that include demographic controls and cohort by high school fixed effects. Even-numbered columns further control for eighth grade math and ELA standardized test scores. Significant pairwise t test results are boldfaced. EL = English Learner; ELA = English language arts.
p < .1. **p < .05. ***p < .01.
Trends by academic subject are very similar to total credit deficit (online Appendix Tables A36–A40). Newcomers start the same as Never-ELs in ninth grade but Newcomer credit advantage grows larger in later years. LTELs face a small credit disadvantage that expands in later years, but differences turn into zeros or LTEL advantages once prior achievement is taken into account. Estimates are robust to restricting the sample to students with eighth grade test scores (results available upon request).
These results from academic progression analyses corroborate findings from the cumulative analyses. Overall, ELs lag behind Never-ELs and RFEPs in enrollment in core subjects, especially in AP and Honors classes, when prior achievement and English proficiency are not taken into consideration. Course access also differs considerably among students who maintained EL status for a longer or shorter amount of time. That is, Newcomers take fewer classes overall but LTELs face more severe disadvantages in terms of advanced courses and credit accumulation. These differences among EL subgroups in course enrollment are consistent with patterns in credit accumulation over time.
Discussion and Conclusion
This study examines course-taking by high school ELs using a large administrative data set from a unique urban district. I report two main findings. First, ELs take fewer math, science, and social science classes than Never-ELs and RFEPs; but differences diminish or turn into EL advantages after controlling for prior academic achievement. Second, considerable heterogeneity in course access and academic progress exists among the three current EL subgroups, especially with respect to access to advanced courses in math and science sequences.
Compared with their high school cohort peers, all three current EL subgroups face considerable disadvantage in accessing math, science, and social science classes. These access gaps are, in large part, due to differences in academic preparation prior to high school. Once controlling for eighth grade math and ELA achievement, ELs enroll in similar numbers of courses in academic subjects as students who exited or never needed English language support. This finding is consistent with that of Conger et al. (2009) and suggests a need to strengthen academic exposure, access, and instruction in Grades K to 8 (Stevenson, Schiller, & Schneider, 1994; Umansky, 2016). However, all students, EL and non-EL, need access to well-supported, rigorous high school courses regardless of eighth grade achievement. Many students, especially certain EL subgroups, are either not getting experience with rich academic content or left to face the challenging materials without adequate support. High schools need to better address the needs of students who arrive with lower levels of English proficiency or content-area preparation.
Tailoring Language Support to Subgroup Needs
As the immigrant student population continues to grow, K–8 schools and districts must confront the task of accurately identifying and then addressing their diverse needs. Informed by longitudinal student performance data, the district in this study is currently restructuring its elementary and middle school language pathways to better match ELs to appropriate services (e.g., expanding Newcomer access to designated Newcomer programs; enrolling seventh grade LTELs in a specifically designed college readiness curriculum). Other local and state education agencies should consider similar efforts toward data-driven reforms to focus on subgroups of ELs. To support EL program and policy development, more empirical research is needed. Recently, government agencies have been publishing reports and guidelines that highlight the academic experiences and outcomes of Newcomers (e.g., Baker et al., 2014; U.S. DoE, 2016). This kind of attention to a specific EL subgroup is encouraging. What we need is more robust evidence, derived from disaggregated data, on the current state of access and outcomes and potential interventions for LTELs, SIFE, ELs with speech or learning disabilities, and other underserved subgroups.
Prior research shows that the effects of K–8 language program models on the outcomes of students who enter as ELs in kindergarten differ based on home language and academic subject, as well as between short-term and long-term effects (e.g., Slavin, Madden, Calderon, Chamberlain, & Hennessy, 2011; Valentino & Reardon, 2015). There is no single approach to language service that maximizes performance in all academic subjects for all EL students, even within cohorts that enter in kindergarten and advance through the grades together in the same district. Newcomers and SIFE add yet more complexity to the demand for programming.
This study finds eighth grade language program to have a significant association with EL subgroups’ access to courses in high school. The results are descriptive and should be interpreted with consideration for student selection into programs. However, the negative association between participation in Dual Language and high school outcomes does point to the need to interrogate program alignment to the needs of the participants. A growing body of research shows that Dual Language Immersion designed to service ELs can improve reading achievement and the probability of being reclassified before eighth grade (e.g., Steele et al., 2017). But not all Dual Language Immersion programs are created equal. In the context of this district, the majority of Dual Language Immersion students are native users of English learning a world language. According to district leaders, teachers had difficulty differentiating instruction for the few ELs in each class. This example goes to illustrate that more than program type, the details of program design and implementation matter to ELs’ subsequent academic outcomes.
Expanding Access to Academic Content
In addition to appropriate language support, schools and districts also need to provide ELs with exposure to rich academic content in Grades K to 8. This requires addressing both exclusionary and leveled tracking (Umansky, 2016). A first step would be to prioritize the inclusion of math, science, and social science content in the EL curriculum, guarding against policies and practices that would preclude ELs from enrolling in content courses. Schools must also ensure that sheltered instruction provides language support without “watering down” the academic material (Olsen, 2014). To be ready for a college-preparatory curriculum in high school, ELs need to leave eighth grade with critical analysis skills and disciplinary literacies that can only be developed through high quality classroom discourse.
For Newcomers, the quality of course-taking is not significantly different from Never-ELs, but the quantity is. More time to take content courses in the form of extended school days or summer learning would address this problem. For LTELs, the challenge is with both credit completion and course quality. Even when special education status is taken into consideration, LTELs are still falling further behind every year in terms of credit completion. This suggests that programs and policies at the high school level are not only maintaining but also exacerbating the differences students arrive with in ninth grade. To address this troubling trend, aggressive interventions that would support credit recovery and academic progress are desperately needed. Early intervention such as summer bridge programs could be implemented to accelerate credit earning and help LTELs transition to high school. Academic and social support can be embedded into students’ schedules by leveraging college and career readiness programs designed for ELs or by extending the school day.
Accountability
Provisions under ESSA (2015) offer new opportunities for building more equitable education access for ELs. Schools are required to disaggregate and report the outcomes of EL subgroups, such as the achievement of ELs with disabilities and the number of ELs who continue to receive service after 5 years. Given the considerable heterogeneity by subgroup in this study, the step toward disaggregating data and focusing on subgroup needs is promising. Likewise, separate reporting of Ever-EL achievement and current EL English proficiency will help educators identify the needs of immigrant students more precisely than before. More detailed tracking and reporting of immigrant students’ academic outcomes and prior schooling experiences would also assist educators and policymakers to design programs and policy that accommodate the needs of individual students. For example, states might consider requiring schools to report the number of SIFE and disaggregating EL SIFEs’ outcomes from other ELs’.
Moreover, individual states now have more flexibility to create and use accountability measures to better serve ELs. For instance, California’s Assembly Bill 2735, approved in 2018, formally prohibits middle and high schools from denying students participation in the schools’ standard instructional programs or advanced courses solely based on EL classification (California Legislative Information, 2018). Given the limitations of standardized test scores (e.g., confounding subject-matter competency with English proficiency), states should consider using other measures that more fully reflect student access. For example, some states now use on-track-to-graduate indicators as part of their ESSA accountability system. On-track status in 9th to 11th grade can give researchers and administrators useful information that standardized test scores and grade point averages do not capture (e.g., Allensworth & Easton, 2007). States and districts vary in their calculation of on-track status. Most capture course grades (e.g., University of Chicago Consortium on Chicago School Research); research also recommends incorporating student attendance and behavior, which are proxies for engagement (Balfanz & Fox, 2011). In the context of the district in this study, the on-track indicator measures the extent to which students have completed the expected number of academic content course credits at the end of each year. As the high school graduation requirements are aligned with entrance requirements to public 4-year universities in the state, the on-track indicator reflects not only a students’ potential to finish high school but also her college readiness. As an accountability measure, the on-track indicator ought to signal not only the quantity but also the quality of academic content to which students are exposed, as it does in this district. States should make sure that districts and schools are not lowering standards to inflate the number of ELs who are on-track to graduate, and that ELs are completing rigorous academic courses that prepare them for college and career.
Local Contexts and Generalizability
The sample in this study is unique in the demographic composition of its EL students. The findings for the full sample are thus unlikely to be generalizable to the national or state population. However, supplemented with additional analyses for Chinese and Spanish users, this study provides valuable information about EL academic access and highlights the informative power of comprehensive, longitudinal EL data.
The State of California has had a long history of serving a large, diverse EL population. Even among California districts, the district in this study is exceptional in its continual dedication of substantial resources toward specialized and innovative EL curricula. New Destination states and local contexts that serve a smaller percentage of ELs are likely to have less experience and resources for tailored support services. Gaps reported in this study can thus be interpreted as lower bounds for contrasts between native English users and ELs on a national scale. Other state and local contexts that serve fewer ELs or a different demographic composition might address EL academic access and achievement through collaborative efforts that draw on local and external resources. For example, a smaller district might partner with college and career readiness programs to provide intensive tutoring and college planning, or work with local community colleges to design and implement an EL credit recovery program. States and districts with a critical mass of Ever-ELs from the same linguistic background might also consider establishing peer-mentoring programs that match RFEPs with current ELs for academic and social support.
Access to students’ U.S. entry and EL classification dates allowed me to disaggregate current ELs by years spent as EL. However, I was not able to examine the effects of consistency of schooling prior to U.S. entry, family income, neighborhood segregation, and other unobserved factors that are likely to contribute to the heterogeneity within each years-as-EL subgroup. To generate more rich, informative research findings, accurate, consistent, and comparable measures on EL academic progress and achievement need to be collected and maintained at the local, state, and national levels. Presently, most federal and state data initiatives distinguish students only by Limited English Proficient (or current EL) status; very few sources disaggregate EL data by years as EL, home language, prior schooling experience, type of language service in the corresponding academic year, or other factors relevant to EL academic development. Tracking the achievement of subgroups of Ever-ELs would greatly improve our understanding of their academic trajectories. I hope this article will catalyze better EL data collection and, ultimately, more useful research on academic access and equity.
Supplemental Material
DS_10.3102_0162373719867087 – Supplemental material for A Matter of Time: Variations in High School Course-Taking by Years-as-EL Subgroup
Supplemental material, DS_10.3102_0162373719867087 for A Matter of Time: Variations in High School Course-Taking by Years-as-EL Subgroup by Angela Johnson in Educational Evaluation and Policy Analysis
Footnotes
Acknowledgements
I am grateful for helpful comments from Eric Bettinger, Rebecca Callahan, Tom Dee, Peggy Estrada, Claude Goldenberg, Susanna Loeb, and two anonymous reviewers.
Declaration of Conflicting Interests
The author(s) declared no potential conflicts of interest with respect to the research, authorship, and/or publication of this article.
Funding
The author(s) disclosed receipt of the following financial support for the research, authorship, and/or publication of this article: The author thanks the Stanford E. K. Potter Fellowship for supporting this research. All views expressed in this article are the author’s and do not represent Stanford University or NWEA.

Notes
Author
References
Supplementary Material
Please find the following supplemental material available below.
For Open Access articles published under a Creative Commons License, all supplemental material carries the same license as the article it is associated with.
For non-Open Access articles published, all supplemental material carries a non-exclusive license, and permission requests for re-use of supplemental material or any part of supplemental material shall be sent directly to the copyright owner as specified in the copyright notice associated with the article.
