



Abstract
This study is a randomized control trial of full- versus half-day prekindergarten (pre-K) in a school district near Denver, Colorado. Four-year-old children were randomly assigned an offer of half-day (4 days/week) or full-day (5 days/week) pre-K that increased class time by 600 hours. The full-day pre-K offer produced substantial, positive effects on children’s receptive vocabulary skills (0.275 standard deviations) by the end of pre-K. Among children enrolled in district schools, full-day participants also outperformed their peers on teacher-reported measures of cognition, literacy, math, physical, and socioemotional development. At kindergarten entry, children offered full day still outperformed peers on a widely used measure of basic literacy. The study provides the first rigorous evidence on the impact of full-day preschool on children’s school readiness skills.
Introduction
Despite strong evidence that early investments can create large and lasting benefits for children, research tracking the impacts of large-scale, present-day ECE programs has yielded mixed results. Recent reviews of the literature indicate that children who attend public preschool in the year prior to kindergarten start school significantly ahead of their peers (Weiland, 2018). However, a growing body of research also suggests that the initial benefits on children’s academic skills may be short-lived, dissipating quickly as children progress through school (Philips et al., 2017).
These findings have led to heightened interest among policymakers and researchers in identifying specific program characteristics that promote returns on early childhood investments. In a recent consensus statement, a group of early childhood experts stressed the need to understand how preschool can serve as “an enduring base for future learning” and emphasized a need to unpack the particular features of preschool programs that contribute to children’s development (Philips et al., 2017). Traditionally, policymakers and researchers have focused on “structural” characteristics of ECE settings such as the qualifications of educators, the class size, and the staff–child ratios. More recently, there also has been substantial interest in process-oriented features of ECE, such as quality teacher–child interactions, effective curricula, and access to professional development. Despite a growing literature on the role of these quality features, our understanding of the causal relationship between specific ECE features and child outcomes remains underdeveloped with little consensus on the features—or the combination of features—that are most critical for promoting children’s development.
One salient characteristic—program intensity, or hours of exposure—has garnered considerable attention as a potentially important policy lever for supporting children’s early learning. Between 1998 and 2010, the percentage of kindergarteners in the United States in full-day kindergarten grew rapidly from 55% to 80% (Bassok, Gibbs, & Latham, 2018). The percentage of preschoolers in full-day preschool also increased, albeit more slowly. In 2000, 47% of young children attended full-day programs. By 2016, that figure rose to 54% (Kena et al., 2016). Increasingly, policymakers are exploring strategies to lengthen the school day in public preschool programs. For instance, the Office of Head Start proposed a new performance standard in 2015 that aimed to raise Head Start’s operating hours from 448 hours a year to at least 1,020 hours per year (Head Start Performance Standards, 2016).
Efforts to increase children’s hours of exposure in ECE settings have been motivated, in part, by the hypothesis that expanding the length of the school day will provide children with more exposure to high-quality learning opportunities, which, in turn, will yield greater and longer lasting benefits. Full-day preschool programs might also attract new families who would otherwise not enroll their children in classroom-based ECE programs because their work or school schedules conflict with part-day programs.
Currently, there is little empirical evidence about the extent to which access to full-day versus half-day preschool yields large benefits, an important gap in the ECE literature given the relative cost of expanding the length of the preschool day. Full-day preschool expansion is expensive and has the potential to divert funds away from other ECE resources that may be more impactful in promoting children’s development.
This study presents results from a randomized control trial (RCT) of full- versus half-day prekindergarten (pre-K) in a school system near Denver, Colorado. To our knowledge, this is the first rigorous RCT about the benefits of full-day, full-week preschool on children’s school readiness skills. We find that, relative to an offer to attend half-day preschool, full-day preschool produces substantively meaningful, positive effects on children’s receptive vocabulary skills (0.267 SDs) in the spring of their preschool year. Among those children enrolled in the public preschool program, full-day preschool also yields positive effects on teacher-reported measures of children’s cognition, literacy, math, and physical development. Finally, our findings suggest that positive impacts are still evident as children start their kindergarten year. Combined, these short-term effects suggest full-day preschool programs had a meaningful impact on children’s school readiness skills and suggest the promise for longer term impacts.
Section “Background” provides background about the potential benefits of intensifying children’s exposure to ECE; section “Study Context” describes the context for the current study; section “Method” describes the study design, measures, and analysis models; section “Results” presents the impacts of full-day pre-K on children’s outcomes at the end of pre-K as well as the beginning of kindergarten. We conclude by offering recommendations for policymakers, and areas for future work.
Background
ECE programs vary substantially with respect to structural features (e.g., teacher education levels, ratios), process features (e.g., the quality of teacher–child interactions), and importantly, their contributions to children’s learning (Bassok, Fitzpatrick, Greenberg, & Loeb, 2016; Morris et al., 2018; Weiland, 2018). Improving ECE at scale requires a better understanding of which particular features are most important for program effectiveness. Toward this goal, a growing body of research has examined the effect of specific program characteristics. For instance, recent RCTs have examined the effects of professional development for ECE teachers, as well as the impacts of specific curricula and teacher–child interactions (Araujo, Carneiro, Cruz-Aguayo, & Schady, 2016; Clements & Sarama, 2008; Early, Maxwell, Ponder, & Pan, 2017; Piasta et al., 2017). However, relatively few studies in ECE have used experimental methods to examine how structural features of ECE programs, which are the primary drivers of programs’ costs, affect children’s development. For example, there are no experimental studies measuring the impact of teacher education levels, teacher pay, or teacher–child ratios on children’s learning in ECE settings. Similarly, few studies have provided rigorous causal evidence on the link between children’s learning and the intensity of an ECE program, defined broadly to encompass both the number of years children attend a program and the number of hours they are enrolled per week.
The Role of Intensity in Preschool Classrooms
The intensity of ECE experiences may affect child outcomes in a number of ways. Most directly, if ECE programs provide more engaging and stimulating environments for children than they would otherwise experience, additional time spent in those programs may foster greater benefits. However, there may be diminishing returns to time spent in ECE settings, and too much time in those settings may actually have negative impacts.
In addition to the stimulation and learning opportunities that ECE programs may provide, these programs also play an important role caring for young children and ensuring their safety while their parents work or attend school. ECE programs with longer hours may better align with parents’ work schedules and, thus, reduce the number of ECE settings and transitions a child experiences regularly. This heightened stability may be beneficial for young children, as navigating multiple ECE arrangements is linked to more behavioral problems and greater rates of communicable illnesses (Morrissey, 2009, 2013; Pilarz & Hill, 2014).
Beyond the direct impact of ECE experiences for young children’s learning, publicly funded ECE programs may also benefit families. A large body of research has documented, for instance, that reductions in the cost of childcare affect maternal employment (Bauernschuster & Schlotter, 2015; Cascio, 2009; Herbst, 2017; Malik, 2018). In addition, several studies show that the parents of children enrolled in Head Start, the largest federally funded preschool program, engage more with their children (Bauer & Schanzenbach, 2016; Gelber & Isen, 2013) and attain higher levels of educational attainment (Sabol & Chase-Lansdale, 2015). In turn, these changes in parental employment, education, and parenting practices may benefit young children’s development.
Although existing research has focused on the impacts of ECE access and participation broadly defined, access to more intensive ECE programs could, theoretically, be particularly beneficial for families, especially if these more intensive programs are free or low cost. By providing greater childcare coverage, full-day, publicly funded ECE programs may save families’ money, allow families to secure more stable employment with higher wages, and/or reduce stress. All of these changes are hypothesized to lead to benefits for young children.
Existing Evidence on Preschool Intensity
Despite the strong theoretical case for investing in more intensive ECE programs, the empirical evidence is limited. The most effective and rigorously evaluated ECE programs provided intensive interventions for children and their families. For instance, the Carolina Abecedarian Project, one of the most touted ECE programs for its sizable impacts into adulthood, offered full-day preschool, 5 days a week, from infancy to age 5 and has been linked to positive outcomes through age 30 (Campbell et al., 2012; Campbell & Ramey, 1994). However, it is not clear whether these findings were caused by the relatively intense exposure or whether they could be explained by other features of the Abecedarian program. For example, from infancy, Abecedarian children were exposed to rich learning environments with trained child development specialists and health and medical professionals, whereas children in the Abecedarian control condition stayed home, without access to similar care environments. The existing literature fails to isolate the unique contribution of intensive exposure.
Unfortunately, there is only a small body of literature examining the impact of preschool intensity on children’s development. Only one existing study is experimental, and it is unpublished (Robin, Frede, & Barnett, 2006). That study included 294 four-year-old children drawn from an urban school district serving mostly low-income families who were randomly assigned to full (N = 77) or half day (N = 217) classes. The half-day program consisted of 2.5- to 3-hour classes for 41 weeks; the full-day program consisted of 8-hour classes for 45 weeks. At kindergarten, full-day program children scored significantly higher on cognitive assessments compared with those in the half-day program and continued to outperform the comparison group at first grade. However, the full-day preschool group was more advantaged at baseline compared with their half-day counterparts, limiting the interpretability of the RCT results. For example, full-day children scored significantly higher on multiple preintervention assessments and their mothers worked more hours per week. Given the lack of baseline equivalence, the results from this study should be interpreted with caution.
All other studies exploring the link between preschool intensity and child outcomes rely on nonexperimental methods and may not fully account for the nonrandom sorting of children into more intensive ECE programs (Herry, Maltais, & Thompson, 2007). For instance, Reynolds et al. (2014) compared outcomes of children who attended full- and half-day programs within the same school, and they found that children in full day have better attendance and scored higher on four of the six school readiness indicators, including language, math, social-emotional development, and physical health. However, the authors caution that their results may be biased because the full-day program prioritized enrollment for 4-year-olds, so children in the half- and full-day programs were not equivalent with respect to age at baseline. Similarly, Gormley, Gayer, Phillips, and Dawson (2005) show that Latinx children enrolled in full-day pre-K in Tulsa benefit more than those enrolled in half-day programs. However, they cannot disentangle whether this is because the full-day program is more effective or because of the nonrandom sorting of certain children and families into that program.
Overall, the findings from these correlational studies are mixed. Whereas some studies find that the association between ECE participation and child outcomes is more pronounced for children who spend more hours in preschool per week (Loeb, Bridges, Bassok, Fuller, & Rumberger, 2007), others indicate that children who spend more hours in center-based childcare exhibited somewhat higher incidences of behavioral problems (Belsky, 2002; Vandell, Belsky, Burchinal, Steinberg, & Vandergrift, 2010).
Findings from the Federal Head Start program also yield mixed results. Using propensity scores and 2016 Family and Child Experiences Survey (FACES) data, Leow and Wen (2017) find no benefits of full-day classes on five academic and social outcomes in kindergarten. In contrast, in his reanalysis of data from the Head Start Impact Study, Walters (2015) found that Head Start centers offering full-day services produced larger impacts on children’s cognitive outcomes compared with centers providing only part-day programming. Notably, however, this result may have been due to the offer of full-day services or other unobserved program features related to full-day programming.
Finally, in a related set of studies, researchers have examined ECE intensity by comparing the benefits of participating in 1 versus 2 years of preschool. Using observational approaches, such as propensity score matching, researchers found that, relative to children with 1 year of preschool, those with 2 years showed improved performance both at school entry, and as they progressed through the early elementary grades (Leow & Wen, 2017; Shah et al., 2017; Wen, Leow, Hahs-Vaughn, Korfmacher, & Marcus, 2012).
Taken together, these set of studies provide mixed evidence about the impact of more intensive exposure to ECE programs, and they are limited by concerns about nonrandom selection into more intensive preschool programs.
Lessons From the K–12 Context
Although the research base on the impacts of ECE intensity is underdeveloped, related research from the K–12 context does provide support for the hypothesis that more intensive preschool programs may benefit children. For instance, a number of quasi-experiments indicate that lengthening the school day leads to increases in children’s academic outcomes (Battistin & Meroni, 2016; Bellei, 2009; Figlio, Holden, & Ozek, 2018). There is also a large body of research comparing outcomes for children enrolled in full- versus half-day kindergarten. The rapid expansion of full-day kindergarten in recent years has fostered heightened interest among policymakers and researchers in understanding how children are affected by the longer school day. Given the age proximity of kindergartners and preschoolers, this line of research may be particularly relevant.
Unfortunately, here, too, the causal evidence is limited. Only one study uses random assignment to identify the impact of offering full- versus half-day kindergarten on children’s outcomes. Gibbs (2014) studied full-day kindergarten programs in Indiana, where lotteries were used to allocate oversubscribed full-day slots. Comparing children within the same school, she found that children randomly assigned to full- rather than half-day kindergarten scored 0.31 SDs higher on a literacy assessment by the end of the kindergarten year.
To date, nearly all other studies tackling this question have relied on observational data, comparing children who attended full-day programs with those who attended half-day programs after accounting, to the extent possible, for selection factors at the child, family, school, or community level (Brownell et al., 2015; Gullo, 2000; Zvoch, Reynolds, & Parker, 2008). In general, these studies suggest positive but fleeting associations between full-day kindergarten participation and child outcomes. A meta-analysis of 40 studies of full-day kindergarten released between 1979 and 2009, for example, indicated that at the end of kindergarten, children who attended full-day kindergarten scored about a quarter of standard deviation higher than similar children in half-day programs, but that as children progressed through the elementary school years, these differences between groups disappeared (Cooper, Allen, Patall, & Dent, 2010).
Taken together, the K–12 literature does provide suggestive evidence that longer school days positively affect children, at least in the short term. It is not clear, however, whether results from the kindergarten context generalize to preschool, as ECE programs serve younger children with unique developmental needs. Classroom practices, routines, and curricula differ between ECE and kindergarten classrooms, and the teachers guiding children’s learning oftentimes differ substantially across these contexts with respect to their education, training, and compensation (Abry, Latham, Bassok, & LoCasale-Crouch, 2015; Whitebook, Phillips, & Howes, 2014).
Current Study
The goal of the current study is to provide rigorous evidence about the effects of one important and manipulable aspect of children’s ECE experiences—program intensity. More intensive preschool programs are hypothesized to benefit young children both directly through increased exposure to a stimulating environment and indirectly through benefits for children’s family. However, rigorous empirical evidence on these benefits is lacking, a major gap given the cost of funding expanded programs. The existing research base on full-day preschool is small and suffers from methodological limitations. Although there is a relatively larger literature on the closely related question of full-day kindergarten, the causal evidence in this area is limited too, and findings from that context may not generalize to younger children. Our study adds to the existing literature by providing new experimental evidence about the impacts of full-day preschool on a host of short-term outcomes in a low-income, largely Latino population.
Study Context
Westminster Public Schools (WPS) is a public-school district located northwest of Denver that serves approximately 10,000 students annually. The district serves a population of students who are largely non-White (83%), low income (76%), and nonnative English speaking (34%). Although WPS is smaller than Denver, the percentage of students who are Latinx is larger (72% vs. 59% in Denver Public Schools [DPS]) and the percent free/reduced-price lunch (FRPL) eligible is about the same (68% vs. 64% in Denver). In recent years, WPS has struggled to overcome the systemic socioeconomic barriers that inhibit the performance of these students. Although about 50% of WPS students perform at or above proficiency on statewide exams, there are large disparities in academic achievement between groups. For instance, although virtually 100% of WPS’ fully English-fluent students are “proficient” in Grade 3 math scores, only about 15% of its not–English-proficient (NEP) students achieve proficiency status (WPS TCAP Results, 2014).
WPS leaders viewed ECE programs as one promising tool for addressing their students’ needs. To intensify its ECE offerings, WPS used a pay-for-success funding model and secured funding to expand its pre-K program from half-day only to also include full-day classes among 4-year-old children. Prior to the 2016–2017 school year, WPS provided only half-day preschool for 3 hours per day, 4 days per week. However, only about half of the district’s eligible 1,100 4-year old children actually enrolled in the district pre-K program, leading district leaders to consider how to serve more Westminster families (Interview With Early Childhood Department Leadership, 2016). WPS hypothesized that many district families did not take advantage of WPS pre-K services due to the half-day and partial week program availability, which may have conflicted with family’s childcare needs. In the summer of 2016, WPS launched the Full-Day Pre-K Program (“FDPK”) for the 2016–2017 school year. Because the district anticipated oversubscription 1 in its full-day classes, it held lotteries to award families with FDPK slots. Families who did not receive slots in the full-day program were offered enrollment in the business-as-usual half-day program.
To assess the efficacy of FDPK on student and family outcomes, WPS committed to a rigorous evaluation of its initiative. WPS worked with the research team to randomly assign offers of full- and half-day pre-K to eligible families. In 2016–2017, the district opened seven new full-day pre-K classrooms that were available for 6 hours per day, 5 days a week; the half-day program ran as it had in the past, with classes available for 3 hours per day, 4 days a week. Compared with the half-day program, FDPK more than doubled the number of hours per week for children in ECE settings and added more than 600 classroom-hours over the school year. In part, these additional hours were used for lunch and a daily nap. Beyond this, teachers could use the remaining hours in a variety of ways including literacy instruction, math instruction, structured or unstructured play, and so on. Aside from the substantial differences with respect to intensity, full- and half-day classrooms were similar in many respects. All WPS pre-K classrooms were led by teachers with a bachelor’s degree, they maintained the same teacher-to-child ratios, and they used the same curriculum, Little Treasures (which has now been replaced with “World of Wonders” by publisher McGraw-Hill). Little Treasures is a prekindergarten curriculum available online for free that has been used in WPS since before the study began. Little Treasures is described by its publisher as “a comprehensive, research-based pre-K program” (Macmillan/McGraw-Hill, 2019). We are unaware of external evaluations of Little Treasures’ efficacy, however a quasi-experimental evaluation of its counterpart, World of Wonders, did not find significant effects on student academic achievement in fourth grade reading (Corcoran, Eisinger, Kim, & Ross, 2016). Because it is free, Little Treasures is used widely across the U.S. Having more time to implement a widely-available and widely-used curriculum with limited efficacy evidence is important for the interpretation of study results.
This article presents findings from the first year of FDPK and is focused on children’s school readiness outcomes, as measured both at the end of the preschool year and at the beginning of kindergarten. Below, we describe the research design for the evaluation study, analysis models, and sensitivity checks for RCT estimates.
Method
Research Design
The current study of FDPK employs a randomized block design (within first choice of school site) in which eligible families who completed an application were randomly assigned to offers of full- and half-day classrooms. In this case, the block-randomized design was ideal because it allowed the study team to accommodate families’ preferences for school sites, while also reducing the likelihood for chance imbalances across groups. Because some families did not take up their lottery assignments into full- or half-day classrooms, we estimate the intent-to-treat (ITT) and complier average treatment effects (CATE) as the causal estimands of interest.
Sample
All children who reside within the district and are of age 4 by October 1 were eligible to participate in the FDPK program. For families to enroll in WPS generally, they needed to complete a required preschool application that includes health certifications and the child birth certificate. Families were included in the current study if they expressed interest in full-day preschool on their application, they completed the consent process, and their child had no known special education needs that prevented them from being served within a full-day classroom (e.g., if special equipment was required, a 6-hour day is inappropriate).
Table 1 provides descriptive information about the study sample of 226 children (114 offered full day, 112 offered half day). Overall, the sample is largely Latinx (74%) and low income (61% qualified for free lunch and 13% qualified for reduced-price lunch). The General Preschool Application (more on this data source below) asks the child’s primary caregiver a series of questions about the child’s family history. For instance, 37% reported having received some education beyond high school, and 49% indicated that their home language is not English. About 17% responded “yes” to the question, “Has an immediate family member [of the child] received Special Education services?” About 23% of caregivers also indicated that the enrolled student has low language development, and 37% indicated low social development for the child. 2 The average age of children enrolled in the pilot study was 4.4 years, and about half the children are male.
Pre-K Study Sample Descriptive Statistics

Source. U.S. Department of Education, NCES, Common Core of Data, Retrieved from http://nces.ed.gov/ccd/elsi/
Note. This table presents descriptive statistics for the study sample on variables collected by the WPS Early Childhood Center or the study team. Two hundred twenty-six study children were randomized. Demographic and family history questions come from the general application for WPS preschool. To see exact wording of these questions, see the footnote of Table 2. All test scores are presented in Table 1 in their original (raw) metric. In analyses, they are standardized (M = 0, SD = 1). The TS GOLD Spring overall score in Table 1 is the mean of the six subdomain unstandardized scores. In the main analyses, the TS GOLD Spring overall score is the mean of the standardized subdomain scores. To compare the study sample with WPS overall, we examine demographics from the Common Core of Data from NCES for 2015–2016. The full district is 52% male, 72% FL eligible, 11% RL eligible, 77% Hispanic, and 1% Black. HS = high school; PPVT = Peabody Picture Vocabulary Test; PK = prekindergarten; K = kindergarten; ESI-R = Early Screening Inventory–Revised; TS = teaching strategies; DIBELS = Dynamic Indicators of Basic Early Literacy Skills; WPS = Westminster Public Schools; FL = free-price lunch; RL = reduced-price lunch; NCES = National Center for Education Statistics.
Treatment Contrast
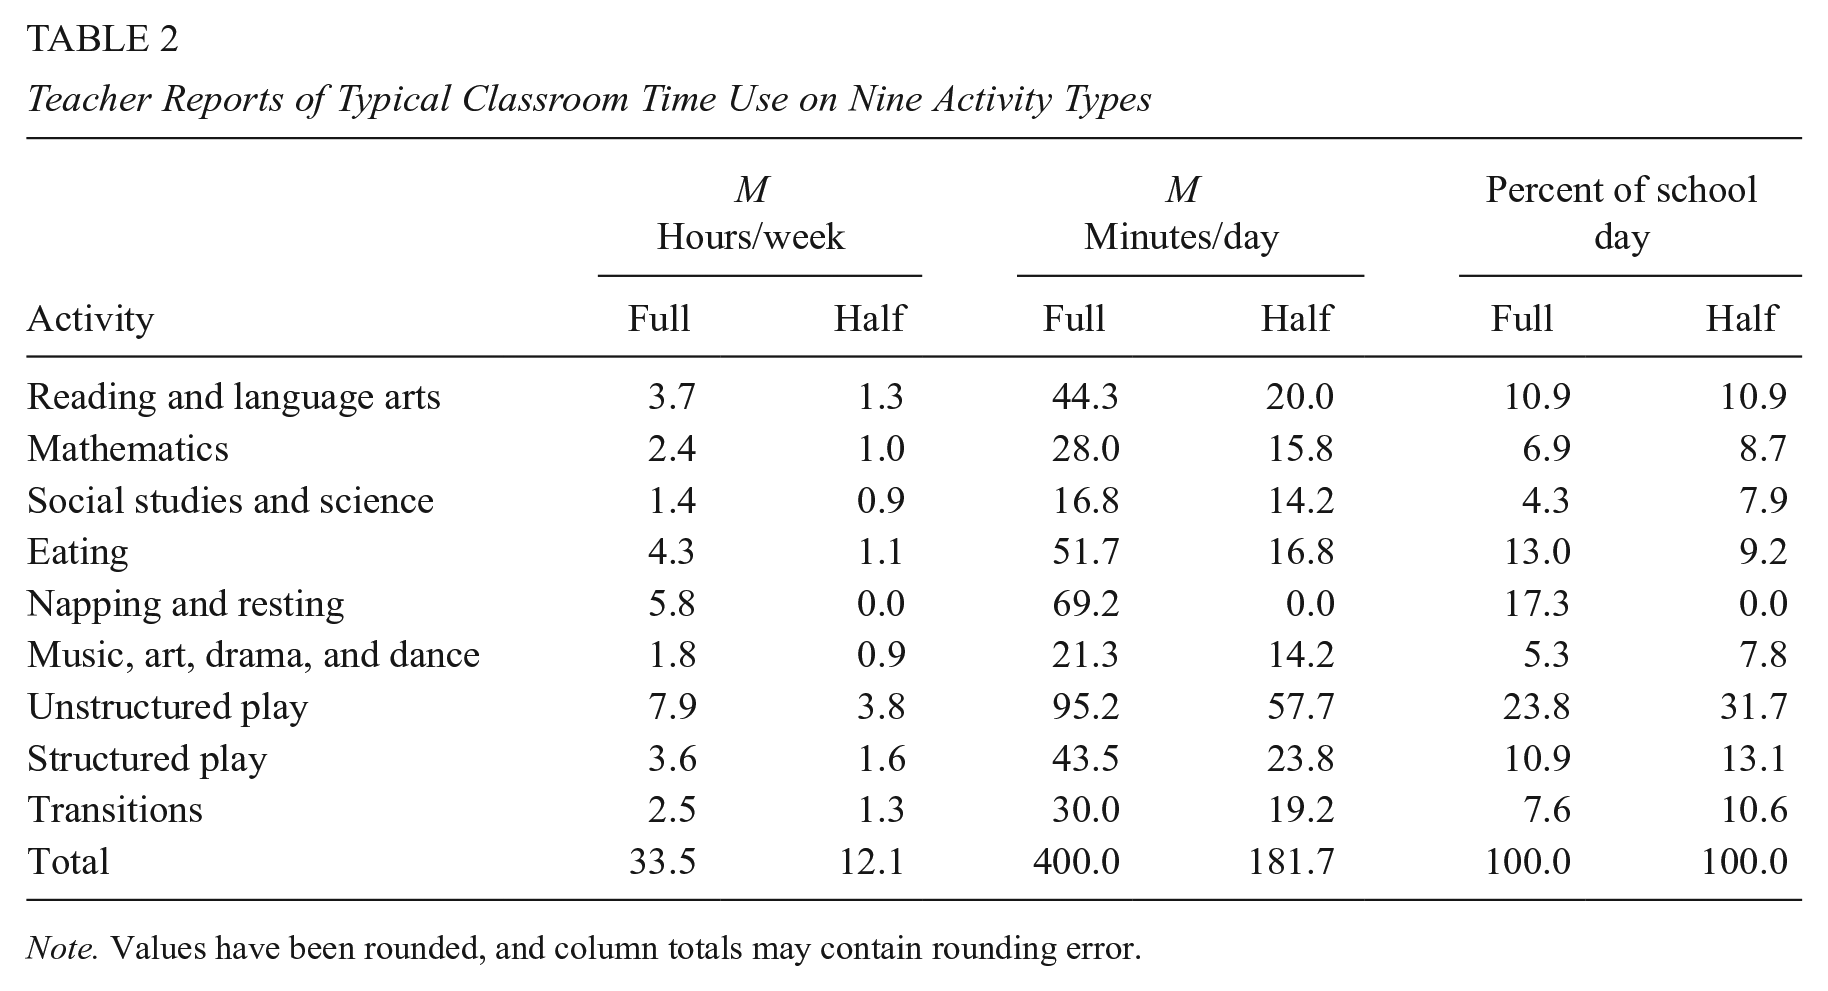
Although many aspects of the full- versus half-day conditions were the same (e.g., same teacher training requirements, same curriculum, same professional development, same student–teacher ratio), students in these settings experienced a very different school year. Naturally, because full-day classrooms had 18 more hours of class time each week than did the half-day classrooms, the primary difference between the assigned treatment conditions was time allocation. In Table 2, we present descriptive statistics from the teacher survey on how teachers reported spending their time each day of a “typical school week.” The largest differences between full- and half-day classroom time use are in the areas of napping (69 vs. 0 minutes per day) and eating (52 vs. 17 minutes per day). Full-day students have a scheduled nap every afternoon, whereas half-day students do not (morning or afternoon sessions). Half-day students are also not served lunch: The morning session is from 8:00 a.m. to 11:00 a.m., the afternoon session begins after lunch from 12:00 p.m. to 3:00 p.m., and the full-day session runs from 8:00 a.m. to 3:00 p.m. and, therefore, is the only setting that includes the 11:00 a.m. to 12:00 p.m. lunch period.
Teacher Reports of Typical Classroom Time Use on Nine Activity Types
Note. Values have been rounded, and column totals may contain rounding error.
Turning to instruction, both classroom types allocate somewhat similar proportions of the class day to “academic” activities such as reading/literacy, math, social studies, and science, but because full-day students are in class so much longer per week, those percentages add up to very different total number of hours exposed to these activities each week: Full-day students receive 3.7 hours per week of reading instruction (relative to 1.3 hours for half day), 2.4 hours per week in mathematics (1.0 for half day), and 1.4 hours of social studies and math (0.9 hours for half day). Students in full-day classrooms also receive double the hours per week in nonacademic activities such as visual/performing arts, play (structured and unstructured), and transitions between activities.
With respect to other differences in treatment versus control conditions, it is also worth noting that teachers were not randomly assigned to full- versus half-day classrooms so that the study design would more closely mirror realistic district staffing practices. When funding was secured for the full-day classrooms, positions were made open to both existing ECE teachers and new hires, alike. The pay for half- and full-day teaching positions is the same (half-day teachers cover both an a.m. and p.m. session each day). In conversations with district leaders, we know there was no systematic sorting of stronger teachers to full-day positions. In fact, teacher survey data document that half-day teachers tended to have somewhat more teaching experience overall (16.8 vs. 12.7 years), years of pre-K experience (12.8 vs. 9.2 years), and years at the current school (7.0 vs. 2.9 years).
Data Collection
To examine the impact of FDPK on children’s outcomes, the study team assessed children’s receptive vocabulary skills and administered an intensive developmental screener that identifies children who may need special education services. These assessments were conducted within the first month of fall 2016 (baseline) and again in the last month of spring 2017 (end of pre-K year). Crucially, all study children were administered the same assessments, regardless of whether or not they enrolled in WPS pre-K. If a child was enrolled in WPS pre-K (half- and full-day programs), the study team administered the receptive vocabulary assessment and developmental screener during regular pre-K hours. If a child was not enrolled in WPS, the study team met with the family directly to administer measures (either at a school or library).
In addition to outcome measures collected by the study team, the evaluation also includes assessments administered directly by the school district. However, because these measures are available only for the subset of study children enrolled in WPS (80% in pre-K), we treat these study results as exploratory.
Measures of Student Skills
Primary Outcomes
Children’s receptive vocabulary was measured by the Peabody Picture Vocabulary Test, 4th Edition (PPVT-4; Dunn & Dunn, 2007). The PPVT-4 is a 228-item test in standard English administered by having children point to one of four pictures that best corresponds to a spoken word. The PPVT-4 scale is norm referenced and is widely used as a measure of children and adult’s receptive, or heard, vocabulary. The PPVT-4 has strong psychometric properties with evidence for high reliability and validity (Dunn & Dunn, 2013). Although the home language is not English for all study participants, all children were given the opportunity to attempt the PPVT (in English). Every child was administered a training set, placed into an age-determined basal set, and then given a raw score based on the ceiling item and total errors, which was transformed into a standardized score based on raw score and month, as prescribed by the assessment.
The Early Screening Inventory–Revised (ESI-R) is a one-on-one, 20-minute developmental screening tool that is appropriate for children from 3 years 5 months to 5 years 11 months (Meisels, Marsden, Wiske, & Henderson, 1997). The ESI-R is designed to identify the possibility of a learning condition that could potentially affect students’ future school success. The measure evaluates children’s developmental abilities in three domains of school readiness. To assess cognition and language, the child is given four tasks that allow her to demonstrate ability to comprehend language, express ideas, and reason and count. To assess visual–motor/adaptive reasoning, the child is asked to replicate patterns with blocks and copy with a drawing. To assess gross motor skills, the child is asked to jump, hop, and other physical coordination tasks. The three domain scores are then summed into a single raw score that can be used to identify children who may need to be referred for additional evaluation for special services. A Spanish language version of the screener is also available, and we administer the ESI-R in the child’s primary language. Study children below the age of 4.5 were given the Early Screening Inventory–Preschool (ESI-P) version, and children above that age were given the Early Screening Inventory–Kindergarten (ESI-K).
We administered the ESI-R for a number of reasons. First, the district was particularly interested in whether full-day preschool could alter the need for costly special education services in early grades. Second, studies of the ESI-R indicate the instrument is both reliable and valid—a reliability for the ESI-P of .98 and .87 for the ESI-K (Meisels, Henderson, Liaw, Browning, & Ten Have, 1993; Moodie et al., 2014). The ESI-R was normed on a sample of about 5,000 children across 60 classrooms in 10 states, including Head Start, public schools, and private childcare and preschools (Fantuzzo, Perry, & McDermott, 2004). The latter two of the three ESI-R domains described above were adapted and implemented in the widely used Early Childhood Longitudinal Study–Kindergarten (ECLS-K) class of 1998–1999 data set (Rock & Pollack, 2002). In addition, the ESI-R has been used in a number of other early childhood studies (Curenton, 2011; Fantuzzo et al., 2004; Luo, Jose, Huntsinger, & Pigott, 2007). Finally, as shown in Table 1, students in our sample exhibited variation in their ESI-R scores (M of 19 and SD of 6.7 in fall, M of 20.6 and SD of 5.1 in spring), suggesting the items capture heterogeneity in students’ skills during this age period.
Exploratory Outcomes
As discussed above, in addition to the data collected directly by our research team, we also considered two outcomes collected by WPS. First, during the fall and spring of the pre-K year, all teachers assessed children using Teaching Strategies GOLD (TS GOLD) a widely used, observation-based authentic assessment (Heroman et al., 2010). Teachers observe children’s skills during typical classroom sessions and evaluate them across up to nine broad areas of development (e.g., literacy, mathematics, language, social–emotional, cognitive, and physical). TS GOLD has been used in other studies tracking the association between preschool intensity and child outcomes (Reynolds et al., 2014). Although teacher-reported, the measure has shown strong reliability and validity in developer-conducted studies (Teaching Strategies, 2011, 2013), and two recent studies provided evidence of concurrent validity with direct assessment of similar skills 3 (Miller-Bains, Russo, Williford, DeCoster, & Cottone, 2017; Russo, Williford, Markowitz, Vitiello, & Bassok, 2019). Although questions remain about the measurement properties of GOLD, recent research indicates the assessment functions well with children whose home language is not English (Kim, Lambert, & Burts, 2013).
The second district-administered measure we use in this study is the Dynamic Indicators of Basic Early Literacy Skills (DIBELS) in kindergarten (Good & Kaminski, 2002). The DIBELS assesses children’s early literacy skills in the areas of phonemic awareness, phonics, reading comprehensive, fluency, and vocabulary. It is designed to help identify children who may experience difficulty acquiring basic early literacy skills. The measure shows adequate validity and reliability and has been adopted by a number of states to assess children’s school readiness (Good et al., 2004). WPS administers the DIBELS to children during the fall and spring of the kindergarten year and provided us with two subdomain scores—First Sound Fluency and Letter Naming Fluency—as well as an overall composite score. The current study presents RCT results on the TS GOLD at the end of the pre-K year and the DIBELS in the fall of the kindergarten year.
Baseline Measures
A unique strength of the current study is that we have access to an unusually rich set of baseline covariates, including measures of child, home, and family characteristics as well as baseline assessments for primary outcomes. All applicants to Westminster complete a General Preschool Application, which included questions about children’s race/ethnicity, gender, birthdate and age, free/reduced-price lunch program eligibility, primary language, and the primary language spoken in the home. In addition, the child’s parent or primary guardian indicated their educational background, and whether there is a history of family drug/alcohol abuse, special needs, frequent school moves, housing difficulty, domestic abuse, social services involvement, and extreme child medical events occurring within the family. Parents also indicated whether they were concerned about the child’s low language and/or social development. Finally, our research team administered measures of the PPVT and the ESI-R in early fall of the pre-K year and teachers also assessed children using the TS GOLD during the same period. These baseline covariates greatly enhance our ability to assess covariate balance across groups and improve statistical precision to detect effects.
Analysis Model
In Equation 1, we present the statistical model used to estimate causal effects of full-day pre-K on student outcomes of interest:

Validity Checks for Experimental Design
Because randomized experiments in field settings are rarely (if ever) implemented perfectly, we conducted a series of diagnostic probes to assess the extent to which validity threats occurred. Below, we discuss the results of our diagnostic checks for covariate balance, treatment noncompliance, and for missing data on outcomes.
Covariate Balance
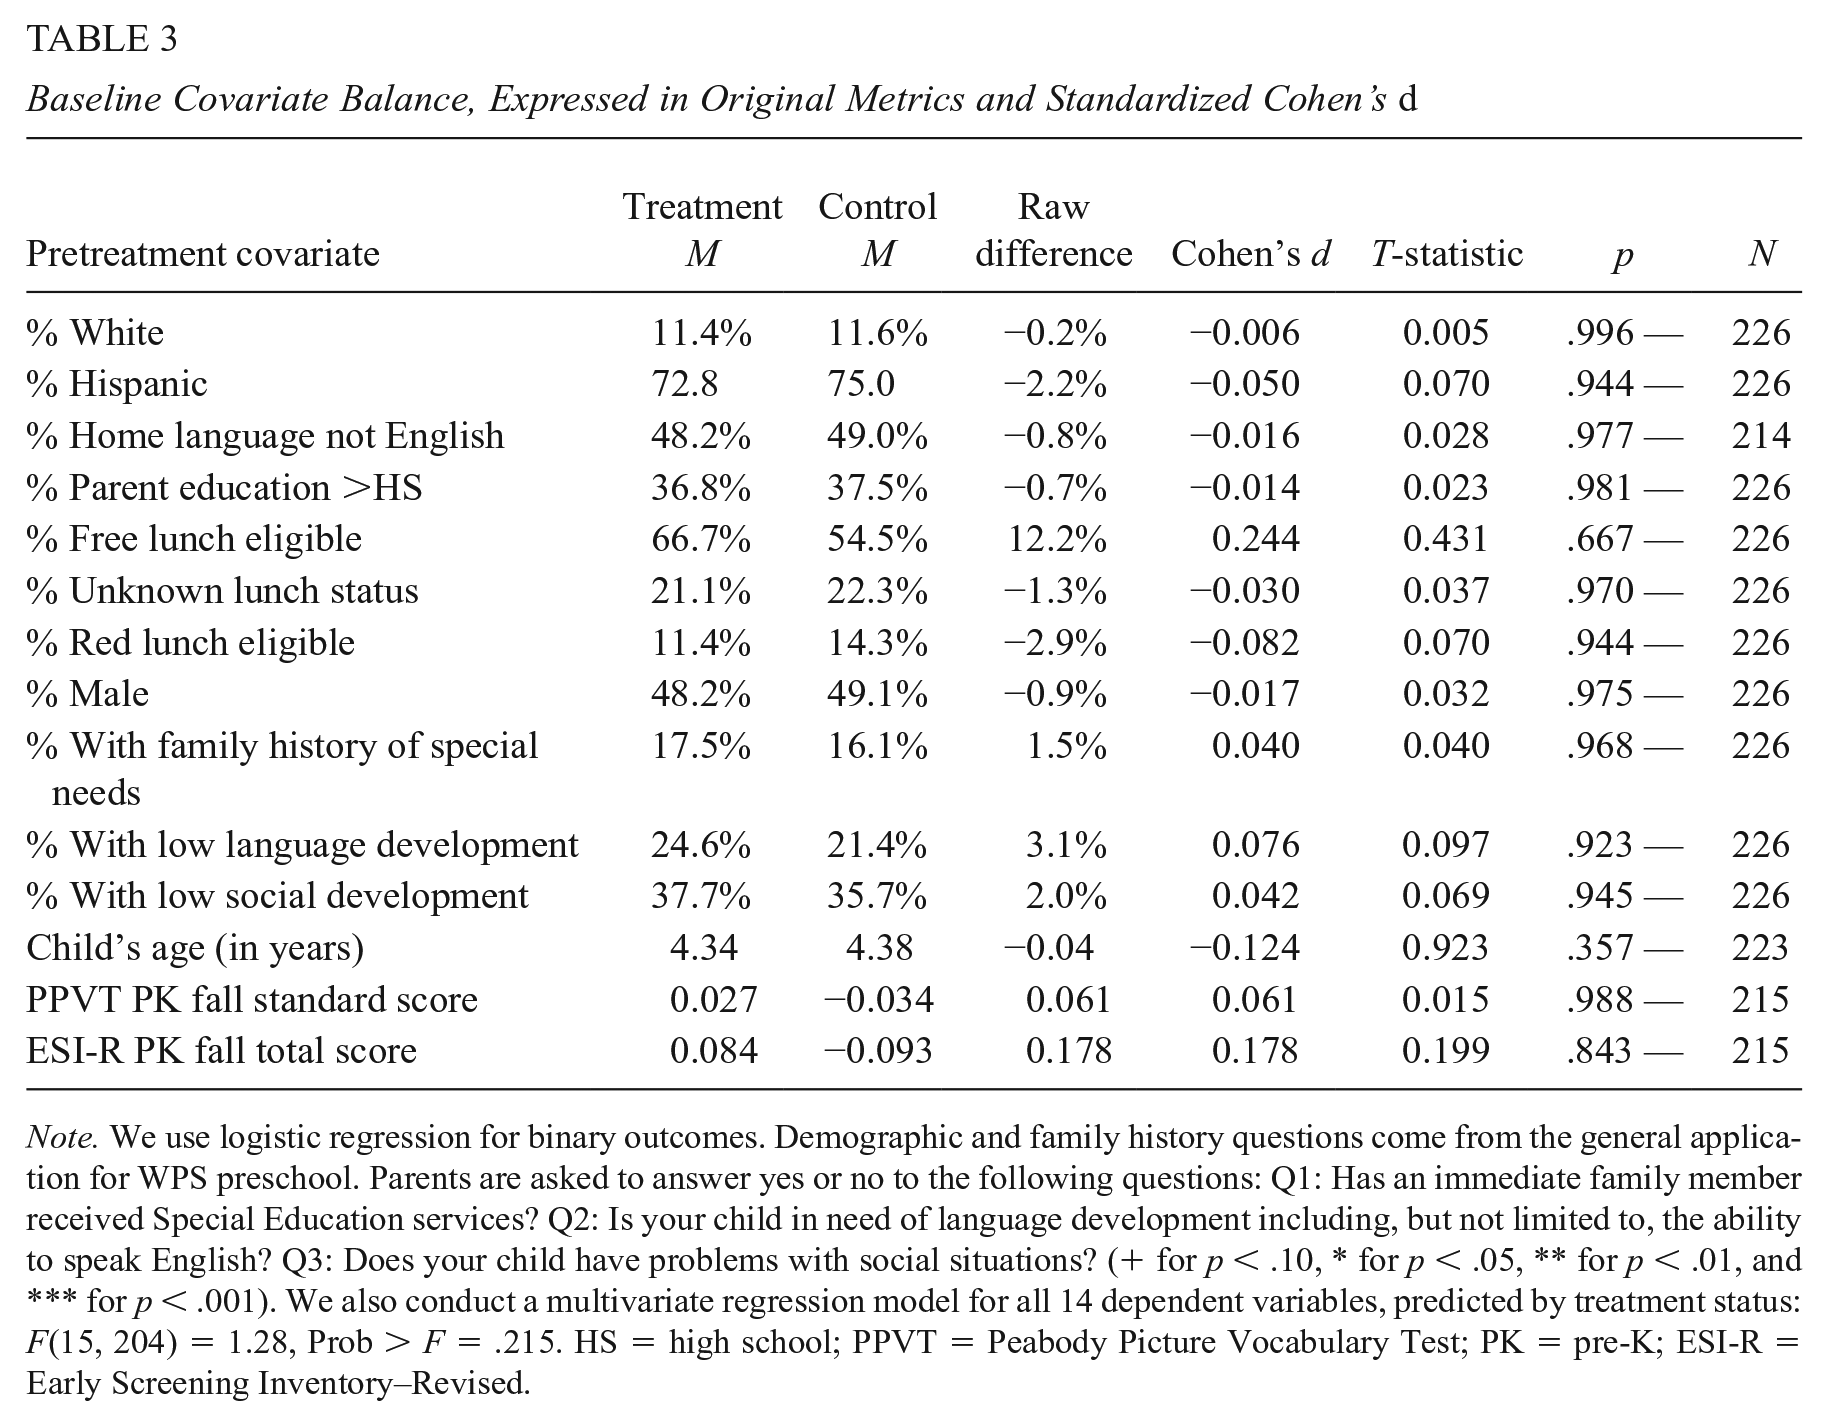
Even with random assignment, it is possible the full- and half-day groups differ based on chance alone. We tested whether there were differences in groups at baseline by fitting a series of regressions in which each baseline covariate was regressed on indicators for whether the family was offered full-day pre-K and site fixed effects. The dependent variables in these regressions included all baseline covariates discussed above. Each row of Table 3 presents the results from a separate regression with the same right-hand side specification but a different baseline covariate as the dependent variable (logistic regression was used for binary covariates). The results in Table 3 are presented both in standardized difference metrics (Cohen’s d) and their original metrics (e.g., percentages, mean scores).
Baseline Covariate Balance, Expressed in Original Metrics and Standardized Cohen’s d
Note. We use logistic regression for binary outcomes. Demographic and family history questions come from the general application for WPS preschool. Parents are asked to answer yes or no to the following questions: Q1: Has an immediate family member received Special Education services? Q2: Is your child in need of language development including, but not limited to, the ability to speak English? Q3: Does your child have problems with social situations? (+ for p < .10, * for p < .05, ** for p < .01, and *** for p < .001). We also conduct a multivariate regression model for all 14 dependent variables, predicted by treatment status: F(15, 204) = 1.28, Prob > F = .215. HS = high school; PPVT = Peabody Picture Vocabulary Test; PK = pre-K; ESI-R = Early Screening Inventory–Revised.
The full- and half-day groups were similar at baseline. None of the group differences on the 14 covariate outcomes are statistically significant. Following Ho, Imai, King, and Stuart (2007), the WWC uses a threshold of 0.25 SDs in absolute value (based on the variation of that characteristic in the pooled sample) as an upper bound for nonequivalence (WWC, 2014). Again, none of the differences in Table 3 are above that threshold.
The groups are very well matched with respect to racial composition, age, gender, home language, and parental education. Furthermore, there does not appear to be any systematic patterns of advantage or disadvantage between the groups. The full-day group has somewhat higher percentages of some characteristics that are historically associated with lower test score performance (e.g., children in the full-day group are approximately 12% points more likely to be eligible for free lunch). However, on other variables, half-day families exhibit slightly higher means (e.g., 75.0% of control families are Latinx, whereas 72.8% of treatment families are Latinx). Finally, we fit a multivariate regression model for the full set of covariates as simultaneous outcomes, and we find that the F statistic associated with the null hypothesis that the coefficient on the treatment variable is the same across all outcomes is not statistically significant, F(15, 204) = 1.28, p = .215. Overall, the balance tests suggest little evidence of systematic differences between groups at baseline. Furthermore, sensitivity analyses (presented below) indicate that the magnitude of our experimental estimates is robust to the inclusion of baseline covariates in the model.
Treatment Noncompliance
Families are randomized to offers of full- or half-day pre-K slots in WPS. Some may choose to not take up their offers. In particular, families assigned to a half-day WPS slot may be more likely to opt out of WPS pre-K and could possibly enroll their child in a different full-day setting. Such treatment noncompliance leads to a discrepancy between assigned and observed treatment status. Across both conditions, 74% of the study sample participated in the pre-K classroom to which they were assigned. Among those who were randomly assigned to full-day pre-K, 86% attended the full-day program in WPS. Among those assigned to the half-day group, 62% participated in half-day classes in WPS. This differential take-up rate across groups was expected given that all study families had initially indicated interest in a full-day slot. A small portion of study participants experienced crossover: Specifically, 2% of families assigned to full-day pre-K switched to the half-day program in WPS, and 9% of families who were initially assigned to half-day pre-K enrolled in the WPS full-day program.
One might be concerned that differential uptake (compliance) could bias our findings. Indeed, if treatment noncompliers were less advantaged at baseline or control noncompliers were more advantaged at baseline, then our CATE estimates would be inflated. Although this assumption is not directly testable, we find that, overall, there are no significant differences in pretreatment covariate means between those who do and do not take up their randomized offer (for all 14 pretreatment covariates). 4 Specifically, among the control group, none of the 14 pretreatment covariate means differ by uptake status. For the treatment group, only one of the 14 covariate mean differences is statistically significant (the mean standardized fall PPVT score is 0.235 SDs and −0.816 SDs for those who do and do not uptake their offers, respectively). Taken together, this suggests that, though control group families are less likely to take their offer (differential rate), the decision to uptake is not systematic in terms of baseline covariates (but we cannot rule out unobserved predictors of uptake).
To address threats to internal validity from differential uptake, we estimate and focus on ITT effects that isolate the causal impact of receiving an offer to participate in the full-day program, as well as CATE effects, which estimate the impact of the program for compliers.
Missing Data and Attrition
Because families were required to complete the General Preschool Application to enroll in FDPK, there is very little missing data on baseline covariates (see Table 1 for missing data rates). For the few cases in which we did not have baseline covariate information, we included controls for missing data in the analysis models.
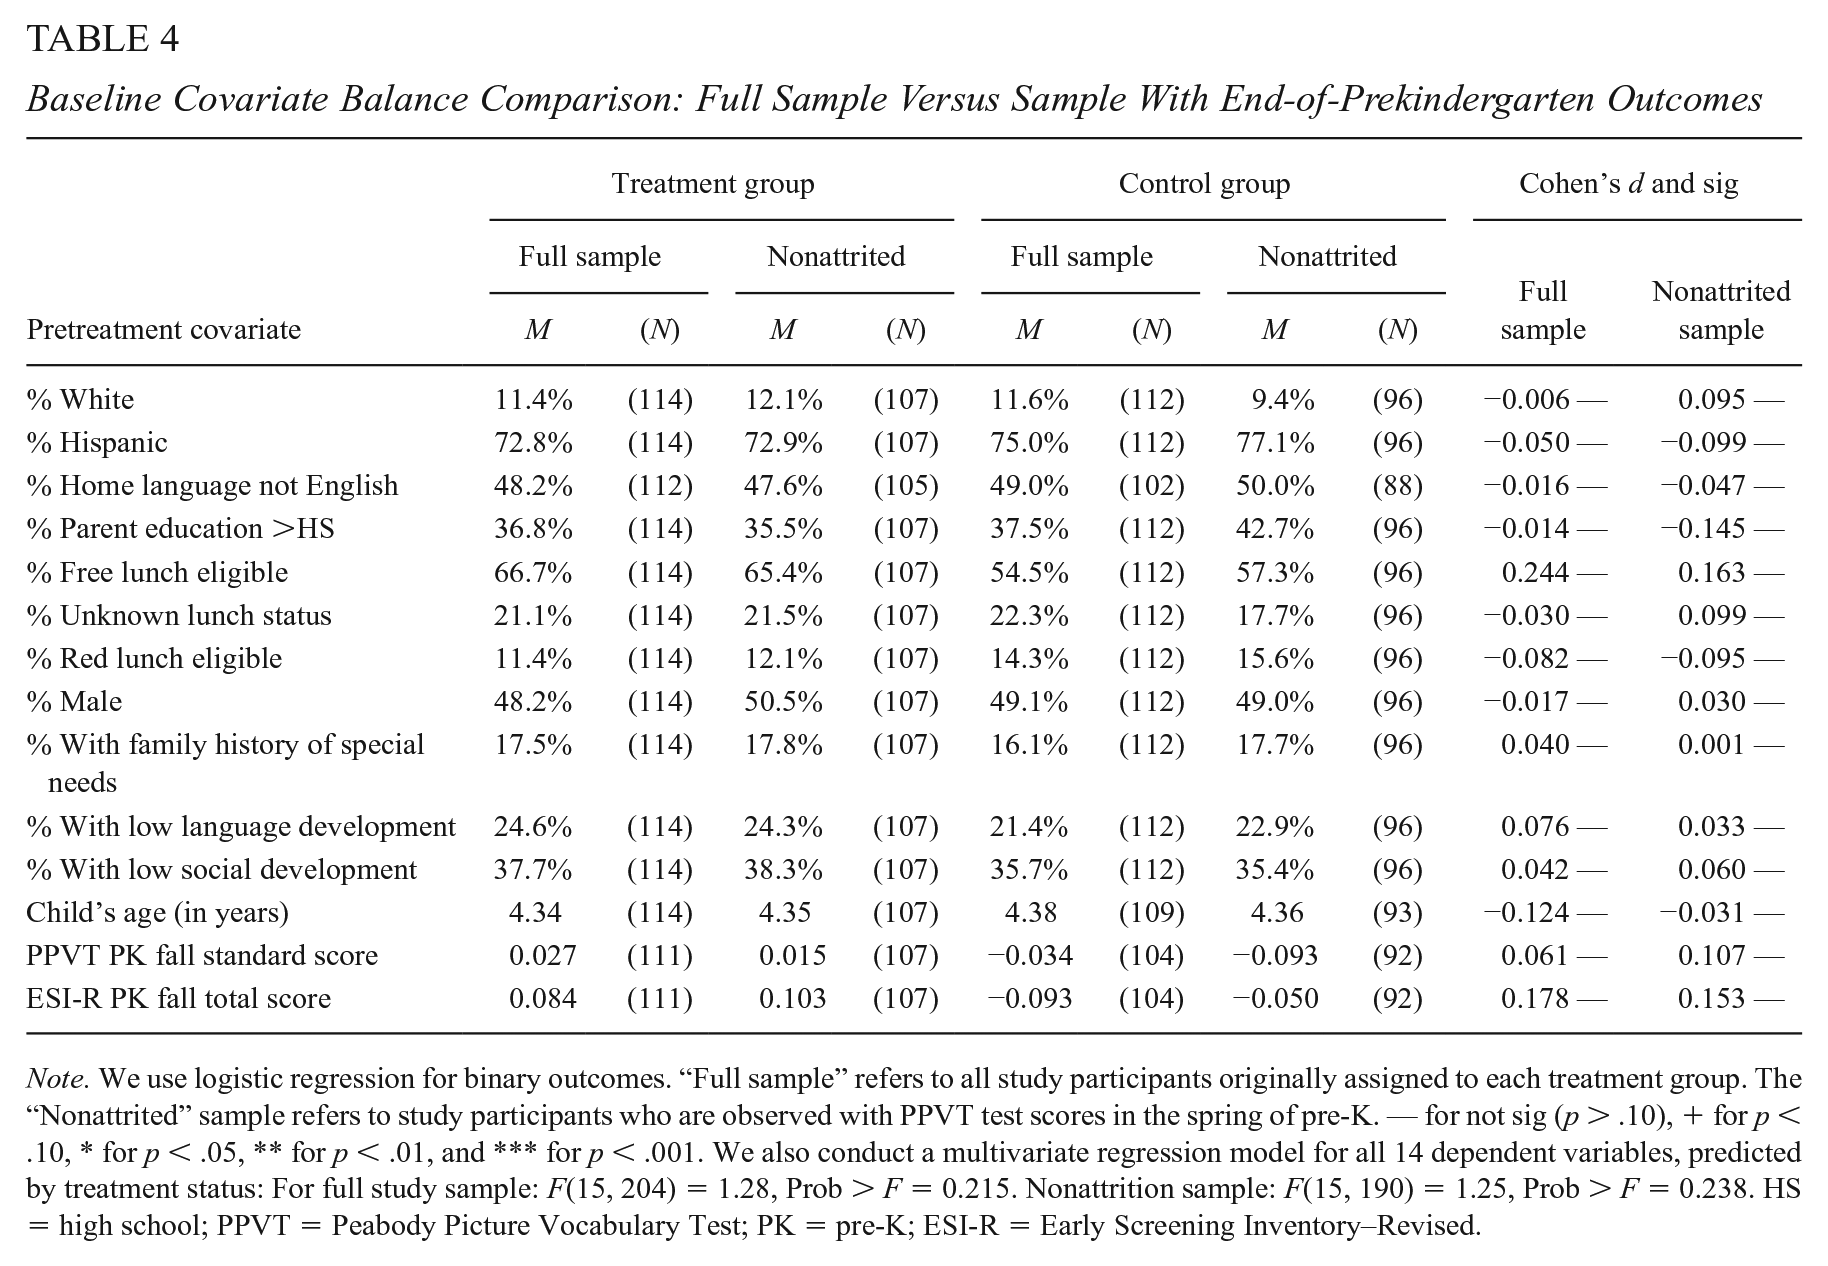
Table 1 shows that 6.2% of the study sample is missing a spring ESI-R score, and 11.5% are missing a PPVT score—our two main outcomes of interest—because we were unable to reach some families to complete the assessments or the child refused to complete the activity. Table 4 presents again the baseline characteristics of half- and full-day children for the full sample (left), alongside the same descriptives for the remaining sample that does not have missing outcome data on which we conduct our main analyses. It shows that the remaining sample is similar to the complete study sample and that there is no evidence of differential attrition across the groups. When we reapply a multivariate regression model to the nonattrited sample for the full set of covariates as simultaneous outcomes, we again find that the F statistic associated with the null hypothesis that the coefficient on the treatment variable is the same across all outcomes is not statistically significant, F(15, 190) = 1.25, p = .238.
Baseline Covariate Balance Comparison: Full Sample Versus Sample With End-of-Prekindergarten Outcomes
Note. We use logistic regression for binary outcomes. “Full sample” refers to all study participants originally assigned to each treatment group. The “Nonattrited” sample refers to study participants who are observed with PPVT test scores in the spring of pre-K. — for not sig (p > .10), + for p < .10, * for p < .05, ** for p < .01, and *** for p < .001. We also conduct a multivariate regression model for all 14 dependent variables, predicted by treatment status: For full study sample: F(15, 204) = 1.28, Prob > F = 0.215. Nonattrition sample: F(15, 190) = 1.25, Prob > F = 0.238. HS = high school; PPVT = Peabody Picture Vocabulary Test; PK = pre-K; ESI-R = Early Screening Inventory–Revised.
By design, there are more missing data on assessments that were administered by the school district rather than by our study team. WPS administers TS GOLD to children during the fall and spring of the pre-K year, and DIBELS during the fall of the kindergarten year. Because the assessments are given only to participants who enrolled in public pre-K and kindergarten, we lack these outcomes for children who did not participate in WPS pre-K and/or kindergarten. As shown in Table 1, we lack TS GOLD data for about 20% of the study sample, and DIBELS data for 38.5% of the sample. When we use these district-administered assessments as exploratory outcomes, missing data rates are higher than for assessments collected by the study team, which suggests more opportunity for baseline imbalance.
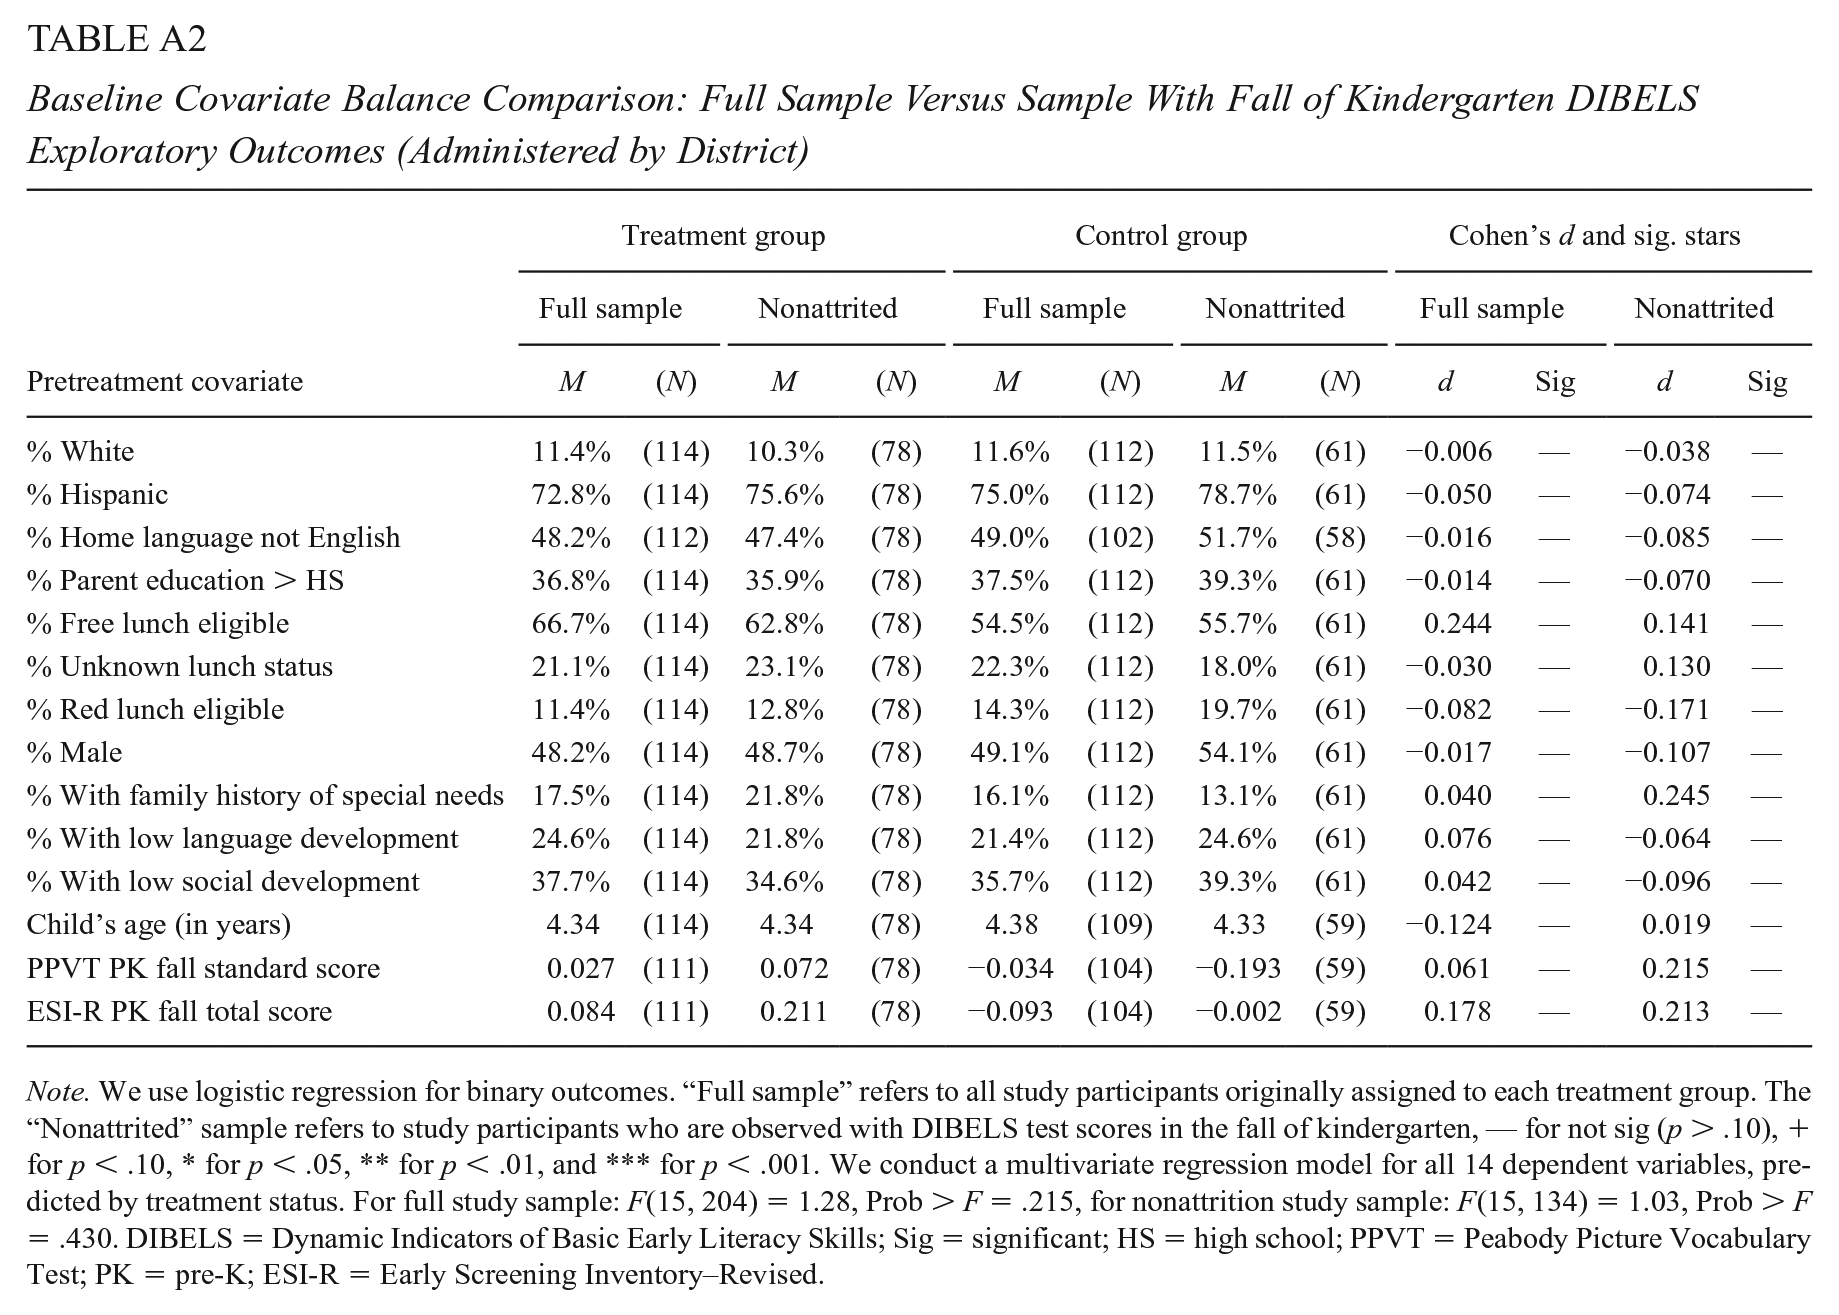
Tables A1 and A2 in the appendix compare baseline information for the full RCT sample and the subset of children who had TS GOLD scores at the end of the pre-K year and DIBELS scores in the fall of the kindergarten year, respectively. Reassuringly, we find that although there is substantial missing data across both groups, we do not observe systematic differences in either full- or half-day group. As was true for the full sample, the treatment versus control group mean differences in the nonattrited samples—expressed in Cohen’s d in the final columns of Tables A1 and A2—are not statistically significant and are not larger than the 0.25 WWC threshold. Moreover, the F statistics for their multivariate regressions (shown in the table footnotes) are not significant. This lends some support to the possibility to the idea that the kinds of participants missing data may generally not systematically different from the full sample. Nevertheless, given the high levels of missingness, we treat these outcomes as exploratory. In specification checks, described below, we also assess whether impacts on these outcomes are robust to conservative assumptions about the nature of the missing data.
Results
Primary Outcomes
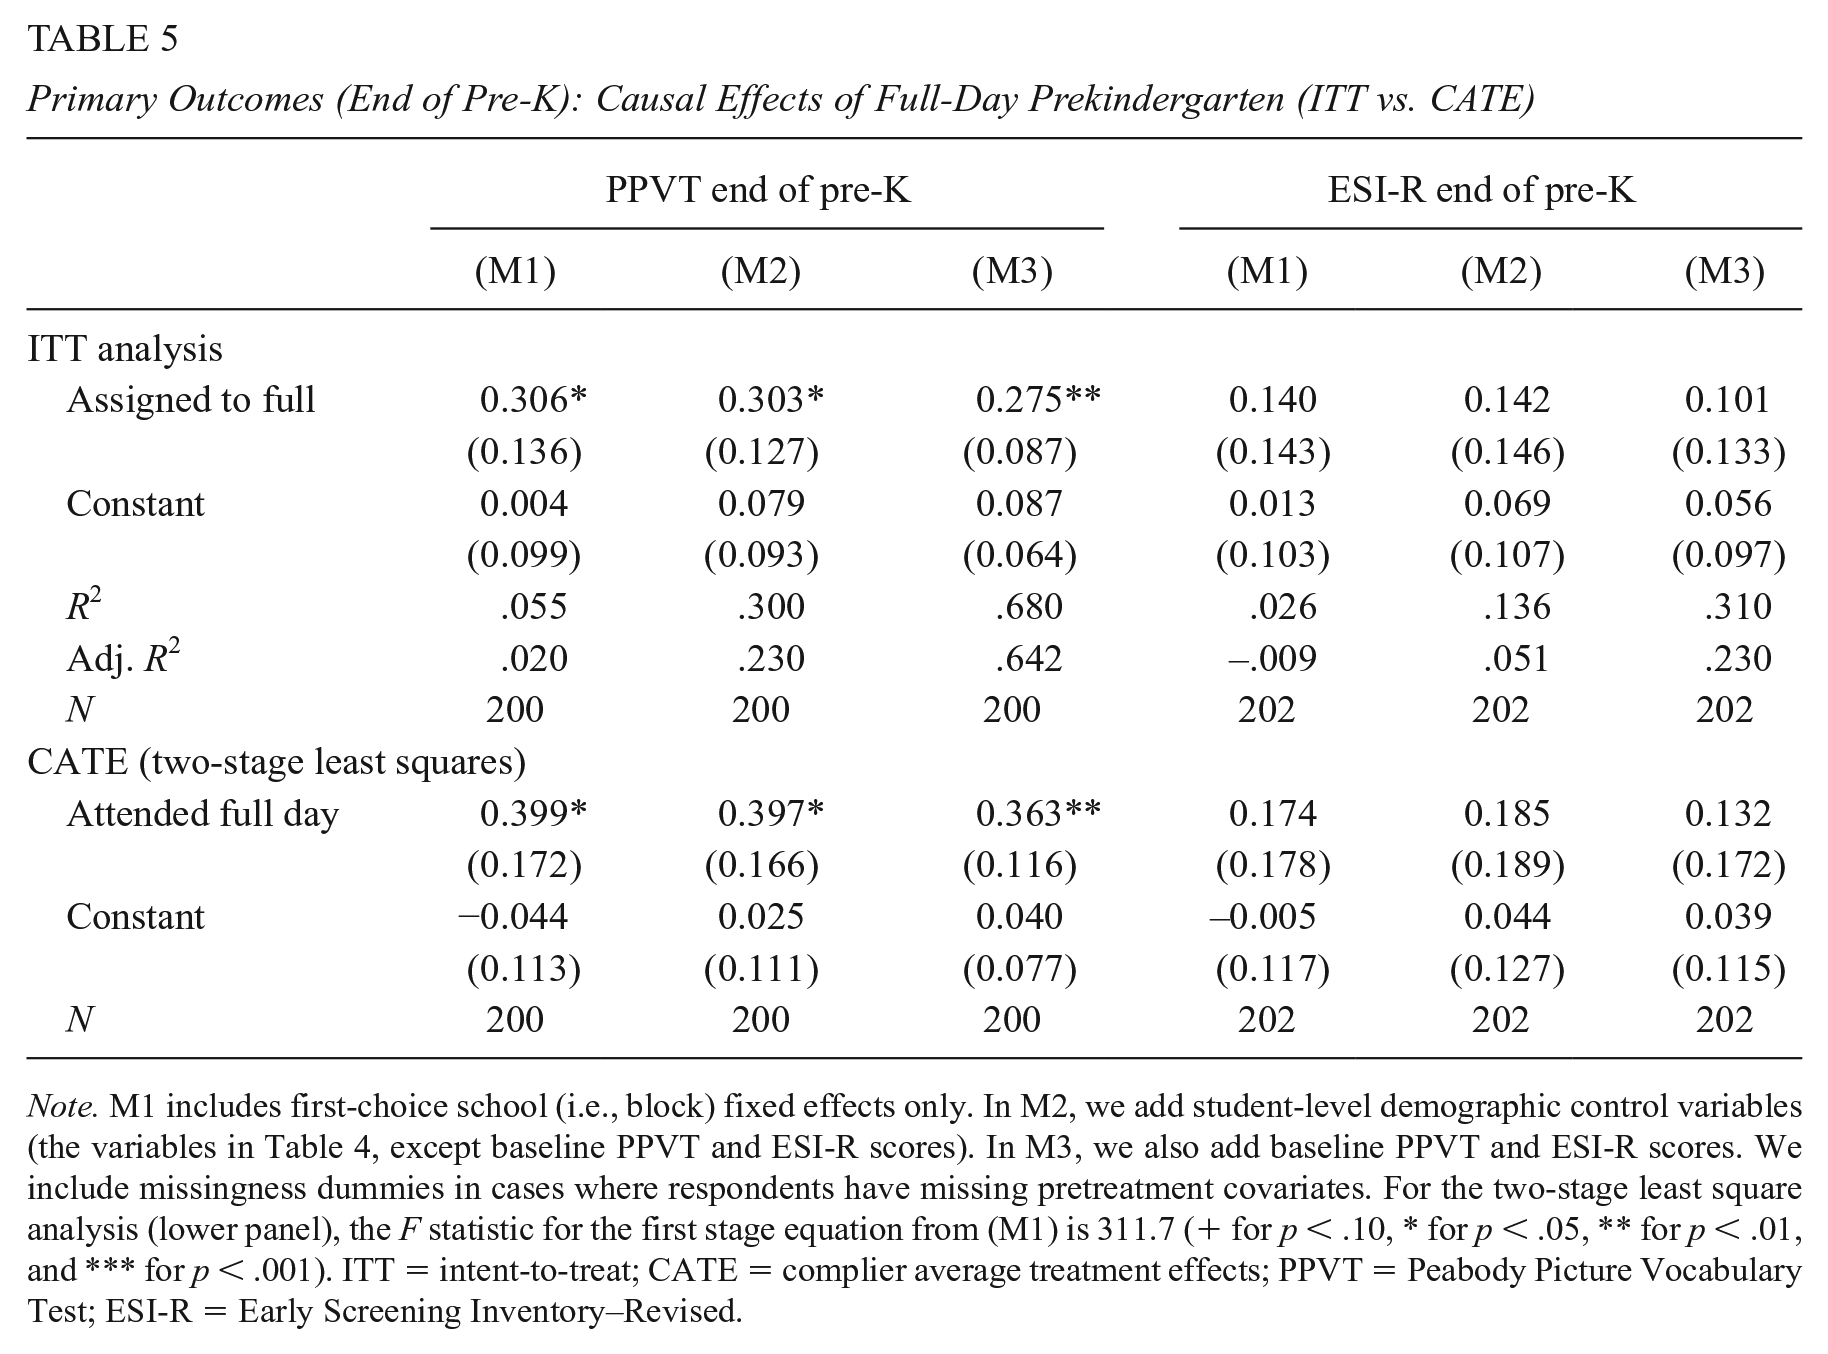
Table 5 presents our estimates of the ITT and CATE for our primary outcomes, PPVT and ESI-R. Columns labeled M1 show the standardized mean differences in effects with only school site fixed effects included in the model; the M2 columns show impact estimates with school site fixed effects and controls for student and family demographic factors; and the M3 columns present results from our preferred model, which includes school site fixed effects, controls for demographic factors, as well as baseline pretest scores. Across all three models, treatment effect estimates are generally stable, whereas the proportion of variance explained increases across models.
Primary Outcomes (End of Pre-K): Causal Effects of Full-Day Prekindergarten (ITT vs. CATE)
Note. M1 includes first-choice school (i.e., block) fixed effects only. In M2, we add student-level demographic control variables (the variables in Table 4, except baseline PPVT and ESI-R scores). In M3, we also add baseline PPVT and ESI-R scores. We include missingness dummies in cases where respondents have missing pretreatment covariates. For the two-stage least square analysis (lower panel), the F statistic for the first stage equation from (M1) is 311.7 (+ for p < .10, * for p < .05, ** for p < .01, and *** for p < .001). ITT = intent-to-treat; CATE = complier average treatment effects; PPVT = Peabody Picture Vocabulary Test; ESI-R = Early Screening Inventory–Revised.
Table 5 shows that the offer of a full-day pre-K slot resulted in an increase of 0.275 SDs on the PPVT-4 (upper left panel of Table 5, Model 3). The impact of actually attending full-day pre-K improved children’s PPVT scores by 0.363 SDs (lower left panel of Table 5, Model 3). For ESI-R, all estimates across models and estimands are positive and between 0.101 and 0.185 SDs. The ITT effect is 0.101 SDs and the CATE result is 0.132 SDs (upper and lower right panels of Table 5, Model 3). Neither are statistically significant.
Exploratory Outcomes
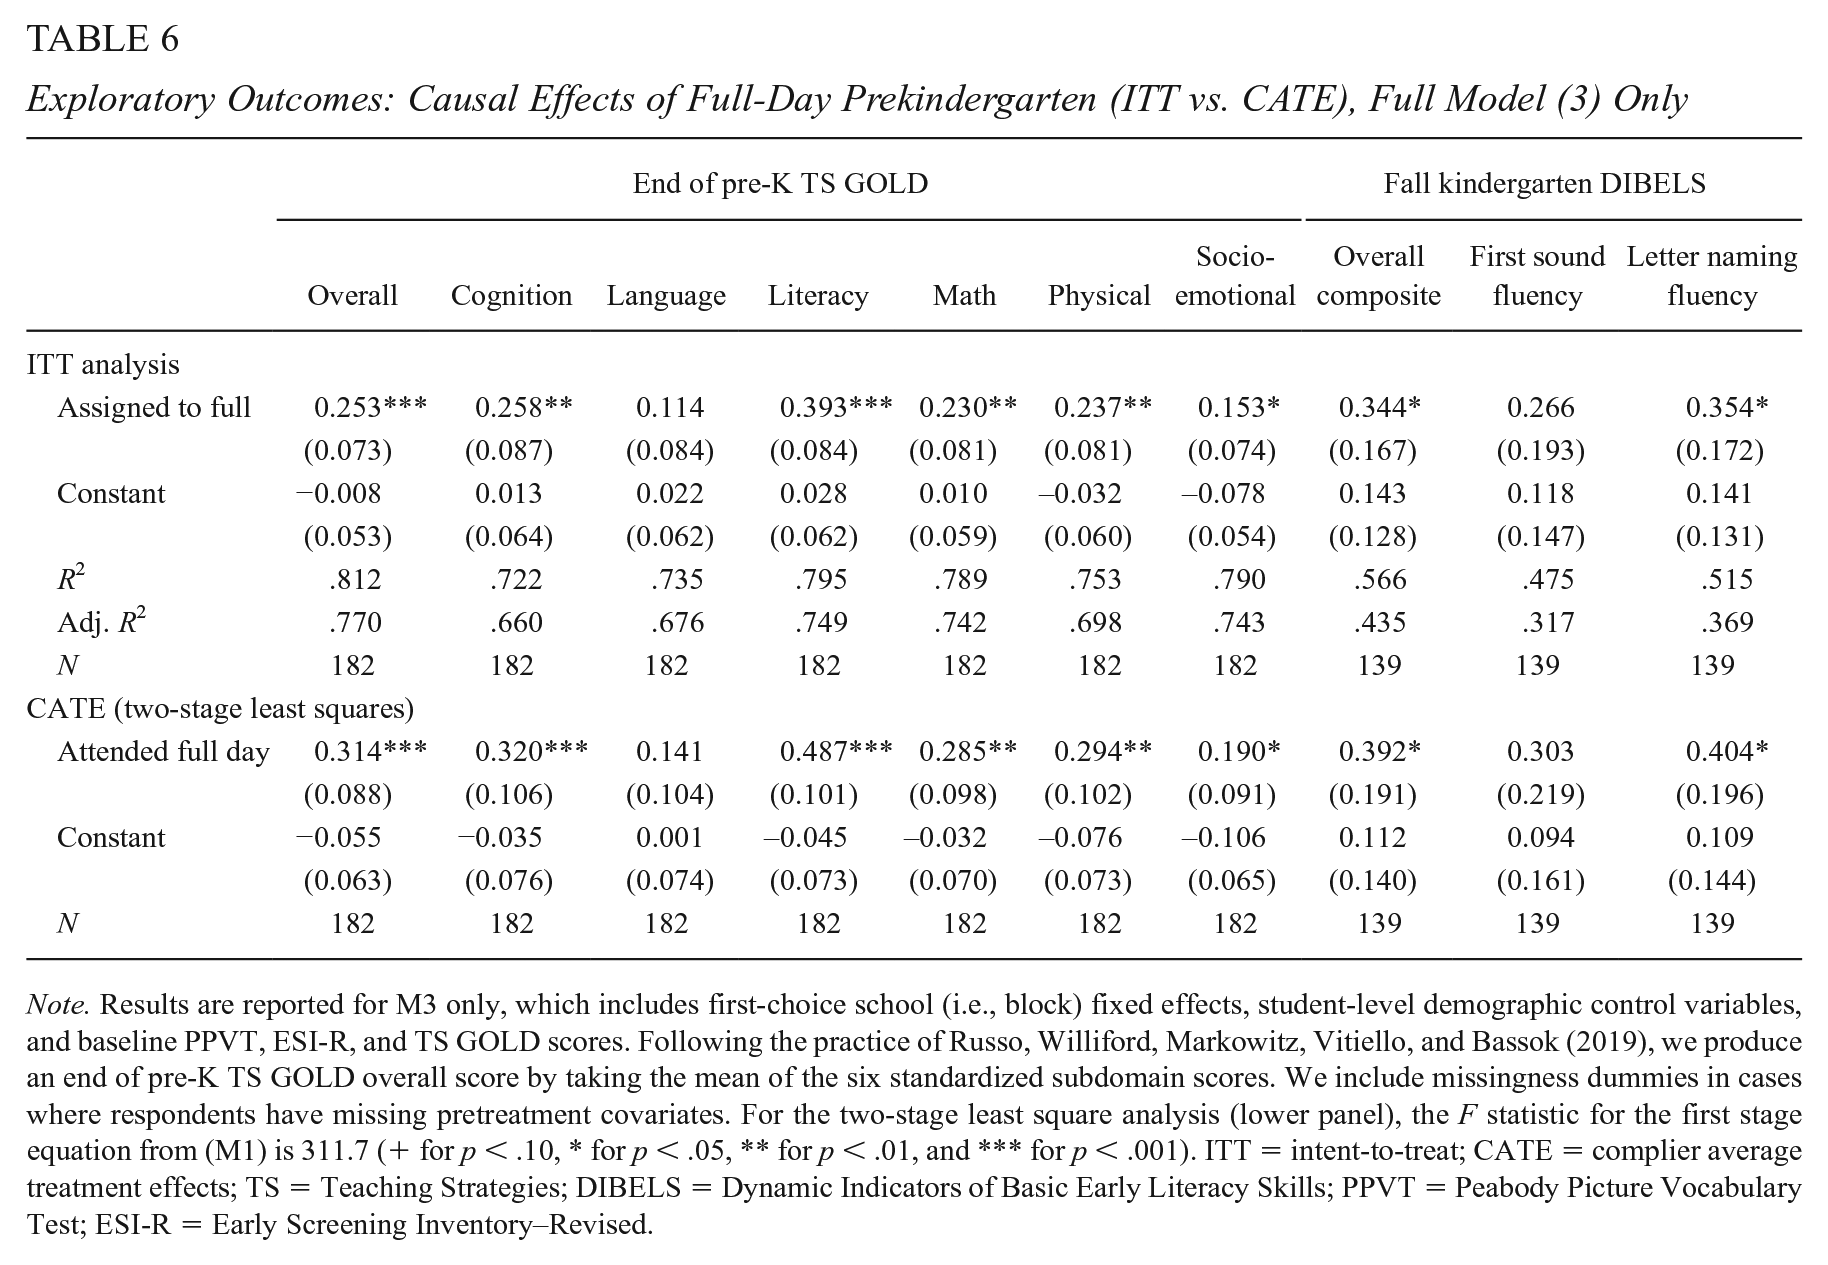
Table 6 contains ITT and CATE results for TS GOLD and DIBELS, the outcome measures collected only for those children enrolled in WPS. For the sake of parsimony, we only present results in Table 6 from our preferred Model 3. Table 6 results suggest that children randomly assigned to an offer of full-day pre-K were rated more highly on the TS GOLD than their peers in half-day programs. Looking holistically across subdomains, the treatment effects on overall TS GOLD scores—calculated by taking the mean of the six standardized subdomains (Russo et al., 2019)—are 0.258 SDs (ITT) and 0.320 SDs (CATE). Treatment effects are positive for all six domains assessed and statistically significant for five of the six domains (cognition, literacy, math, physical development, and socioemotional development). The largest effects were for literacy (ITT = 0.393 SDs, CATE = 0.487 SDs), followed by cognition (ITT = 0.258 SDs, CATE = 0.320 SDs), physical development (ITT = 0.237 SDs, CATE = 0.294 SDs), and math (ITT = 0.230 SDs, CATE = 0.285 SDs). TS GOLD scores on language are substantively meaningful and positive but do not differ significantly between groups.
Exploratory Outcomes: Causal Effects of Full-Day Prekindergarten (ITT vs. CATE), Full Model (3) Only
Note. Results are reported for M3 only, which includes first-choice school (i.e., block) fixed effects, student-level demographic control variables, and baseline PPVT, ESI-R, and TS GOLD scores. Following the practice of Russo, Williford, Markowitz, Vitiello, and Bassok (2019), we produce an end of pre-K TS GOLD overall score by taking the mean of the six standardized subdomain scores. We include missingness dummies in cases where respondents have missing pretreatment covariates. For the two-stage least square analysis (lower panel), the F statistic for the first stage equation from (M1) is 311.7 (+ for p < .10, * for p < .05, ** for p < .01, and *** for p < .001). ITT = intent-to-treat; CATE = complier average treatment effects; TS = Teaching Strategies; DIBELS = Dynamic Indicators of Basic Early Literacy Skills; PPVT = Peabody Picture Vocabulary Test; ESI-R = Early Screening Inventory–Revised.
Table 6 also indicates that by the fall of kindergarten, children randomly assigned to an offer of full-day pre-K outperformed their peers on the DIBELS. The ITT effect for the overall composite score of the DIBELS was 0.344 SDs, and for the CATE, it was 0.392 SDs. We also see positive estimated effects on the two provided DIBELS subdomains—first sound fluency (ITT effect = 0.266) and letter naming fluency (ITT effect = 0.354). All DIBELS effects were positive and substantively meaningful, though only the overall composite score and letter naming fluency effects were statistically significant at the 5% alpha level.
Robustness Checks for Missing Outcome Data
Despite the fact that we make every effort to assess all study children not enrolled in WPS, we do not observe outcomes for all study children at the end of preschool or the start of kindergarten due to the natural mobility that occurs in any district during and after preschool (see Table 1). One could be concerned that the missingness is systematic and could bias our results. We would be particularly concerned in a scenario where high-scoring control students (or low-performing treatment students) were more likely to have missing data, as these patterns would bias our estimates upward so that they appear larger than they actually are.
As a robustness check for our estimated effects, we make assumptions about the missing outcome scores that would work strongly against our findings: Within each school, we assume that every missing control group child would have performed on these assessments at the average level of the apparently higher scoring treatment group. Likewise, we assume that every missing treatment group child would have performed at the average level of the control group. These strong assumptions correspond to the upward bias scenario described above. Recall that we do see evidence that the observable characteristics of the pre- and postmissing data samples are systematically different from one another, so this thought experiment may be somewhat overly punitive. Nevertheless, we can look to see whether the direction and magnitude of estimated effects under these assumptions remain positive and substantively meaningful (if not still statistically significant).
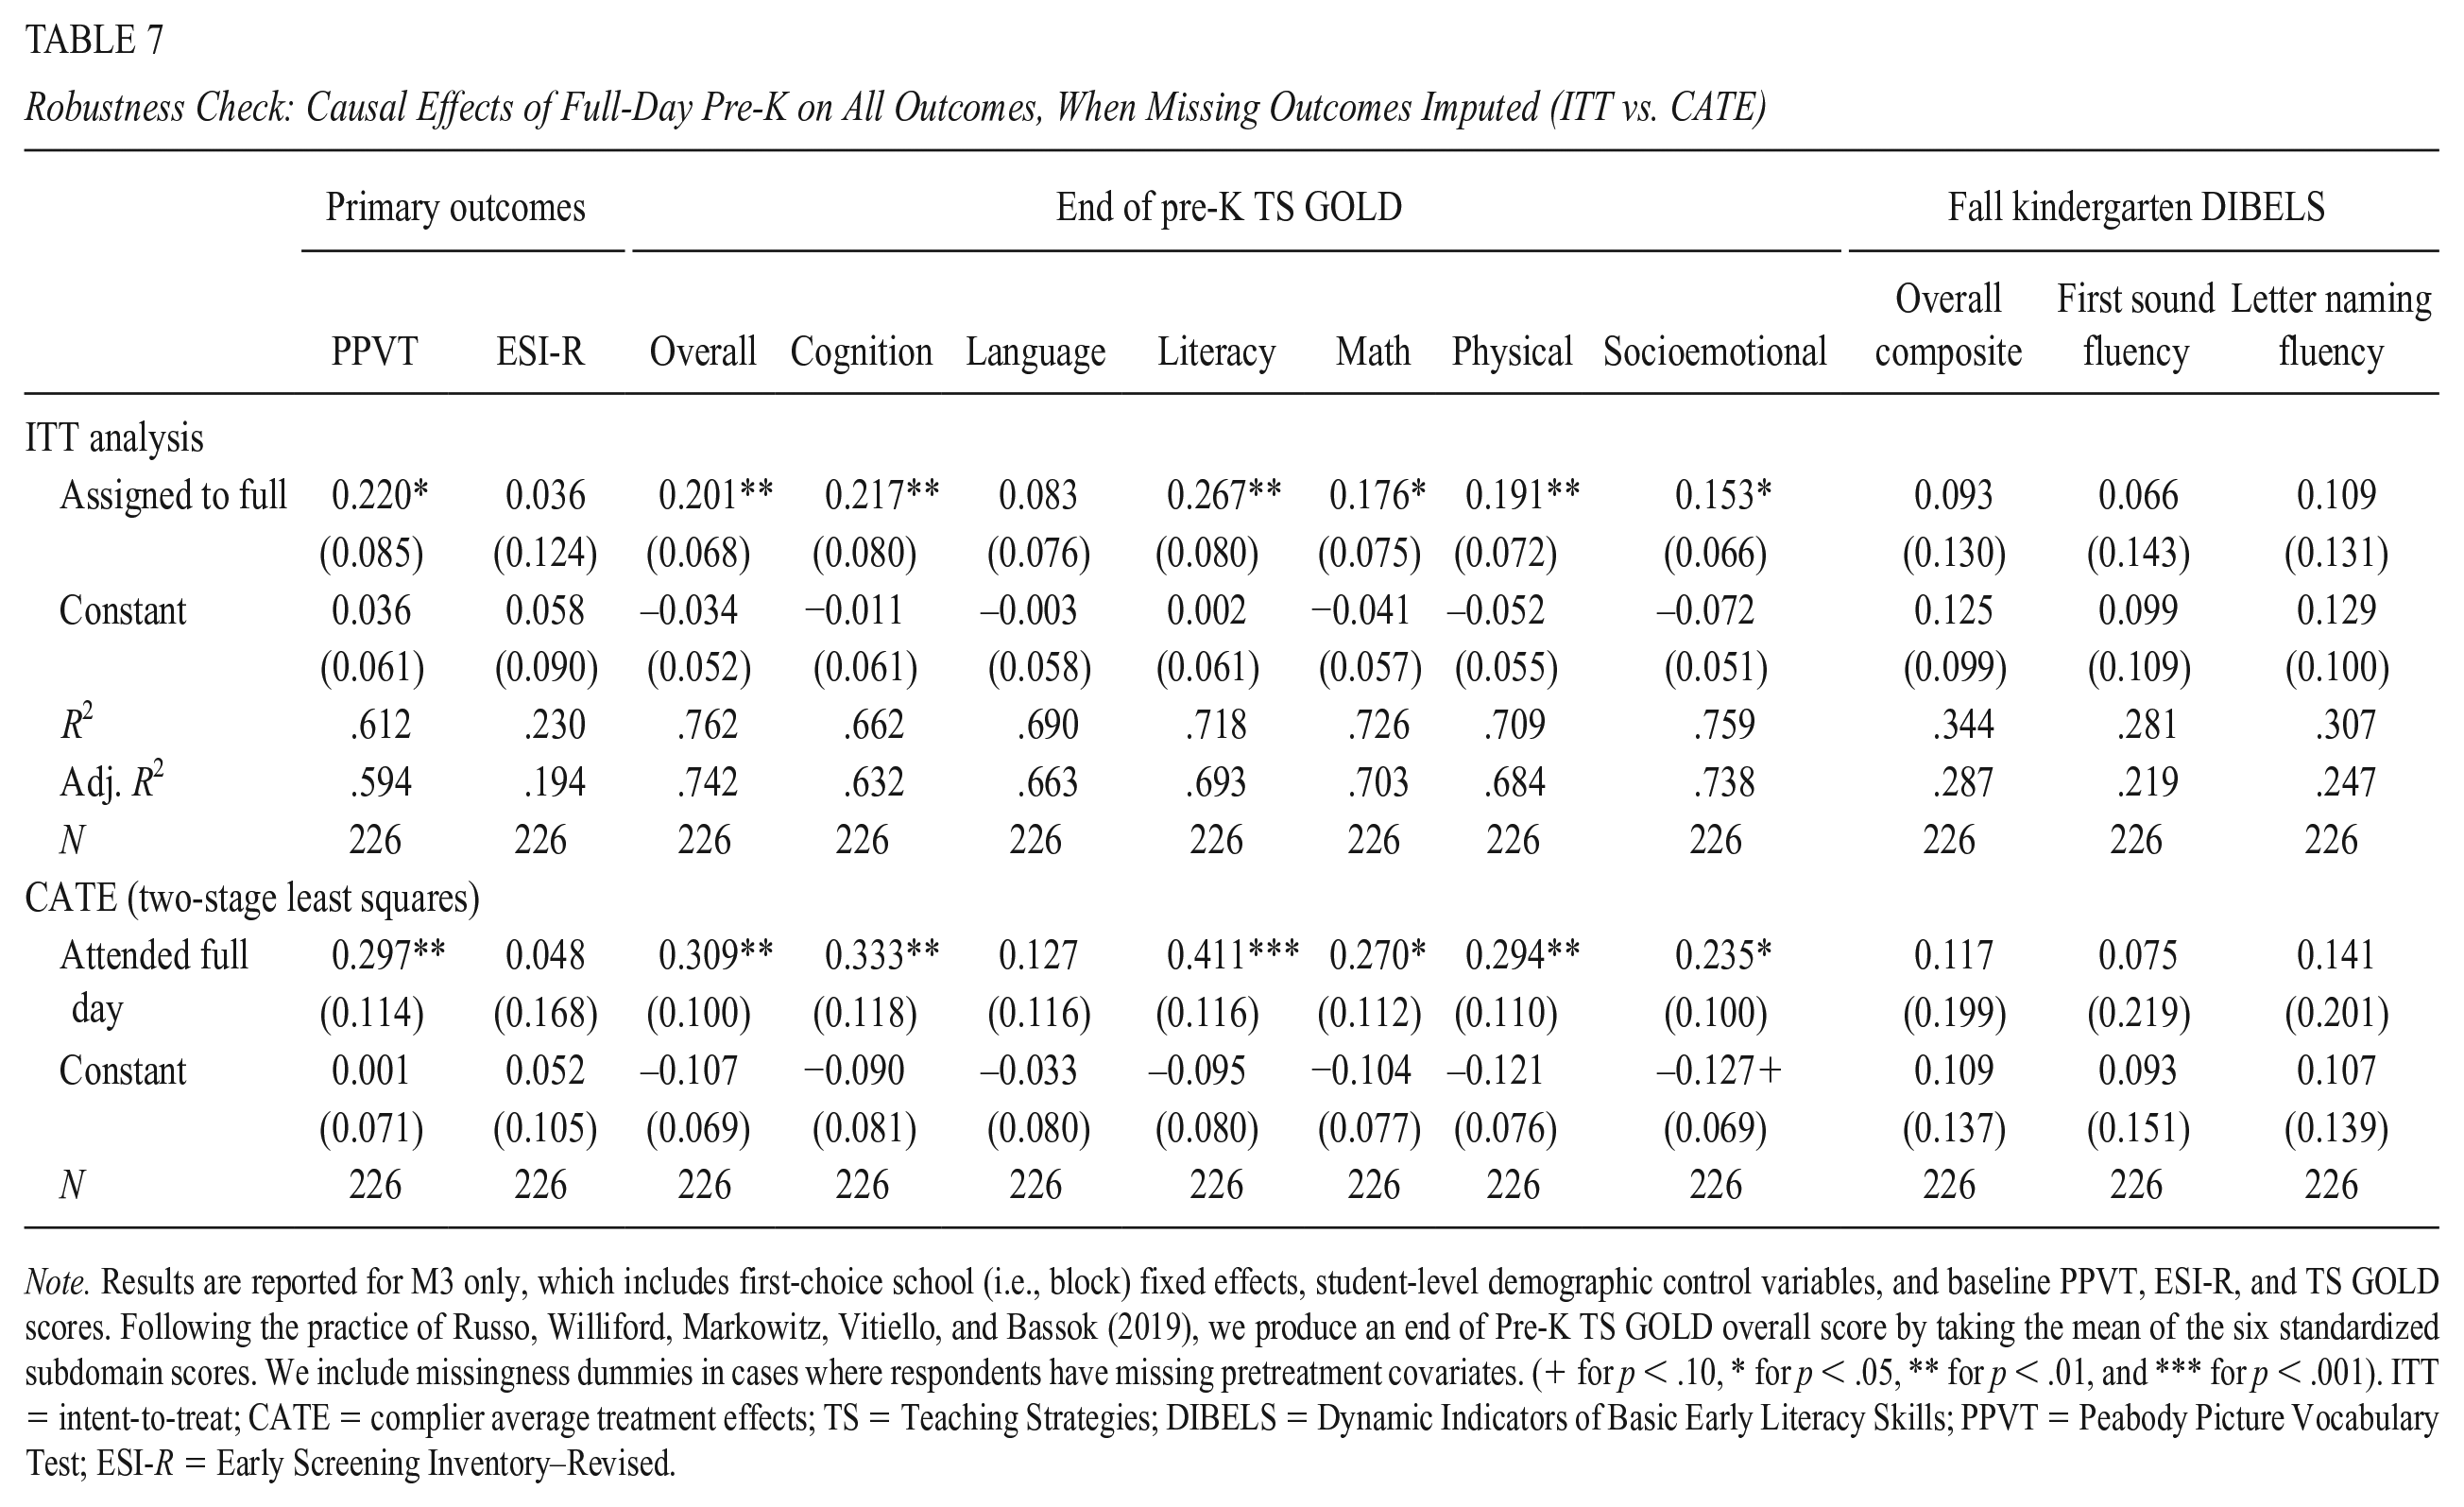
When we make these assumptions, we find the pattern of the results generally persists. We reproduce the analyses presented in Tables 5 and 6 now with the imputed outcome data and present updated results in Table 7. Note that in Table 7, there are now N = 226 children in every model because all study participants now have a value for the outcomes, imputed or otherwise. In Table 7, we see that the estimated effects are generally smaller in magnitude, but all remain positive and most substantively meaningful. Statistical significance should be interpreted with caution when analyzing imputed outcome data; however, 14 of the estimated effects continue to be statistically significant. This suggests that the direction and magnitude of our findings are insensitive to the missing data that are both present in this study and endemic to all longitudinal early childhood research designs.
Robustness Check: Causal Effects of Full-Day Pre-K on All Outcomes, When Missing Outcomes Imputed (ITT vs. CATE)
Note. Results are reported for M3 only, which includes first-choice school (i.e., block) fixed effects, student-level demographic control variables, and baseline PPVT, ESI-R, and TS GOLD scores. Following the practice of Russo, Williford, Markowitz, Vitiello, and Bassok (2019), we produce an end of Pre-K TS GOLD overall score by taking the mean of the six standardized subdomain scores. We include missingness dummies in cases where respondents have missing pretreatment covariates. (+ for p < .10, * for p < .05, ** for p < .01, and *** for p < .001). ITT = intent-to-treat; CATE = complier average treatment effects; TS = Teaching Strategies; DIBELS = Dynamic Indicators of Basic Early Literacy Skills; PPVT = Peabody Picture Vocabulary Test; ESI-R = Early Screening Inventory–Revised.
Discussion
To complement the large body of research examining whether preschool leads to benefits for children, evidence is needed on the conditions under which preschool is most effective. The current study provides the first rigorous evidence on the effects of full-day, full-week preschool on young children’s school readiness. Unlike the majority of the existing research on the intensity of early childhood interventions, which reports regression adjusted associations between program exposure and child outcomes, the current study leverages a school-based lottery to conduct an RCT, thus isolating the true impact of an offer for this full-day, full-week program on young children’s early development.
The results indicate that the offer of full-day pre-K has a positive impact on young children’s school readiness skills. In particular, children offered full-day pre-K scored a quarter of a standard deviation higher on the PPVT—a widely used measure of receptive vocabulary—than peers offered half-day pre-K.
This effect is substantively meaningful. To put it in perspective, we compare the effect size (ES) with the magnitude of impacts from rigorous studies measuring the overall impact of ECE interventions, arguably a stronger contrast than that explored in the current study, which examines the added value of a more intensive preschool program. Evidence from the experimental Head Start Impact Study showed that the effect of random assignment to Head Start on the same outcome considered here was 0.18 for 3-year-olds assigned to Head Start and 0.09 for 4-year-olds (Puma et al., 2010). Wong et al. (2008) used regression discontinuity methods to estimate the impact of five state pre-K programs on the PPVT. They found that effects sizes ranged from a statistically insignificant –.13 in Michigan to a statistically significant .36 in New Jersey. Only two of the five states considered showed statistically significant positive impacts on this outcome. In a recent study expanding this work to eight state pre-K programs (Barnett et al., 2018), the average ESs of pre-K on the PPVT was 0.24, though only three of eight states (New Jersey, Michigan, and Oklahoma) showed statistically significant impacts in the authors’ preferred model, and results were sensitive to model fit. Finally, findings from the recently published evaluation of Tennessee’s pre-K program indicate that at the end of preschool, the ITT effect on a composite measure including language was 0.24, with a total ES of 0.395 (Lipsey, Farran, & Durkin, 2018). Lipsey et al. (2018) specifically called out the 0.25 threshold as “educationally meaningful, e.g., by the 0.25 threshold used by the U.S. Department of Education What Works Clearinghouse” (p. 165).
The effects observed in the current study are thus larger than what are often observed in studies measuring the overall impacts of ECE programs and roughly the same size as those seen for some of the most successful state pre-K programs (Lipsey et al., 2018). These findings are encouraging, especially given the importance of unconstrained skills, and particularly early vocabulary, for children’s reading at third-grade and longer term literacy success (Snow & Matthews, 2016). As discussed in greater detail below, there are important differences in the populations of interest between the current study (largely Latinx) and the preceding ECE impacts studies that may be related to differences in the magnitude of effects.
Although we consider our findings on the PPVT to be our primary results, we do also find suggestive, positive results from the other outcome measures considered. For instance, we find positive but statistically insignificant effects at the end of the preschool year on the ESI-R, a developmental screener used to identify children who may need special education services. We also find positive outcomes with respect to the TS GOLD, a widely used teacher-reported observational tool, which captures development across a broader range of developmental domains. Here too effects were encouraging. In particular, we find statistically significant and sizable impacts on five of the six subdomains and the overall score, ranging in ITT effects sizes from 0.15 to 0.39. The ITT coefficient for the language subdomain was about 0.11 but was not statistically significant. 5 A recent nonrandomized study exploring the impacts of full-day preschool in the context of Chicago’s Child–Parent Centers also showed that children in full-day classrooms outperformed their peers on four of six TS GOLD outcomes, though they found statistically significant outcomes on language and socioemotional development but not literacy or cognition (Reynolds et al., 2014).
We interpret the TS GOLD findings with caution for two reasons. First, because the measure was collected as part of “business-as-usual” practice for WPS pre-K, it is unavailable for the nonrandom sample of children who ultimately did not attend pre-K in WPS despite receiving an offer to do so (about 20% of the study). Encouragingly, the findings in the current analysis are robust to relatively conservative assumptions about the values of these missing data. A second concern about the TS GOLD data is that it is reported by teachers. It is difficult to know how problematic this is. On one hand, existing research suggests some concurrent validity of these measures to direct assessments of children’s skills (Miller-Bains et al., 2017; Russo et al., 2019). WPS teachers have been routinely administering TS GOLD in their classrooms for at least 6 years prior to the study and, therefore, it is standard practice and not specific to this study. On the other hand, teachers are aware of children’s full- versus half-day status, and this knowledge may introduce bias. Relatedly, teachers who spend more time with children in full-day classrooms may have more opportunities to observe children’s skills relative to those in half-day classrooms. This too may introduce bias. The formal TS GOLD trainings teachers take in WPS are designed specifically to increase accuracy and reduce rating bias. Still, we cannot directly assess the existence or size of this bias in teacher-reported assessments and, therefore, treat these findings as suggestive.
Finally, ESs for the DIBELS, a direct literacy assessment administered by WPS in the fall of the kindergarten year, are substantial (ES = 0.34), though only marginally statistically significant given the smaller sample size. These results closely align with Gibbs (2014) whose lottery-based analysis of full-day kindergarten shows ITT effects of approximately a third of a standard deviation. Again, these findings are encouraging given the association between early literacy, as measured by this assessment, and children’s development of reading skills throughout elementary school (Burke, Hagan-Burke, Kwok, & Parker, 2009; Rouse & Fantuzzo, 2006). However, here too, caution is warranted, given the relatively high rates of missingness on this WPS-only outcome.
Taken together, the effects documented in the current article, which were systematically positive, and in most cases also statistically significant, provide the most rigorous evidence to date on the impacts of an extended pre-K day for young children’s school readiness skills. These findings are important, especially in light of recent calls for more rigorous evidence on the impacts of specific aspects of ECE in fostering children’s learning gains (Weiland, 2018). Before turning to the policy implications of the current results, we first highlight some important study limitations, as well as key questions our study cannot answer.
Limitations
Several aspects of the current analysis pose important limitations. The first is that only two of the outcomes considered in the study (the PPVT and ESI-R) were directly assessed by the research team as part of the study and administered to all children irrespective of whether or not they enrolled in the study district. As discussed above, the TS GOLD and the DIBELS assessments are collected as part of “business-as-usual” practices in the district and are, therefore, limited to the 80% of study children who enrolled in WPS (for preschool). Although we conduct analyses to evaluate the sensitivity of our results to the nonrandom sorting of children into WPS across the treatment and control groups, the study would benefit from a broader array of researcher-collected measures, or measures collected for all children. In particular, in light of research both about the effects of ECE programs on young children’s social skills and about the potential impacts of long days in childcare on children’s behavior, this study would benefit from more reliable measures of children’s behavior and noncognitive outcomes.
A closely related concern is the unsurprising, differential take-up of WPS preschool across the treatment and control groups, and related issue of missing data. In the current study, 86% of children offered a full-day slot enrolled in WPS compared with 62% of those offered a half-day slot. Although we have carefully considered the implications of this nonrandom sorting on our findings, we cannot fully account for bias that may be introduced into our analysis here.
Finally, a third potential limitation in our current study is the nonrandom sorting of teachers across half- and full-day classrooms. Randomizing teachers to half- or full-day programs was, understandably, viewed as impractical by our district partners. This leaves the possibility that teachers assigned to teach in the more intensive classrooms differed in important ways from those assigned to half-day programs and that those differences rather than the intensity itself, is what is driving the impacts we document in the current study. Although our examination of observable teacher characteristics suggests clear sorting is not present and, if anything, half-day teachers may be more experienced, unobserved differences may still be at play.
Questions the Study Currently Cannot Answer
Beyond these data limitations, the current study, which focuses on the immediate impacts of full-day pre-K on child outcomes within one Colorado district, leaves many important questions unanswered. Four of these warrant particular consideration.
First, to what extent will the benefits observed at the end of the pre-K year and at the beginning of kindergarten be maintained as children proceed through the early grades and beyond? In recent years, concern questions about the rapid “fade-out” of early childhood program effects have been a major concern among early childhood researchers and policymakers. Often, the benefits observed from ECE programs at school entry dissipate quickly as children progress through elementary school (Bassok et al., 2018). To get at the persistence of the effects documented in the current study, we are tracking the children in the current study as they proceed through at least the first 4 years of elementary school (and up to 6 years). In addition to the current cohort of children, we are tracking two additional cohorts of WPS children, who will also be randomly assigned to an offer of full- or half-day pre-K. By following these children through a minimum of third grade, we will be able to track whether the initial benefits fade out as children proceed through school.
Second, to what extent do the experimental findings documented in the current study—which focused on a predominantly Latinx, predominantly low-income sample—generalize to other contexts? Given the central role of replication in the accumulation of scientific knowledge, it essential to assess whether the findings documented in the current study replicate in other contexts (Duncan, Engel, Claessens, & Dowsett, 2014). Because there are so few non-Latinx children in the current sample (N = 26), we are unable to effectively compare estimated effects between White and Latinx students. Districts serving predominantly Latinx children may benefit differentially from full-day preschool programs. Existing research suggests that, in general, the benefits of preschool participation are greatest among Latinx children. The same may be true for full-day preschool relative to half day. It may be, for example, that for English language learners, a primary way in which more hours in preschool lead to better outcomes is by providing more hours of English language exposure. If this is a key mechanism, results may look different in communities with fewer English language learners, and future replications should measure the impact of full-day preschool in districts serving other populations of children. Such studies would inform whether policymakers might prioritize targeted or universal full-day expansions, and they may also inform the extent to which moving toward full-day programs may ameliorate achievement gaps.
Third, if full-day classrooms are effective in supporting young children’s learning, what specific practices and experiences are driving the benefits? Just as it is important to unpack the mechanisms that lead to benefits from ECE program participation broadly, it is essential to understand the specific pathways through which full-day programs lead to benefits. Two broad categories of mechanisms may be at play. First, it may be that full-day programs offer children more stimulating learning environments than they would otherwise experience. Second, benefits to children may operate through effects on families, such as increases in work hours and earnings or decreases in stress. For the second and third cohorts of this study, we are collecting data that will allow us to explore these possibilities. In particular, through multiple classroom observations throughout the year, we are collecting detailed information about the time use in full- and half-day classrooms, as well as the quality of teacher–child interactions as measured by the Classroom Assessment Scoring System (CLASS; Pianta, La Paro, & Hamre, 2008). We also supplement these observational measures with detailed parent surveys, which allow us to explore the potential impacts of full-day programs on parental employment and family well-being. These surveys will also provide us with detailed information about the counterfactual condition, highlighting how young children in half-day programs spend the out-of-school portions of their day.
Finally, it is essential to consider the magnitude of the benefits observed from full-day preschool in light of the program’s costs, and compared with other, potentially less expensive approaches to supporting ECE programs. Moving from half- to full-day preschool is a relatively costly policy, because half as many students can be accommodated by the same number of classrooms and teachers (a full-day classroom accommodates 16 students each day, and a half-day classroom accommodates 32). An intensive cost–benefit analysis is beyond the scope of the current article and planned for future work on this project. The various potential benefits, in particular, are difficult to monetize (Levin, McEwan, Belfield, Bowden, & Shand, 2017). However, to provide some sense of the cost side, WPS spends about US$4,180 additional amount per student to offer full day. In addition, districts in Colorado receive about US$4,400 per child from the Colorado Department of Education, and if the district serves fewer students due to offering full-day classrooms, they receive less of this funding.
Policy Implications and Conclusion
Although more research is certainly needed to examine exactly who benefits from more intensive ECE programs, on which outcomes, and through what mechanisms, the current study does provide the most compelling evidence available to date that a full-day, full-week preschool supports young children’s development, at least among a sample of primarily low-income, Latinx children. Our findings, coupled with the very high demand for full-day slots in this district, suggest that policy initiatives that provide greater access to full-day programs may be beneficial.
In recent years, the rapid fade-out of ECE program effects documented in several rigorous studies has led policymakers and researchers to ask how best to ensure that ECE programs yield meaningful and long-lasting effects. Many have suggested that focusing on children’s subsequent experiences in early elementary school is a critical strategy to better sustain the gains (Philips et al., 2017). Although the focus on sustaining environments is certainly worthy of further investigation, the current study also suggests the importance of also focusing on the preschool year itself, and strategies for making that experience as meaningful for young children as possible.
Through this deep dive into the impacts of one particular feature of ECE—program intensity—as well as through similar undertakings about other potentially central ECE features such as curricula, professional development, we will begin to provide policymakers with the kind of evidence necessary to make smart decisions not about whether or not to offer ECE programs but about how to design policies that yield meaningful and sustained impacts.
Footnotes
Appendix
Baseline Covariate Balance Comparison: Full Sample Versus Sample With Fall of Kindergarten DIBELS Exploratory Outcomes (Administered by District)
| Pretreatment covariate | Treatment group | Control group | Cohen’s d and sig. stars | |||||||||
|---|---|---|---|---|---|---|---|---|---|---|---|---|
| Full sample | Nonattrited | Full sample | Nonattrited | Full sample | Nonattrited | |||||||
| M | (N) | M | (N) | M | (N) | M | (N) | d | Sig | d | Sig | |
| % White | 11.4% | (114) | 10.3% | (78) | 11.6% | (112) | 11.5% | (61) | −0.006 | — | −0.038 | — |
| % Hispanic | 72.8% | (114) | 75.6% | (78) | 75.0% | (112) | 78.7% | (61) | −0.050 | — | −0.074 | — |
| % Home language not English | 48.2% | (112) | 47.4% | (78) | 49.0% | (102) | 51.7% | (58) | −0.016 | — | −0.085 | — |
| % Parent education > HS | 36.8% | (114) | 35.9% | (78) | 37.5% | (112) | 39.3% | (61) | −0.014 | — | −0.070 | — |
| % Free lunch eligible | 66.7% | (114) | 62.8% | (78) | 54.5% | (112) | 55.7% | (61) | 0.244 | — | 0.141 | — |
| % Unknown lunch status | 21.1% | (114) | 23.1% | (78) | 22.3% | (112) | 18.0% | (61) | −0.030 | — | 0.130 | — |
| % Red lunch eligible | 11.4% | (114) | 12.8% | (78) | 14.3% | (112) | 19.7% | (61) | −0.082 | — | −0.171 | — |
| % Male | 48.2% | (114) | 48.7% | (78) | 49.1% | (112) | 54.1% | (61) | −0.017 | — | −0.107 | — |
| % With family history of special needs | 17.5% | (114) | 21.8% | (78) | 16.1% | (112) | 13.1% | (61) | 0.040 | — | 0.245 | — |
| % With low language development | 24.6% | (114) | 21.8% | (78) | 21.4% | (112) | 24.6% | (61) | 0.076 | — | −0.064 | — |
| % With low social development | 37.7% | (114) | 34.6% | (78) | 35.7% | (112) | 39.3% | (61) | 0.042 | — | −0.096 | — |
| Child’s age (in years) | 4.34 | (114) | 4.34 | (78) | 4.38 | (109) | 4.33 | (59) | −0.124 | — | 0.019 | — |
| PPVT PK fall standard score | 0.027 | (111) | 0.072 | (78) | −0.034 | (104) | −0.193 | (59) | 0.061 | — | 0.215 | — |
| ESI-R PK fall total score | 0.084 | (111) | 0.211 | (78) | −0.093 | (104) | −0.002 | (59) | 0.178 | — | 0.213 | — |
Note. We use logistic regression for binary outcomes. “Full sample” refers to all study participants originally assigned to each treatment group. The “Nonattrited” sample refers to study participants who are observed with DIBELS test scores in the fall of kindergarten, — for not sig (p > .10), + for p < .10, * for p < .05, ** for p < .01, and *** for p < .001. We conduct a multivariate regression model for all 14 dependent variables, predicted by treatment status. For full study sample: F(15, 204) = 1.28, Prob > F = .215, for nonattrition study sample: F(15, 134) = 1.03, Prob > F = .430. DIBELS = Dynamic Indicators of Basic Early Literacy Skills; Sig = significant; HS = high school; PPVT = Peabody Picture Vocabulary Test; PK = pre-K; ESI-R = Early Screening Inventory–Revised.
Declaration of Conflicting Interests
The author(s) declared no potential conflicts of interest with respect to the research, authorship, and/or publication of this article.
Funding
The author(s) disclosed receipt of the following financial support for the research, authorship, and/or publication of this article: This research was funded by Westminster Public School District. We thank them for their generous support. All errors are solely attributable to the authors.

Notes
Authors
ALLISON ATTEBERRY is assistant professor in research and evaluation in the School of Education at the University of Colorado Boulder. Her research focuses on policies and interventions that are intended to help provide effective teachers to the students who need them most.
DAPHNA BASSOK is associate professor of education and public policy at the University of Virginia. Her research focuses on early childhood education policy.
VIVIAN C. WONG is associate professor of research, statistics, and evaluation in the Curry School of Education at the University of Virginia. Her research focuses on methodological issues related to causal inference and evaluating interventions in early childhood and K–12 systems.