
Abstract
Over half of community college students place into developmental education, resulting in significant financial costs. We extend previous research demonstrating that using placement tests to assign students into developmental courses results in frequent misplacement. We use Florida data to explore the extent to which students are misplaced into their first college course by more than one level. Results suggest that moving away from placement tests and toward other metrics (like high school grade point average [GPA]) may not be as beneficial in Florida as was demonstrated in prior studies. Rather, it may be preferable to choose cutoffs that minimize misplacement than to use new metrics. States should consider their own unique contexts and examine whether they can improve placement accuracy by changing cut scores.
Keywords
Despite the high costs of DE and the evidence questioning its effectiveness (Valentine, Konstantopoulos, & Goldrick-Rab, 2017), DE enrollment rates remain high. A series of studies from the Community College Research Center (Belfield & Crosta, 2012; Scott-Clayton et al., 2014; Scott-Clayton, 2012) found the use of college placement tests to assign students to DE led to frequent placement errors. Some students are overplaced into for-credit courses in which they are predicted to fail; likewise, there are also a substantial number of students who are underplaced into DE courses when they likely could have passed for-credit courses. Although the studies from the Community College Research Center were conducted in limited contexts that may not be generalizable to other states or placement exams, the findings have been influential in policy recommendations, encouraging the nationwide use of multiple measures for college course placement (i.e., Education Commission of the States, 2016). There is a need for further research on placement accuracy to determine whether the findings replicate in other settings and in different policy contexts, such as one where colleges offer multiple levels of DE courses.
Responding to the need for further research on placement accuracy, we examine how well placement exams predict college success using data from the State of Florida. Several unique factors differentiate Florida from the contexts of prior studies. First, Florida Department of Education staff worked with McCann Associates to develop Florida’s Postsecondary Education Readiness Test (PERT), which was aligned with both the state K–12 standards and Postsecondary Readiness Competencies. This state-specific alignment of the placement test to the standards could potentially lead to improvements in predictive power over national placement tests that may not be as closely aligned with any local context. Second, the state required that the PERT be used by all public state colleges, using identical cutoffs, for placement into initial courses. This requirement resulted in a large statewide sample with a diverse set of institutions. Third, during the timeframe of this study, the state was implementing the Florida College and Career Readiness Initiative (FCCRI), which required all mid-performing high school students to take the PERT in Grade 11. Students who scored below college-ready were required to take math or English college readiness courses in Grade 12. This policy allows us to further examine how well early assessment in high school can predict future college success.
Our approach builds on the work of Scott-Clayton et al. (2014) who study the severe error rate (SER). The SER considers the share of students predicted to earn a B or better in for-credit courses but placed into DE (underplacement) and the share of students placed into for-credit courses but predicted to fail (overplacement). This error rate is referred to as “severe” because it represents clear error in placement. In our study, we also examine how often students are misplaced by more than one level, as Florida places students into lower and upper level DE. Consideration of multiple levels of DE is important because policy implications depend on where both cutoffs are relative to one another. Either cutoff can act as a constraint on the other because the cutoff for college-level courses cannot be set below the cutoff for upper DE courses.
We find that using exam scores alone, students tend to be overplaced in math but underplaced in English. In both subjects, eliminating placement into upper DE would minimize misplacement. This suggests that very few Florida students would benefit from taking a single DE course. Instead, most students are either so far behind that they likely need two courses to catch up or they are prepared enough to go directly into college-level courses. Using high school transcript data can reduce misplacement, but not as much as adjusting test cutoffs values to minimize overplacement and underplacement rates (e.g., reducing the current cutoff of 85 for upper level DE English to 65).
Our study makes several important new contributions to the literature. First, we provide a way to conceptualize calculating error within a system with two placement cutoffs by incorporating the extent to which students are doubly underplaced or overplaced (e.g., when a test score places a student in a for-credit course, but that student would be likely to fail not only that course but even a course one level less challenging). Many colleges offer multiple levels of DE courses, so it is important to look beyond assessing error at only one cutoff. Second, our results suggest that moving away from placement tests and toward other metrics (like high school grade point average [GPA]) may not be as clearly beneficial in Florida as it is in the context of prior studies. Instead, our results suggest that it may be better to adjust placement cutoffs so as to minimize misplacement error than to place students using new metrics, particularly in math. As a result, states should consider their own unique contexts and examine whether they can improve placement accuracy by changing cut scores before rushing to make more dramatic changes to placement policies like eliminating placement tests or developing complicated placement algorithms with multiple measures. Context is important because placement accuracy may depend on multiple factors including the characteristics of students being tested, the reliability and validity of the placement test, the content of the placement test, and how well this content aligns with college courses taken by students. Third, our findings indicate that SERs are dependent on the testing context, including the test type and the cutoffs. This has implications for policymakers considering abandoning placement testing or DE courses, as they may be better off examining the accuracy and error of their current placement policies before making significant changes. Finally, our study examines how taking the placement test in high school (rather than upon college entry) may affect the accuracy of placement predictions. These results should be interpreted with caution because many students in our sample did not retake the PERT upon college entry. Nevertheless, we provide preliminary evidence on an important placement issue with implications for policymakers as states move toward early assessments and other college-readiness interventions.
Literature Review
It is important to accurately assign students to college courses because placement decisions will likely impact students’ future college success. Valentine et al. (2017) examined the effects of placement into DE courses at community colleges and 4-year universities. They conducted a meta-analysis of DE regression discontinuity studies and found students narrowly assigned to DE performed significantly worse than their nondevelopmental peers on multiple outcomes, including pass rates of gateway courses and degree completion rates. Other research, though, suggests that, even though overall effects of DE tend to be negative, there may be some positive effects for students with lower levels of academic preparation (Boatman & Long, 2018).
A review of the literature on college entrance exams indicated high school GPA was a stronger predictor of college grades and 4-year graduation rates, even though grading standards varied by school (Atkinson & Geiser, 2009). Another review of the literature on grading found that high school grades more consistently predicted postsecondary enrollment, persistence, and degree completion than standardized tests (Brookhart et al., 2016). Despite promising evidence on the predictive validity of high school grades, there are some concerns that high school grades are subject to grade inflation and may not reflect the skills needed for college-level work. For example, McCormick and Lucas (2011) found that most secondary math teachers think they are covering appropriate material to prepare students for college, whereas the majority of college professors believe students come to college unprepared for college-level math courses. Compared with high school grades, a placement test may provide a more objective measure of college readiness that is more closely aligned with the skills needed for college-level courses.
Although most assessment studies have focused on the ACT or SAT, several have examined the accuracy of community college placement tests. Belfield and Crosta (2012) used data from a statewide community college system to examine the association between COMPASS and ACCUPLACER placement scores and DE course grades, college GPA, credits earned, and success in gatekeeper math and English courses. The study resulted in weak associations between placement scores and most outcomes, although high school GPA had stronger associations, particularly with college GPA and credits earned. Other high school transcript data (i.e., number of high school math and English courses, number of honors courses, number of F grades, and number of credits) did not improve predictive power.
In a related working paper, Scott-Clayton (2012) evaluated the predictive validity of COMPASS in a large, urban community college system. Results from this study suggested that placement test scores were likely to misplace significant numbers of students, particularly in English. Yet, in this study, the addition of indicators for high school achievement and student background characteristics was more likely to reduce severe misplacement.
Scott-Clayton et al. (2014) extended Belfield and Crosta’s (2012) and Scott-Clayton’s (2012) analyses by examining the accuracy of students placed into DE and for-credit courses, using COMPASS and ACCUPLACER data. They calculated the SER as the proportion of students predicted to earn a B or better in for-credit courses but placed into DE (underplacement) plus the proportion placed into for-credit courses but predicted to fail (overplacement). Approximately one in four students were severely misplaced in math and one in three in English. By using high school transcript data, it is predicted that colleges could reduce misplacement by up to 30%, with little benefit from adding test scores to transcript data. The authors posited that transcript data might be more accurate because placement tests tend to be short in duration, provide noisy measures, and may not cover all skills needed for college success (Scott-Clayton et al., 2014).
Different types of placement tests may have different accuracy. Ngo and Melguizo (2015) used the same methods as Scott-Clayton et al. (2014) to calculate the SER before three colleges in a California community college district switched from a diagnostic assessment to a computer-adaptive test for math placement and after they switched assessments. The researchers found the SER was higher with the computer-adaptive test and concluded that diagnostic tests may improve placement accuracy relative to more commonly used computer-adaptive tests. However, computer-adaptive tests tend to be more cost effective and take less time to administer.
Placement policies also need to define how test scores are used in determining college readiness. Score cutoffs are often set by college or state agency employees with little knowledge about which tests most effectively place students, how to evaluate cutoffs, and which measures can address tests’ shortcomings (Melguizo, Kosiewicz, Prather, & Bos, 2014). Students are therefore placed into courses that do not align with their actual level of readiness.
Given that decisions about setting placement score cutoffs are usually ill-informed, there is likely much variation across colleges in how well cutoffs assign students to the appropriate course levels. Most research to date on DE placement accuracy has been limited to small samples of community colleges, and replication studies are needed to understand whether their results are generalizable to other settings. Furthermore, these studies have all examined placement policies where there is a single level of DE, even though many community colleges provide two or more levels of DE classes in each subject. Our study provides a unique opportunity to use data from an entire college system in a large and diverse state with multiple levels of DE to inform the debate about how to improve placement accuracy in different contexts.
Context of This Study
In Florida, DE is provided almost exclusively by 28 public community colleges, which are referred to as state colleges. Florida’s placement policies have evolved over time. To provide context for the study, we describe the placement policies affecting students in our sample who were enrolled in Grade 11 in 2011/2012, Grade 12 in 2012/2013, and any state college in Fall 2013.
Florida state colleges use the Postsecondary Education Readiness Test (PERT), a computer-adaptive test of reading, writing, and math with 30 items on each section. The PERT determines college course placement using scale scores from 50 to 150. Students scoring below a fixed cutoff are required to take lower and upper DE, those scoring above this cutoff but below another cutoff are required to take upper DE, and those scoring above both cutoffs are labeled “college ready” and placed into for-credit courses.
Under the FCCRI, the PERT became mandatory in 2011/12 for Grade 11 students with midrange scores on the Grade 10 Florida Comprehensive Achievement Test (FCAT) in math or reading. Students not meeting college-ready cutoffs on the PERT were required to enroll in a Grade 12 College Readiness and Success (CRS) course in the corresponding subject area. Students who completed CRS courses in high school had to retake the PERT and earn college-ready scores to enroll in for-credit college courses. Retesting could occur any time prior to college matriculation; some high schools offered PERT retesting at the end of CRS courses, but they were not required to do so. Students were given information about the college-ready cut scores on the PERT and their performance, which may have provided motivation to retest.
Research Questions
We build on previous studies examining how well college placement exams predict college success, using the State of Florida as a new context. We extend prior research by considering Florida’s use of separate cutoffs for upper DE and for-credit courses, as well as the timing of test scores taken by students in high school and college. We also assess the extent to which placement cutoffs in our data reflected consistent policy preferences. Specifically, we address the following four questions:
Data
Our data consist of student records in Florida’s K–20 Education Data Warehouse. We restricted our analysis to students who first enrolled in Grade 11 during 2011/2012 and seamlessly enrolled in a state college in 2013/2014. This was the first cohort widely exposed to the PERT in high school. Students who took the PERT in Grade 11 were assigned to CRS courses in Grade 12 if they scored below 113 in math or 104 in English. In college, students were assigned to lower DE in math if they scored below 96 and upper DE if they scored below 113; they were assigned to lower DE in English if they scored below 85 and to upper DE if they scored below 104. We omit students missing FCAT or PERT scores, high school GPAs, or demographic data.
We use both first PERT scores and highest PERT scores in our probits. High PERT scores earned early in high school may underestimate true ability at college enrollment. Including an indicator for when high scores were achieved should mitigate this source of bias. If scores on retests do not reflect student ability, including first scores will account for this potential bias. Not all students retested; approximately 28% of students with math and reading PERT scores had only tested once in each subject.
Cumulative high school GPAs (overall and by subject) were computed on a 4.0 scale. Due to limitations in the way high schools report transcript data to the state, less than 3% of grades included pluses or minuses. Because of this, we ignored plus and minus values, which may lower the predictive power of GPA. Outcome values are grades from students’ first postsecondary courses in math and English.
Table 1 shows summary statistics of student characteristics. There were 151,391 students with demographic and GPA data who began Grade 11 in Florida public high schools during the 2011/2012 school year. Of these students, 26.6% seamlessly enrolled in a 2-year college in Fall 2013. They were disproportionately female, non-White, free or reduced-price lunch (FRPL) eligible, and/or current or former English language learner (ELL) students with slightly higher grades than the overall cohort. Seamless enrollees who took both PERT subjects were like those who took either, as few took the test in just one subject. However, the share of math PERT takers placed in DE math was greater than the share of reading PERT takers placed in DE English. Mokher, Leeds, and Harris (2018) found no evidence that assignment to take the PERT or enroll in a CRS course affected college enrollment or performance for students near the college readiness cutoff.
Summary Statistics of Student Characteristics by Sample
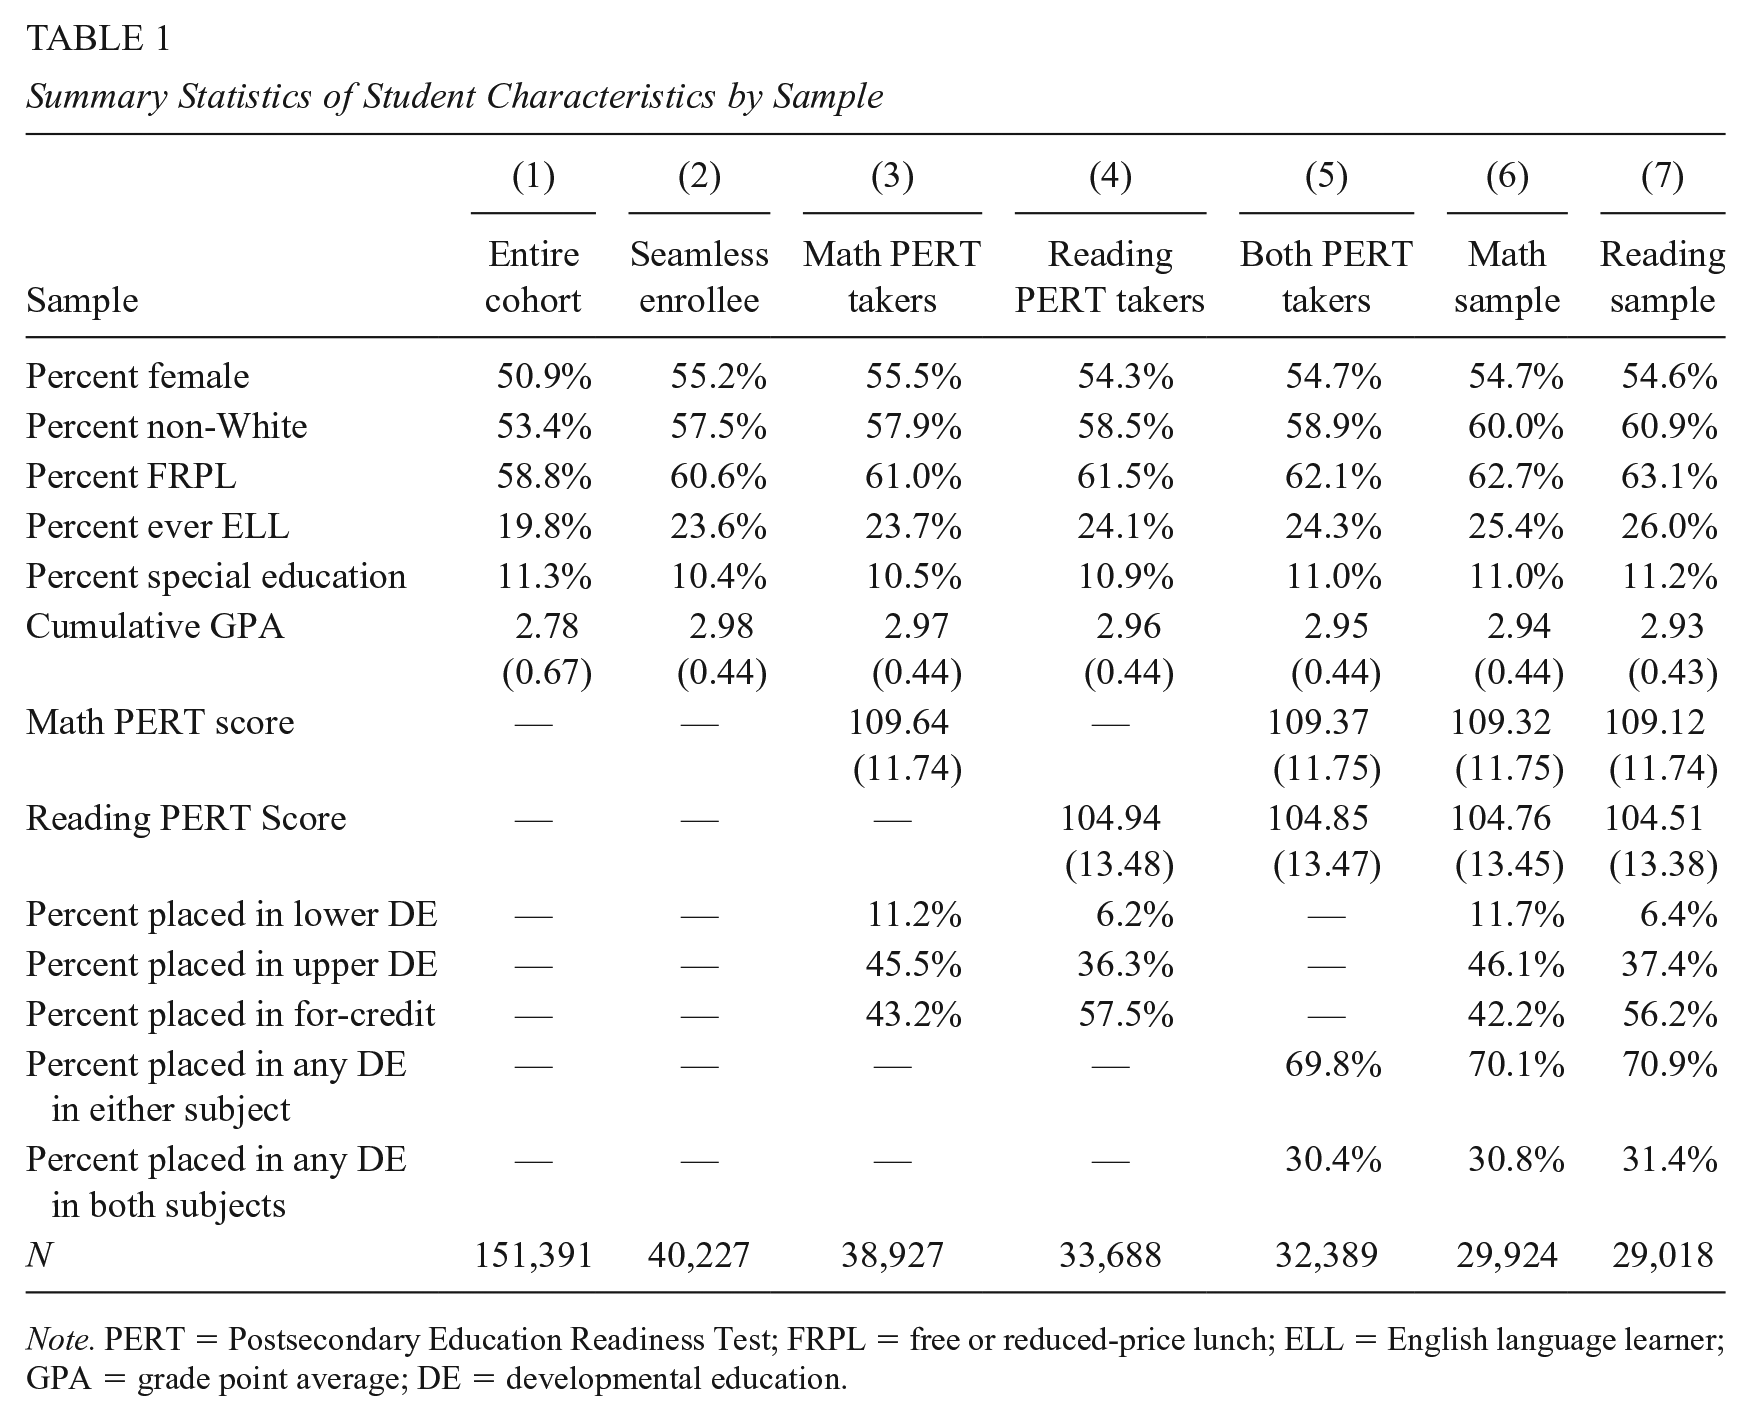
Note. PERT = Postsecondary Education Readiness Test; FRPL = free or reduced-price lunch; ELL = English language learner; GPA = grade point average; DE = developmental education.
Some students were dropped from the final samples because covariates perfectly predicted success or failure. Two small colleges that listed almost no students in DE math courses were also dropped from all analyses because their inclusion could harm the interpretability of our results. Final sample sizes were 29,924 for math and 29,018 for English.
Analytical Models
To address the research questions, we set up logit models to simulate placement policy and predict misplacement rates. We first used a model with one cutoff between DE and for-credit courses (following Scott-Clayton et al., 2014) to predict misplacement rates at each cutoff value. Then, to reflect Florida’s two DE levels, we used a model with one cutoff between lower DE and upper DE and another between upper DE and for-credit courses. This model was designed to predict both the direction and degree of misplacement at each combination of cutoffs.
Cutoffs should minimize some combination of overplacement and underplacement. Scott-Clayton et al. (2014) proposed minimizing their unweighted sum, which they refer to as the SER. Lowering a placement cutoff will reduce underplacement but increase overplacement, while raising the cutoff will do the opposite. Minimizing the SER therefore means setting marginal overplacement equal to marginal underplacement. 1
Focusing only on the difference between DE and for-credit courses ignores some types of misplacement. As students in lower DE must complete more requirements than those in upper DE before taking for-credit courses, they are at greater risk of dropping out. Although some students may require the extra support provided in lower DE, those who do not require the additional support should not face the time and financial costs associated with taking an extra DE course. There are multiple ways in which students may experience greater harm from assignment to lower level DE courses instead of a single upper level DE course. For example, assignment to lower level DE courses can increase both cost and time to completion for students and can lead to greater discouragement, which may increase the risk of dropout or negatively impact course performance. Because of this, we examined cutoffs for both upper DE and for-credit courses.
Using a metric such as GPA percentile instead of the PERT may also lower the SER. More accurate placement metrics may reduce both overplacement and underplacement, a Pareto im-provement over the current system. We considered both the SER with the DE placement rate held fixed and the minimum SER under each metric. 2 Doing this allowed us to separate the effects of a new assignment mechanism from the effects of using each optimally.
We proceed our discussion of misplacement by more than one level by briefly introducing the model that underpins our data. We then explain the numeric approach that we used to apply this model to our data. Figure 1 illustrates a hypothetical double-cutoff model whereby vertical lines represent the math cutoffs used in Florida at the time of placement for the students in our sample. One cutoff was between lower DE and upper DE, and the second cutoff was between upper DE and for-credit courses. The four functions plotted on the graph represent the probabilities of particular outcomes in particular course levels. For ease of exposition, Figure 1 treats these as continuous functions of students’ PERT scores; we relaxed the continuous function assumption for our numeric estimates. Here,

Hypothetical example of placement accuracy graph.
Six regions in Figure 1 represent misplacement:
Region C contains students placed in lower DE but predicted to get a B or better in for-credit courses. These students are double underplaced, as they are misplaced by two course levels.
Region B contains students placed in lower DE but predicted to get a B or better in upper DE. These students are single underplaced.
Region F contains students placed in upper DE but predicted to get a B or better in for-credit courses. These students are single underplaced.
Region D contains students placed in upper DE predicted to fail those courses. These students are single overplaced.
Region H contains students placed in for-credit courses predicted to fail those courses. These students are single overplaced.
Region G contains students placed in for-credit courses predicted to fail upper DE. These students are double overplaced.
The SER is minimized by minimizing these six regions (see Supplemental Appendix A, available in the online version of this article, for derivation); students in regions A, E, and I are accurately placed. The key insight provided by this model is when minimizing the SER—that is, if all misplacement is equally bad, regardless of degree or direction—then marginal single underplacement should equal marginal single overplacement at each cutoff. This is because, for example, lowering the cutoff for upper DE moves nearby students from region A into region D (increasing the SER) and from region B into region E (lowering the SER); however, those in region C would move to region F, where they would still be misplaced. As some forms of misplacement may be worse than others, we expand the model later in this section; by doing so, we hope to illustrate both the implications of the current cutoffs in each subject and how they might be adjusted to fit a given set of policy preferences.
Placement Accuracy
Because the probability of getting a particular grade in a certain course level may not be a smooth function of one’s PERT score, we used numeric methods to compute the SER at each possible cutoff value. Although we ran regression analyses to do so, we were less interested in specific parameter estimates than in the predicted performance of students at each possible test score, GPA value, or other possible cutoff. By computing the expected SER at each possible cutoff value, we were able to select the one that minimized the SER.
We used a probit (following Scott-Clayton et al., 2014) to estimate the probability that a student received a B or better in or failed a given course; those who received a B or better clearly did not need additional preparation, while those who failed did. 4 Students predicted to receive Cs did not count toward either outcome. Unlike Scott-Clayton et al. (2014), we treated Ds as failure, as they rarely satisfy prerequisites or receive credit. We believe the decision to treat Ds as failure was more appropriate for the policy context in Florida given that students must receive a minimum grade of C in the gateway math and English courses to fulfill the requirements for an associate degree. However, online Supplemental Appendix D includes a sensitivity analysis of placement accuracy using a grade of D of passing instead of C. 5
Probabilities were estimated as

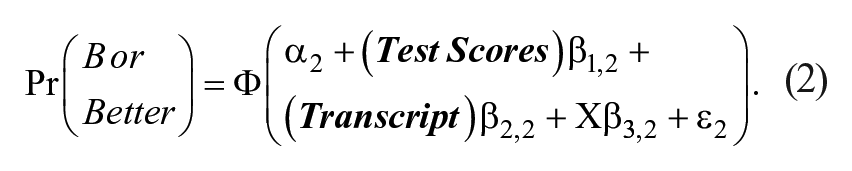
Given that Florida pursued a strategy of early assessment and implemented CRS courses to help more students test college-ready prior to college enrollment, the timing of the PERT scores may have important implications. It is possible that CRS courses and the opportunity to retest may have reduced certain types of placement errors that otherwise would have occurred if placement were based only on the first PERT score. Furthermore, score usage policy itself may have affected how students approached the PERT. For example, if students knew there was an option to retake the PERT, they may have been less concerned about performing well the first time. This means the first PERT scores that we observed in the data may have been lower than they would have been if students could not retest. Therefore, even though we could have used existing data to explore differences in predictive validity under alternative testing policies, we did not use that data and therefore our results did not perfectly account for behavioral effects of different policies on retesting and placement.
Following our research questions, we sought to examine the extent to which students were accurately placed into DE courses based on their PERT scores and whether accuracy could have been improved by using different cutoffs, different metrics, or different sets of test scores for re-testers. We first computed the optimal SER using a single-cutoff model to show how our context differed from the one in Scott-Clayton et al. (2014) and to illustrate the implications of switching to a double-cutoff model. Scott-Clayton et al. computed the SER for a single cutoff between DE and for-credit (FC) courses as

We expanded on the Scott-Clayton et al. (2014) analysis by computing the SER when cutoffs separate lower DE, upper DE, and for-credit courses, since Florida used cutoffs for each level. We examined how the results changed when accounting for these cutoffs by computing:
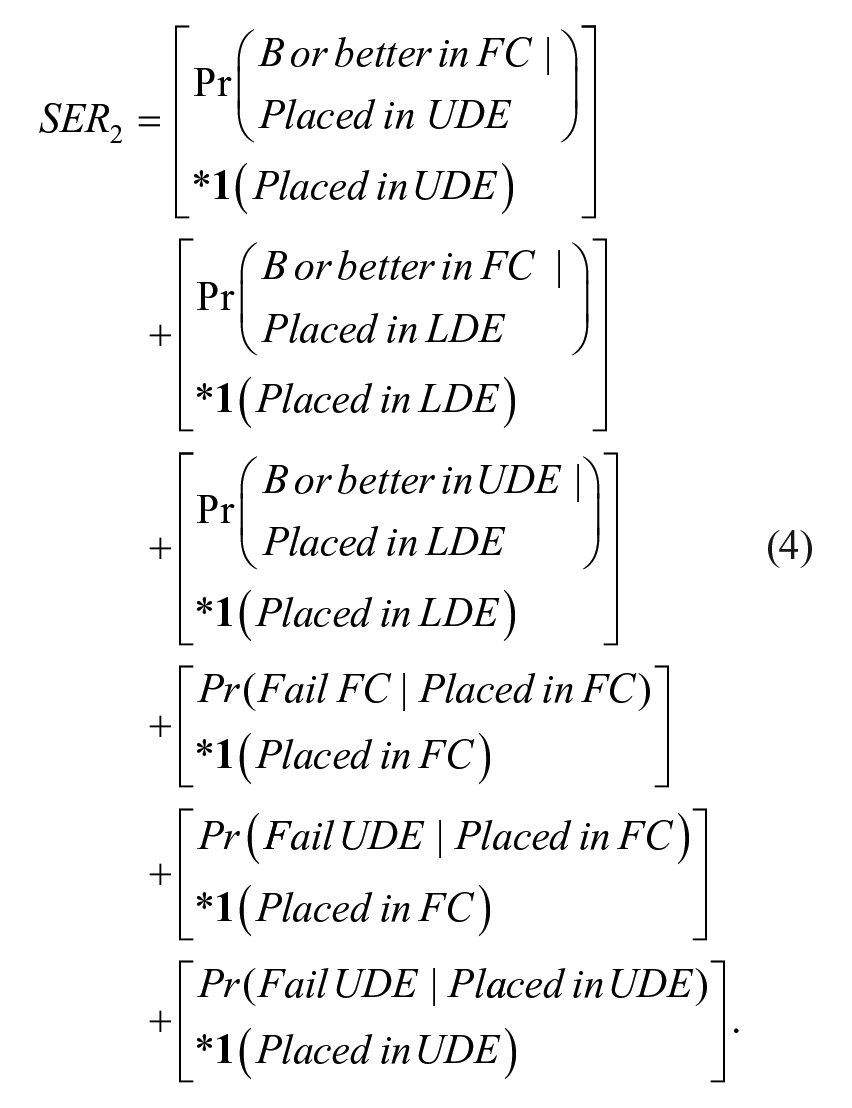
We used predicted values from probit regressions to compute
We computed probabilities of success in each course level using students placed in that level, as compliers and noncompliers may be systematically different. 7 In both single and double-cutoff models, probit regressions for performance in for-credit courses therefore contained only students who were both placed in and took those courses; parameter estimates were used to predict probabilities for all other students. In the double-cutoff model, we estimated parameters for upper DE students using those who were placed in and took upper DE and then extrapolated to all other students. We focused on compliers for three reasons. First, most students complied with placement. Table 2 sorts seamless 2-year enrollees (those who enrolled in college by the fall after high school graduation) by placement and first-year enrollment. In both subjects, compliance was highest for students placed into for-credit courses (over 90%). Although fewer students took math than English, those who took math were more likely to comply with course assignment at each level.
Student Course Placement Compared With Actual Courses Taken in Math (Top) and English (Bottom)
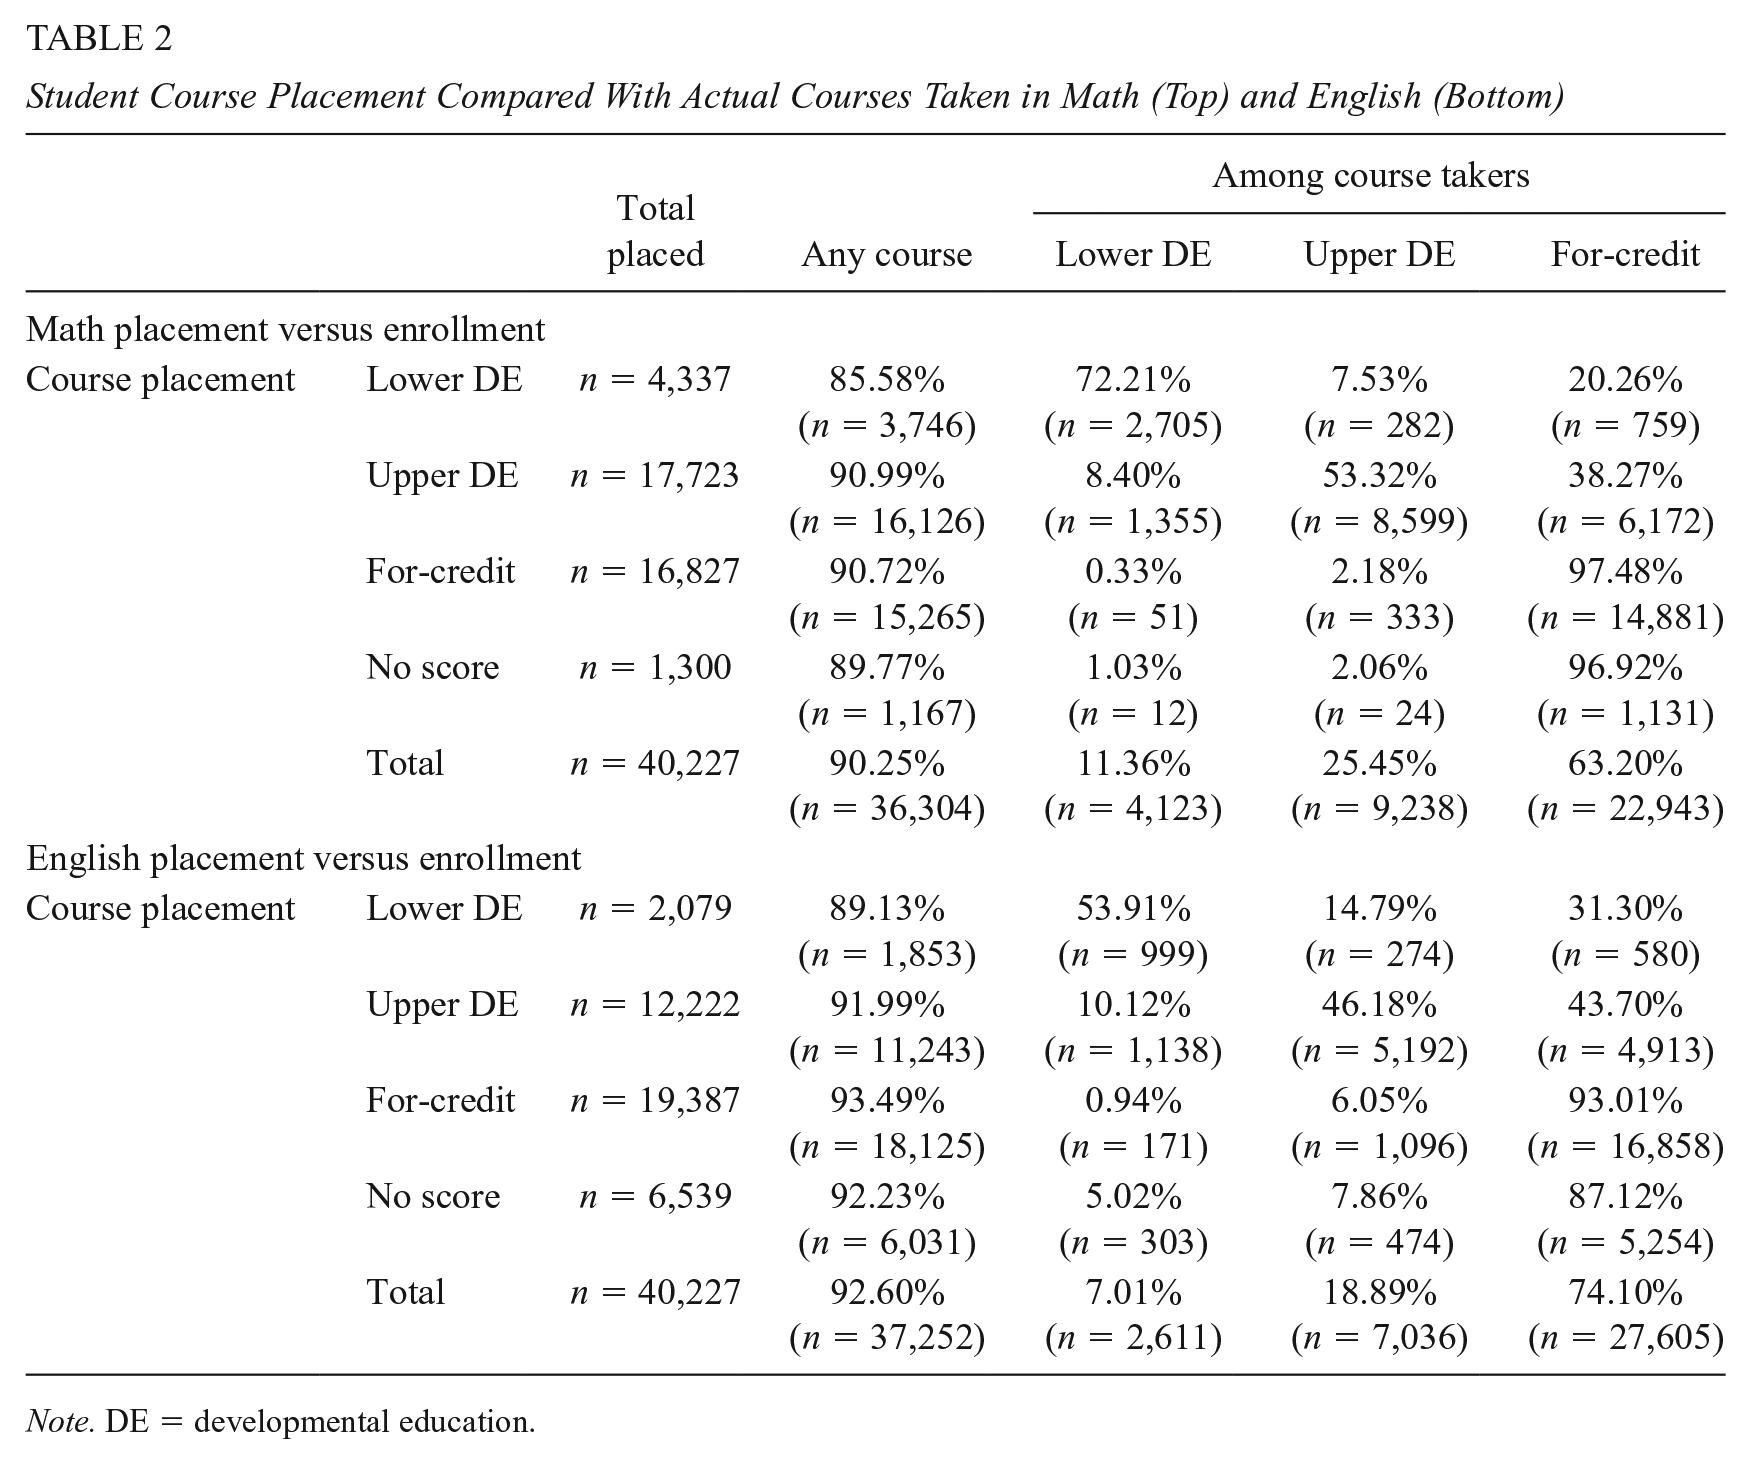
Note. DE = developmental education.
Second, many students who did not comply with course placement likely had concordance scores on the SAT or ACT (not included in our data) that allowed them to enroll directly into for-credit courses regardless of their PERT scores. Concordance scores were subject to separate policies, which should be adjusted independently. However, the predictive validity of our model may have been weaker as we did not have the data to adjust for these scores. Third, we cannot say which observed compliers would have complied with new policies.
Relaxing Model Assumptions Based on Policymaker Preferences
Policymakers should not minimize the SER if some forms of misplacement are perceived to be more harmful than others. Being double misplaced may result in greater discouragement and less learning than being single misplaced, and being overplaced could be worse than being underplaced (e.g., because failing a course has negative repercussions) or vice versa (e.g., if DE placement leads to lower persistence levels). Once these harm levels are known, placement cutoffs should be set to reflect them. A more flexible model can illustrate both how relative harms should affect policy and whether the placement cutoffs in our data reflected consistent policy preferences.
We therefore consider a model (formally presented in the online Supplemental Appendix A.2) in which double misplacement (in either direction) is worse than single misplacement by amount
Limitations
Our findings are subject to several limitations. First, our sample is limited to high school students who seamlessly enrolled in college. Many community colleges have large populations of nontraditional students who have been out of school for several years or longer before enrolling in college. The results for misplacement might be quite different depending on student characteristics such as age and number of years since high school graduation. Second, our sample is limited to students who attended a Florida state college. The results may not be generalizable to 4-year universities or other states, particularly if different placement tests are used that are not as closely aligned to state standards. Third, the analysis relies on out-of-sample predictions of course outcomes using data on students who complied with the placement policy and enrolled in college-level courses (for either model) or upper DE courses (for the double-cutoff model). These models will be invalid if compliers poorly predict counterfactual course outcomes for students with other limitations. This is a common issue among other prior studies on this topic area of placement test accuracy.
In particular, extrapolation out of the sample could lead to biased estimates for students with other placements and result in their placement into courses too demanding or insufficiently challenging for their ability levels. We addressed this in two ways, following Scott-Clayton et al. (2014). First, although we did not have psychometric data, the standard deviation of PERT scores showed that at an exam reliability of 0.9 (on par with the SAT or ACT) the standard error of measurement was 4.6 in math and 5.1 in reading. Thus, if a student received a score of 104 in math, we could not put her with 95% confidence in any course level; similarly, if a student received a score of 95 in English, we could not with statistical confidence put him in any course level. If reliability was 0.7 (on par with a well-designed classroom exam), we would barely be confident that a student at the college readiness cutoff in either subject does not belong in lower DE. Although extrapolation far from each subject’s course level cutoffs may therefore require a degree of caution, extrapolation near either cutoff is unlikely to introduce noticeable bias. Even if extrapolation far from course-level cutoffs were completely unreliable, results close to the cutoffs would be useful in telling us the direction in which each cutoff should be shifted. Therefore, to both show that results are not driven by extreme outliers and illustrate that the directions of our findings are unchanged, we also conducted analyses omitting the top and bottom 1% of PERT scores among seamless enrollees. Results of these analyses (available on request) were similar to those presented here. 8
Results
We begin by graphing probabilities of success by course level and subject. Next, we discuss SER-minimizing metrics and cutoffs under a single-cutoff model. We then present analogous results for a double-cutoff model. We finish by discussing what actual cutoffs would reveal about perfectly rational policymakers and how policy preferences might affect outcomes.
Predicted Probabilities of Success and Failure by Course Level
Figure 2 shows predicted probabilities of course outcomes by PERT scores. In both subjects, probabilities increase noisily with PERT scores. Receiving a B or better in upper DE is generally more likely than in a for-credit course; the same holds for passing. However, some students are more likely to pass a for-credit course than get a B or better in upper DE, and very low-scoring students are more likely to pass a for-credit course than upper DE. These findings largely support our assumption that a given performance level will be harder to achieve in a for-credit course than in an upper DE course.

Results for the predicted probabilities of course performance by PERT scores in math (top) and reading (bottom).
Students with low math scores were unlikely to pass upper either DE or for-credit courses. Probabilities of success in upper DE increase rapidly and plateau at a probability of one, while probabilities in for-credit courses increase more gradually. Students barely assigned to upper DE in math had less than a 40% probability of passing; however, those who narrowly missed assignment to for-credit courses had nearly a 90% probability of passing upper DE and a 70% probability of receiving an A or B. Students narrowly assigned to for-credit courses had a 60% probability of passing and a 35% probability of receiving an A or B. In English, there were only two PERT scores at which students were more likely to fail for-credit courses than to pass. Nearly three quarters of students at the upper DE cutoff would have passed a for-credit English course, and half would have earned an A or B. Thus, many students were underplaced in English.
Single-Cutoff Model
We first present results for a single-cutoff model, in which policymakers do not differentiate between upper and lower DE. This both provides a baseline for the double-cutoff model and allows us to determine whether differences between our results and the Scott-Clayton et al. (2014) study are attributable to the model or to policy contexts and data sets.
In Table 3, the columns show six placement metrics: highest PERT score, highest FCAT score, high school GPA within subject, overall high school GPA, all high school data (GPA, credits attempted, number of honors or AP courses taken, and number of courses failed, computed overall and by subject), and all high school data plus PERT scores. For the last two measures, grades in for-credit courses (on a 4.0 scale) were regressed on components of that measure and predicted out-of-sample, and students were sorted into percentiles.
Results for Minimizing the SER Using Different Placement Metrics Under a Single Cutoff Model in Math (Top) and English (Bottom)
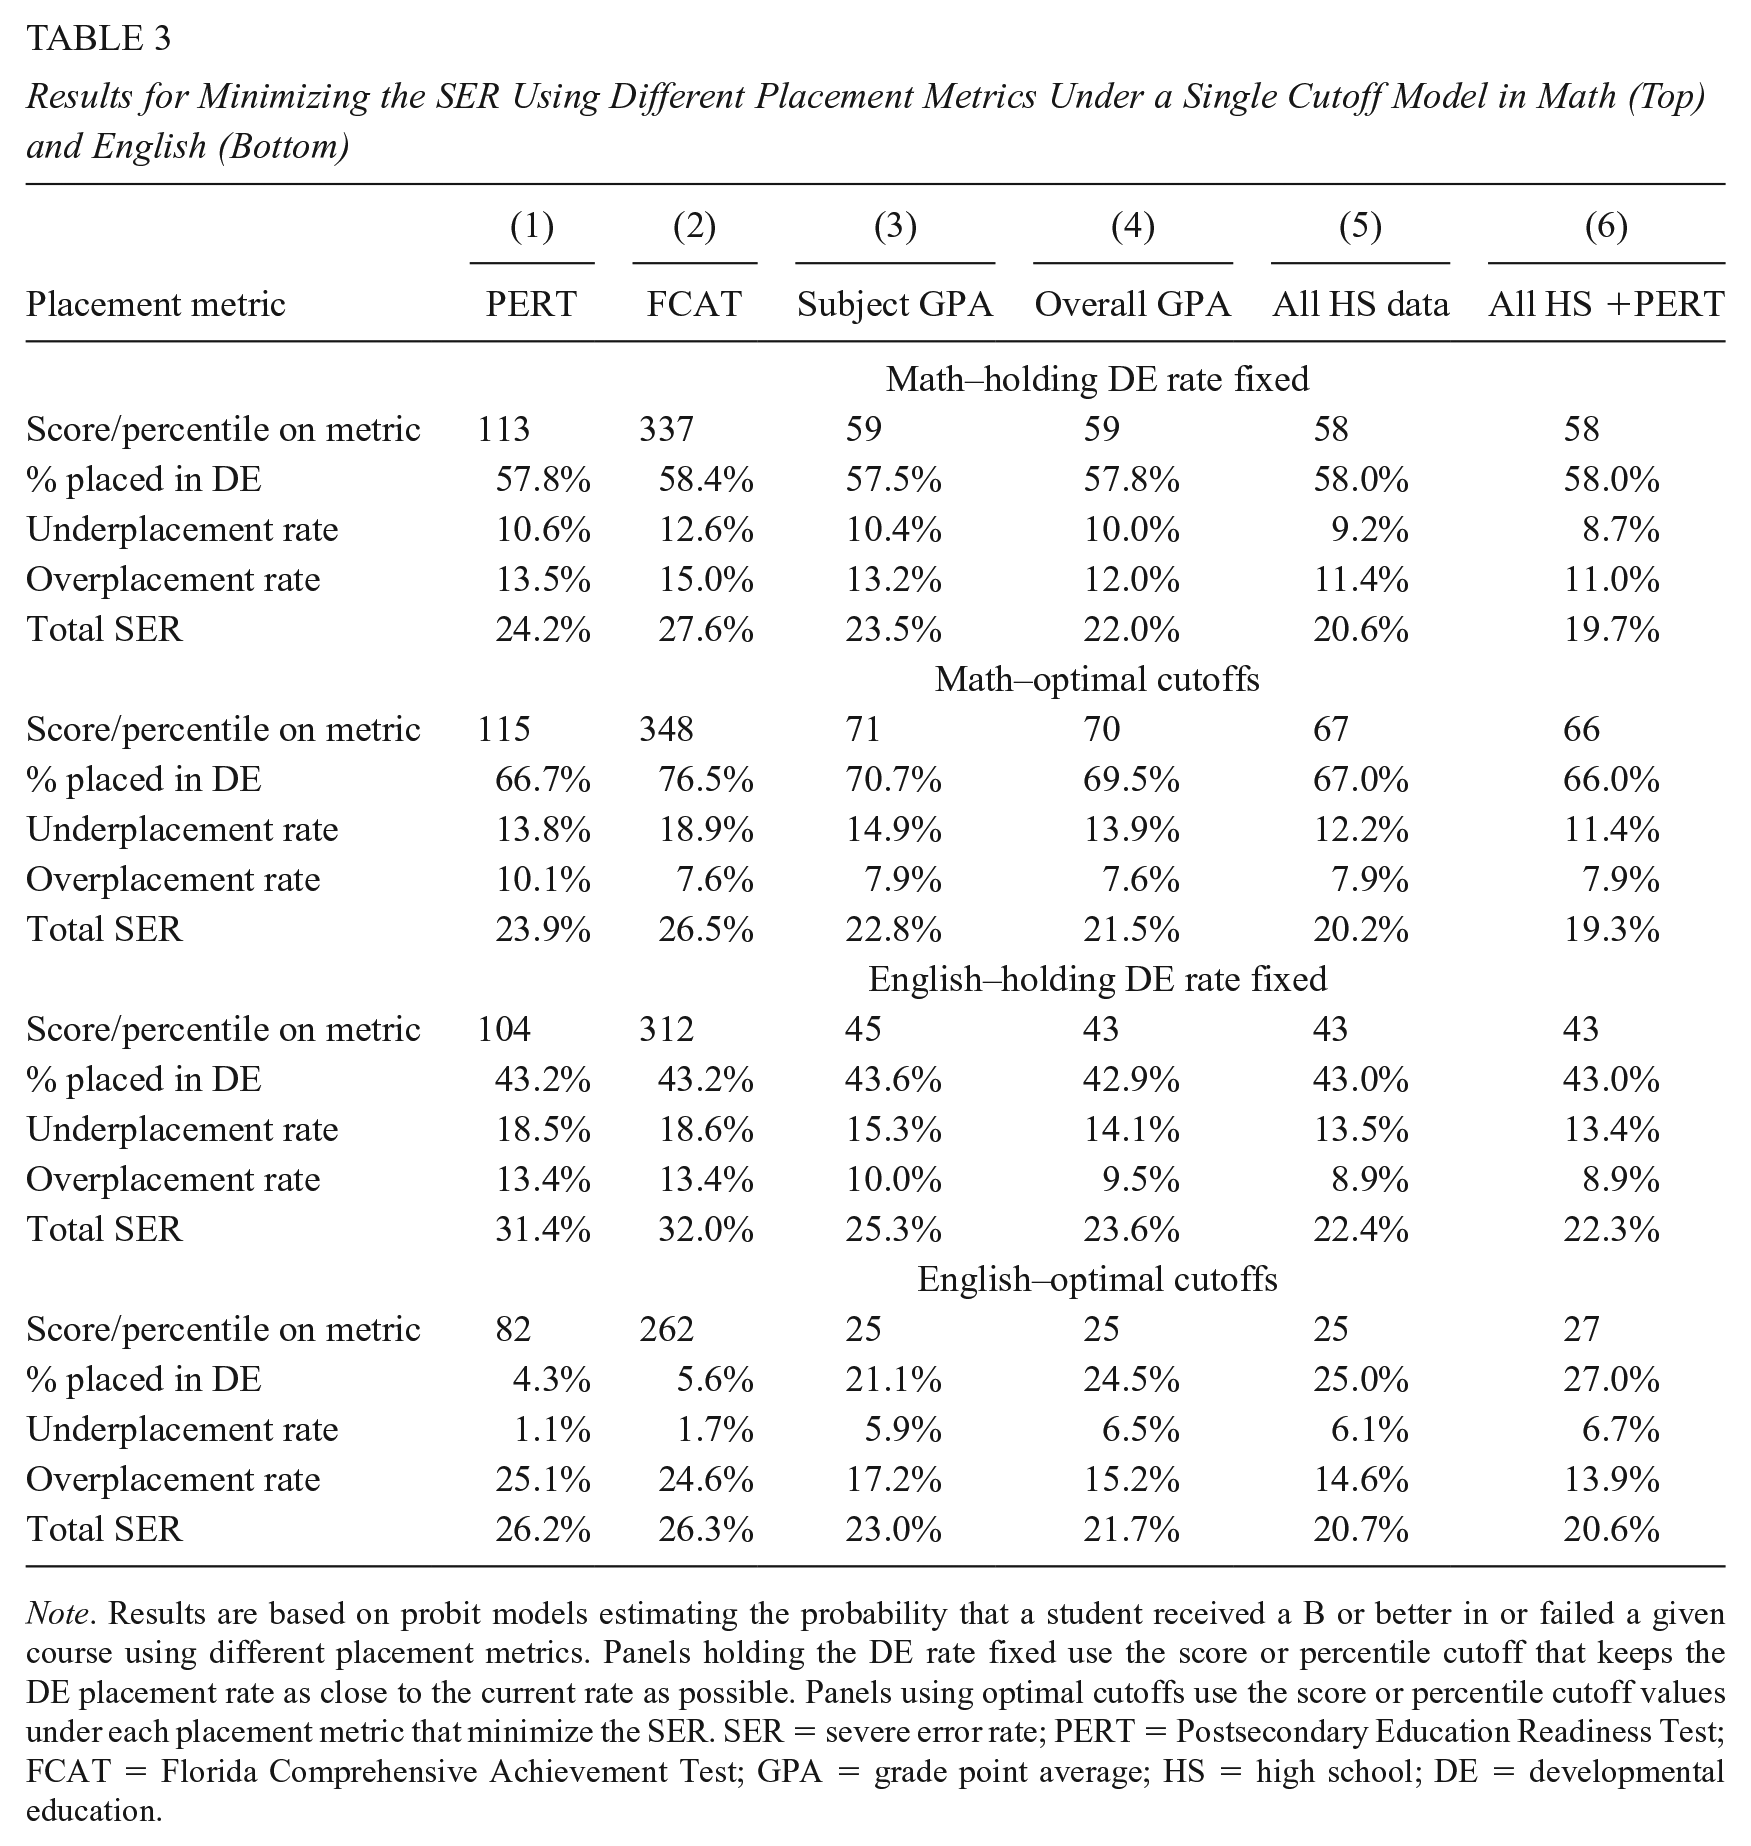
Note. Results are based on probit models estimating the probability that a student received a B or better in or failed a given course using different placement metrics. Panels holding the DE rate fixed use the score or percentile cutoff that keeps the DE placement rate as close to the current rate as possible. Panels using optimal cutoffs use the score or percentile cutoff values under each placement metric that minimize the SER. SER = severe error rate; PERT = Postsecondary Education Readiness Test; FCAT = Florida Comprehensive Achievement Test; GPA = grade point average; HS = high school; DE = developmental education.
Rows show the cutoff score or percentile, the percentage of students placed in DE, the percentage underplaced and overplaced, and the total SER. Underplacement is the probability of both getting a B or better if placed in a for-credit course and being placed in DE. Overplacement is the probability of both failing a for-credit course if placed in one and being placed in one. Total SER is the sum of the probabilities for underplacement and overplacement. Table 3 is divided into four panels. The top panel shows placement accuracy in math, holding the remediation rate constant; column (1) represents the status quo. 9 This is how Florida Department of Education (FLDOE) first set PERT cutoffs; it also allows us to separate the effect of switching placement metrics from that of optimizing cutoff locations. However, we rarely perfectly match the DE placement rate using discrete scores and percentiles. For example, 57.8% of our sample was placed in DE math based on PERT scores, but the closest rate using FCAT scores is 58.4%. The second panel shows outcomes at SER-minimizing cutoffs under each metric; if students are distributed differently over each metric, keeping the same placement rates will not make sense. The third and fourth panels are analogous to the first two but show outcomes for English.
In all four panels, the SER falls consistently from column (2) to column (6), with most of the changes due to a decrease in both overplacement and underplacement. There are consistent patterns across all metrics. Holding DE placement rates fixed, students are more likely to be overplaced in math (between 11.0% and 15.0% depending on the metric) and underplaced in English (between 13.4% and 18.6%), minimizing the SER means raising the math cutoff and lowering the reading cutoff. In math, the optimal cutoff improves the SER by 1 percentage point or less, while in English there are improvements up to 6 percentage points. With optimal cutoffs, students are more likely to be underplaced in math (between 7.6% and 10.1%) and overplaced in English (between 13.9% and 25.1%).
In both subjects, the optimal PERT cutoff is less accurate than a suboptimal GPA cutoff. The optimal PERT cutoff in math has a total SER of 23.9%, which is approximately 2 percentage points higher than the SER of 22.0 for overall GPA holding DE rates fixed. Results are similar in English, where the optimal PERT cutoff has a total SER of 26.2 compared with 23.6% for overall GPA at the fixed DE rate. However, accuracy gains from switching to high school GPA are much greater in English than in math. This could be because students take a wider range of core math courses than English courses, even controlling for honors status. Therefore, while all metrics can predict postsecondary performance more accurately in math than in English, there may be particular gains from using classroom-based measures rather than standardized assessments in English. We show these results graphically in the online Supplemental Appendix Figure B.1.
In both our context and that of Scott-Clayton et al. (2014), approximately a quarter of students were misplaced in math and a third were misplaced in English. However, DE placement rates for their samples were frequently much larger than ours. Since our sample was enrolled in DE at much lower rates than theirs, optimal adjustments might be quite different across contexts.
Switching from test-based placement to GPA-based placement may have smaller effects on misplacement in our study for several reasons. First, our GPA variables were limited to categorical grade variables (e.g., A, B, or C), because the Florida transcript data were missing plus or minus values (e.g., A–, B+) for most records. This means there was less variation available in grades used to predict student outcomes relative to the Scott-Clayton et al. study (which had high school grade data on a 0 to 100 grading scale). Second, all Florida colleges used the PERT for the college placement test, while the colleges in the Scott-Clayton et al. sample used ACCUPLACER and COMPASS. The PERT was created specifically to align with Florida’s state standards, so it may also be better aligned with college courses in Florida than national placement tests. Third, our sample is limited to high school students who seamlessly enrolled in community college, while the Scott-Clayton et al. sample includes a mix of recent high school graduates and older students. This is important because there is some evidence that the predictive validity of Accuplacer may vary by student age (Cole, Muenz, & Bates, 1998), so the results may not be comparable among students with different characteristics like age.
However, the primary reason why our results differ from Scott-Clayton et al. (2014) is likely the double-cutoff model itself. As an extreme example, consider a single-cutoff model in which the cutoff between any DE and for-credit coursework is properly set, but in which all students below the cutoff are incorrectly assigned to upper DE instead of lower DE. A single-cutoff model will see no misplacement and will instead assume that improvement can be made only through changing the placement metric. However, in a double-cutoff model, changing the placement metric while keeping placement proportions constant will still misplace many students; the only solution to misplacement within DE would be to adjust the cutoffs themselves.
Double-Cutoff Model—Minimizing the SER
Results using two cutoffs are shown in Table 4 (math) and Table 5 (English). Each is divided into two panels; the top panel shows the effect of switching metrics while keeping upper and lower DE rates fixed, and the bottom panel shows the effect of minimizing the SER under each metric. Minimizing the SER treats all misplacement as equally bad, regardless of level (single or double) or direction (underplacement or overplacement).
Minimizing the Math SER Using Different Placement Metrics Under a Double-Cutoff Model While Holding DE Rates Fixed (Top) and Estimating Optimal Cutoffs (Bottom)
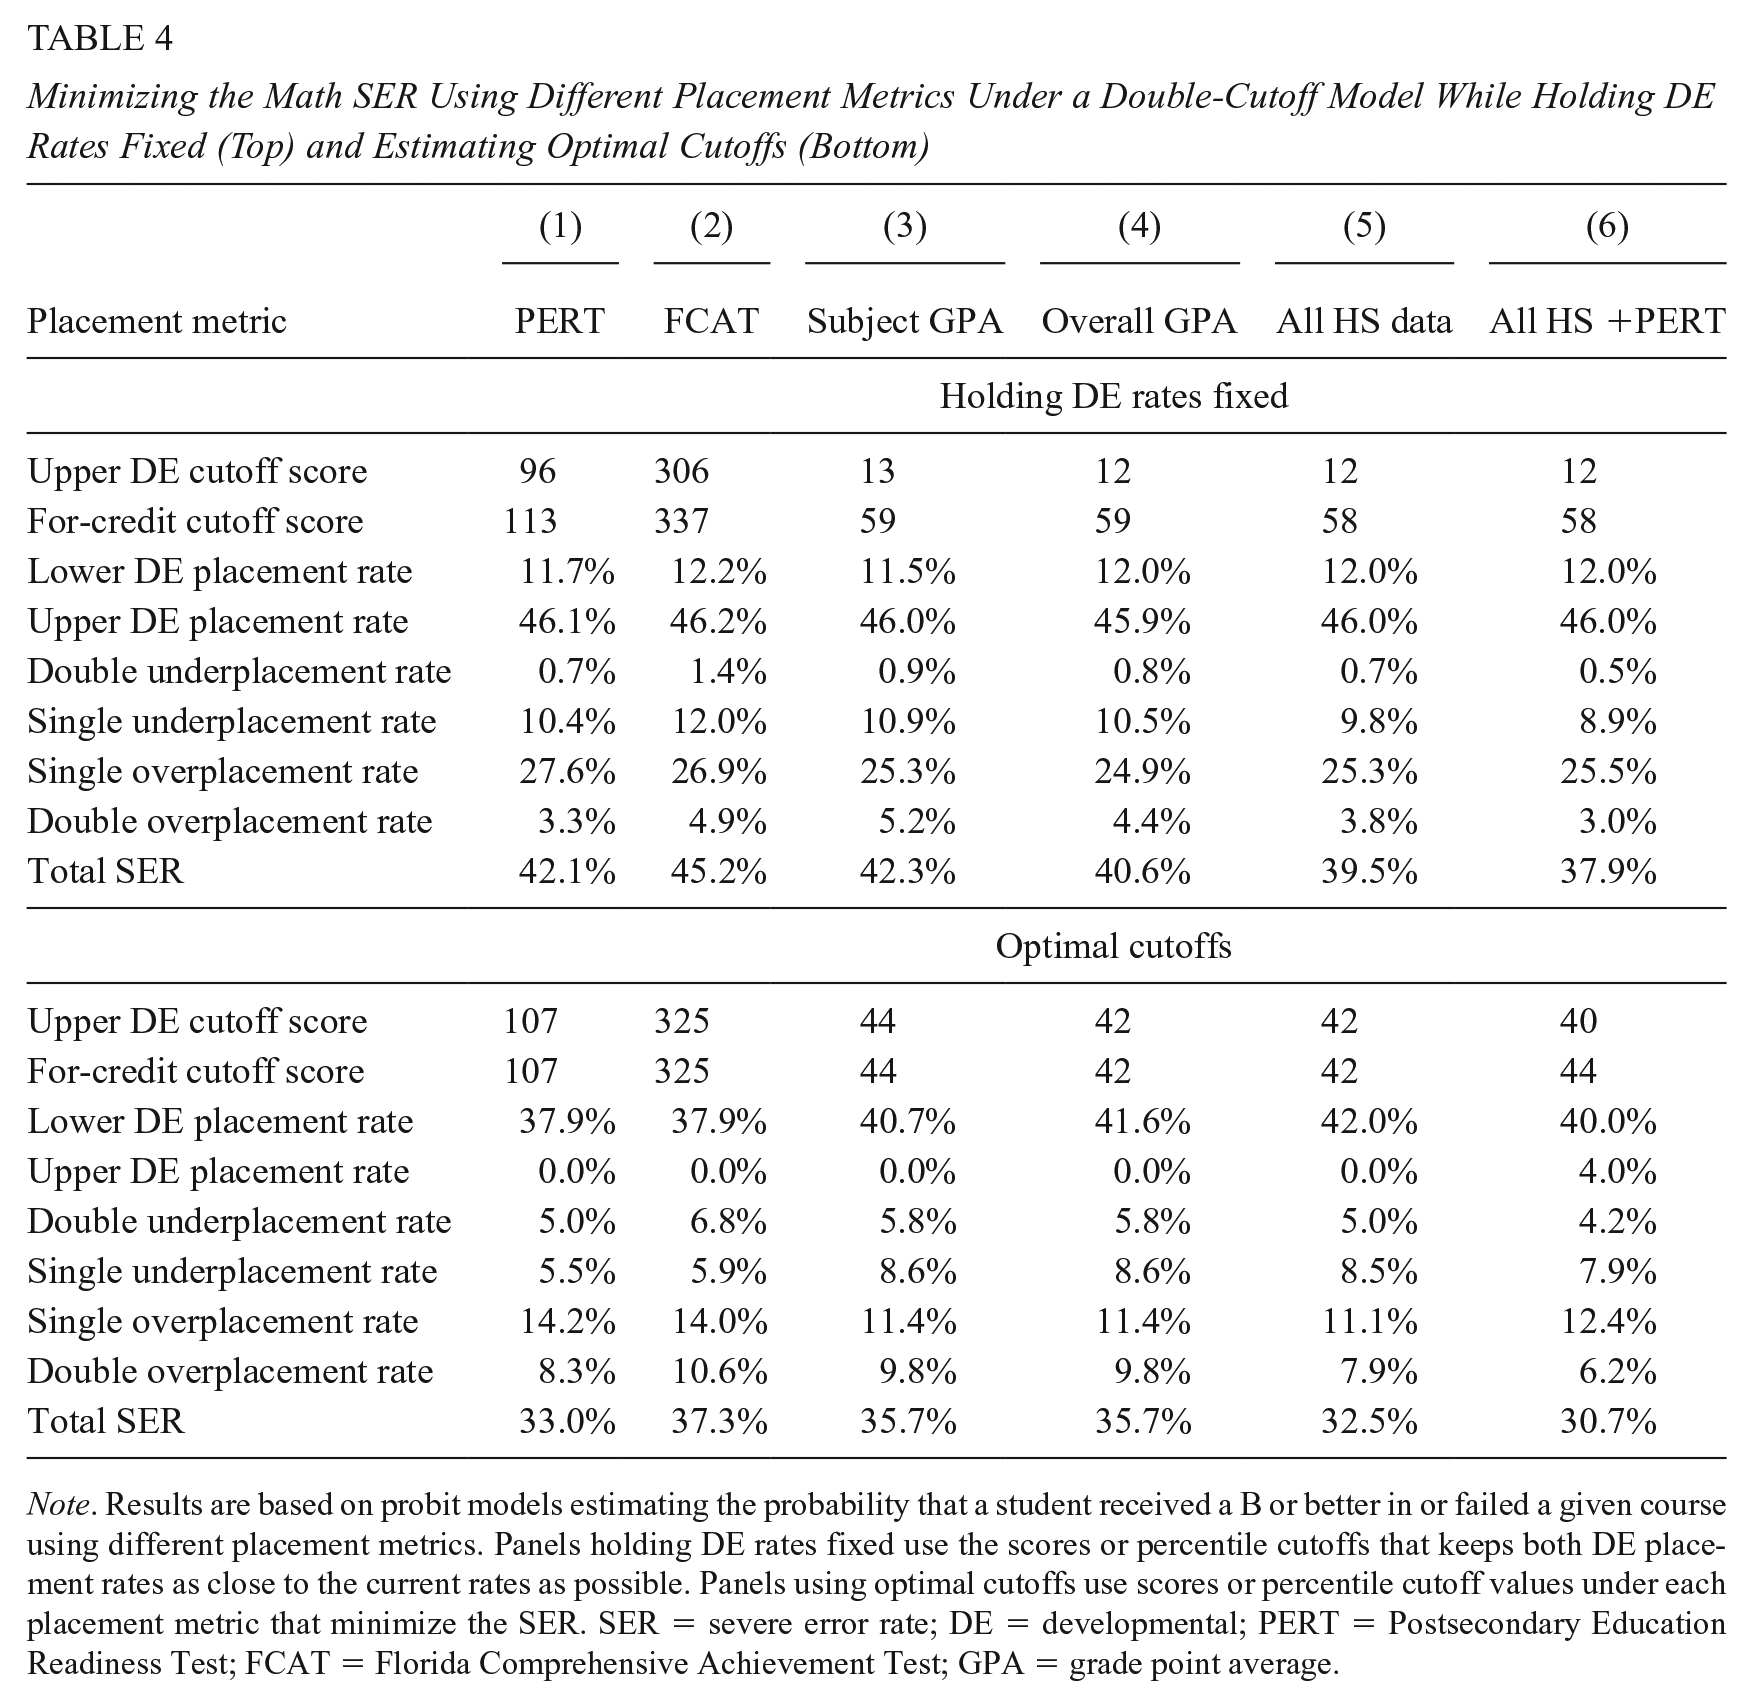
Note. Results are based on probit models estimating the probability that a student received a B or better in or failed a given course using different placement metrics. Panels holding DE rates fixed use the scores or percentile cutoffs that keeps both DE placement rates as close to the current rates as possible. Panels using optimal cutoffs use scores or percentile cutoff values under each placement metric that minimize the SER. SER = severe error rate; DE = developmental; PERT = Postsecondary Education Readiness Test; FCAT = Florida Comprehensive Achievement Test; GPA = grade point average.
Minimizing the English SER Using Different Placement Metrics Under a Double-Cutoff Model While Holding DE Rates Fixed (Top) and Estimating Optimal Cutoffs (Bottom)
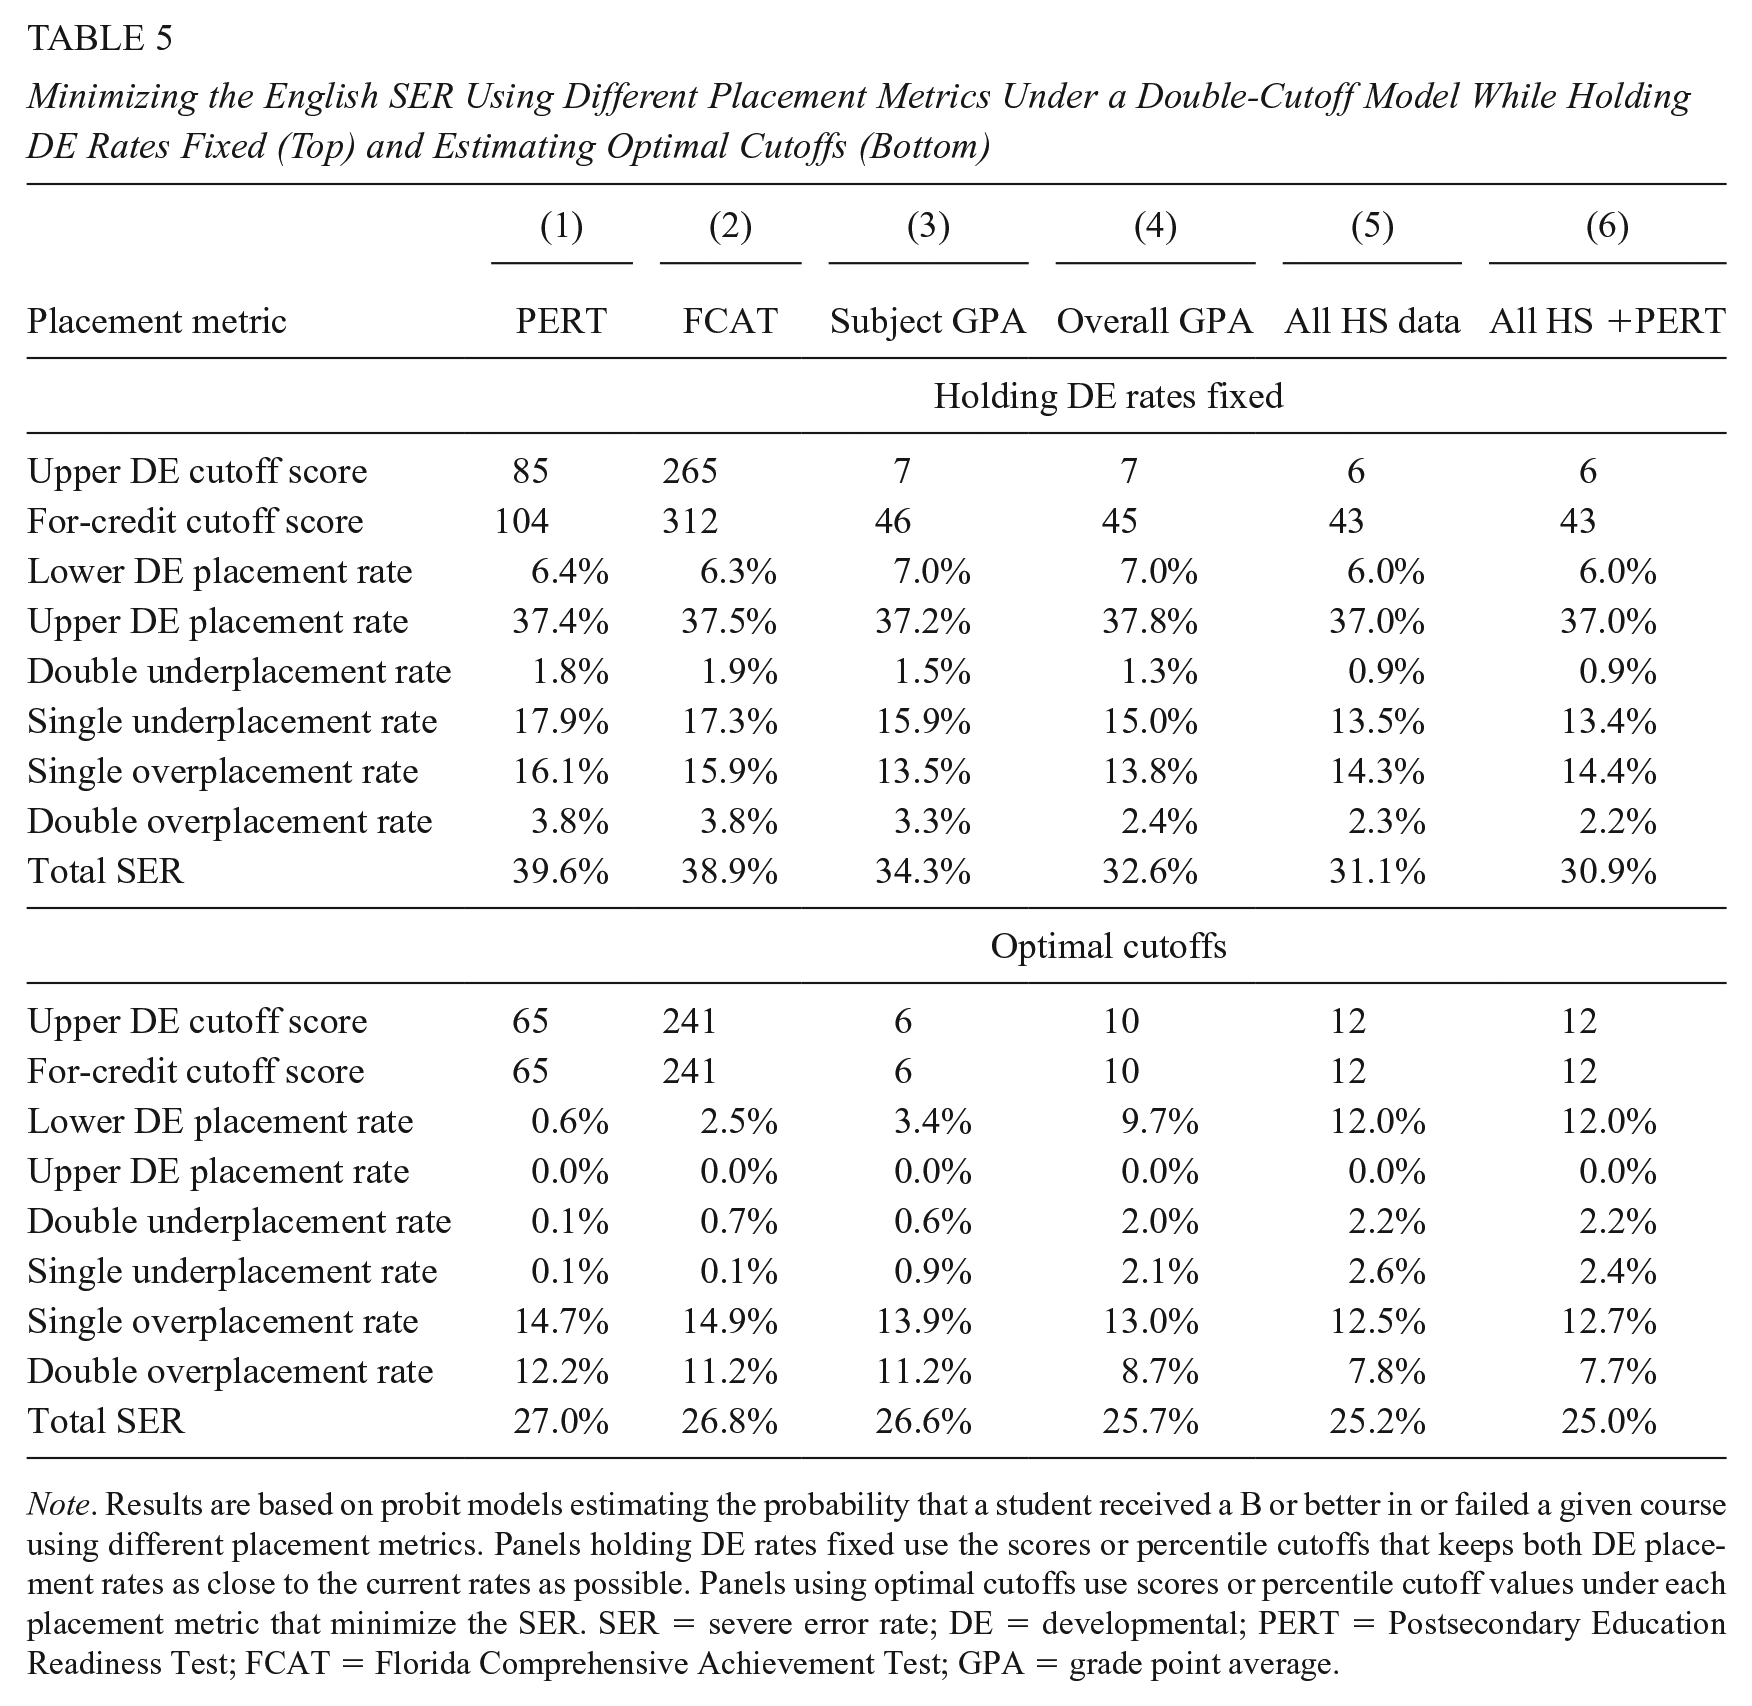
Note. Results are based on probit models estimating the probability that a student received a B or better in or failed a given course using different placement metrics. Panels holding DE rates fixed use the scores or percentile cutoffs that keeps both DE placement rates as close to the current rates as possible. Panels using optimal cutoffs use scores or percentile cutoff values under each placement metric that minimize the SER. SER = severe error rate; DE = developmental; PERT = Postsecondary Education Readiness Test; FCAT = Florida Comprehensive Achievement Test; GPA = grade point average.
Because Table 4 has two margins for misplacement, there is more misplacement than in a single-cutoff model. Single overplacement is substantially larger than the other three forms of misplacement combined with values up to 27.6% in math and 16.1% in English. These values are greater than the total SER for each metric in Table 3, which only go up to 15.0% in math and 13.4% in English holding DE rates fixed. Similarly, the total SER falls from column (2) to column (6). Holding DE placement rates constant, switching to overall GPA would reduce the SER only slightly (from 42.1 to 40.6 in math). Incorporating high school transcript data further improves placement accuracy to 37.9%.
In the bottom of Table 4, the SER is minimized by increasing the upper DE cutoff and lowering the for-credit cutoff, often setting the two equal. For example, the optimal cutoff score for both levels would be 107 for PERT math and 325 for FCAT math. Optimal cutoffs using all high school data plus PERT scores are not equal but still reduce upper DE enrollment by over 90%. Thus, a placement system designed to minimize the SER would either eliminate placement into upper DE or come very close to doing so: While the course level itself would not be eliminated, completing lower DE would be a prerequisite for upper DE. While some students would certainly be best placed in upper DE, too many students at the low end of its placement range are expected to fail and too many at the high end of its placement range could perform well in for-credit math. The average student at every possible score in five of six metrics would therefore be more accurately placed elsewhere. While PERT scores for our sample are not perfectly normal distributions, there is no evidence of a bimodal distribution that would naturally sort students out of upper DE. It is possible to envision scenarios in which this is attributable to course sequencing (e.g., if the upper DE course is nearly as challenging as the for-credit course) or staffing decisions (e.g., if the best teachers are assigned to the most able students and the most needy students, with students in upper DE falling into neither category); however, these scenarios are purely hypothetical and their analysis is beyond the scope of this work.
When holding the DE placement rate fixed in English in Table 5, misplacement is balanced between single overplacement and single underplacement. Again, the total SER falls consistently by column from 38.9% in column (2) to 30.9% in column (6). Unlike in math, switching to overall GPA greatly reduces the SER (from 39.6% to 32.6%).
The SER-minimizing upper DE and for-credit cutoffs are again equal across all six metrics, but lower DE placement rates vary from 0.6% under PERT to 12.0% using high school data plus PERT. The total SER falls by only 2 percentage points across columns; however, unlike in a single-cutoff model, the optimal SER in English is lower than in math under each metric. Online Supplemental Appendix Figure B.2 depicts SER values in a two-cutoff framework using contour graphs.
Using the full range of values (available upon request), we can consider other counterfactual policies. For example, recent changes under Florida’s Senate Bill 1720 both made DE optional for all recent high school graduates and eliminated requirements for PERT testing upon college entry. Laws pushing the vast majority of students into for-credit courses are predicted to contribute to higher misplacement rates in math (rising to 47.2% if no students enrolled in DE) but predicted to greatly reduce misplacement in English (to 27.1% if no students enrolled in DE, only 0.1% from the minimum SER value). We cannot directly compare our simulation results to actual trends under the reform because DE was optional rather than completely eliminated, and our model does not account for complications such as selection bias. However, our findings are consistent with observed trends in performance under the DE reform, as described by Hu et al. (2016). Our simulations indicate that pass rates would decline in for-credit courses, particularly in math. Following the reform, course-based passing rates in for-credit courses did fall, conditional on enrollment; the magnitude was negligible in English and more pronounced in math, as predicted by our model. Yet the cohort-based passing rate for the percentage of students in the full cohort who both enrolled in and passed for-credit courses in the first semester increased after the reform, which indicates that some students who would have been underplaced into DE courses were able to succeed in for-credit courses.
We also find—unlike our single-cutoff results—that switching to GPA as a placement metric without adjusting cutoff levels is not as effective as setting optimal cutoffs for the PERT. For example, the total SER for the optimal PERT cutoff is 27.0%, which is considerably lower than the total SER of 32.6% for overall GPA when DE rates are held fixed. Therefore, policymakers may wish to investigate whether cutoffs on placement assessments are optimal before embarking on the more challenging task of switching placement metrics.
Our analyses also explored how the results of the predictive models differed depending on the timing of when the PERT was taken. Table 6 shows placement cutoffs and total SERs under a double-cutoff model (with no additional covariates for high school performance) for models that include (a) all PERT scores (from our preferred specification), (b) first PERT score only, (c) last PERT score only, and (d) highest PERT score only. We find that the total SER using all PERT scores is 33.0% in math and 27.0% in English. The total SER is very similar (within 2 percentage points) across all sets of results using different timing of PERT scores in each subject area. This suggests that using placement scores at different points in time has little impact on the accuracy of our predictions. When looking at the placement cutoffs for upper DE and for-credit courses, results are almost identical among the models using all PERT scores and highest PERT scores with cut scores of 107 in math and 65 in English. This suggests that once we know a student’s highest test score, there is not much influence of other factors such as when the test was taken or the number of attempts that it took for the student to achieve the score. However, there are some differences in the results when first PERT scores are used. One possible explanation is that some students who take the PERT for the first time will receive scores that underestimate their true ability levels and will therefore benefit from retesting. This makes it more difficult to differentiate high-ability and low-ability students with the same PERT score. However, once students have retested, higher ability students tend to achieve higher scores, which leads to an increase in the optimal PERT cutoffs.
Minimizing the SER Under a Double-Cutoff Model With Optimal Cutoffs Using Different Timing of PERT Exams, by Subject Area
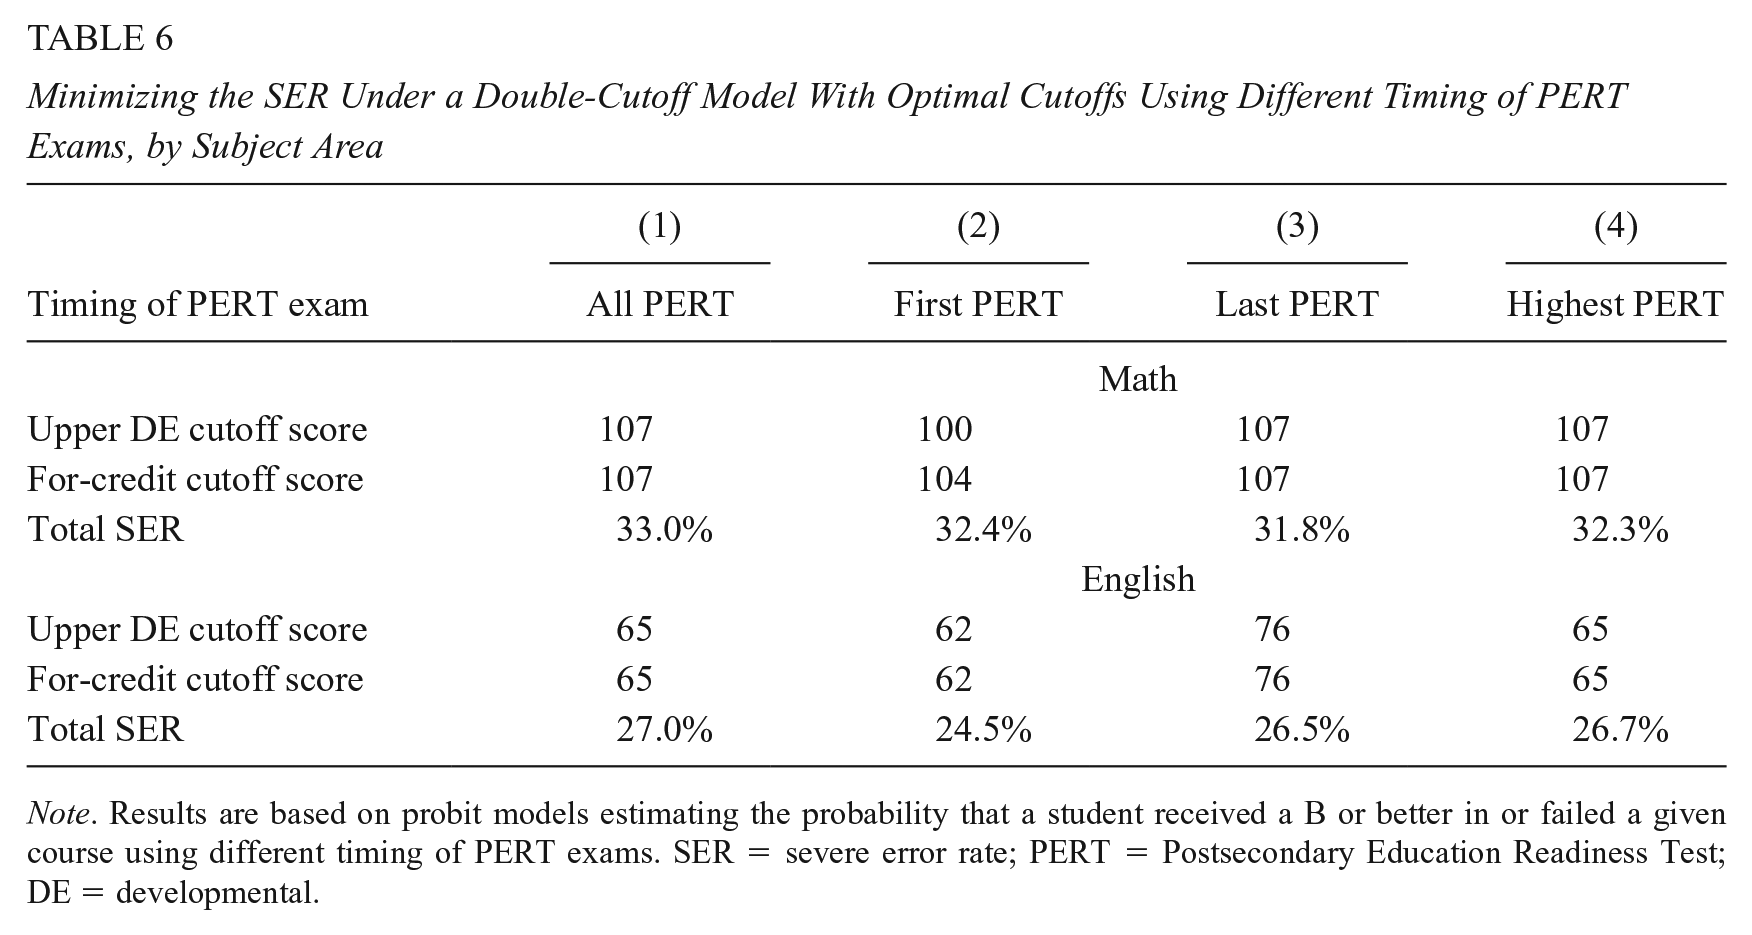
Note. Results are based on probit models estimating the probability that a student received a B or better in or failed a given course using different timing of PERT exams. SER = severe error rate; PERT = Postsecondary Education Readiness Test; DE = developmental.
Double Cutoff—Implications for Policymakers
Minimizing the SER will not be optimal if misplacement types are perceived to be differentially harmful. We now assume that policymakers base their decision-making on these harm levels. Specifically, double misplacement causes an additional
The cutoffs in our data show that if policymakers were indeed minimizing a weighted version of the SER, they would regard double misplacement as similarly harmful for each subject. Double misplacement would be over 2.5 times more harmful than single misplacement in math (
While optimal values for
But even if policymakers know their preferences for prioritizing different forms of misplacement, they may not know how to put those preferences into effect. To provide guidance on how this might work, Figure 3 and 4 show how the PERT cutoffs and placement rates respond to a range of

Developmental education placement and severe error rates for sample omega and tau values (math).

Developmental education placement and severe error rates for sample omega and tau values (English).
For low enough values of
Conclusion
The Florida College and Career Readiness Initiative mandated that students take the Postsecondary Education Readiness Test (PERT) to determine placement into College Readiness and Success courses in Grade 12. The PERT was also used in college to sort students into lower level DE, upper level DE, and for-credit courses. In principle, the FCCRI could have signaled and promoted college readiness; however, it relied on the PERT’s accuracy in course placement. We build on an existing body of work examining the extent to which students are accurately placed into DE courses based on their placement test scores. As with prior studies, these results are contingent upon the extent to which out-of-sample predictions using compliers can be used to predict counterfactual course outcomes for students with another placement.
Like Scott-Clayton et al. (2014), we find that using high school data improves placement accuracy. Unlike in the Scott-Clayton et al. study, setting optimal cutoffs on the PERT improves accuracy more than selecting a new metric, while holding remediation rates fixed. This finding suggests that policymakers should lend caution to switching placement metrics to improve placement decisions. For example, California’s recent legislation under AB 705 requires community colleges to make placement decisions primarily using indicators of high school performance. This policy was based on evidence suggesting that too many students were being underplaced into DE courses based on placement test scores (California Community Colleges, 2018). However, policymakers in states considering these types of changes should also consider that adjusting existing placement score cutoffs may lead to greater placement accuracy than using suboptimal cutoffs on a theoretically better metric.
In addition to considering the accuracy of placement metrics, policymakers should also consider how feasible it would be to implement different placement procedures. Further optimizing cutoff scores could be easier to implement because placement policies using multiple measures may face challenges in getting students to provide transcripts in a standardized manner and may pose substantial administrative burdens on both students and college staff. Using multiple measures could also create confusing signals of college readiness for students if placement is based on numerous indicators rather than a single test score cutoff and would likely make advising more complicated. Another limitation is that it may be difficult for institutional researchers or state agency staff to replicate our procedures for adjusting cutoffs to minimize placement error if they lack the statistical skills or institutional bandwidth to implement predictive analytics.
In Florida, the optimal cutoffs also imply that few, if any, students should be sorted into upper DE based on placement metrics; most are either already prepared to succeed in for-credit courses or require more intensive remediation through two levels of DE. These findings tend to be consistent regardless of whether students’ first PERT scores, last scores, highest scores, or a combination of scores is used to predict the likelihood of course success. While implementing this policy is beyond the scope of our work, using an opt-in system for upper DE might prevent misplacement while allowing students freedom of course selection.
Recent legislative changes no longer require that students take the PERT in high school or upon college enrollment; instead, college advisors are instructed to take a holistic view of high school performance. The legislation also made DE optional for recent high school graduates, while requiring that colleges provide academic support to mitigate overplacement. While exempt students (those who enrolled in a public high school during or after 2003/2004, enlisted military personnel, and veterans) are no longer required to take the PERT upon college enrollment, they are still advised to do so to inform their course selections. In addition, all Florida state colleges still require that nonexempt students take the PERT to determine course placement. The reform also requires colleges to redesign the delivery methods for DE courses, but these courses still do not count for college credit. If implemented properly, these policies could improve student outcomes by reducing underplacement; but at worst, they could exacerbate both forms of misplacement. Early descriptive research indicates that more students are enrolling in for-credit courses in the first semester, but passing rates are declining within for-credit courses, indicating that not all students are prepared to succeed (Hu et al., 2016). Longer term implications of these changes remain unknown.
One direction for future research is to consider the lifetime costs of misplacement. Overplaced students have to retake courses and may lose financial aid. Underplaced students pay for courses that they do not need, and financial aid often will not cover DE. Either form of misplacement may increase the time to degree or probability of dropping out of college. Information about the costs of misplacement could be used to inform priorities for the direction and degree of misplacement. Additional analyses might also explore whether adjusting cutoffs would affect enrollment, employment, tuition, or revenue at 2-year colleges.
Another direction for future research is to identify additional predictors of student success. For example, though high school GPA does not depend on specific math or English courses taken, a student with a B average in math through AP Calculus will likely be better prepared than one with an A average through Algebra II. Diagnostic tests may also place students more accurately than computer-adaptive tests, although they may be more expensive and time-consuming to administer (e.g., Ngo & Melguizo, 2015). In addition, the optimal cutoffs based on the SER could be compared with the cutoffs determined using a regression discontinuity framework (as described by Melguizo, Bos, Ngo, Mills, & Prather, 2016) to determine which method works best. However, many students will remain misplaced even under optimal metrics and cutoffs, as academic mismatch is only one reason why students do not succeed in college. Some may not want to put in the effort to complete assignments or attend class. Others may fail due to outside factors such as work commitments or financial difficulties. Future research may also examine the extent to which students fail due to lack of preparation, lack of effort, or external circumstances, and examine policies for each of these causes.
Supplemental Material
Christine_Mokher_Online_Appendix – Supplemental material for Improving Indicators of College Readiness: Methods for Optimally Placing Students Into Multiple Levels of Postsecondary Coursework
Supplemental material, Christine_Mokher_Online_Appendix for Improving Indicators of College Readiness: Methods for Optimally Placing Students Into Multiple Levels of Postsecondary Coursework by Daniel M. Leeds and Christine G. Mokher in Educational Evaluation and Policy Analysis
Footnotes
Acknowledgements
We thank the staff of the Florida Department of Education for their support of the project and for providing the data required for our analyses. This study was conducted under an Institutional Review Board (IRB) approval from Western IRB (WIRB protocol # 20121640).
Declaration of Conflicting Interests
The author(s) declared no potential conflicts of interest with respect to the research, authorship, and/or publication of this article.
Funding
The author(s) disclosed receipt of the following financial support for the research, authorship, and/or publication of this article: The Institute of Education Sciences, U.S. Department of Education, supported this research through Grant R305E120010 to CNA. The report represents the best opinion of the authors at the time of issue and does not represent the views of the Institute or the U.S. Department of Education.
Notes
Authors
References
Supplementary Material
Please find the following supplemental material available below.
For Open Access articles published under a Creative Commons License, all supplemental material carries the same license as the article it is associated with.
For non-Open Access articles published, all supplemental material carries a non-exclusive license, and permission requests for re-use of supplemental material or any part of supplemental material shall be sent directly to the copyright owner as specified in the copyright notice associated with the article.