



Abstract
A growing number of school systems use self-report surveys to track students’ social-emotional development as a tool to inform policy and practice. We use the first large-scale panel survey of social-emotional learning (SEL) to simulate how four constructs—growth mindset, self-efficacy, self-management, and social awareness—develop from Grade 4 to Grade 12 and how these trends vary by gender, socioeconomic status, and race/ethnicity among students participating in the survey for two consecutive years. With the exception of growth mindset, self-reports of these constructs do not increase monotonically as students move through school; self-efficacy, social awareness, and to a lesser degree self-management decrease after Grade 6. Female students report higher self-management and social awareness than males, but lower self-efficacy relative to males in middle and high school. Economically disadvantaged students and students of color report lower levels of each construct. These patterns highlight the need for policymakers to interpret changes in students’ self-reports over time in light of normative trends in social-emotional development and illustrate how such self-reports may nonetheless be used to set priorities and target interventions and resources.
Keywords
Accumulating evidence on the importance of nontested skills has led policymakers to look beyond test scores when seeking to measure and improve student outcomes. The recently enacted federal Every Student Succeeds Act (ESSA), for example, requires states to incorporate an additional indicator of school quality or student success (i.e., not based on math and reading test scores) into their school accountability systems. A growing number of states have established standards for SEL or incorporated social-emotional skills into their academic content standards (Dusenbury et al., 2015). Meanwhile, the Aspen Institute launched a National Commission on Social, Emotional, and Academic Development with a mandate to “re-envision what constitutes success in our schools” and “explore how schools can fully integrate social, emotional, and academic development to support the whole student.” 1
At the forefront of this trend are the CORE Districts, a network of large urban districts in California serving nearly 1 million students. These districts received a waiver from the U.S. Department of Education in 2013 to implement an alternative to the school accountability system then-mandated under the No Child Left Behind Act. 2 The CORE Districts used this flexibility to develop a measurement system that includes survey-based measures of SEL and school culture and climate alongside traditional academic indicators. Although ESSA’s 2015 enactment eliminated the CORE Districts’ obligation to use the SEL survey for school accountability, the districts continue to collect data on SEL to inform policy and support continuous improvement.
Across all CORE Districts, metrics based on students’ survey responses are integrated side-by-side with measures of academic performance and other nonacademic measures (e.g., suspension rates, chronic absenteeism) in the CORE dashboard. 3 District administrators and school leaders are thereby encouraged to use the SEL measures as part of their assessment of school quality and performance. In districts that make this information publicly available (e.g., Fresno Unified School District and Long Beach Unified School District), other stakeholders such as parents or teachers can also consider the SEL measures when assessing school quality.
Educators and policymakers within CORE report using data from the SEL survey to set priorities and assess progress in supporting students’ development. J. A. Marsh et al. (2018) find that school leaders within CORE report both using the SEL data “to plan and identify areas of need in annual cycles” and supplementing the annual CORE survey with more frequent surveys to monitor progress (p. 56). Toch and Miller (2019) similarly identify a range of ways that school leaders use the CORE survey data, such as reviewing “survey results for staff at the start of each school year, to explore trends and get teachers’ reactions” (p. 13), identifying schoolwide improvement priorities, and driving conversations around equity. At the district level, Marsh and colleagues found “a high level of awareness and support for the [SEL] surveys” among administrators (p. 56). Central office staff report reviewing the SEL data to monitor school performance and to provide targeted supports and interventions to schools. Toch and Miller (2019) report that Fresno Unified School District administrators “focus on the CORE survey results in regional meetings they convene several times a year to bring together representatives of schools” (p. 13).
There are other possible policy uses of these kinds of SEL measures, beyond current practice within CORE, such as for school or teacher accountability. Concerns about the possibility of “gaming” such a system if formal stakes were attached to students’ survey responses have thus far led states to avoid incorporating SEL surveys into their systems for identifying low-performing schools under ESSA. Researchers nonetheless disagree as to whether survey-based measures of social-emotional skills could ever be appropriate for use in school accountability systems (e.g., Duckworth & Yeager, 2015; Hough et al., 2017; Melnick et al., 2017; Toch & Miller, 2019).
To interpret and determine how best to use newly available measures of SEL, policymakers need to understand how social-emotional skills typically vary across grade levels and subgroups. This information is essential to make sense of aggregate SEL data and determine where interventions or supports are most needed. Similarly, educators need such information to interpret data from their own students and take appropriate action.
However, there is a lack of research examining how social-emotional skills develop over time, particularly for different student subgroups. Existing studies with a longitudinal design tend to focus on the development of SEL only in early childhood or elementary school (e.g., Edossa et al., 2018; Rothbart et al., 2006) or consider only a single SEL construct (Ross & Tolan, 2018). Cross-sectional studies in turn do not shed light on how skills evolve over time (e.g., Ablard & Lipschultz, 1998; Choudhury et al., 2006). Many studies of SEL rely on small convenience samples of students within specific settings (e.g., Blackwell et al., 2007; Duckworth et al., 2010), raising questions about the generalizability of their findings. Moreover, variation in the specific constructs and measures used to assess students’ social-emotional skills makes it difficult to compare results across studies (e.g., Berg et al., 2017; Duncan & Magnuson, 2011). Further compounding this challenge is the sheer number of competencies that fall under the umbrella of SEL or noncognitive skills (Berg and colleagues, 2017, identified 136 different frameworks of social and emotional competencies across nearly 20 areas of study).
In this article, we leverage the CORE Districts’ SEL survey to address two broad questions: How do the four SEL constructs CORE chose to include on that survey—growth mindset, self-efficacy, self-management, and social awareness—develop from Grades 4 through 12? And how do these patterns vary by gender, socioeconomic status, and race/ethnicity? Our analyses are based on self-report surveys administered to nearly 400,000 students in the 2014–2015 and 2015–2016 school years. With 2 years of data, we can only track the development of SEL for a given student over the course of a single school year. However, we are able to aggregate information on these changes across multiple grade levels to simulate long-term trends for students who remain enrolled in participating districts and complete the SEL survey in both years. More specifically, we calculate mean score gains for students who completed the survey in both years, and we use these gains to extrapolate from Grade 8 (the midpoint of our sample) to both prior and subsequent grades. Although we cannot follow individual students across all grades, this method improves on cross-sectional comparisons of means across grades by accounting for idiosyncratic differences between grade cohorts and for students’ endogenous entry into and exit from the study sample.
In reporting these simulated trends and discussing their implications for policy, we emphasize that the measures gathered by the CORE Districts’ SEL survey are self-reported and therefore reflect students’ subjective assessments of their social-emotional skills. Students evaluating their own skills must employ an external frame of reference to reach a judgment about their relative standing. As a result, differences in self-reports over time or across students may reflect differences in normative standards rather than authentic differences in skills (reference bias; West et al., 2016), the tendency of survey respondents to offer positive self-descriptions (social desirability bias; Paulhus, 1991), or differences in culture or in home or school environments that lead students to interpret or respond to items in different ways.
Although we cannot rule out that such potential sources of bias influence our results, there is substantial evidence for the measures’ validity. For instance, West and colleagues (2016) show that the SEL measures and student achievement are less correlated within schools than overall; this finding suggests reference bias due to differences in school environment is not a substantial concern, as the opposite would be true if students in higher-performing schools rated themselves more critically. Moreover, Meyer et al. (2018) use Differential Item Functioning (DIF) analysis to show that student subgroups are not responding differently to specific items within the survey scales. Finally, we document below that within-student changes in self-reports of each SEL construct correlate in expected ways with concurrent changes in theoretically related academic and behavioral indicators. Although we cannot yet speak to our findings’ generalizability beyond students continuously enrolled across two years within the California districts we study and the measures they employ, the scope and scale of our data far exceed anything in the extant literature on social-emotional development.
Literature Review
Despite policymakers’ heightened interest in SEL, there remains a lack of consensus regarding how different aspects of students’ social-emotional skills evolve over time. In this section, we discuss the available evidence on the development of the four constructs assessed by the CORE Districts’ SEL survey. We then turn to differences in SEL trajectories over time for student subgroups based on gender, socioeconomic status, and race/ethnicity. The four constructs are defined as follows:
Self-management, also referred to as self-control or self-regulation, is the ability to regulate one’s emotions, thoughts, and behaviors effectively in different situations. This includes managing stress, delaying gratification, motivating oneself, and setting and working toward personal and academic goals (Collaborative for Academic, Social, and Emotional Learning [CASEL], 2005).
Growth mindset is the belief that one’s abilities can grow with effort. Students with a growth mindset believe that they can develop their skills through effort, practice, and perseverance. These students embrace challenges, see mistakes as opportunities to learn, and persist in the face of setbacks (Dweck, 2006).
Self-efficacy is the belief in one’s ability to succeed in achieving an outcome or reaching a goal. Self-efficacy reflects confidence in the ability to exert control over one’s own motivation, behavior, and environment and allows students to become effective advocates for themselves (Bandura, 1997).
Social awareness is the ability to take the perspective of and empathize with others from diverse backgrounds and cultures, to understand social and ethical norms for behavior, and to recognize family, school, and community resources and supports (CASEL, 2005).
The CORE Districts identified these four constructs in collaboration with researchers, content experts, district staff, and school stakeholders. They prioritized constructs that were predictive of academic and life outcomes, measurable via existing survey instruments, and malleable in school settings (see J. A. Marsh et al., 2018; West, Buckley et al., 2018), as well as ones that aligned to SEL competencies identified by CASEL. Self-efficacy and growth mindset are each part of CASEL’s self-awareness domain, whereas self-management and social awareness are domains in CASEL’s framework (West, Buckley et al. 2018).
Studies generally suggest that self-management (also referred to as self-regulation or self-control) declines during early adolescence (Duckworth et al., 2010; West et al., 2016). However, studies of how self-management develops throughout adolescence are limited (Gestsdottir & Lerner, 2008) and inconclusive. 4 Some researchers suggest that certain skills required for self-management―such as controlling attention, inhibiting responses, and self-monitoring progress―actually increase as students age, but other factors related to self-management―such as interest in school, motivation, and the changing classroom environment―dampen students’ ability to exercise self-management (e.g., Gestsdottir & Lerner, 2008; Pintrich & Zusho, 2002).
Few studies have examined how growth mindset develops within students over time; the literature has focused instead on the relationship of growth mindset and academic outcomes (e.g., Blackwell et al., 2007; Claro et al., 2016) and the effects of interventions seeking to foster a growth mindset (e.g., Dweck, 2006; Yeager et al., 2016, 2019). Some researchers have reported that growth mindset decreases during middle school (Pintrich & Zusho, 2002), whereas others show growth mindset may in fact increase during this period (West et al., 2016).
By contrast, a large body of work has established that self-efficacy tends to decline in middle school (e.g., Anderman et al., 1999; Pajares & Valiante, 1999; Pintrich & Zusho, 2002; Schunk & Meece, 2006; Schunk & Pajares, 2002; Urdan & Midgley, 2003; Wigfield et al., 2006). In particular, the middle-school transition is an especially vulnerable time for students’ self-efficacy beliefs (Schunk & Meece, 2006; Schunk & Pajares, 2002). However, some studies suggest that domain-specific self-efficacy (i.e., English language arts [ELA]- or math-specific) increases during middle school (Shell et al., 1995; Zimmerman & Martinez-Pons, 1990).
Finally, research into the development of social awareness indicates that students become more socially aware over time as peer groups become more central (Rubin et al., 2005; Ryan, 2001; Wigfield et al., 2006). Some concepts or skills that are related to or prerequisites of social awareness―such as self-awareness, self-reflection, perspective taking, and metacognition―improve as students age (Choudhury et al., 2006; Eccles, 1999; Piaget, 1972; Yurgelun-Todd, 2007). However, because empirical studies of social awareness generally focus on social skills broadly, it is difficult to characterize developmental patterns for social awareness specifically (Farrington et al., 2012).
There is good reason to believe that SEL trajectories differ according to students’ gender, but the empirical evidence to date has been inconclusive. Early adolescence is a time when culturally relevant gender stereotypes intensify (Eccles, 1987; Hill & Lynch, 1983; Kågesten et al., 2016), and differences between boys’ and girls’ biological development can manifest in their noncognitive skills. For example, girls tend to display higher self-management than boys in elementary school and early adolescence (Ablard & Lipschultz, 1998; Duckworth & Seligman, 2006; Moffitt et al., 2011; Pintrich & Zusho, 2002; Zimmerman & Martinez-Pons, 1990).
Evidence of gender differences in self-efficacy is more ambiguous. Some studies suggest that boys and girls have similar self-efficacy in elementary school, but girls display lower self-efficacy during the transition to middle school (e.g., Anderman et al., 1999; Wigfield et al., 1991; Wigfield et al., 1996). Other studies suggest that gender differences in self-efficacy may be domain-specific, with girls tending to show higher levels than boys of self-efficacy in ELA but lower levels in math (Eccles et al., 1998; Jacobs et al., 2002; H. W. Marsh, 1989; Schunk & Meece, 2006; Wigfield et al., 1991). In contrast, some studies find no evidence of gender differences in self-efficacy (e.g., Pajares, 1996; Pajares & Graham, 1999; Roeser et al., 1996; Smith et al., 2002).
Girls are generally viewed as being more likely than boys to endorse a fixed rather than a growth mindset (Dweck, 1986, 2000), particularly when asked about their abilities in stereotypically male-dominated domains such as math or science (Farrington et al., 2012). However, multiple studies have found no relationship between gender and growth mindset (e.g., Macnamara & Rupani, 2017; Storek & Furnham, 2013; Tucker-Drob et al., 2016).
Finally, research provides evidence that girls display higher social awareness than boys during the transition to middle and high school (Gaspar et al., 2018; Wentzel, 1994). Because boys and girls experience distinct socialization practices during adolescence (Kågesten et al., 2016), girls’ relationships to peers and families might differentially affect how they develop self- and social awareness. Similarly, studies have indicated that girls tend to suffer from intrapersonal behavior challenges, whereas boys tend to suffer from interpersonal behavior challenges (Hatzchristou & Hopf, 1996; Underwood, 2004).
Relatively few studies examine how students’ economic disadvantage is associated with self-reported SEL (Schunk & Meece, 2006), but the available evidence suggests gaps favoring economically advantaged students. For example, studies show that students from economically advantaged backgrounds may display higher levels of skills related to self-management, such as emotional regulation (Papini et al., 1990), adaptability (Davis, 2012), or impulsive behavior (Takeuchi et al., 1991). Factors related to self-efficacy have also been shown to vary by socioeconomic status. For example, economically disadvantaged students may suffer from lower self-esteem (Bolger et al., 1995), they may be more likely to experience learning challenges early in school that dampen their self-efficacy later on (Schunk & Miller, 2002), and their parents may have reduced expectations of their academic success (Alexander & Entwisle, 1988). In terms of growth mindset, a recent study found that students in Grades 4 through 12 attending schools with a higher concentration of students in poverty reported lower levels of growth mindset (Snipes & Tran, 2017). Finally, research shows that students from economically advantaged backgrounds may develop stronger social awareness, as they may be less likely to struggle with peer relationships (Bolger et al., 1995) or social competence (Winer & Thompson, 2013). More generally, a large body of evidence shows that growing up in poverty is a major risk factor for increased adverse childhood experiences, and for low levels of social and emotional well-being in both adolescence and adulthood (Bradley & Corwyn, 2002; Brooks-Gunn & Duncan, 1997; Kupersmidt et al., 1995; Takeuchi et al., 1991; Yoshikawa et al., 2012).
Most of the literature examining racial and ethnic subgroup differences in SEL consists of cross-sectional studies measuring SEL at a single time point. Few studies have examined racial or ethnic differences in the development of self-management (Pintrich & Zusho, 2002). For self-efficacy, some studies show no difference across different racial/ethnic groups (e.g., Britner & Pajares, 2001; Roeser et al., 1996). Other studies find that Asian students report lower self-efficacy (Eaton & Dembo, 1997), that Latinx teens report lower self-efficacy in writing (Pajares & Johnson, 1996), and that African American teens report lower self-efficacy in math (Pajares & Kranzler, 1995). Still other studies suggest that certain underrepresented minority students may report higher perceptions of academic competence (e.g., Graham, 1994). Few studies explicitly examine differences in growth mindset among adolescents of differing racial or ethnic backgrounds. One recent report found that African American and Latinx students self-reported lower levels of growth mindset than their White counterparts, but this finding was based on evidence from a single school district (Snipes & Tran, 2017). Finally, evidence of students’ social awareness based on race or ethnicity is limited to elementary and middle school, and findings are ambiguous. DiPerna and Elliott (1999) describe how elementary school students from racial/ethnic minority groups were rated lower than their White counterparts on teacher-reported measures of interpersonal skills, but Malecki and Elliott (2002) report no differences in teachers’ reports of social skills for White and minority students.
In short, the literature suggests self-management and self-efficacy may decrease in adolescence, while social awareness is expected to increase, and expectations of changes in growth mindset over time are unclear. Girls are expected to have superior self-management and social awareness relative to boys—but also a more fixed mindset and lower self-efficacy, particularly with regard to male-stereotyped domains such as math and science. For socioeconomic status, research indicates that students from economically advantaged backgrounds report higher SEL than their more disadvantaged peers. However, because only a small proportion of the existing research focuses on differences in economic advantage, there is additional need for evidence supporting this hypothesis. As for racial and ethnic differences, there is little consensus on differences in either levels or developmental trajectories in SEL over time. The current study aims to shed additional light on how key aspects of SEL develop over time as students progress through school.
Data and Methods
The CORE Districts’ SEL survey comprises a battery of items designed to measure four SEL constructs: self-management (nine items), social awareness (eight items), growth mindset (four items), and self-efficacy (four items). Students in Grades 4 through 12 in the 2014–2015 and 2015–2016 school years rated themselves on the same 25 questions using a 5-point Likert-type scale. 5 Additional details regarding survey administration can be found in Gehlbach and Hough (2018).
Measuring SEL development using these data requires us to transform the responses to the SEL items on the student survey into a metric. We create scale scores for each of the four SEL constructs for students who responded to at least half of the survey items associated with that construct. Following Meyer et al. (2018), we use a generalized partial credit model (GPCM) to convert students’ responses to these items into a scale score for each of the four constructs. 6 Based on Muraki’s (1992) extension of the partial credit model (PCM; Masters, 1982), GPCM can incorporate measures for which responses are on a multipoint scale, rather than only dichotomous items. The GPCM assigns more weight to items that better distinguish among students with different construct-specific abilities and appropriately accounts for missing student survey responses. Using a PCM in place of a GPCM to produce SEL scale scores yielded very similar substantive results, as did using raw scores.
The Appendix (available in the online version of the journal) presents a series of analyses examining the reliability and validity of the measures gathered via the CORE Districts’ SEL survey. For example, we show that the scales used to measure each construct generally demonstrate strong internal consistency across all grade levels (see the online Figure A.2). The four SEL constructs demonstrate less temporal stability than test scores (see the online Figure A.3), with across-year correlations ranging from 0.22 to 0.53 (p < .001) for students assessed in both the 2014–2015 and 2015–2016 school years; this pattern could indicate that social-emotional skills may be more malleable over time than cognitive ability, or alternatively, that test scores are a better measure of academic achievement than the SEL measures are of the underlying SEL competencies. Finally, we show that each of the SEL measures correlates in expected ways with the academic and behavioral indicators available in each district’s administrative data: test scores in ELA and Math (see the online Figure A.5), absences (see the online Figure A.6a), and suspensions (see the online Figure A.6b).
In addition, given our focus in this article on changes in SEL within students over time, we examine the correlations between within-student changes from one year to the next for each of the four SEL constructs, Grade Point Average (GPA, available for Grades 7 through 12), and math and ELA test scores (available for Grades 3 through 8). 7 Figure 1 displays a heatmap of these correlations; each gray box shows the “gain” for a given student between two grades (e.g., Grade 3 to Grade 4 in the top left box of Panel A), and each number in a box is a correlation, with darker shades indicating larger correlations. The figure confirms that within-student gains in each SEL construct have consistently positive (though small in magnitude) correlations with gains in math scores, ELA scores, and GPA. Gains in GPA are more strongly correlated with gains in SEL than are math and ELA test scores—especially for the self-management and self-efficacy constructs. In the case of self-management, this pattern is consistent with evidence that the grades students receive provide information on their self-regulatory capacity (Galla et al., 2019). Students’ self-efficacy may in turn be influenced by the signals that grades communicate over the course of an academic year. Overall, the systematic patterns in these correlations suggest that the within-student changes in the SEL constructs that we analyze in this article capture meaningful variation in the development of student skills.
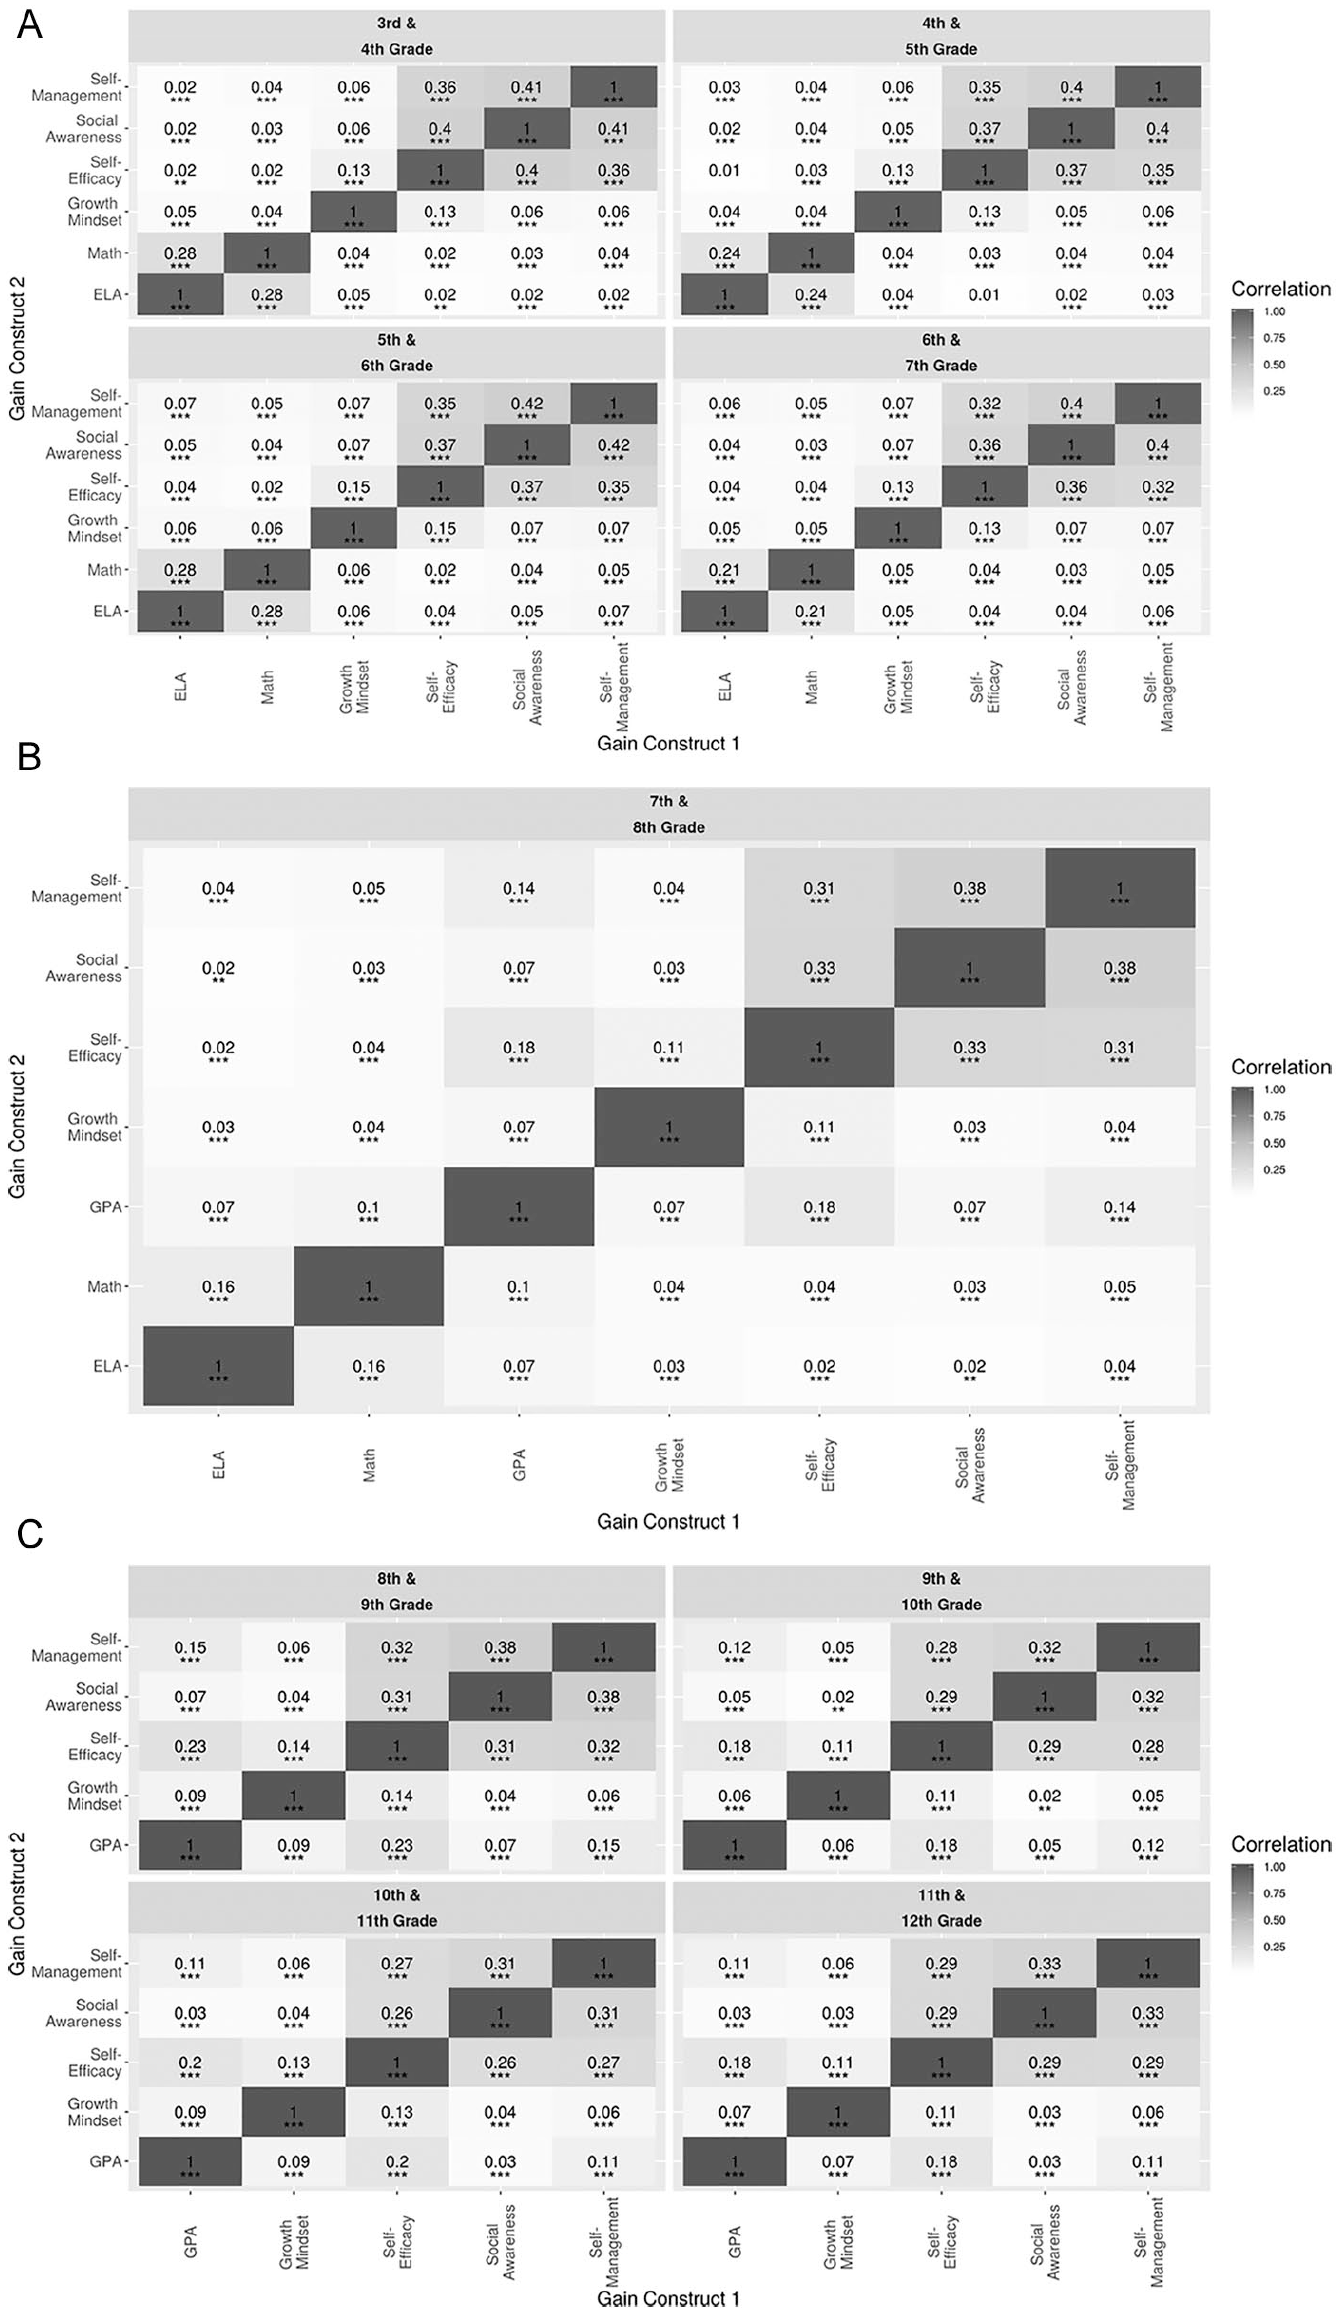
Correlations of within-student changes from year to year in each SEL construct, GPA, and math and ELA test scores: Panel A: Grades 3 through 7 (SEL, Math scores, and ELA scores), Panel B: Grades 7 and 8 (SEL, Math, ELA, and GPA), and Panel C: Grades 8 through 12 (SEL and GPA).
Analytic Sample
We analyze data from six CORE Districts that administered the SEL survey in the spring of the 2014–2015 and 2015–2016 school years. These districts collectively serve roughly 572,000 students in Grades 4 through 12 across 1,200 schools. Approximately 390,000 (about 70%) students in the districts completed the survey each year. Our analysis of trends in SEL development across grades is based on students surveyed in both years to address nonrandom entry into and exit from schools within the CORE Districts across grade levels.
As in any survey, not all students completed all items on the SEL survey. On average, each item was answered by 97.1% of the students across all grades in 2014–2015 and by 97.5% of the students across all grades in 2015–2016. Our final analytic sample for each SEL construct includes the 282,867 students who completed at least 50% of the items for that construct in both years. Scale scores from the GPCM were used for all analyses to account for the remaining missing responses.
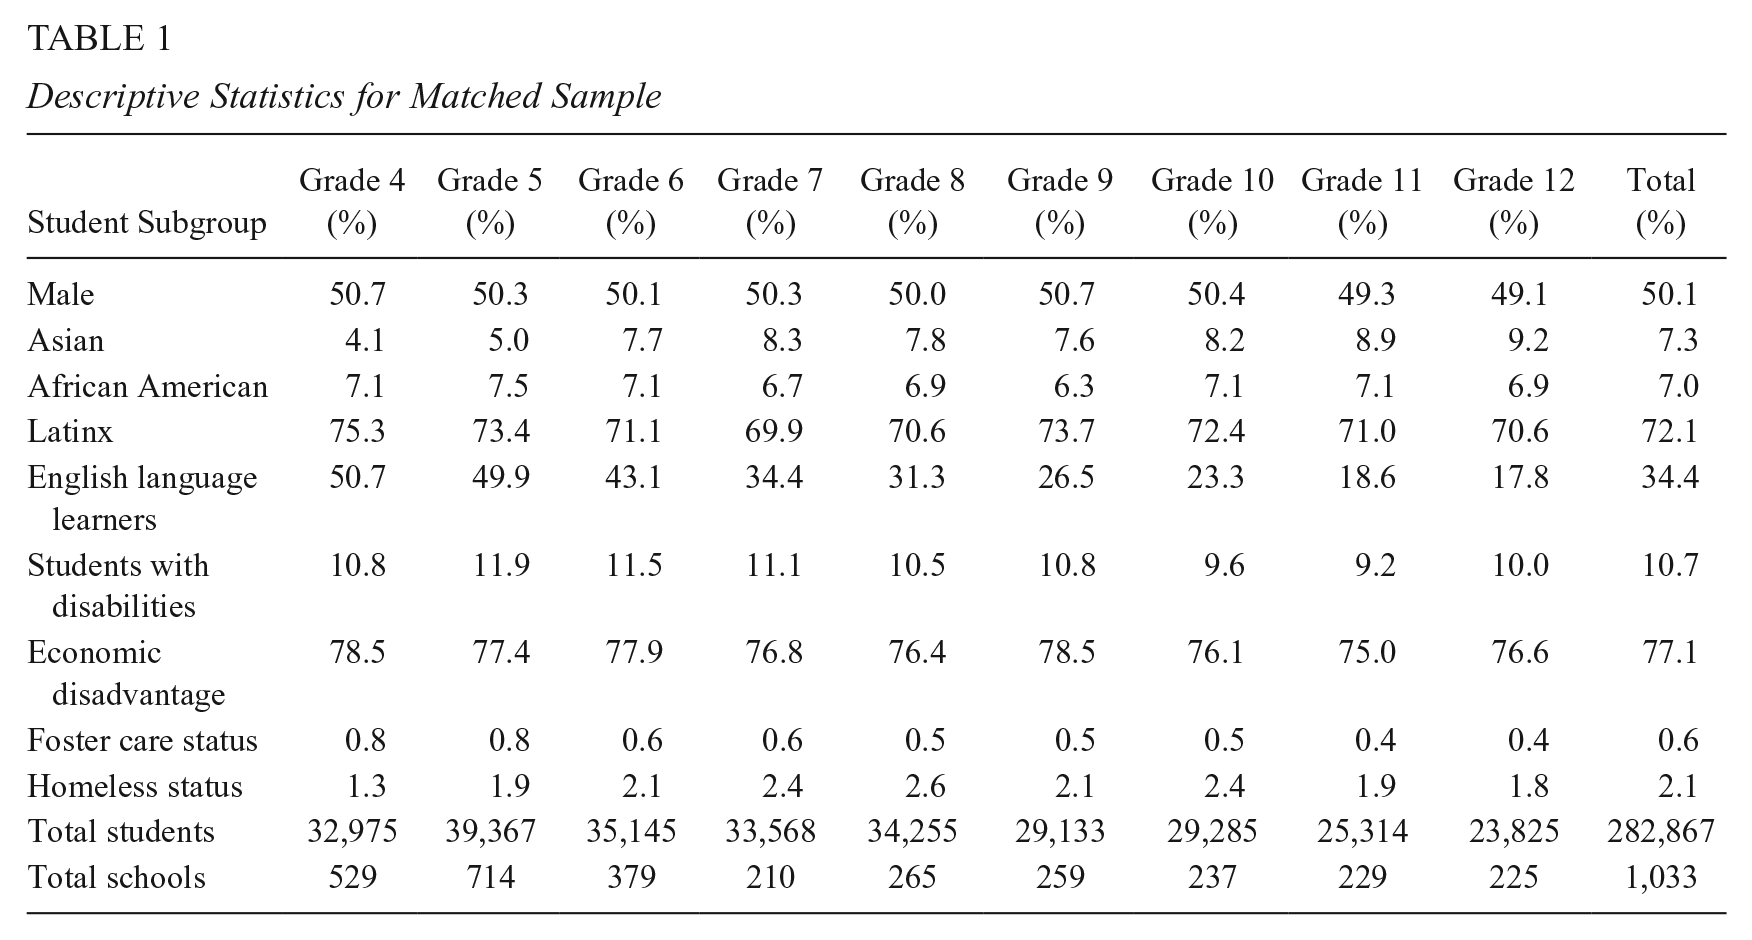
Table 1 provides descriptive statistics for the matched analytic sample. Although the precise matched sample varies across constructs because the inclusion criteria are applied separately to each construct, differences in the demographic composition of these samples are trivial. Students attending schools in the CORE Districts in these grades are predominately Latinx (72%) and economically disadvantaged (77%); 34% are classified as English language learners. Relative to all enrolled students, students in the matched sample were roughly four percentage points more likely to be economically disadvantaged and Latinx, three percentage points less likely to be African American, and one percentage point more likely to be female, to be an English language learner, and not to have a disability. All other differences in demographic characteristics were smaller than a full percentage point. These patterns are generally consistent across grade levels.
Descriptive Statistics for Matched Sample
Method for Simulating Trends
We cannot simply interpret the means of each SEL construct by grade in either the 2014–2015 or 2015–2016 cross-section as depicting true trends in students’ SEL over time for two reasons. First, there could be idiosyncratic differences in SEL across grade cohorts. Second, students with particularly high or low levels of SEL may systematically enter and exit the CORE Districts across grade levels. That is, students with particularly high or low levels of SEL may be systematically more likely to enter or exit the districts at specific grade levels. The method described below exploits the availability of repeated cross-sections from two consecutive years to address these issues.
In brief, we take the year-to-year changes in each construct for all students who complete the survey for two consecutive years, and we anchor those changes to a specific mean (for Grade 8, which is the midpoint of our data) to produce “simulated cohort trends” and their associated standard errors. This estimation method can be viewed as a model of student-level data that includes both student and year fixed effects. By holding cohort composition and student characteristics constant, this simulation approach solves the problem of idiosyncratic differences and endogenous exit and entry of students across years and grades.
For all analyses, we use a version of the GPCM true scores that have been standardized so that the mean score across grades within a construct is 0 and the corresponding standard deviation is 1. This rescaling simplifies presentation of the results but has no effect on their interpretation.
To implement this approach, we first calculate the mean gain of SEL scores,
To obtain the simulated mean score in a given grade,

For grades earlier than 8 (i.e., Grade 7 and below), the following formula estimates the simulated score for each grade and subgroup (note that the summation of the delta term continues through Grade 8, because that term is for the 7 to 8 transition):
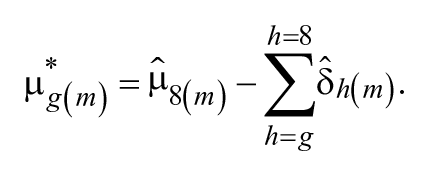
For example, for the simulated score in Grade 11, the gains of Grades 9, 10, and 11 are added to mean score in Grade 8. For the simulated score in Grade 6, the gains of Grades 8 and 7 are subtracted from the mean score in Grade 8. The variances of these means are simply the sum of the variance of their components.
The simulated cohort trends produced by this method can be interpreted as showing trends in the SEL constructs among students who would be expected to attend CORE District schools and complete the SEL survey for two consecutive years between Grade 4 and Grade 12, assuming that all aspects of the educational environment relevant to SEL development remain as they were in 2014–2015 and 2015–2016. Because they are based only on students who participated in the SEL survey in both years, the results may not be representative of the full population of students attending CORE District schools—particularly those who attend for only 1 year.
The online Table A1 reports the share of students who participated in the SEL survey in 2014–2015 but not 2015–2016 for the full sample and each subgroup for which we report results. Attrition stems from two sources: students remaining enrolled in CORE District schools but not completing surveys due to imperfect administration and from students exiting CORE District schools. The total rate of attrition ranges from 24% to 40% of students across grades. Attrition due to nonadministration increases across grades, from 17% in Grade 4% to 35% in Grade 11; attrition due to exit is highest in Grades 5 and 8, when most students transition to middle school and high school. To the extent that attrition is correlated with SEL growth rates, these patterns could influence the differences across grade levels we report below. Our choice of sample nonetheless maximizes coverage of students in the CORE Districts. Although sample selection is always a concern, many of the students who are not observed due to nonadministration may be similar to students we do observe, and no data collection within the CORE Districts would allow us to assess year-over-year trends for students who stay less than 1 year.
Results
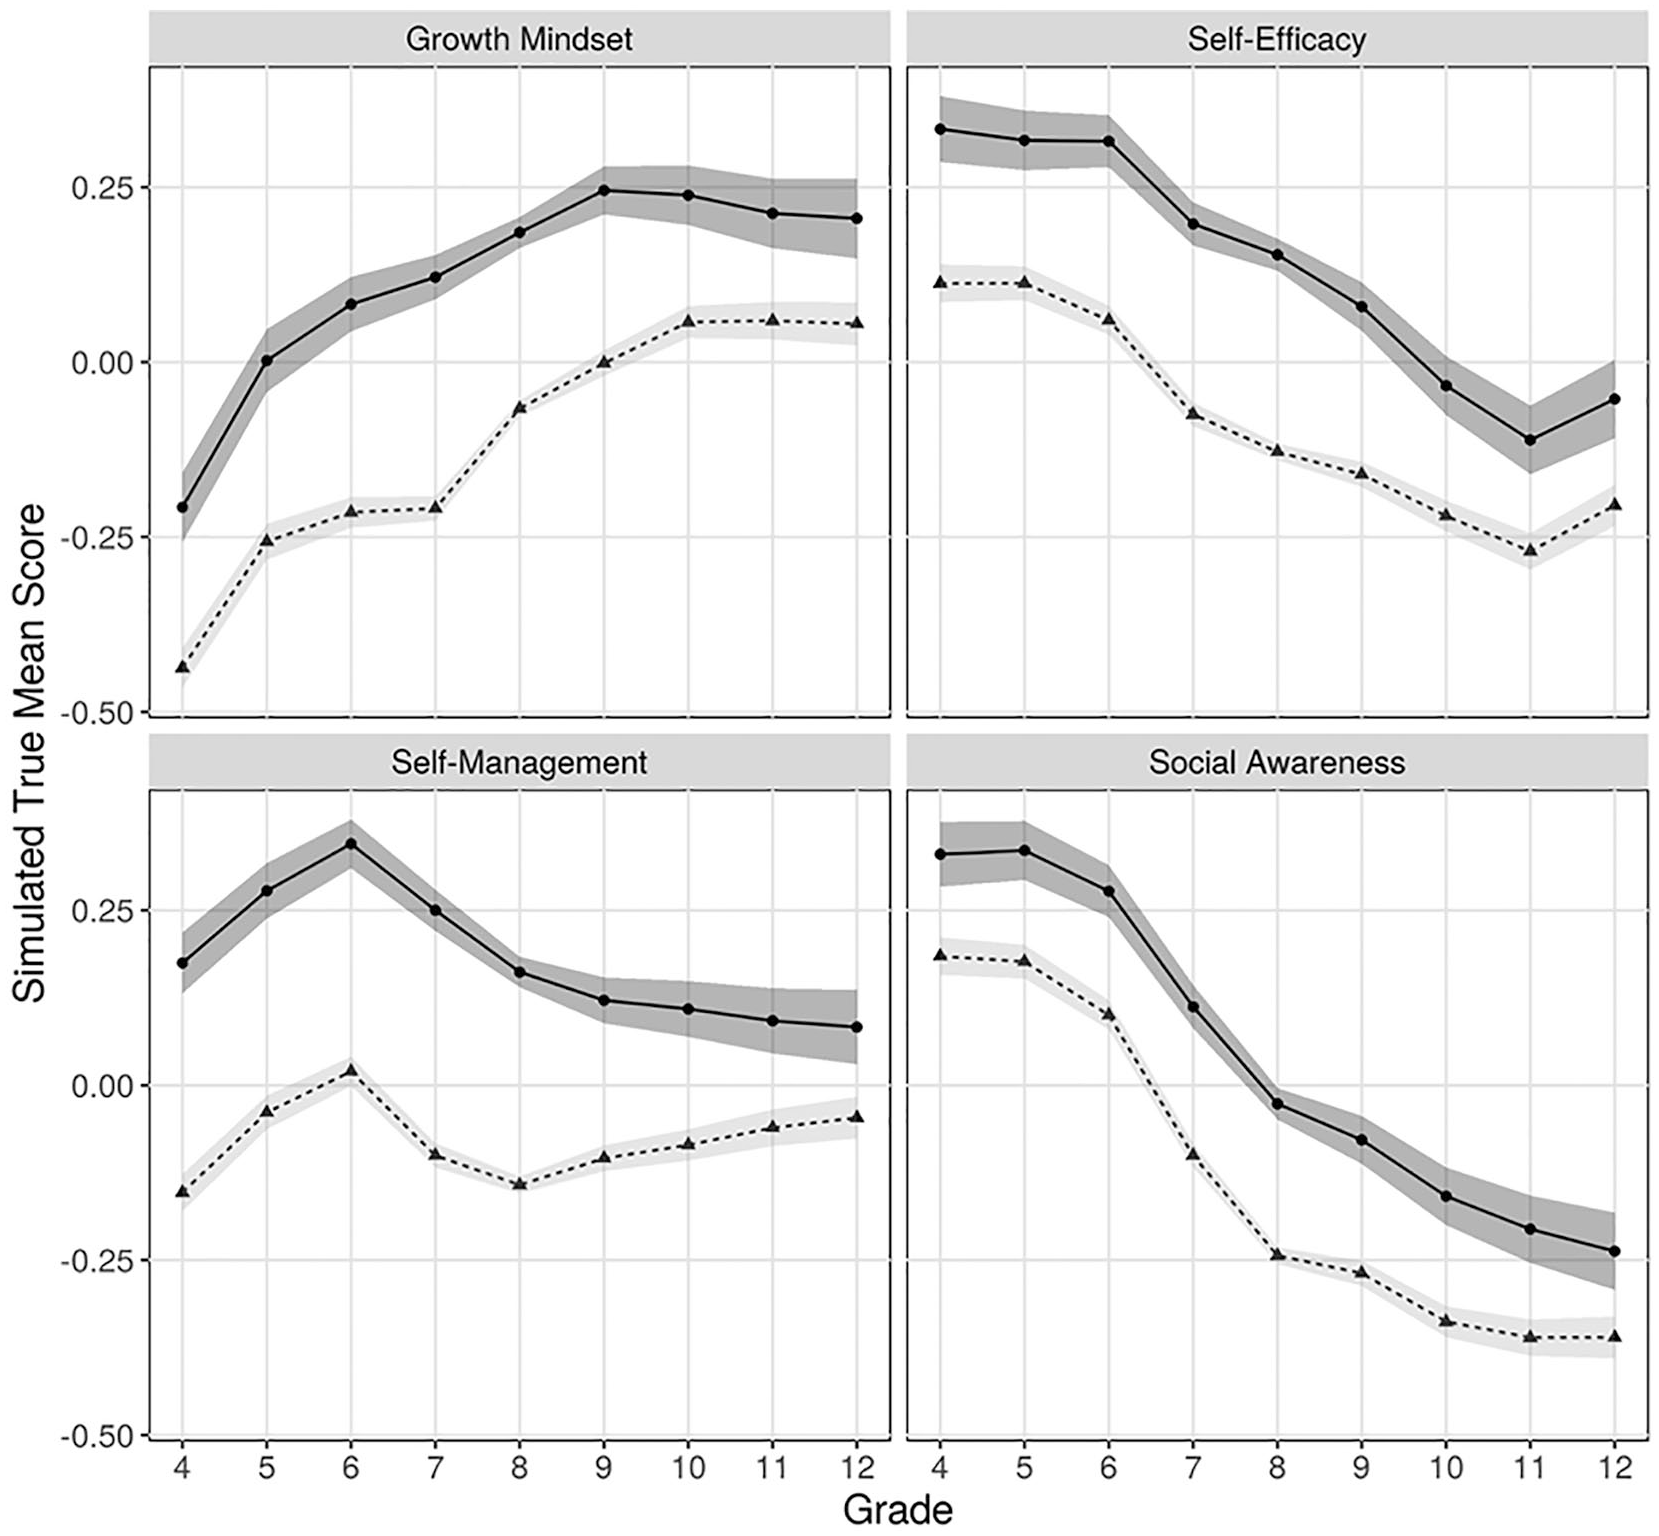
Figure 2 plots the simulated cohort trends of each SEL construct across grades for all students (dashed line) alongside the same grade-level cross-sectional (i.e., nonsimulated) mean scale scores (solid line) for each SEL measure. Because the simulations are anchored at the full-sample mean for Grade 8, the two lines overlap at that point by construction. In addition to simulated means, the figure also displays 95% confidence intervals around each simulated data point. These confidence intervals become larger as one moves away from Grade 8 in either direction, due to the compounding of measurement error from combining estimates of gain scores across multiple grade levels. Although the full-sample means are also measured with uncertainty, their confidence intervals are trivially small due to the large number of surveyed students and are excluded to enhance the figure’s legibility.

Mean social-emotional construct score: Full sample versus simulated trend based on 2015–2016 changes.
These simulated trends show that the self-reports of SEL gathered by the CORE Districts do not increase monotonically as students advance through school. Growth mindset is a partial exception, with students who remain enrolled in CORE Districts from Grade 4 to Grade 12 registering fairly consistent increases of approximately 0.06 standard deviations annually between Grade 4 and Grade 10, before leveling off through the remainder of high school. Conversely, students’ simulated scores on self-efficacy and social awareness decline by 0.38 and 0.56 standard deviations, respectively, between Grade 4 and Grade 12, with the most rapid declines occurring while students are enrolled in middle school. In the case of self-management, student simulated scores increase by roughly 0.2 standard deviations between Grade 4 and Grade 6, decline by a similar amount by Grade 8, and remain roughly stable thereafter.
The differences between the simulated and cross-sectional trends evident in Figure 2 reflect the influence of nonrandom entry into and exit from the districts participating in the SEL survey across grade levels. For example, the simulated trends show students making substantial gains in growth mindset between Grade 4 and Grade 9 that were not clearly evident in the cross-sectional analysis. Substantively, this implies that students reporting higher levels of growth mindset are more likely to exit participating districts prior to Grade 9 (or that students entering in those years tend to report lower levels). It could be the case that students with more of a growth mindset—those who believe that their intelligence can be improved with effort—are more likely to seek out alternatives to traditional public schools during the late elementary and middle school years. As a result, the increases in growth mindset made by students remaining enrolled in CORE District schools evident in the simulated trend do not translate into higher levels of growth mindset across grade levels when examined in a cross-section.
Even more striking are the gaps between the simulated trends and cross-sectional means at the end of high school, as only the latter shows evidence of improvements in each construct after Grade 10. In this case, the cross-sectional differences across grade levels appear to be a consequence of students who score lower on each SEL construct being more likely to leave CORE District high schools prior to Grade 12. Assuming that many of these students did not complete high school, this pattern constitutes evidence of the measures’ predictive validity over an important behavioral outcome. It also reinforces the fact that the simulated trends our method generates overall and by subgroup only apply to students expected to remain enrolled continuously in CORE District schools over the relevant grade span.
Subgroup Results
Figures 3, 4, and 5 present trends separately by student gender, economic disadvantage, and race/ethnicity, respectively. The SEL scores of female and male students attending CORE District schools differ notably in terms of both levels and trends. As shown in Figure 3, girls exhibit a sizable advantage over boys with respect to both self-management and social awareness that is present across all grade levels but becomes smaller as students age. In the case of self-management, girls score 0.4 standard deviations higher than boys in Grade 4 and 0.2 standard deviations higher in Grade 12; the bulk of the narrowing of the gender gap for self-management occurs between Grade 6 and Grade 8, when girls experience a larger decline in this construct. In the case of social awareness, girls’ advantage starts at 0.33 standard deviations in Grade 4 and narrows to 0.14 standard deviations by Grade 12.
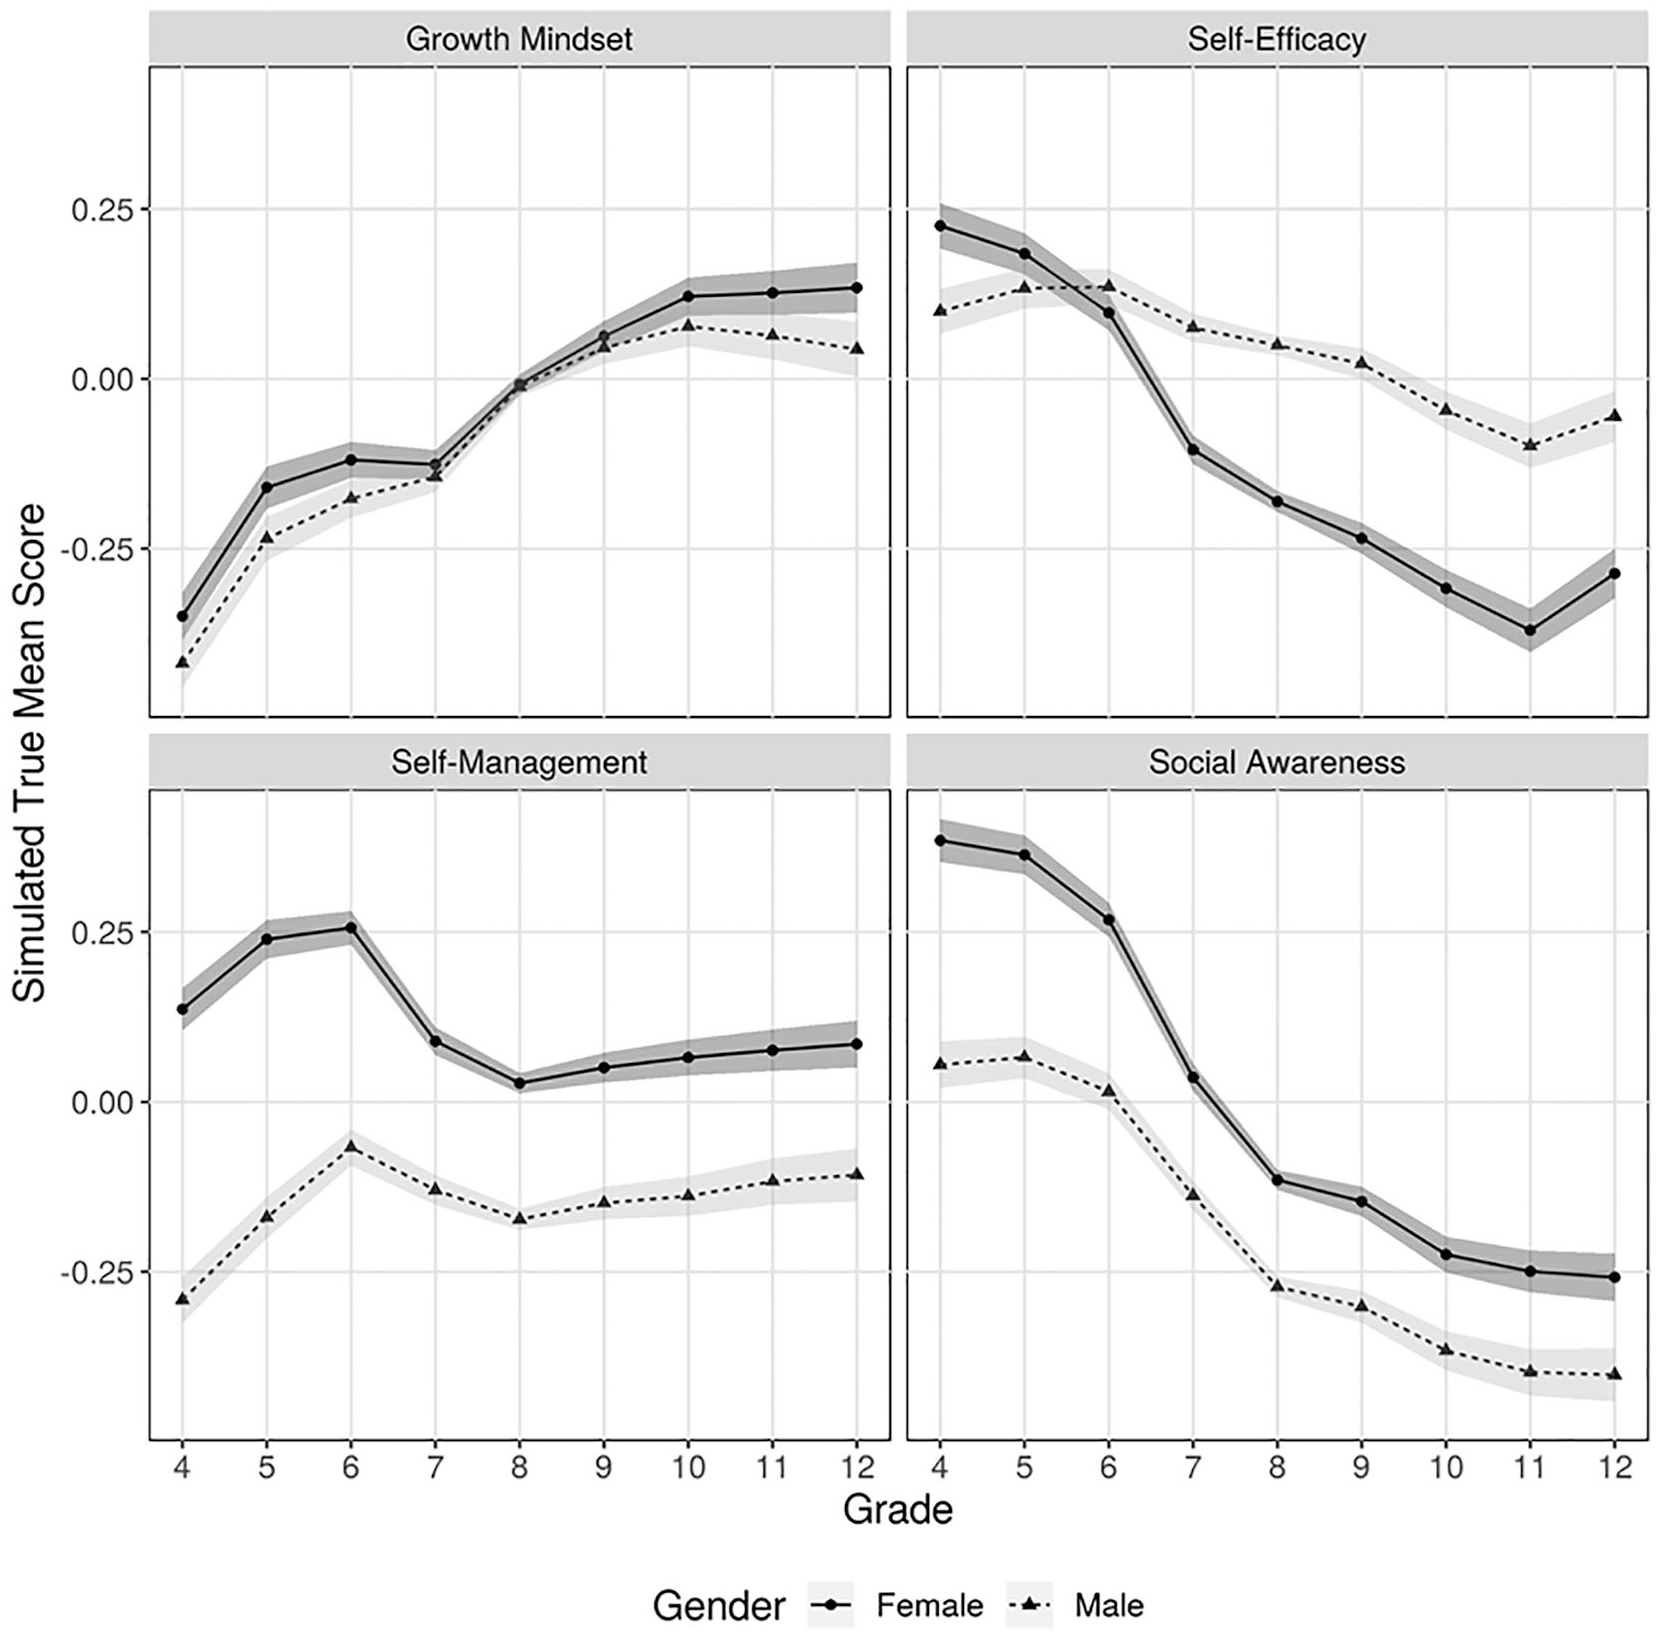
Simulated trends in mean social-emotional construct score by gender, 2015–2016.
Simulated trends in mean social-emotional construct score by economic disadvantage, 2015–2016.
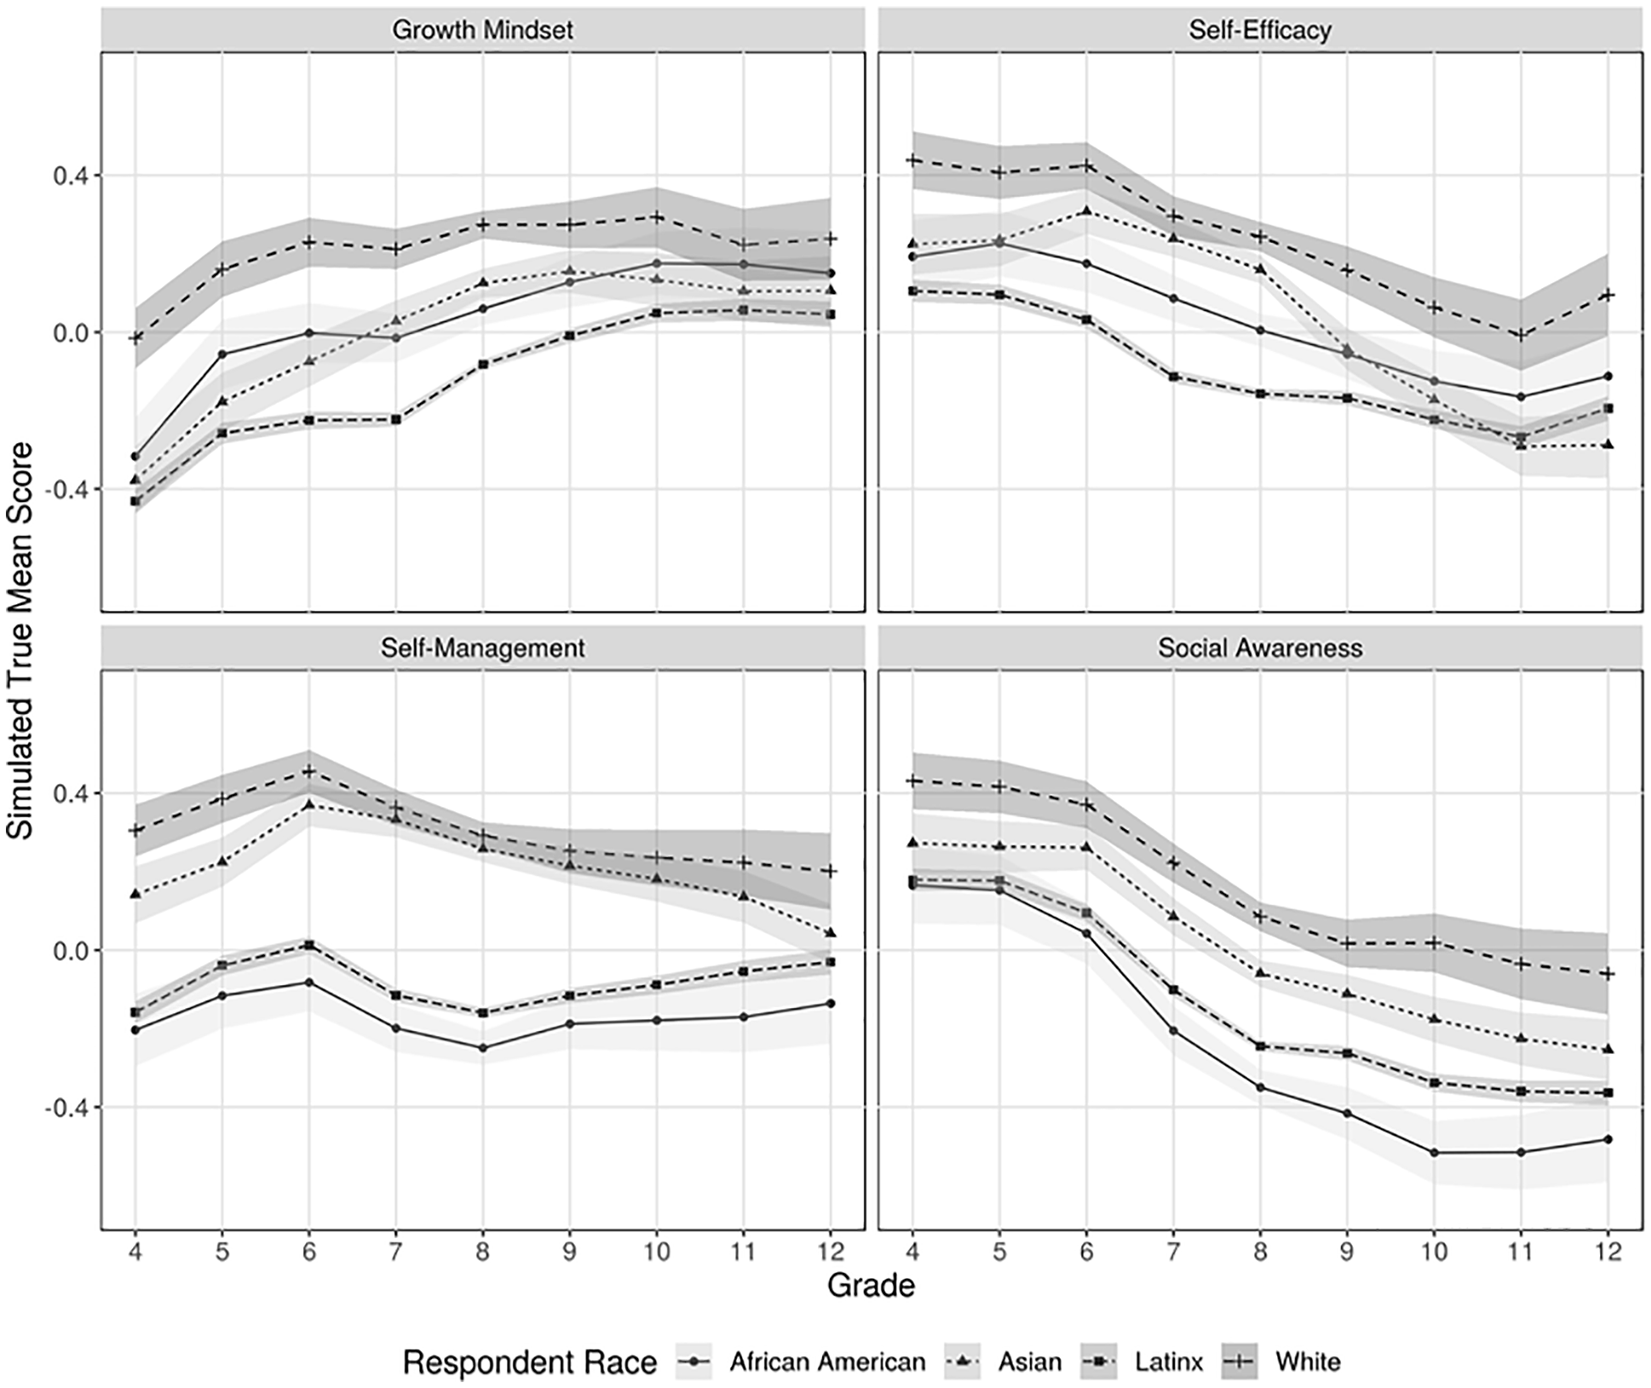
Simulated trends in mean social-emotional construct score by race/ethnicity, 2015–2016.
Trends for girls and boys differ even more dramatically for self-efficacy. For this construct, girls start out with a modest 0.13 standard deviation advantage over boys in Grade 4. However, girls experience a decline in self-efficacy that is particularly steep between Grade 6 and Grade 8; girls’ self-efficacy scores decline by 0.47 standard deviations between Grade 6 and Grade 11, before recovering modestly in Grade 12. Boys also register a decline in self-efficacy between Grades 6 and 11, but the slope in their scores is far more gradual (0.23 standard deviations). As a result, girls start to report lower self-efficacy compared with boys in Grade 6, and this gap is roughly one third of a standard deviation throughout high school.
In contrast with the other three constructs, trends with respect to growth mindset are quite similar across genders. Girls exhibit a small advantage over boys in elementary school that narrows (and becomes statistically insignificant) in middle school but reemerges in high school.
Figure 4 reveals that students who are economically advantaged report higher levels of each SEL construct across all grade levels than their economically disadvantaged peers. These gaps at Grade 4 range in magnitude from 0.2 standard deviations for social awareness to 0.35 standard deviations for self-management. The gaps widen somewhat in middle school before narrowing again in high school. For self-management, the result is a narrowing of the gap associated with economic disadvantage from 0.35 standard deviations in Grade 4 to 0.14 standard deviations in Grade 12. Gaps in growth mindset and self-efficacy also narrow over this 8-year period, but by a smaller amount.
Finally, Figure 5 documents differences in both levels and simulated trends in SEL for students of different racial and ethnic backgrounds. Consistently across grade levels, White students report higher levels of each SEL construct than do other student groups, though the levels of self-management reported by Asian students are similar to those of White students and often do not differ by a statistically significant amount. African American and Latinx students—the latter comprising the bulk of students enrolled in the CORE Districts—generally report lower levels of self-management and social awareness than do White and Asian students. In the case of self-management, these gaps narrow from 0.48 and 0.51 standard deviations in Grade 4 for African American and Latinx students, respectively, to 0.25 and 0.35 standard deviations by Grade 12. However, in the case of social awareness, the size of the gap between African American and Latinx students and White students widens modestly over the same period.
The patterns observed across racial/ethnic groups for growth mindset and self-efficacy are more complex. In Grade 4, White students report higher growth mindset by roughly 0.4 standard deviations. Although growth mindset increases for students of all races by Grade 12, these initial gaps favoring White students narrow by more than half. The timing of the largest increases in growth mindset is delayed for Latinx students, however, with the bulk of the gains occurring between Grade 7 and Grade 9, rather than in elementary school. As a result, Latinx students report noticeably lower levels of growth mindset than all other groups throughout upper elementary and middle school. In the case of self-efficacy, White, African American, and Latinx students follow similar trends from Grade 4 to Grade 12, with White students reporting higher self-efficacy than African American and Latinx students by roughly 0.2 and 0.3 standard deviations, respectively. Trends for Asian students are quite different, however. Their self-reported self-efficacy increases through Grade 6 and remains very close to that of White students through Grade 8. However, Asian students’ self-efficacy drops by more than one third of a standard deviation between Grade 8 and Grade 11, leading them to emerge as the lowest scoring group on this construct by the end of high school.
Discussion
The results of the simulated trend analyses in this article substantiate claims that the development of students’ SEL does not proceed monotonically over time (e.g., Pintrich & Zusho, 2002; Schunk & Meece, 2006; Schunk & Pajares, 2002). Self-management improves in the late elementary grades, but then decreases during middle school before tapering off in high school. This aligns with findings from other researchers (e.g., Duckworth et al., 2010; Edossa et al., 2018; Rothbart et al., 2006; Rueda et al., 2005; West et al., 2016), but unlike these studies, we examine self-management trends across both childhood and adolescence in a single data set. Self-efficacy also appears to decline in middle school, in line with previous studies (e.g., Anderman et al., 1999; Pajares & Valiante, 1999; Pintrich & Zusho, 2002; Schunk & Meece, 2006; Schunk & Pajares, 2002; Urdan & Midgley, 2003; Wigfield et al., 2006). Unlike the other constructs, students’ growth mindset seems to increase with age during early adolescence, consistent with the findings of West et al. (2016) for three schools.
Our simulated trends for social awareness differ from most existing research on social skills (e.g., Choudhury et al., 2006; Eccles, 1999; Piaget, 1972; Rubin et al., 2005; Ryan, 2001; Wigfield et al., 2006; Yurgelun-Todd, 2007). We find that social awareness in fact declines across grades, with a particularly notable plunge between Grades 6 and 9. This discrepancy is potentially due to the CORE Districts’ measure of social awareness, which asks students to quantify how often they engaged in behaviors taking others’ thoughts and feelings into account, articulating their own feelings, and getting along with others who are different from them, whereas other studies measure whether peer groups become more central to students’ identities and experiences as they age (Rubin et al., 2005; Ryan, 2001; Wigfield et al., 2006). In addition, third-party observations of students’ perspective-taking or social skills might increase as students age, even if their self-perceptions of these behaviors or skills may not.
In terms of gender differences, girls tend to display higher self-management and social awareness than boys across all grade levels, though this gap narrows over time. Although this trend has not yet been captured in the literature across elementary, middle, and high school, this generally aligns with previous research finding that girls outperform boys in these competencies (e.g., Ablard & Lipschultz, 1998; Duckworth & Seligman, 2006; Gaspar et al., 2018; Kågesten et al., 2016; Moffitt et al., 2011; Pintrich & Zusho, 2002; Wentzel, 1994; Zimmerman & Martinez-Pons, 1990).
Unlike self-management and social awareness, we found little difference in growth mindset between female and male students, which corroborates some existing research (e.g., Macnamara & Rupani, 2017; Storek & Furnham, 2013; Tucker-Drob et al., 2016), even though some scholars have suggested that girls may be more likely to endorse a fixed mindset compared with boys (Dweck, 1986, 2000). Our results indicate that boys and girls report similar levels of growth mindset across elementary, middle, and high school—even as other SEL constructs develop differently.
Indeed, the simulated trends in girls’ and boys’ self-efficacy are particularly striking; although girls report slightly higher self-efficacy in elementary school, their self-efficacy declines far more rapidly than that of boys in middle and high school, before recovering slightly in Grade 12. Although prior studies have detected similar trends in middle school, they also suggest boys and girls display similar self-efficacy in elementary school (Anderman et al., 1999; Wigfield et al., 1991, 1996). Our results indicate that girls exhibit higher self-efficacy in elementary school, implying an even greater decline in self-efficacy for girls over time. In addition, conflicting findings in the field about gender differences may stem from the differential use of measures of global self-efficacy versus domain-specific self-efficacy (e.g., Pajares, 1996; Pajares & Graham, 1999; Roeser et al., 1996; Smith et al., 2002); our findings suggest that girls and boys display different trends even on measures of global academic self-efficacy.
For students from economically disadvantaged backgrounds, our findings corroborate the broad consensus in the field that economically advantaged students report higher levels of SEL than their less advantaged peers, and that this trend persists over time (e.g., Bradley & Corwyn, 2002; Brooks-Gunn & Duncan, 1997; Kupersmidt et al., 1995; Takeuchi et al., 1991; Yoshikawa et al., 2012). However, notably, we find that socioeconomic status (SES)-based gaps in SEL tend to narrow in high school, especially for self-management. Importantly, this narrowing does not reflect the fact that students who are economically disadvantaged are more likely to drop out of high school prior to Grade 12, as our analyses include only students who were present in both years of survey data.
As family and community influences play a pivotal role in SEL (Eccles, 1999), these results suggest that schools, in particular, may have an opportunity to additionally support the development of SEL among students from economically disadvantaged backgrounds. Given that social-emotional skills are predictive of student’s academic achievement and other life outcomes (Almlund et al., 2011; Heckman et al., 2014), targeted school-based interventions may help to further family and community efforts to alleviate the detrimental effects of poverty on students’ long-term well-being and success.
Finally, both ESSA and California’s own Local Control Funding Formula (LCFF) require the disaggregation of student outcomes by race/ethnicity, highlighting the importance of understanding how SEL measures differ among students in these groups. In making such comparisons, however, it is important to keep in mind various factors that could lead students of color to respond to survey items differently than their White peers. Students of color are more likely to be economically disadvantaged and to experience trauma outside of school (Bolger et al., 1995; Chau et al., 2010; DeCarlo Santiago et al., 2011; Hackman et al., 2012); these differences not only are risk factors for social and emotional well-being, but also may make it more difficult for students of color to demonstrate the kinds of behaviors asked about in the survey. The survey items do not take into account difficulties or hardships that may influence how readily students display the behaviors the survey attempts to measure, and evidence shows that there are multiple factors outside an individual student (e.g., school community, school curricula, etc.) that influence the development of social-emotional skills (see, e.g., Hoffman, 2017). Relatedly, the CORE Districts’ school culture and climate survey also reveals that students of color rate their schools’ culture and climate less favorably than their White peers, even when they attend the same school (Hough et al., 2017); this is consistent with extensive research showing that students’ experiences within school differ by race/ethnicity, including well-documented disparities in disciplinary practices and expectations for success (Bankston & Zhou, 2002; Gregory et al., 2010; Lareau & Horvat, 1999; Lewis, 2003; Okonofua et al., 2016; Tenenbaum & Ruck, 2007; Warikoo & Carter, 2009; Watamura et al., 2011). If these factors are considered when evaluating SEL data, disaggregating the survey results by race can be useful in prompting educators and other stakeholders in schools serving diverse students to discuss how best to support students of color.
Simulated trends in students’ SEL look different for students of different racial and ethnic backgrounds and depend on the construct of interest. We see that White students report higher levels of SEL consistently over time (although Asian students’ self-management closely mirrors that of White students). However, the size and trend of the gaps, as well as the group of students affected, vary depending on the construct. In general, across grades, African American students tend to report lower levels of both self-management and social awareness relative to other racial/ethnic subgroups. Latinx students report lower levels of both growth mindset and self-efficacy compared with other racial/ethnic subgroups. Overall, these gaps narrow substantially by the end of high school. For self-efficacy, gaps among White, African American, and Latinx students do not change dramatically over time; for Asian students, however, this is not the case. Their self-efficacy decreases such that they report the lowest levels of self-efficacy by the end of high school of any racial/ethnic subgroup. This aligns with the findings of Eaton and Dembo (1997) but provides more specific evidence on how this self-efficacy gap evolves across elementary, middle, and high school.
As mentioned above, the self-report nature of the measures may elicit different kinds of response patterns from different groups of students that might either mask or exacerbate gaps among student subgroups. Ongoing research to examine these possibilities is still needed. Even so, given the lack of empirical research explicitly examining differences in how students from various racial/ethnic student subgroups develop particular social-emotional competencies (Pintrich & Zusho, 2002), these results provide much-needed preliminary insights.
Implications for Policy
In addition to contributing to the literature on social-emotional development, our results can inform ongoing efforts to use survey-based measures of SEL for policy and practice. At the most basic level, the results highlight the need for policymakers to interpret the data generated by SEL surveys in light of normative trends in students’ responses over time. Our descriptive analyses cannot establish definitively whether the substantial declines in key SEL constructs we see in certain grades reflect typical developmental patterns, or instead stem from differences in the quality of the services and supports students receive in CORE District schools. As noted above, however, they are broadly consistent with expectations from studies of adolescent development conducted in diverse settings, strongly suggesting that forces beyond the control of schools are at play.
The likely importance of nonschool factors in explaining changes in SEL across grades suggests that comparisons of metrics such as average scale scores (our focus in this article) or the percentage of students responding positively to each Likert-type-scaled item (the metric currently reported on the CORE dashboard) are apt to be misleading if used to compare the performance of schools serving different grade spans. Moreover, it suggests that the raw changes observed over time among students exposed to a given intervention are unlikely to be a reliable indication of the intervention’s effectiveness. Those raw changes should ideally be evaluated relative to a comparison group not exposed to the same intervention. At a minimum, they need to be interpreted in light of typical trends.
Our results also reveal how cross-sectional comparisons of self-reported SEL across grade levels can provide a misleading picture of how students are faring in the aggregate, particularly for high school students. For example, Figure 2 shows that such naive comparisons would lead policymakers to conclude that students within the CORE Districts experience substantial gains in self-management and social awareness while in high school. In contrast, by focusing on within-student changes over time, our simulation method reveals that this pattern is an artifact of students with lower self-management and social awareness scores leaving CORE District high schools.
The differences in both levels and trends we document across demographic subgroups can also inform the use of SEL survey data as measures of school performance. For example, we find substantial gaps in students’ self-reports of their social-emotional skills favoring economically advantaged and White students over lower-income students and students of color. The extent to which these gaps reflect authentic differences in student skills requires further research. In particular, the questions used to gauge students’ skills may not be adequately sensitive to systematic differences in home or school environments that lead students to report on their skills differently. Even so, the magnitude of the differences we document suggests the importance of applying demographic adjustments when using SEL survey data to inform judgments about school performance.
One potential application of these measures to inform such judgments is the use of relative change or growth models to estimate the impact schools have on students’ SEL from one year to the next (e.g., Fricke et al., 2019; Loeb et al., 2019). These models can incorporate demographic adjustments and effectively eliminate normative differences in responses across grade levels by standardizing students’ scores by grade. Forty-eight states now use such models to gauge schools’ contribution to growth in academic achievement as part of their formal accountability systems (Data Quality Campaign, 2019). Our prior work using the CORE survey data to estimate similar models for SEL has documented between-school differences in students’ gains in SEL constructs similar in magnitude to differences in their gains in math or ELA (Loeb et al., 2019). However, these between-school effects are considerably less stable over time than is the case for similar models based on measures of academic achievement (Fricke et al., 2019). Additional work is therefore needed to assess whether these measures could be appropriately used to evaluate school quality or performance.
In the meantime, a more promising use of the SEL data may be to leverage aggregate data to set priorities for supporting students’ social-emotional development and to target interventions and support. For example, prior evidence showing that many students experience a decline in self-esteem and school engagement as they move from elementary school to middle school (Blum & Libbey, 2004; Eccles et al., 1991, 1993) has motivated the development of SEL-focused interventions aimed at supporting students through this transition (see, e.g., Blackwell et al., 2007). As noted in the introduction, policymakers and educators within CORE are already using the SEL data to set district-wide and school-specific priorities (Toch & Miller, 2019) and to target supports for specific individuals or groups (J. A. Marsh et al., 2018). While the success of such efforts will depend on the strength of available interventions and the quality of their implementation, the results in this article provide an empirical basis for prioritizing certain concerns over others. Over time, this process of priority-setting could be further enhanced by analyses of the relationship between SEL constructs and students’ success in post-secondary education and the labor market.
Conclusion
This article has used the first large-scale panel survey of SEL outcomes to examine trends in students’ social and emotional learning across grades, and how those trends differ across student subgroups. We apply an innovative method for simulating cohort trends to estimate how self-reports of students’ self-management, growth mindset, self-efficacy, and social awareness develop between Grade 4 and Grade 12 among students participating in the CORE Districts’ SEL survey in the 2014–2015 and 2015–2016 school years.
We find that self-efficacy, social awareness, and, to a lesser degree, self-management decrease after Grade 6. These findings corroborate prior evidence that, unlike academic achievement, the development of students’ social-emotional skills does not proceed monotonically over time (e.g., Schunk & Meece, 2006; Schunk & Pajares, 2002). These trends are crucial for educators and policymakers to understand as they seek to make sense of patterns observed in their students. Declines across grades in a given construct might not be alarming, for example, but rather a sign of typical development. It also may be the case that changes over time reflect changes in normative standards, rather than students’ underlying skills. For instance, self-efficacy may decline at least in part because younger students tend to overestimate their capabilities and become more realistic as they mature (Pintrich & Zusho, 2002). Moreover, the contrasting patterns observed for growth mindset compared with the other three constructs illustrate how different constructs within the SEL domain vary in their development over time, indicating that they should be measured and assessed individually.
We also find that the development of social-emotional skills as measured by student self-reports varies across subgroups. Girls initially report higher levels of SEL than boys, but these gender gaps narrow over time, and girls experience a sharp decline in self-efficacy in middle school that leads them to fall behind boys on this construct through the end of high school; economically disadvantaged students consistently report lower SEL; and White students generally report higher SEL than Asian, African American, and Latinx students. Because these differences may be driven by differences in social norms rather than true discrepancies in social-emotional competencies, more work is needed to understand where particular subgroups may need additional support at various points in their educational trajectories. Nonetheless, our results suggest that schools may have an opportunity to additionally support the development of social-emotional skills among student groups who report low levels of these constructs.
There are several caveats to the findings presented here. First, student self-report measures have well-known limitations (Duckworth & Yeager, 2015). For instance, given the likely multi-dimensionality of the latent constructs underlying SEL, self-report measures may capture only a specific aspect of a given social-emotional competency. It also may be the case that measured changes over time reflect changes in students’ normative standards (i.e., reference bias), rather than students’ underlying skills. At the same time, our findings generally align with those of previous studies looking at individual constructs over shorter time horizons. Second, we can follow the development of individual students’ SEL only from one school year to the next; although we simulate cohort trends from Grade 4 to Grade 12, longitudinal analyses following a cohort through Grades 4 to 12 would provide more precise estimates of individual development over time. Third, our specific findings may not generalize to settings outside the California school districts in which the data were gathered.
The data from the CORE Districts’ SEL survey nonetheless provide a unique opportunity to assess students’ social-emotional development across elementary, middle, and high school, and our results yield a number of useful insights for policy and practice. In the CORE Districts alone, these data already inform actions and decisions by policymakers, administrators, and educators together serving more than 1 million students (J. A. Marsh et al., 2018). As additional school systems gather data on SEL at scale, using either survey-based measures or alternative forms of assessment, it should become possible to learn whether the patterns we document hold more generally. It is only by better understanding how SEL typically proceeds over the course of students’ educational careers that practitioners, researchers, and policymakers can begin to make sense of the patterns of development they see in their own data, for their own students.
Supplemental Material
Elizabeth_Pier_Online_Appendix – Supplemental material for Trends in Student Social-Emotional Learning: Evidence From the First Large-Scale Panel Student Survey
Supplemental material, Elizabeth_Pier_Online_Appendix for Trends in Student Social-Emotional Learning: Evidence From the First Large-Scale Panel Student Survey by Martin R. West, Libby Pier, Hans Fricke, Heather Hough, Susanna Loeb, Robert H. Meyer and Andrew B. Rice in Educational Evaluation and Policy Analysis
Footnotes
Acknowledgements
This article was produced as part of the CORE-PACE Research Partnership, which is focused on producing research that informs continuous improvement in the CORE Districts (Fresno, Garden Grove, Long Beach, Los Angeles, Oakland, Sacramento City, San Francisco, and Santa Ana Unified School Districts) and policy and practice in California and beyond. We thank the leaders and administrators in the CORE Districts for their support throughout this project, and the generous funder of this research, the Walton Family Foundation. Finally, we thank Jordan Mader and Hayley Tymeson for their invaluable contributions to the analyses in this article.
Declaration of Conflicting Interests
The author(s) declared no potential conflicts of interest with respect to the research, authorship, and/or publication of this article.
Funding
The author(s) disclosed receipt of the following financial support for the research, authorship, and/or publication of this article: The research reported in this presentation was supported by the Walton Family Foundation (Grant # 2017-1553). The content is solely the responsibility of the authors and does not necessarily represent the official views of WFF.
Notes
Authors
MARTIN R. WEST is the William Henry Bloomberg Professor of Education at the Harvard Graduate School of Education. His research interests are the politics of K–12 education in the United States and how education policies affect student learning and noncognitive development.
LIBBY PIER is the research manager at Education Analytics. Her research interests include social-emotional learning, predictive modeling, and the intersection of cognitive and sociocultural perspectives on learning.
HANS FRICKE is an economist at Amazon.com, Inc. He was the director of Quantitative Research at Policy Analysis for California Education when producing this work. His research interests include economics of education, education policy, behavioral interventions in education, and causal analysis.
HEATHER HOUGH is executive director of Policy Analysis for California Education. Her research interests are district- and state-level policymaking and implementation, with a focus on policy coherence, system improvement, and school and teacher accountability.
SUSANNA LOEB is the director of the Annenberg Institute and professor of Education and International and Public Affairs at Brown University. She was formerly the Barnett Family Professor of Education and founding director of the Center for Education Policy Analysis at Stanford University. Her research interests are educational outcomes and their distribution, school finance and governance, and educator development, effectiveness, and labor markets.
ROBERT H. MEYER is president and CEO of Education Analytics and Professor Emeritus at the University of Wisconsin–Madison LaFollette School of Public Affairs. His research interests are value-added modeling, evaluation methods, strategic management of human capital, and social-emotional learning.
ANDREW B. RICE is chief operating officer at Education Analytics. His research interests are predictive modeling, school accountability models, assessment data, social-emotional learning, and data systems.
References
Supplementary Material
Please find the following supplemental material available below.
For Open Access articles published under a Creative Commons License, all supplemental material carries the same license as the article it is associated with.
For non-Open Access articles published, all supplemental material carries a non-exclusive license, and permission requests for re-use of supplemental material or any part of supplemental material shall be sent directly to the copyright owner as specified in the copyright notice associated with the article.
