



Abstract
A vast research literature documents racial bias in teachers’ evaluations of students. Theory suggests bias may be larger on grading scales with vague or overly general criteria versus scales with clearly specified criteria, raising the possibility that well-designed grading policies may mitigate bias. This study offers relevant evidence through a randomized Web-based experiment with 1,549 teachers. On a vague grade-level evaluation scale, teachers rated a student writing sample lower when it was randomly signaled to have a Black author, versus a White author. However, there was no evidence of racial bias when teachers used a rubric with more clearly defined evaluation criteria. Contrary to expectation, I found no evidence that the magnitude of grading bias depends on teachers’ implicit or explicit racial attitudes.
Keywords
A vast research literature shows that teachers give racially biased evaluations of student work (for reviews, see Ferguson, 2003; Malouff & Thorsteinsson, 2016; Tenenbaum & Ruck, 2007). Downwardly biased evaluations can lead to actual reductions in student learning through self-fulfilling prophesies, or teacher expectancy effects (e.g., Ferguson, 2003). Such effects may be far-reaching, given that students’ future teachers base their expectations in part on the biased evaluations of previous teachers. Biased evaluations may also produce stereotype threat (Steele, 2011), which negatively affects students’ short-term performance and their learning over the longer term (Taylor & Walton, 2011). Furthermore, when students detect bias from their teachers, they are unlikely to develop trusting relationships with those teachers and may disengage from that class, or—over time—school more generally (Rangvid, 2018; Woodcock et al., 2012).
Theory suggests that the magnitude of evaluation bias may depend on characteristics of the evaluation tool (Malouff & Thorsteinsson, 2016; Payne & Vuletich, 2018; Uhlmann & Cohen, 2005). When evaluation criteria are subjective or ambiguous, teachers’ implicit or explicit stereotypes have greater potential to influence their grading. When evaluation criteria are clear and specific, teachers’ judgments may be less susceptible to bias (Uhlmann & Cohen, 2005). The adoption and promotion of clear evaluation criteria may therefore be a simple policy lever for instructional leaders aiming to reduce racial bias in student evaluations. However, experimental research comparing bias across different scoring metrics is lacking.
In the present study, I replicate and extend experimental work on teacher bias in grading. I replicate—in a U.S. setting—prior research from outside the United States showing racial/ethnic bias in teachers’ evaluations of student work when performance criteria are relatively vague. I extend this work by studying whether such evaluation bias is present on a clear and specific criterion-referenced rating scale. I also study whether the magnitude of evaluation bias differs by teachers’ implicit and explicit racial attitudes. In exploratory analyses, I examine whether bias differs by teacher demographics (i.e., racial match effects) or the racial demographics of teachers’ school settings.
Background
Documenting Evaluation Bias
Researchers have documented racial bias in teachers’ evaluations of students through observational, experimental, and quasi-experimental designs. Tenenbaum and Ruck (2007) conducted a comprehensive meta-analysis of the early studies on teachers’ racial/ethnic biases for social and academic evaluations. The experimental studies they reviewed typically elicited teachers’ ratings of students through vignettes or student work samples accompanied by photographs. In observational studies, teachers would often rate their actual students, then researchers would estimate bias by comparing teachers’ covariate-adjusted ratings across social groups. The meta-analysis showed an average bias in favor of White students over Black students of d = .25 (30 studies), White students over Latinx students of d = .46 (6 studies), and Asian students over White students of d = −.17 (3 studies). Across the experimental studies, most manipulation methods (photo, audio/visual, simulated teaching) showed significant bias in favor of White students (d = .21–.51), although vignette studies were an exception (with teachers showing average bias against White students of d = −.10 [13 studies]). The authors speculated this could be due to the vignettes not being realistic enough to trigger differential evaluations.
A more recent meta-analysis of the experimental research on grading bias by Malouff and Thorsteinsson (2016) examined studies of bias based on student race/ethnicity, gender, physical attractiveness, and disability status. Across 23 studies from 20 research articles, the authors found an average grading bias of g = .36. Seven of these studies (from five reports) examined racial or ethnic bias, with an average effect of g = .26. Only one of these studies took place in the United States, which was a small, under-powered dissertation testing for Black/White bias (Gerritson, 2013). One goal of the present work is therefore to replicate previous bias research with U.S. teachers in regard to Black/White bias.
In the more recent research on grading bias, scholars from outside of the United States have used quasi-experimental methods to test for evaluator bias. Although the generalizability of this work to racial bias in American contexts is uncertain, the findings raise important questions in need of investigation domestically. Several of these studies have estimated gender bias in grading by comparing gender differences in scores on exams that were scored anonymously (i.e., the grader was not aware of the student’s identity) to gender differences on (often separate) exams that were scored with knowledge of the student’s identity (Falch & Naper, 2013; Hinnerich et al., 2011; Lavy, 2008; Protivinsky & Munich, 2018; Rangvid, 2018; Terrier, 2016). Results from these studies have been mixed, with some finding teachers favoring females in math and reading (Falch & Naper, 2013; Lavy, 2008; Protivinsky & Munich, 2018), some finding teachers favoring females in math but not reading (Terrier, 2016), some finding teachers favoring males in math but not reading (Lavy & Sand, 2015), and others showing no bias at all (Hinnerich et al., 2011). Direction of the bias aside, longitudinal studies using this approach have suggested that teacher bias has long-term effects on students’ future exam performance, course-taking choices, and field of study (Lavy & Megalokonomou, 2019; Lavy & Sand, 2015; Terrier, 2016).
In recent experimental studies, researchers have asked teachers to score student work samples that were randomly assigned student names signaling different gender and ethnic identities. Two such studies found that German teachers scored essays more favorably when purportedly written by an ethnic German student compared with when purportedly written by a student of Turkish descent (Bonefeld & Dickhauser, 2018; Sprietsma, 2013). In India, teachers discriminated against lower caste students (by 0.03–0.09 SD) and high-performing girls (Hanna & Linden, 2009). However, a Dutch study using this method did not find bias in teachers’ evaluations of students from Turkish or Moroccan backgrounds compared with ethnic Dutch students (van Ewijk, 2011). Methodologically, these studies offer evidence with strong internal validity regarding the causal effect of students’ identities on teachers’ evaluations. Such designs can help us better understand the extent to which similar bias effects generalize to the United States.
Implicit Stereotypes and Teachers’ Evaluations
What policy tools might successfully mitigate grading bias? Devising effective policy solutions requires that we understand the mechanisms underlying biased grading. Teachers’ biased evaluations could be driven by either their explicit or implicit racial attitudes. Some teachers hold explicit racial stereotypes—or stereotypes they consciously endorse—which are liable to affect their treatment of racially minoritized students (e.g., Farkas, 2003; Quinn, 2017). However, it is likely more common for teachers to hold implicit racial stereotypes that influence their evaluations (Chin et al., in press; Warikoo et al., 2016). An implicit stereotype is one that is not identifiable through introspection (Greenwald & Banaji, 1995). Implicit stereotypes can be automatically activated in one’s mind (Devine, 1989), leading to biased behaviors or judgments (Greenwald & Krieger, 2006). Thus, teachers can exhibit implicit bias even when they do not consciously endorse the implicit stereotype from which it stems (Devine, 1989).
Implicit racial stereotypes may lead teachers to rate work produced by a Black student less favorably compared with the rating they would have given the same work had it been produced by a White student. Work by a Black student can automatically call to teachers’ minds the stereotype of African Americans as unintelligent. This stereotype can then, perhaps unbeknownst to the teacher, lead them to judge the work as being consistent with the stereotype. As such, we would expect teachers holding stronger implicit racial stereotypes to exhibit larger racial biases when evaluating students. I test this hypothesis in the present study.
Policy Options for Mitigating Bias
Two main categories of policy levers are available to education leaders aiming to mitigate racial bias in grading. One approach focuses on professional development that “de-programs” individuals’ implicit attitudes through methods such as repeated exposure to counterstereotypical examples. A meta-analysis (Forscher et al., 2018) of 494 studies showed such interventions can be effective at reducing measures of individuals’ implicit attitudes, with an average effect size of d = .30. However, these reductions in negative implicit attitudes did not lead to behavioral changes (Forscher et al., 2018). Consequently, we might expect that attempts to combat grading bias by training teachers to unlearn their general implicit stereotypes would be ineffective.
Another approach focuses on policies that engineer circumstances to reduce the influence that implicit attitudes exert on peoples’ behaviors or judgments. Given that implicit stereotypes reflect content that is readily accessible in one’s mind at the moment, stereotypes are less likely to influence decision-making when people have an opportunity to process information more carefully (Payne & Vuletich, 2018). Implicit stereotypes can be more influential when cognitive load is high (e.g., when people are distracted), when processing capacity is diminished (e.g., when people are fatigued or under stress), or when time is limited. Teachers and administrators may therefore be able to reduce bias in grades by ensuring that evaluations are conducted free of distractions and with sufficient time. Under these circumstances, teachers have available the necessary cognitive resources to assess work fairly. This makes them less likely to rely on stereotypes in place of the more taxing or time-consuming cognitive work of sober evaluation. Another obvious strategy (for which empirical evidence is available through the studies described above) is to employ anonymous grading. However, anonymous grading will not always be feasible, and the improvements in teachers’ grading conditions described above would not eliminate all pathways through which stereotypes can influence evaluations.
Other specific policies that may reduce the influence of teachers’ biases on grading are those that articulate how educators should evaluate student work. Although current debates about grading policy do not typically invoke the issue of racial bias (Brookhart et al., 2016; O’Connor et al., 2018; Reeves, 2008), some major grading reforms—such as standards-based grading (SBG) and mastery grading—may nevertheless offer the benefit of mitigating bias.
At the core of SBG and mastery grading policies is the philosophy that performance criteria should be predetermined and clearly specified (Brookhart et al., 2016). With SBG, student work is compared with grade-level performance levels articulated through ordered categories (such as “below basic,” “basic,” “proficient,” “advanced”). Mastery grading similarly establishes clear mastery standards but evaluates student performance on a binary mastered/not mastered scale (Brookhart et al., 2016).
Theory on implicit bias suggests that predetermined and clearly specified standards may help reduce grading bias because vague evaluation criteria leave more room for teachers’ implicit biases to influence their judgments. If teachers are evaluating student work and they are unsure what standard to compare the work with, implicit stereotypes can “fill in the blanks.” In addition, research suggests that people shift their evaluation criteria to match the qualifications of people from groups they prefer (Uhlmann & Cohen, 2005). When evaluation criteria are clearly defined beforehand, there is no opportunity for such criteria shifting. As such, teachers may exhibit less bias when clear and specific evaluation standards are employed, versus when vague and general criteria are employed. For example, if teachers are asked to rate a piece of student writing on a scale of 1 to 10 where higher values simply indicate higher quality, teachers may shift their indicators of quality to match their biased expectations about which student groups would produce the higher quality writing. In contrast, if the dimensions of evaluation are predetermined through specific writing traits—and if criteria for specific performance levels are clearly articulated—teachers will be oriented toward the aspects of the student work that are relevant to their evaluation.
Despite the popularity of SBG and mastery grading among reformers, research suggests that U.S. teachers typically have a great deal of autonomy in how they determine student grades (Brookhart et al., 2016). When formal grading policies do exist, they tend to involve broad strictures such prohibiting teachers from giving students zero credit on assignments (Walker, 2016), or policies that limit the extent to which nonachievement factors can affect students’ grades (Cox, 2011). Furthermore, evidence suggests that the implementation of grading policies varies widely across teachers (Cox, 2011), with many teachers lacking familiarity with the policies (Tierney et al., 2011). Grading policy—implemented with a focus on teacher training and buy-in—deserves more attention as a potential tool for mitigating racially biased grading practices.
There is suggestive evidence that policies that clarify performance standards may help reduce grading bias. In the experimental and quasi-experimental studies discussed above, information is not always provided regarding whether explicit evaluation criteria were used by raters. In the cases in which rater discretion was explicitly noted or in which vague rating scales were described, grading bias against various social groups was found (Bonefeld & Dickhauser, 2018; Hanna & Linden, 2009; Sprietsma, 2013). In contrast, no evidence of bias was found in the one study that noted the use of explicit grading guidelines (Hinnerich et al., 2011). In their meta-analysis, Malouff and Thorsteinsson (2016) tested whether the use of grading rubrics moderated the magnitude of bias estimates across studies. Although effect sizes did not differ significantly depending on rubric use, results were suggestive: The average effect size across the 6 studies using rubrics was not significant and was smaller in magnitude than the average effect size across the 17 studies that did not use a rubric (g = .24 vs. .39). However, these estimates are noisy and cross-study confounds cannot be ruled out.
If some evaluation methods or metrics are less susceptible to bias than others, instructional leaders have a simple low-cost policy tool available for reducing bias in grading. Leaders at the school and district levels may be able to design evaluation procedures to minimize bias, provide professional development on these procedures, and even encourage their use through negotiating professional teaching standards. Teacher preparation programs also may have a role to play in preparing and encouraging teachers to use evaluation tools or procedures. At the state-level, procedures for scoring statewide writing tests may be designed to minimize bias. The first step is to produce evidence regarding the extent to which different evaluation metrics yield biased scores.
Summary and Study Hypotheses
Plentiful research has documented bias in teachers’ evaluations of student work. However, very little recent experimental research has been conducted in the United States on Black/White bias in grading. Theory suggests that less bias may be evident when clear criterion-referenced evaluation standards are employed, versus vague and general criteria. If biases are more likely to appear on some rating scales than others, adopting tools less susceptible to bias may be a simple policy lever for reducing biased grading. However, we lack experimental research on the extent to which bias exists across different measures. Finally, it will be beneficial to examine whether measures of teachers’ implicit or explicit racial attitudes moderate grading bias. Such knowledge will be useful to teachers and policymakers who are working to eliminate the effects of bias on student evaluation.
In this study, I begin by replicating past experimental work on grading bias, but in a U.S. context and with regard to Black/White bias. Most importantly, I hypothesized that (a) teachers would show racially biased evaluations of student writing when employing a vague grade-level rating scale, but (b) teachers would show less, or no, bias in evaluations when given a more specific criterion-referenced rating scale, and (c) grading bias would be larger among teachers holding stronger implicit stereotypes of Black students as lacking competence (as measured by an implicit association test [IAT]), and with more explicit preference for European versus African Americans (as measured by feeling thermometers). I find evidence in favor of the first two hypotheses but not the third. In addition, I conduct exploratory analyses examining whether the magnitude of bias on the vague relative scale differed by characteristics of teachers or their schools.
Method
Participants and Procedures
I conducted this Web-based survey experiment by contracting with Qualtrics to recruit a national (although not nationally representative) sample of U.S. schoolteachers (respondents were compensated directly by Qualtrics). The target sample size was 800 teachers, yielding .80 power to detect a bias main effect of 0.20 SD (in the binary outcome metrics employed below, this yields .80 power to detect a treatment/control group difference of approximately 0.10 or 0.07 for control group proportions of 0.50 and 0.10, respectively). All panel participants who were pre-K–12 teachers were eligible, and Qualtrics terminated data collection when 810 participants had completed the entire survey. Of the 1,799 unique respondents who clicked the survey link, 163 were terminated immediately because they were not in fact teachers. The remaining 1,636 participants completed the experimental phase of the survey (writing evaluation task, demographic questionnaire, and explicit bias measure). 1 During administration of the IAT (described below), however, a large share of respondents abandoned the survey (hence the sample size discrepancies between the main effects analyses and the IAT moderation analyses). Of those who completed the entire survey, 706 produced valid IAT scores (with some participants’ excessive speed preventing score calculation). Finally, a total of 87 respondents were dropped from the analyses because they did not self-identify as a current full-time pre-K–12 teacher (e.g., retired teachers, substitute teachers, teachers’ aides, parents homeschooling their children). This resulted in an analytic sample of 1,549 for the main effect analyses and the analyses testing for moderation by explicit racial attitudes; 675 teachers were included in the analyses testing for moderation by implicit stereotypes (see Online Appendix A for comparisons of the IAT analytic sample vs. those not in the IAT analytic sample, as well as comparisons across experimental condition among teachers in the IAT analytic sample). The actual sample sizes yield .80 power to detect a main effect of 0.14 SD, or approximately 0.07 and 0.05 for treatment-control proportion differences when control group proportions are 0.50 and 0.10, respectively.
At the start of the survey, teachers were informed that the researcher was interested in learning how educators evaluate student writing. Teachers then answered questions about their teaching background (current position, years in the field of education) before being randomly assigned to receive one of the two versions of a student writing sample that used different names to signal a Black or White student author (described below). Participants were required to respond to each item before proceeding to the next.
In Table 1, I present descriptive statistics by experimental condition and balance checks for the full analytic sample(s). Differences across conditions in pretreatment characteristics were not large (although some were statistically significant or marginally significant; see Table 1). The “Black author” group had slightly more female teachers (64% vs. 59%) and slightly more K–2 and Grade 3 to 5 teachers. The sample was majority White (~69%); the modal teacher taught in a predominantly White school (~54%) and had been in the field of education for 7 to 10 years (~24%). For comparison, I include statistics for teachers nationally, as available.
Descriptive Statistics by Condition With Comparisons to Nationally Representative Estimates for Teachers in 2015 to 2016 School Year
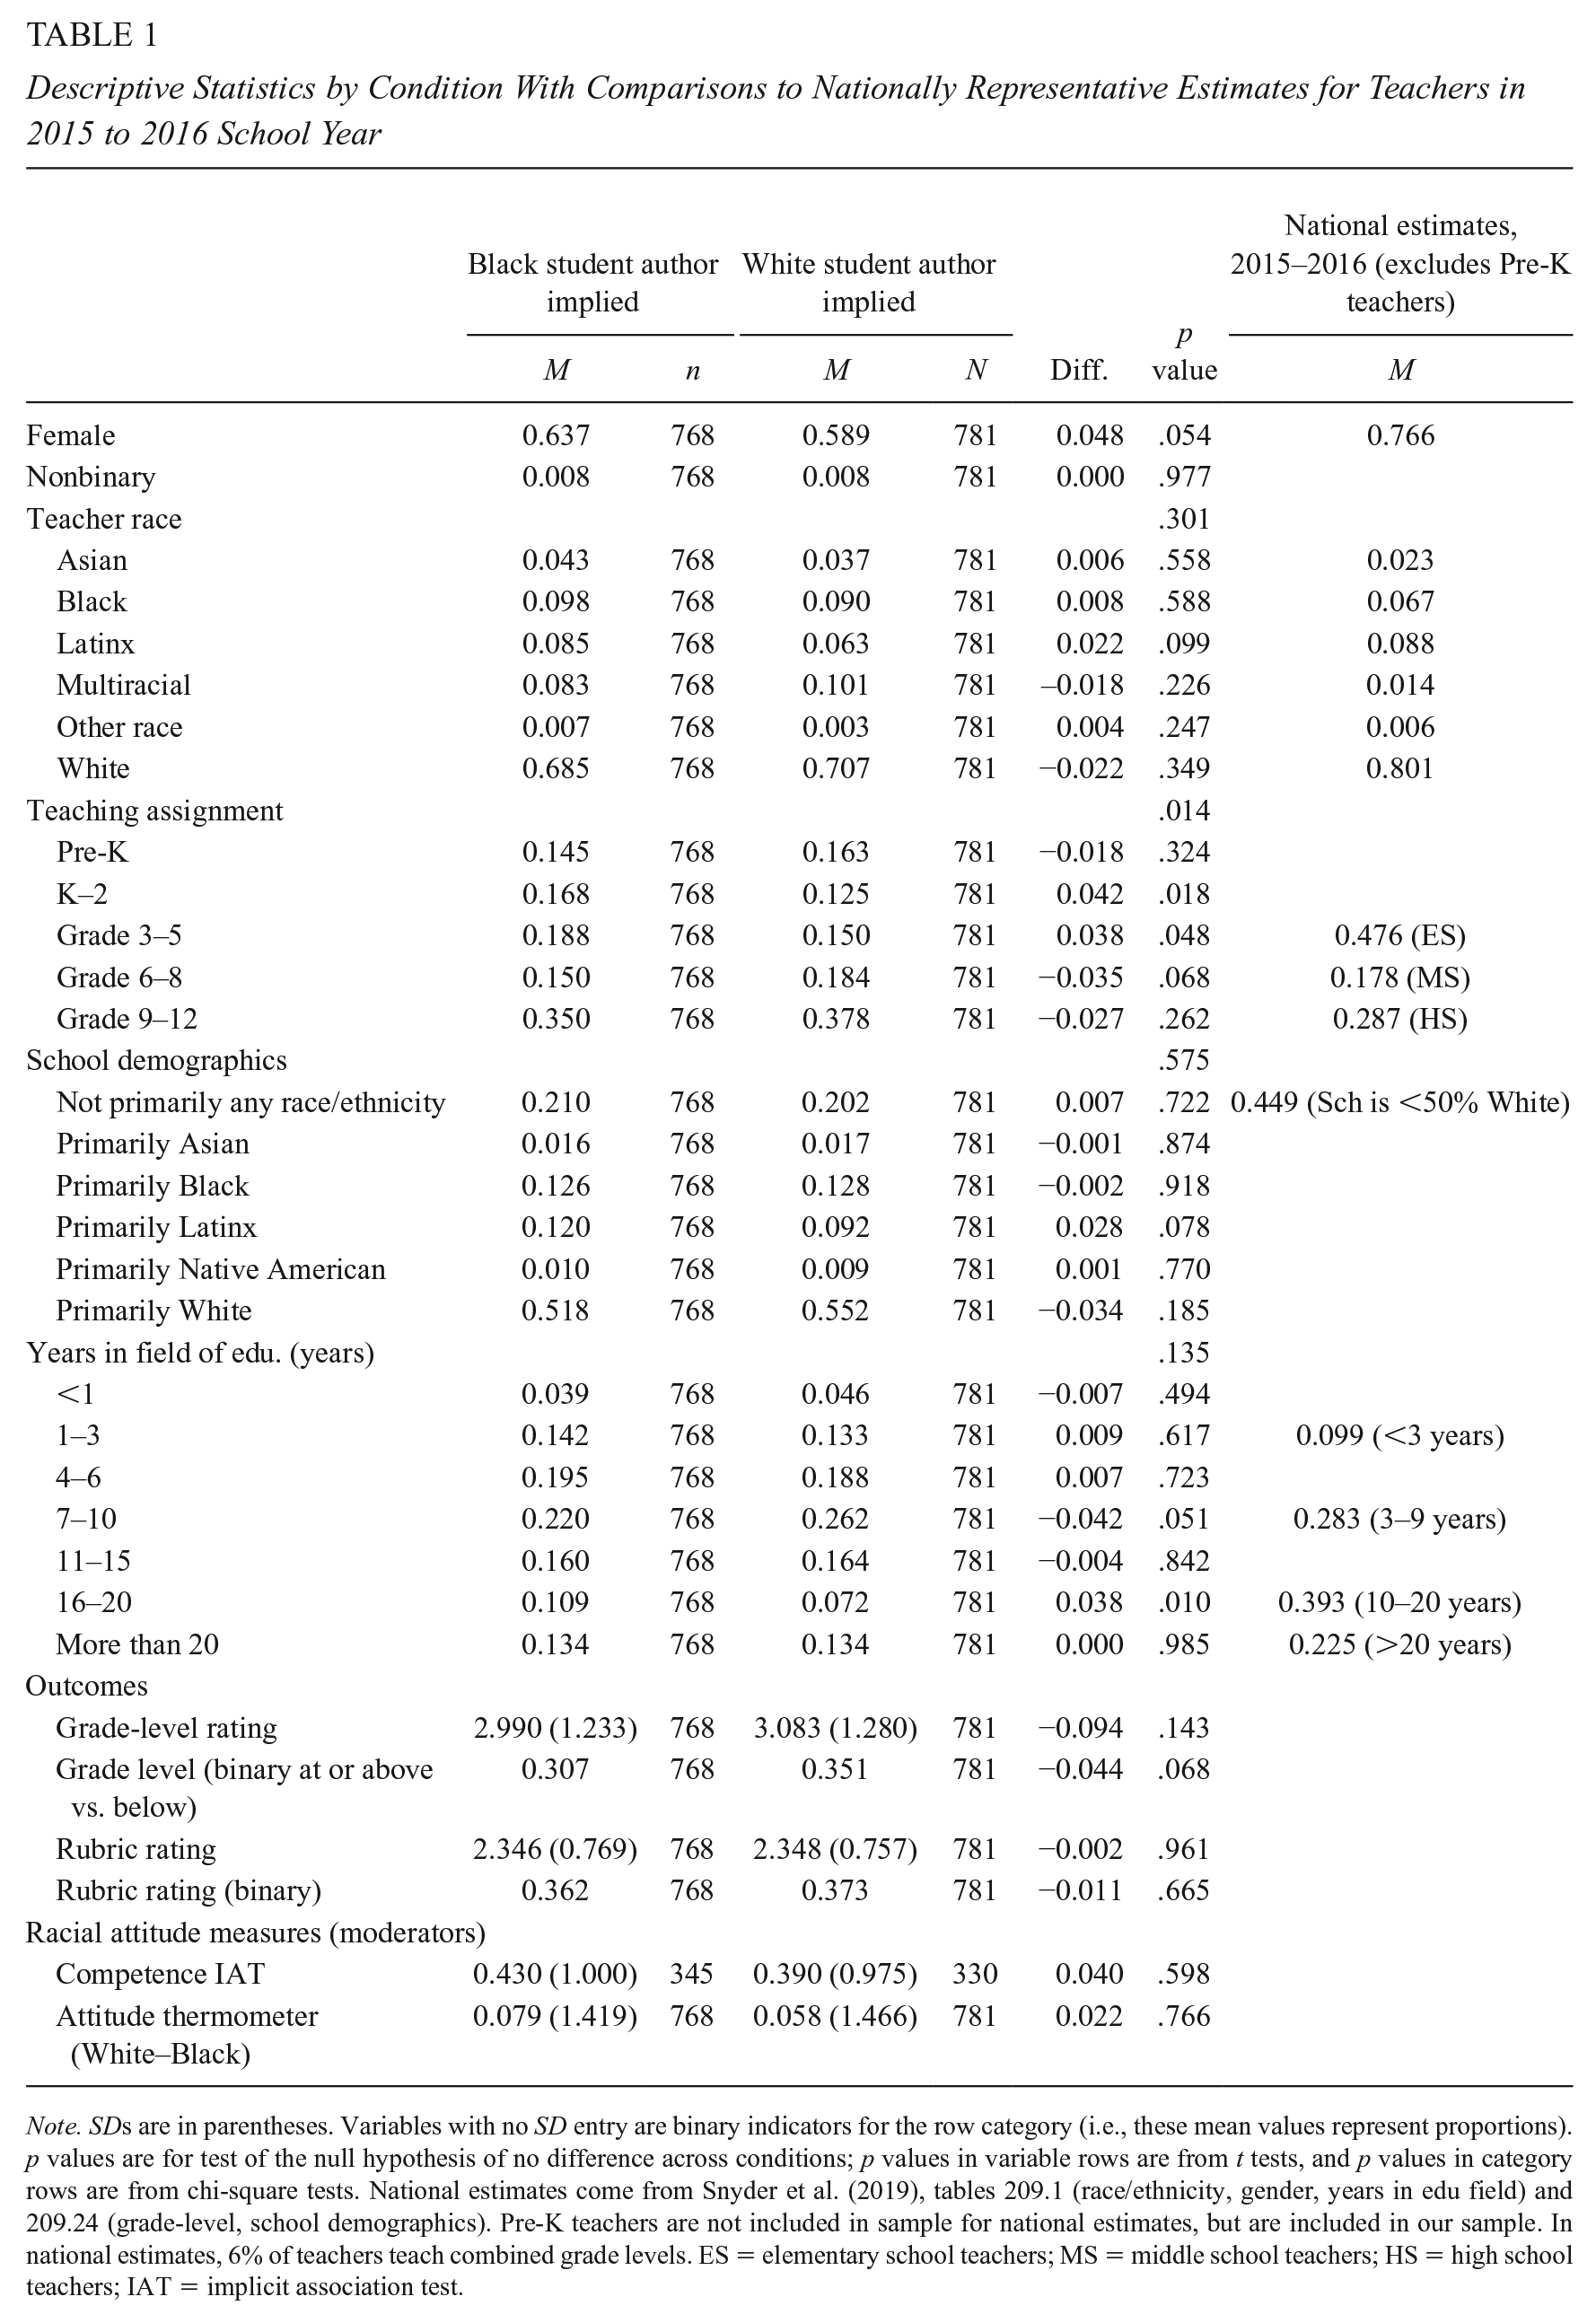
Note. SDs are in parentheses. Variables with no SD entry are binary indicators for the row category (i.e., these mean values represent proportions). p values are for test of the null hypothesis of no difference across conditions; p values in variable rows are from t tests, and p values in category rows are from chi-square tests. National estimates come from Snyder et al. (2019), tables 209.1 (race/ethnicity, gender, years in edu field) and 209.24 (grade-level, school demographics). Pre-K teachers are not included in sample for national estimates, but are included in our sample. In national estimates, 6% of teachers teach combined grade levels. ES = elementary school teachers; MS = middle school teachers; HS = high school teachers; IAT = implicit association test.
Experimental Materials
Teachers were shown a scanned copy of a student writing sample purportedly written by a student in the fall of second grade in response to a prompt to write about their weekend. In the response, the student author refers to his brother by name, as well as his brother’s friend. In one condition, teachers randomly received a response in which the writer’s brother’s name is “Dashawn,” signaling a Black author. In the other condition, teachers randomly receive a response in which the writer’s brother’s name is “Connor,” signaling a White author (names taken from list of most racially distinct names; Levitt & Dubner, 2005). In full, the student essay read, “I wose with my brother [Dashawn/Connor] and his frind [Arin/Scot] but it wose a graet day to be a boy at home . . .” (see Appendix for actual experimental materials). Teachers then rated the writing on the scales described below, answered demographic questions, and completed measures of implicit and explicit racial attitudes.
As a subject area, writing is well suited for a study of grading bias for two main reasons. Substantively, the subject area is of interest, given that tools for evaluating student writing vary in their focus and specificity. Methodologically, the personal narrative lends itself well to signaling the author’s racial identity in a relatively subtle way (as described above). This can help reduce demand effects, given that an explicit statement of the student’s racial identity may arouse suspicion among research participants.
Measures
Writing Evaluations
Teachers were first asked to rate the writing sample on a relative grade-level scale with options “far below grade level,” “below grade level,” “slightly below grade level,” “at grade level,” “slightly above grade level,” “above grade-level,” and “far above grade level.” This scale represents the vague, general scale because performance criteria are not explicitly defined. As discussed below, I convert these responses to a binary “at or above grade level” scale for interpretability in my main analyses.
Teachers then rated the writing on a rubric with more clearly defined performance criteria. This item read, “Overall, where would you place this student’s writing on the following rubric for a personal narrative?” The rubric comprised the ratings “provides a well-elaborated recount of an event,” “recounts an event with some detail,” “attempts to recount an event,” and “fails to recount an event.” In my main analyses, I convert this to a binary scale of “recounts an event with some detail” or better (see Online Appendix B for ordered logistic regression models that use the original numeric versions of the scales; all results are robust). The rubric appeared after the grade-level scale (and on a separate screen without the option to return to the earlier screen) to ensure that teachers’ ratings on the grade-level scale were not influenced by the criteria in the rubric.
Substantively, these evaluation measures differ in two important respects. The grade-level scale is general in the sense that it does not specify what dimension(s) the rater should consider (e.g., grammar, spelling, creativity, and organization). It also does not clearly specify the gradations among scale points (e.g., how should a teacher determine whether the writing is “slightly above grade-level” vs. “above grade-level”?). These ambiguities are hypothesized to leave the grade-level scale more susceptible to bias. In contrast, the rubric specifies the evaluation domain of interest (how well the writer recounts an event) and provides more specific scale point descriptors to guide teachers in their rating choices. The two measures also differ in the number of possible scale points, a matter I return to in the “Discussion” section. When interpreting the variation in bias estimates across these two measures, the totality of these differences should be kept in mind.
By using single-item evaluation outcomes, I follow the convention in the experimental literature on grading bias (Bonefeld & Dickhauser, 2018; Hinnerich et al., 2011; Rangvid, 2018; Sprietsma, 2013; van Ewijk, 2011) and improve ecological validity by mimicking the grading process as it often occurs in real-world settings. However, a drawback of these measures is that I am unable to calculate reliability statistics for the sample. I return to this consideration in the “Discussion” section.
Racial Attitudes
In this study, collecting data on respondents’ racial attitudes presented a challenge. If these measures are administered before teachers see the writing sample, the act of completing the racial attitude measures may produce demand effects that influence teachers’ ratings of the writing sample. If respondents complete the racial attitude measures after viewing the writing sample, the writing sample may affect their racial attitude scores. I opted for the second sequence to prevent contamination of my first two hypothesis tests, viewing this as less damaging to the experiment overall (furthermore, experimental effects on racial attitudes were tested for and showed null results).
Implicit competence stereotypes
To measure teachers’ implicit stereotypes of Black students, I adapted the traditional IAT using iatgen online software (Carpenter et al., 2018). The IAT is a timed computerized classification test that assesses “the strength of association between a target category and two poles of an attribute dimension” (Nosek & Banaji, 2001, p. 627). The traditional race IAT has been validated and found to be predictive (albeit weakly) of various biased behaviors (Greenwald et al., 2009; but see Oswald et al., 2013 for a different take on the evidence). In my adapted IAT, the target category is race (African American/European American) and the two poles are competence and incompetence. A positive IAT “d-score” indicates more pro-White bias (i.e., stronger implicit stereotypes of White students as more competent than Black students), a negative score represents pro-Black bias, and zero represents neutrality. My adapted competence IAT demonstrated internal consistency (based on split-half with Spearman–Brown correction) of .86 (see Online Appendix C and Quinn [2020] for additional detail on this measure, its development, and validity evidence).
Explicit attitudes
I administered traditional feeling thermometers (Nelson, 2008) in which teachers rated how warm or cold they feel toward Black and White Americans. The items read, “How cold or warm do you feel toward African Americans [European Americans]?” A 1 to 10 scale was shown with 1 representing “very cold” and 10 representing “very warm.” I created a measure of explicit bias by calculating the difference, for each individual, in their rating of White and Black Americans (such that positive scores indicate a preference for White Americans, negative scores a preference for Black Americans). Again, while such single-item measures preclude internal consistency estimates, feeling thermometers such as these are widely used in psychology, sociology, and political science (Nelson, 2008; Xu et al., 2014).
Analytic Plan
In their original form, the rating scales used in this study are ordinal. To improve interpretability, I dichotomize these scales and fit linear probability models (again, Online Appendix B includes results from ordered logistic regression models that use the original full scales as outcomes; all conclusions are robust). My models take the form:

In one set of models,
To explore variation in racial bias, I break the full sample down into several subgroups and fit models separately by teacher race/ethnicity, gender, and the racial demographics of their school. These analyses should be viewed as exploratory, conducted for the purpose of generating (rather than confirming) hypotheses.
To test whether the magnitude of racial bias differed by teachers’ implicit or explicit racial attitudes, I fit a series of models that include the main effect of one of the attitude measures along with its interaction with the
See Online Appendix D for estimates from logistic regression models (all results are robust).
Results
Racial Bias on Grade Level and Rubric Scales
In the top panel of Table 2, I present main effect estimates (i.e.,
Estimates of Racial Bias in Evaluating Student Writing Using General Grade-Level Scale Versus Specific Evaluation Criteria (Linear Probability Models)
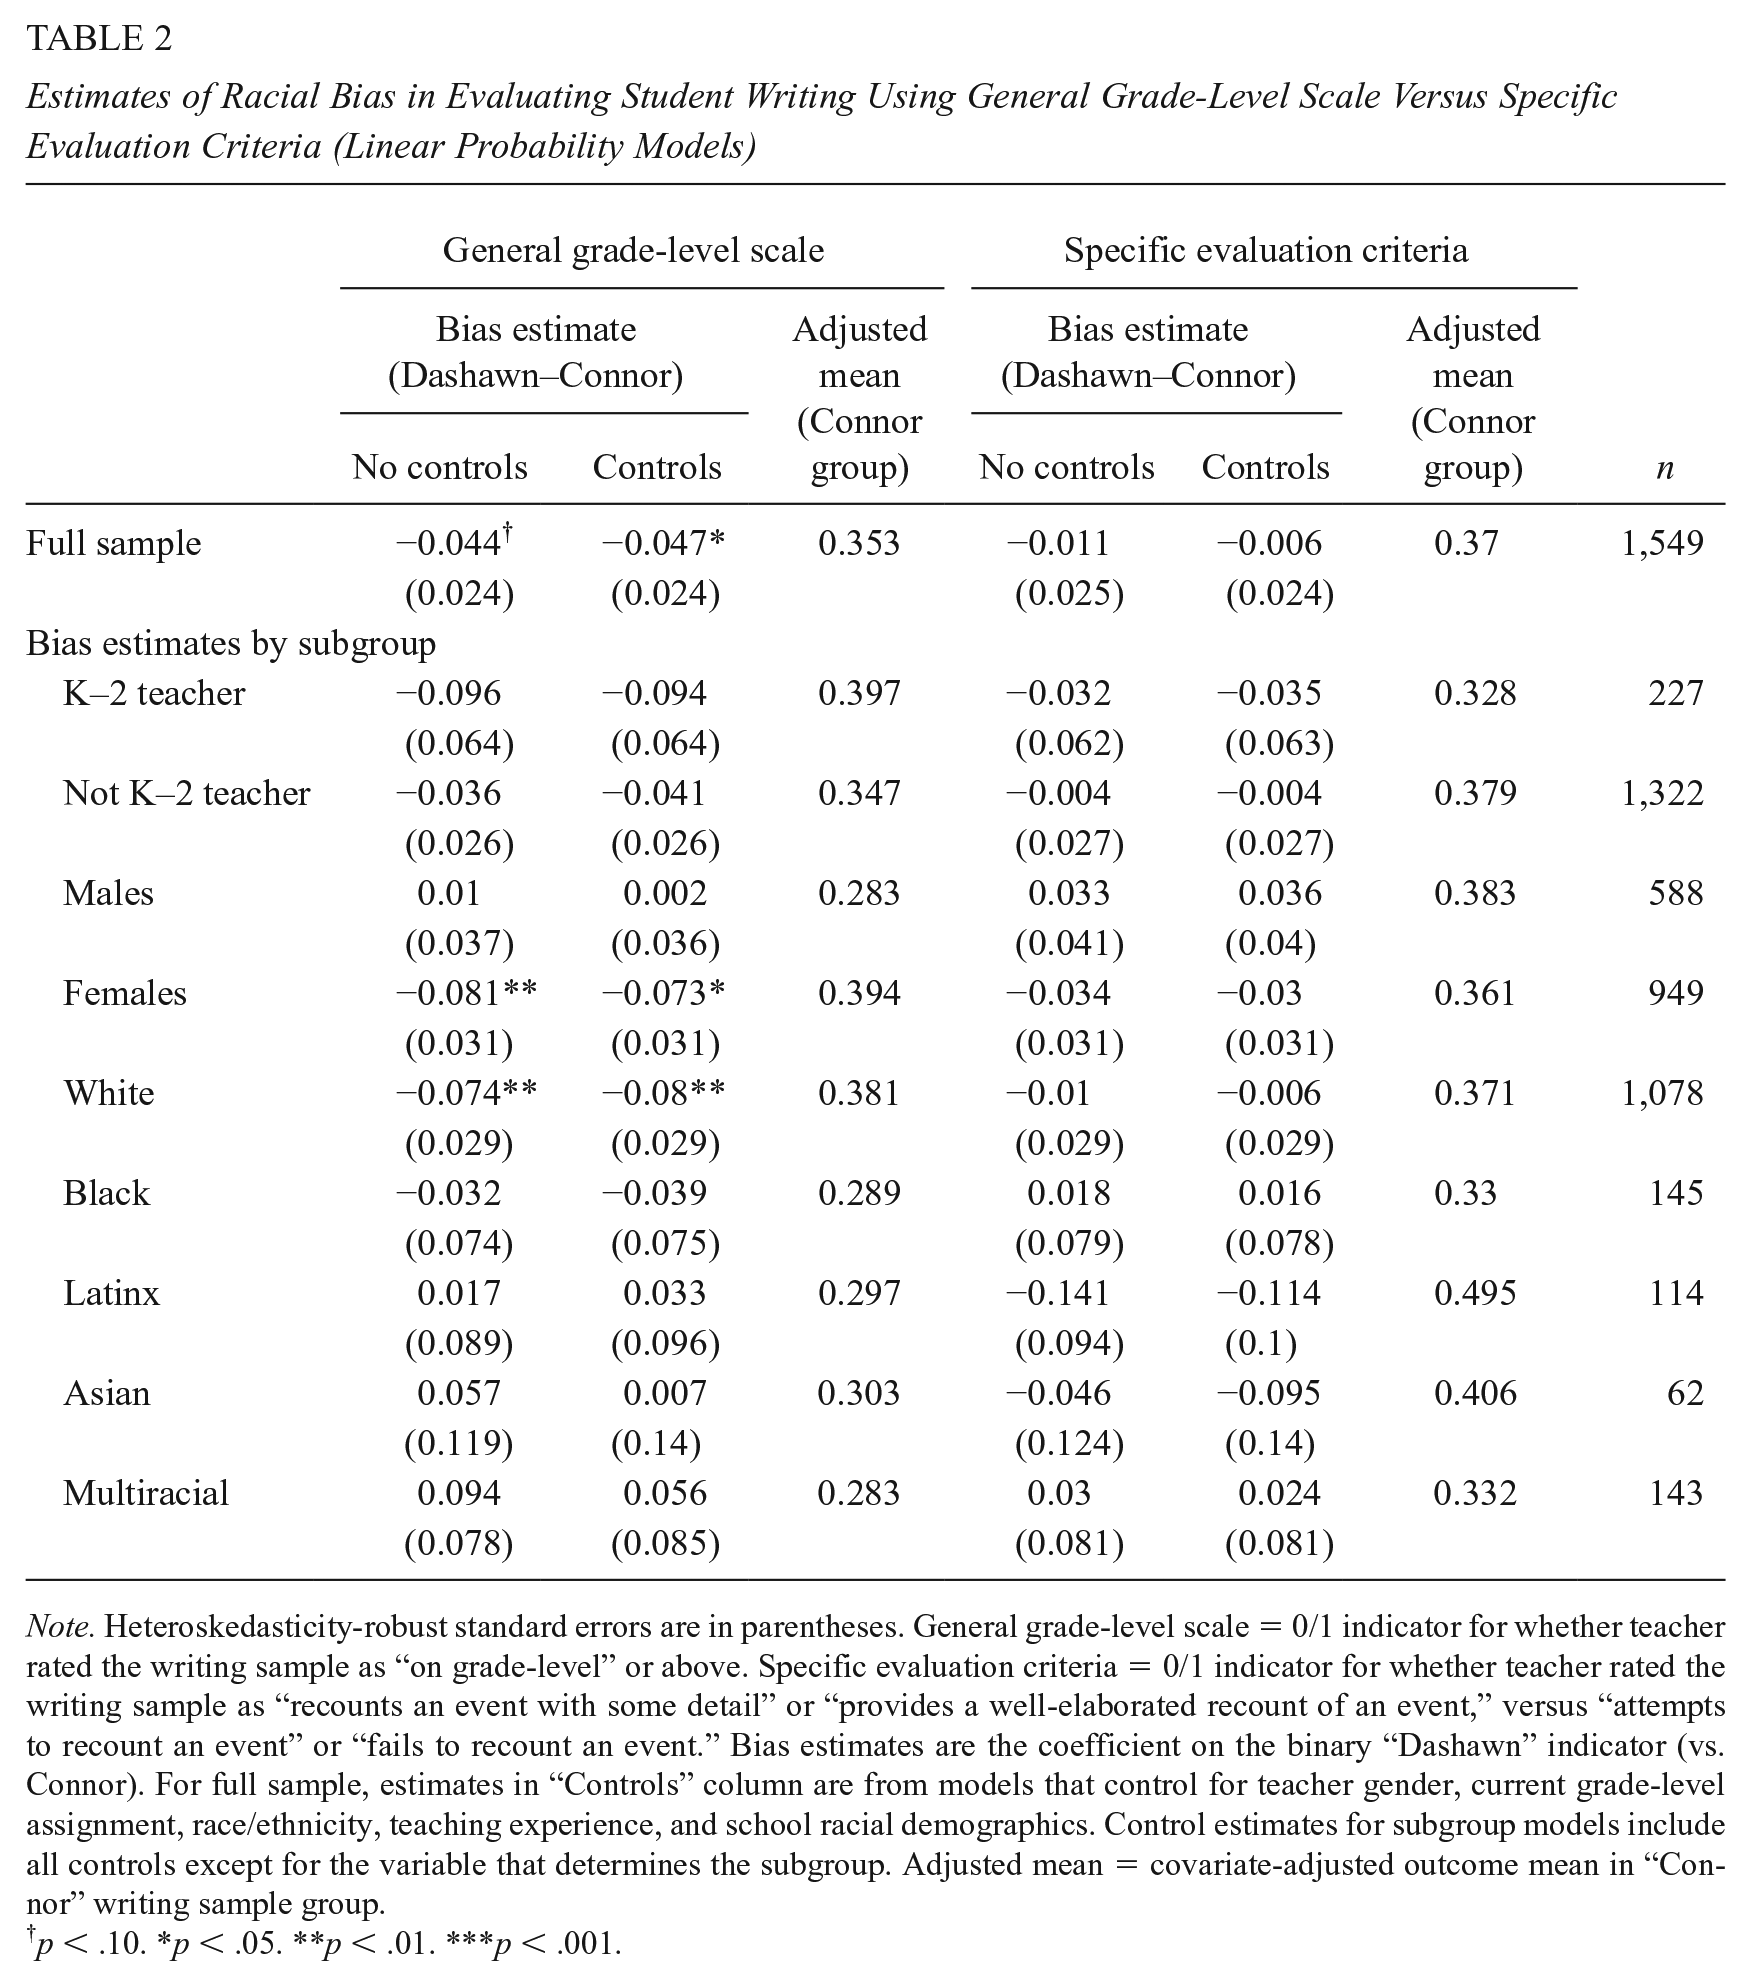
Note. Heteroskedasticity-robust standard errors are in parentheses. General grade-level scale = 0/1 indicator for whether teacher rated the writing sample as “on grade-level” or above. Specific evaluation criteria = 0/1 indicator for whether teacher rated the writing sample as “recounts an event with some detail” or “provides a well-elaborated recount of an event,” versus “attempts to recount an event” or “fails to recount an event.” Bias estimates are the coefficient on the binary “Dashawn” indicator (vs. Connor). For full sample, estimates in “Controls” column are from models that control for teacher gender, current grade-level assignment, race/ethnicity, teaching experience, and school racial demographics. Control estimates for subgroup models include all controls except for the variable that determines the subgroup. Adjusted mean = covariate-adjusted outcome mean in “Connor” writing sample group.
p < .10. *p < .05. **p < .01. ***p < .001.
Teachers who were shown the Dashawn version were 4.7 percentage points less likely to rate the writing as being on grade level or above compared with teachers shown the Connor version (with 35% of respondents rating the White version as grade level or above [adjusted mean column]). Consistent with my hypothesis, teachers gave essentially identical ratings to the Black and White authors on the more explicit rubric (right-side panel). Approximately 37% of teachers (adjusted) rated the “Connor” and “Dashawn” version of the prompt as recounting an event with “some detail” or better.
Theoretically, bias may be stronger among teachers less familiar with appropriate expectations for students of this age. Teachers of lower elementary grades will presumably have more useful background knowledge to draw from when evaluating the writing sample, whereas other teachers may be more likely to allow stereotypes to “fill in the blanks” where their expertise is lacking. One limitation of this sample, therefore, is that it includes teachers from across all grade levels (this choice was made for practical reasons, given the cost of setting grade-level qualifiers for the sample). I therefore estimated bias separately for K–2 teachers and all other teachers (first two rows of “Subgroup Effects” panel of Table 2). The bias estimate among K–2 teachers (approximately 10 percentage points) was larger in magnitude than the estimate for non-K–2 teachers (although not significant due to the small subgroup sample size, n = 227; p = .13). In a linear probability model interacting each grade-level band indicator with the “Black Author” indicator (along with grade-level main effects), I failed to reject the null of equal bias across all grade-level groups (p = .37). These results provide reassuring evidence that the full sample bias estimates were not being driven by teachers of more advanced grade levels.
Research shows that teacher biases can arise as demographic match effects, such that teachers show preference for students with identities similar to their own (e.g., Gershenson et al., 2016). I therefore include in Table 2 exploratory subgroup analyses examining whether the bias on the relative grade-level scale differs by teacher gender or race/ethnicity.
In the “Males” and “Females” rows in the “Bias estimates by subgroup” panel of Table 2, we see that the main effects for the full sample were driven by female teachers. Females were 7 percentage points (adjusted) less likely to rate the Black author as being on grade level, but the effect for males was small and nonsignificant (b = .002, n.s.; in a test of the null hypothesis of equal bias for males and females, p = .07). Female teachers may be more likely than male teachers to show bias against Black males.
White teachers exhibited the largest bias against the Black student author. White teachers were approximately 8 percentage points less likely to rate the Black author’s writing as being grade level or above, compared with the White author’s. This bias among White teachers was significantly different (p = .03, not shown) from the bias among all other teachers, who collectively showed a nonsignificant preference for the Black student author (b = .03, p = .50, not shown). (White teachers were also the only racial/ethnic group with a statistically significant bias, although note that other subgroups had substantially smaller sample sizes). Moreover, White teachers were more likely than others to rate the White student’s response as being on grade level or above, suggesting that part of their bias may be due to an in-group preference. The significance level of these bias estimates for female teachers and White teachers is robust across all specifications. (See Online Appendix E for additional exploratory analyses broken down for gender-by-race teacher subgroups; again, these subgroup estimates should be interpreted cautiously, given the small sample sizes.)
In the right-side panel of Table 2, we see that no bias estimate was statistically significant on the personal narrative rubric, and most estimates were small in magnitude.
Given that some teachers have more Black students than others, it is worth examining the extent to which teachers’ biases vary across schools with different racial demographics. In Table 3, I report the bias estimates from the relative grade-level measure (left panel) and the rubric (right panel), broken down by the racial make-up of the teachers’ schools. Here, we see that bias was largest for teachers in racially diverse schools, at 13 percentage points (p < .05). Effects were small and not significant for teachers in primarily Black (b = .01, n.s.) and primarily Latinx (b = −.01, n.s.) schools. Among teachers in primarily White schools, bias was not statistically significant, although the magnitude matched that of the overall sample (b = −.047, n.s.). In no school type was there evidence of bias on the personal narrative rubric.
Estimates of Racial Bias in Evaluating Student Writing Using General Grade-Level Scale Versus Specific Evaluation Criteria by Teachers’ School Racial Demographics (Linear Probability Models)
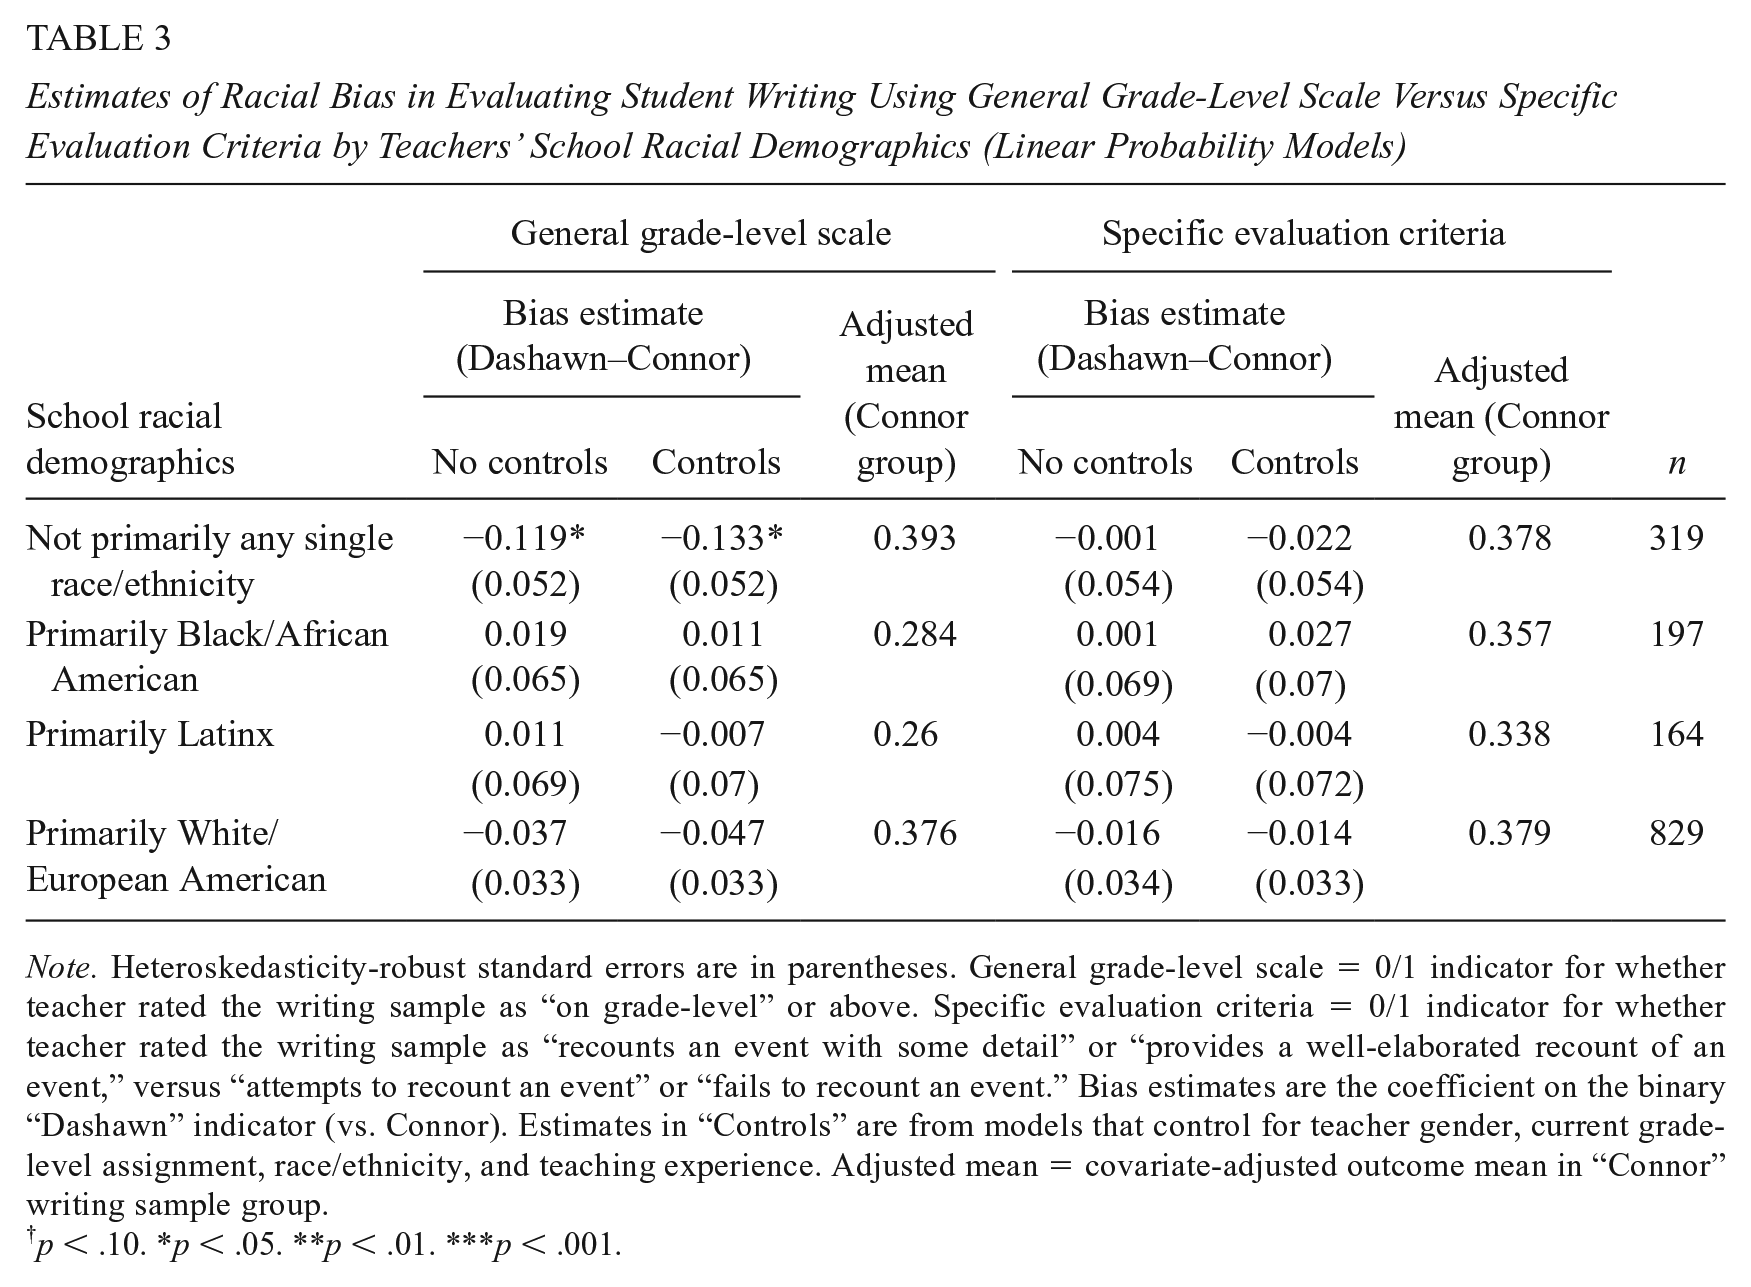
Note. Heteroskedasticity-robust standard errors are in parentheses. General grade-level scale = 0/1 indicator for whether teacher rated the writing sample as “on grade-level” or above. Specific evaluation criteria = 0/1 indicator for whether teacher rated the writing sample as “recounts an event with some detail” or “provides a well-elaborated recount of an event,” versus “attempts to recount an event” or “fails to recount an event.” Bias estimates are the coefficient on the binary “Dashawn” indicator (vs. Connor). Estimates in “Controls” are from models that control for teacher gender, current grade-level assignment, race/ethnicity, and teaching experience. Adjusted mean = covariate-adjusted outcome mean in “Connor” writing sample group.
p < .10. *p < .05. **p < .01. ***p < .001.
Interactions With Racial Attitudes
As discussed above, the magnitude of bias in teachers’ evaluations may depend on teachers’ racial attitudes. Teachers with stronger implicit stereotypes of Black students as less competent than White students, or with less explicit warmth toward African Americans versus European Americans, may show more bias on the grade-level evaluation measure. Recall that the racial attitude measures were administered after teachers rated the writing sample. As seen in Table 1, there is no evidence that the writing sample version affected any of the attitude measures. I therefore proceed with using attitudes as moderator variables.
In Table 4, I present the results from linear probability models that test whether experimental condition interacts with measures of implicit or explicit racial attitudes (again, sample sizes for analyses with the IAT are substantially reduced due to participant drop-off in these phases of the survey). Columns 1 to 2 show models with the vague grade-level rating outcome, and columns 3 to 4 show models with the more specific rubric rating outcome. In each column, the treatment indicator interacts with a different implicit or explicit bias measure. As can be seen across models, in no case does the magnitude of the bias differ significantly by teachers’ implicit or explicit racial attitudes.
Linear Probability Models Estimating Interactions Between Measures of Teachers’ Racial Attitudes and Student Author’s Implied Race (Predicting Teachers’ Evaluations of Student Writing)
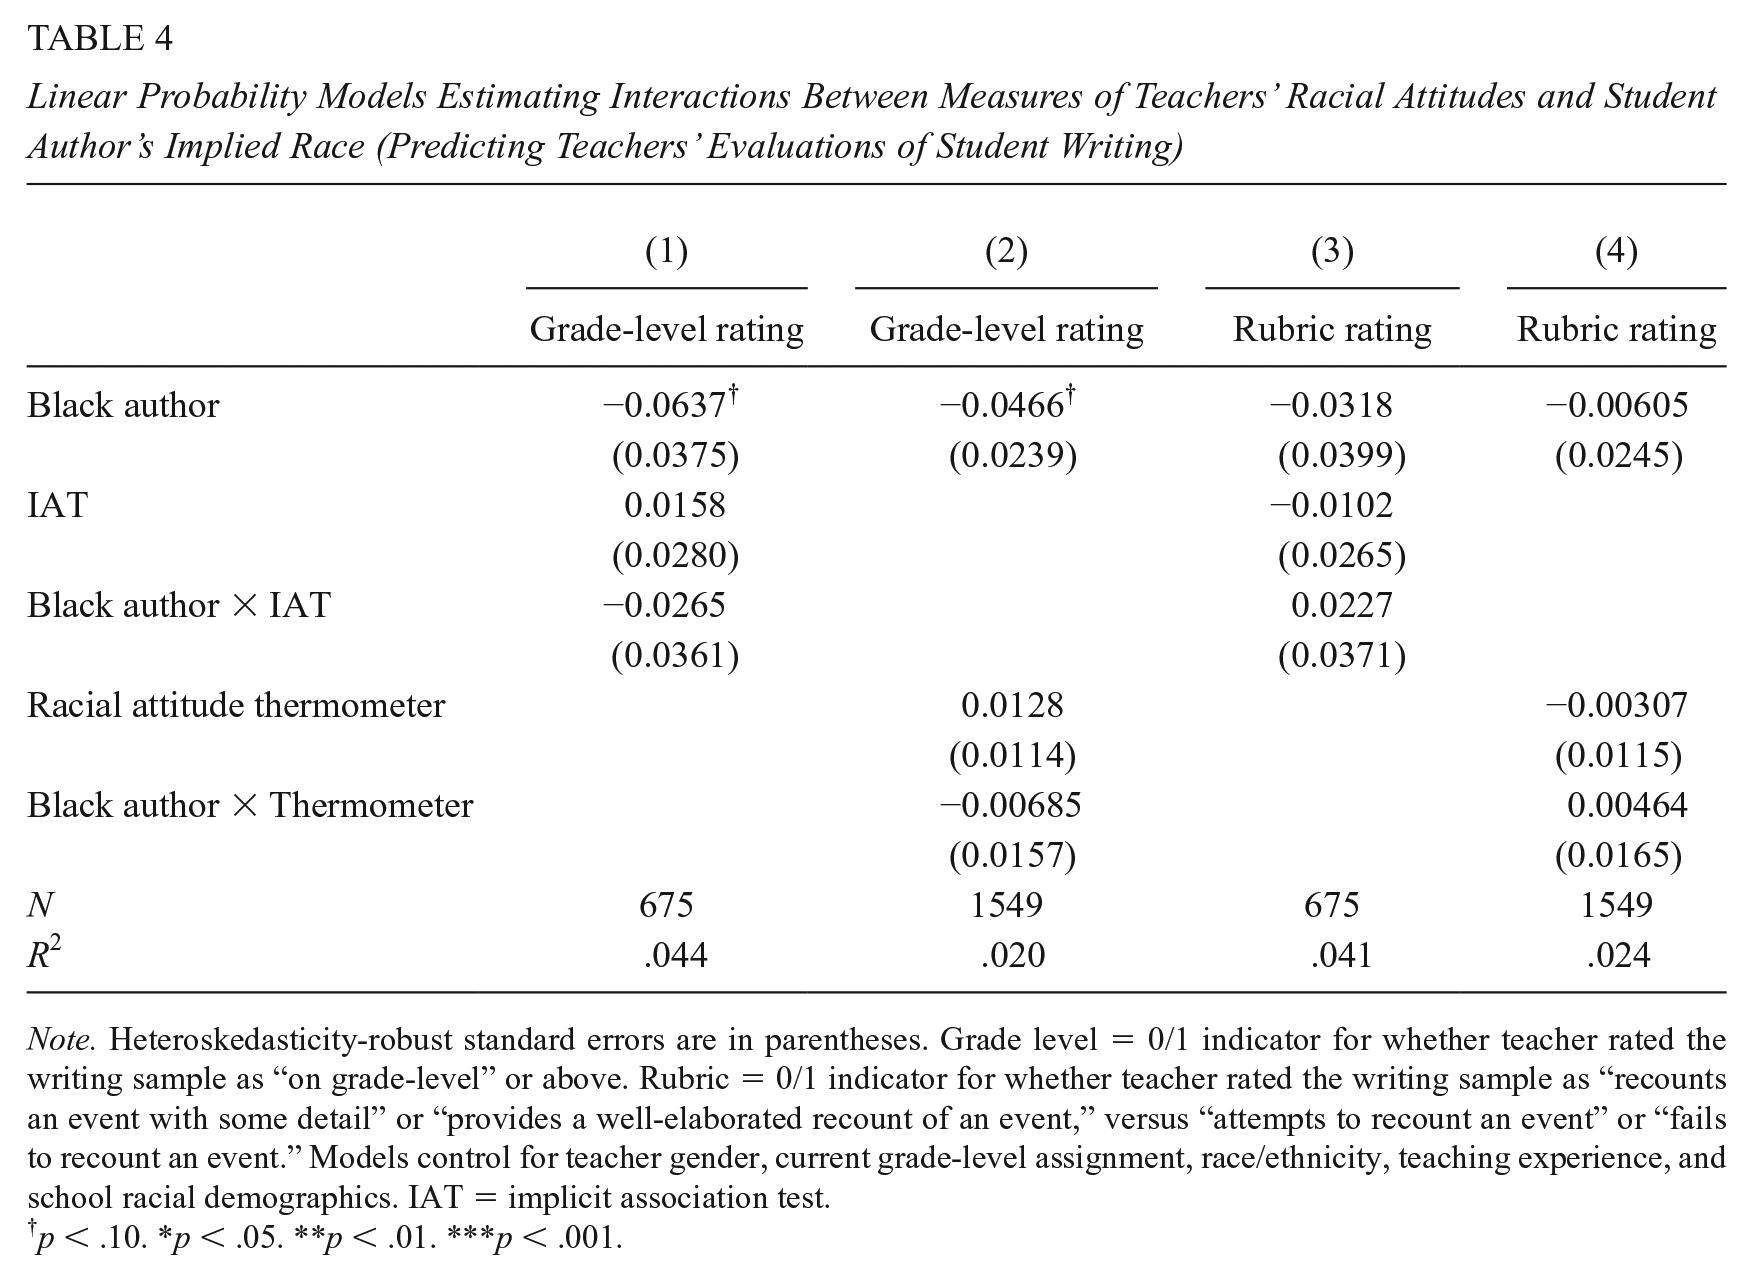
Note. Heteroskedasticity-robust standard errors are in parentheses. Grade level = 0/1 indicator for whether teacher rated the writing sample as “on grade-level” or above. Rubric = 0/1 indicator for whether teacher rated the writing sample as “recounts an event with some detail” or “provides a well-elaborated recount of an event,” versus “attempts to recount an event” or “fails to recount an event.” Models control for teacher gender, current grade-level assignment, race/ethnicity, teaching experience, and school racial demographics. IAT = implicit association test.
p < .10. *p < .05. **p < .01. ***p < .001.
Discussion
In this study, I found evidence of racial bias in teachers’ evaluations of student writing when scored using a vague relative grade-level rating scale. However, there was no evidence of bias when teachers scored the writing using a more descriptive rubric with absolute criteria. These findings are consistent with theory from scholars of implicit bias (Payne & Vuletich, 2018; Uhlmann & Cohen, 2005). Teachers’ stereotypes may have more influence on their evaluations when they are not given clear, specific criteria on which to rate student work. In contrast, teachers may be less likely to draw on their stereotypes when they have less discretion over the criteria for evaluating students.
I did not find evidence that teachers’ implicit or explicit racial attitudes moderated their biased evaluations. Given the sample size for the implicit bias moderation analysis (n = 675) and the internal consistency of this IAT (.86), power is .80 to detect a Bias × Treatment interaction of approximately −0.11 SD (when overall “grade-level or above” proportion is 0.40). One possibility, then, is that this study was underpowered to detect the true moderation effect. Another possible explanation is that the strength of a teacher’s implicit racial stereotypes does not affect the likelihood that they will evaluate student work in a racially biased manner. Knowing that explicit racial attitudes often diverge from implicitly measured attitudes, skeptics have argued that perhaps explicit attitudes dominate in determining behavior, making implicitly measured attitudes less of a behavioral concern (Oswald et al., 2013). Some divergence in explicit and implicit attitudes was observed in the present study; whereas the IAT showed, on average, a significant implicit association of White students as being more competent than Black students (d = .41), the explicit measure showed a small but nonsignificant preference for White Americans (0.068 points on the feeling thermometer, or 0.047 SD, p = .068 for
This study provides direct evidence regarding grading bias as it manifests for a particular writing sample on two particular rating scales. Conceptual replications will be useful in producing evidence as to whether bias varies across other rating scales or other student work samples. Do the present results suggest that, more generally, using explicit grading criteria will help mitigate grading bias? Or is there something unique about this rubric, this writing sample, or the combination of the two? We might expect that rubrics will be more effective at mitigating bias as the clarity of their performance criteria increases. Similarly, the more clearly a particular work sample meets a given set of criteria, the greater the bias-mitigating effect might be.
We should also consider whether bias may differ depending on the academic subject or the nature of the work being evaluated. The evaluation of student writing is likely more subjective than other types of evaluation, such as whether a student arrived at the correct answer to a math problem. Indeed, if my proposed explanation for the observed differences across the evaluation metrics in the present study is correct, we might expect less bias on teachers’ grading of math problems as correct or incorrect.
Exploratory analyses suggest that Black/White grading bias toward male students on the relative grade-level measure may be stronger among White teachers and female teachers. In fact, White, Latina, and Black female teachers all showed similar estimates of bias (although the bias was only statistically significant for the White subgroup, which had the largest sample size; see Online Appendix E). This raises the question of how student/teacher match on race and gender might operate together when it comes to biased evaluations. We know from past research that teachers sometimes rate same-race students more favorably, and the results of the present study suggest that some demographic match effects may operate differently depending on other demographic traits. Are teachers less likely to exhibit racial bias against a student if the student shares their gender? Again, these results should be taken as hypothesis generating rather than as confirmatory.
It is somewhat reassuring to see that teachers in primarily Black schools showed no evidence of racial bias in their evaluations, given that these teachers interact with many Black students. Teachers at racially diverse schools showed the largest bias, suggesting that Black students at diverse schools may be especially at risk of receiving biased evaluations. Given that these analyses are exploratory, and that this sample is not nationally representative (although national in scope), we cannot know whether this finding reflects patterns in the broader population. Taking the finding at face value, however, it is consistent with some theories on implicit bias. On average, Black students score lower on standardized tests than White students, and this holds within schools (e.g., Fryer & Levitt, 2004; Quinn, 2015; Quinn & Cooc, 2015). On average, then, teachers in racially diverse schools will more regularly encounter intergroup comparisons in which White students perform higher than Black students. This may lead these teachers to develop stronger implicit (or explicit) stereotypes of Black students as less competent than White students. When this stereotype is more accessible in one’s mind, it can be more influential on one’s judgments.
Policy Implications
As discussed above, scholars have focused on two distinct approaches for mitigating the effects of negative implicit attitudes: training programs that aim to reduce people’s general implicit associations versus efforts that engineer circumstances to reduce the impact that people’s implicit stereotypes can have on their behaviors or judgments. The present study lends support to one form of the latter strategy in the context of teacher education and development. Given that teachers showed no bias when using explicit evaluation criteria, education leaders and teacher education programs may be more effective at reducing grading bias if they focus on implementing policies that establish predetermined and clearly defined grading criteria.
I also found evidence that the overall bias on the vague grade-level scale was driven by White teachers, whose bias estimate was significantly different from the nonsignificant bias estimate among all other teachers. This bias may have been driven by White teachers showing in-group preference toward White students. This finding aligns with calls to diversify the teaching force. Recent research has shown that although the share of teachers of color has grown in recent years, this growth has not kept pace with the increase in the share of students of color (Hansen & Quintero, 2019). The present findings suggest that the relative overrepresentation of White teachers may disadvantage Black students (potentially through White teachers showing undue preference for White students). In addition to promoting strategies effective in reducing teachers’ evaluation biases, policies aimed at recruiting and retaining teachers of color may also help reduce the frequency of Black students’ experiences with biased evaluations.
In the present study, teachers were simply presented with a grading rubric without any training or norming examples. Previous evidence has suggested that the benefits offered by explicit rubrics for increasing score reliability may require that teachers receive training on the rubric (Rezaei & Lovorn, 2010). When it comes to the potential for clear evaluation rubrics to reduce bias, such training may not be necessary—at least for simple writing responses in the early grades, evaluated with straightforward rubrics. For cases in which teachers are evaluating more extensive writing artifacts and employing more complex rubrics, prior training may be necessary before teachers can understand the criteria deeply enough to apply them without bias. In addition, policies aiming to specify grading standards or practices face the same challenge faced by many education policies: the challenge of penetrating the classroom to actually change teacher practice (Weick, 1976). Such policies will be more likely to influence practice if they are accompanied by effective teacher training or coaching (e.g., Kisa & Correnti, 2015).
Limitations and Future Work
As noted earlier, the use of single-item evaluation measures in this study follows the convention of this research area and strengthens ecological validity. At the same time, it prevents the calculation of reliability statistics for the outcomes. Given that outcome measures with lower reliability yield lower statistical power, one potential concern would be that the differences in experimental effects across outcomes found here could be due to differential reliability of the measures. However, this would require that the vague grade-level measure has higher reliability than the more clearly defined rubric, which contradicts past research (e.g., Jonsson & Svingby, 2007) and intuition. As additional reassurance, the difference in significance levels across outcomes is driven primarily by the differences in the magnitude of the estimates rather than the differences in precision, with the group difference being close to zero for the rubric outcome (b = −.008 for rubric, vs. b = −.047 for grade-level rating).
Another possibility is that the ordering of the writing evaluations affects the scores teachers give. In this study, teachers rated the writing sample on the grade-level scale before rating it on the rubric. The purpose of this ordering was to ensure the criteria in the well-defined rubric did not influence the criteria that teachers had in mind when applying the vague grade-level scale. However, it is possible that bias on the vague rating scale could be reduced by having teachers first rate the writing sample using the rubric. In other words, focusing teachers’ attention to a clear set of criteria may have carryover effects to reduce bias in evaluations more generally. We also cannot know the extent to which the number of scale points on each measure may have affected the appearance of bias. The 4-point personal narrative rubric was taken directly from an actual writing rubric, while the choice of a 7-point grade-level scale was made to align with recommendations for developing bipolar response scales (Gehlbach & Brinkworth, 2011). I cannot rule out the possibility that the number of scale points affects the amount of bias detected by the scale.
The generalizability of these findings to classroom settings is unknown. The extent to which bias appears in teachers’ evaluations of their own students—with whom they have relationships and of whom they have prior knowledge—may differ compared with this experimental setting. The present findings may be more generalizable to settings where raters are conducting anonymous review of essays in which the authors’ identities may be signaled through context clues. Such settings would include the grading of state writing exams, or potentially SAT or GRE scoring.
If teachers are less likely to give biased evaluations of their own students (compared with students they do not know), then explicit rubrics may offer less benefit than the present study would suggest (at least with regard to the goal of mitigating bias). However, past research comparing anonymized and nonanonymized scoring methods has found evidence of teachers’ gender bias directed toward their own students (e.g., Falch & Naper, 2013; Lavy & Sand, 2015; Terrier, 2016). There may therefore be reason to recommend absolute rubrics as a means to mitigate bias. Yet the present study does not offer direct evidence on whether rubrics would produce bias-reducing effects in such a setting. It is possible that teachers hold strong student-specific biases that absolute rubrics are less effective at overcoming. One potential way to study this in a field setting would be to randomly assign teachers to grade their own students’ writing using either a vague scale or more explicit rubric, and then compare Black/White differences in scores on the two measures.
Conclusion
Teachers’ biased evaluations of student work may lead to a vicious cycle in which initial racially biased evaluations from a teacher cause lower future performance from students, which reinforces stereotypes held by teachers, which in turn leads to future bias in evaluations. This is a cycle over which teachers, school leaders, and district policies may be able to exert some influence through engineering evaluation procedures in bias-minimizing ways. The present study suggests that bias does not appear equally across all evaluation scales. The findings are consistent with the hypothesis that teachers exhibit less bias when they are given clear and specific grading criteria. By developing a deeper understanding of why some evaluation methods may be less likely to yield bias than others, we may be able to equip educators with a simple tool for mitigating bias: the thoughtful selection of evaluation measures.
Supplemental Material
David_Quinn_Online_Appendix – Supplemental material for Experimental Evidence on Teachers’ Racial Bias in Student Evaluation: The Role of Grading Scales
Supplemental material, David_Quinn_Online_Appendix for Experimental Evidence on Teachers’ Racial Bias in Student Evaluation: The Role of Grading Scales by David M. Quinn in Educational Evaluation and Policy Analysis
Footnotes
Appendix
Acknowledgements
I am grateful to Drishti Saxena for indispensable research assistance, Daphna Oyserman for study design feedback, and to Amadou Diallo for assistance creating the writing sample used in the experimental manipulation.
Declaration of Conflicting Interests
The author(s) declared no potential conflicts of interest with respect to the research, authorship, and/or publication of this article.
Funding
The author(s) disclosed receipt of the following financial support for the research, authorship, and/or publication of this article: Funding was provided by the James H. Zumberge Individual Research Award from the University of Southern California.
Notes
Author
DAVID M. QUINN is an assistant professor of education at the Rossier School of Education, University of Southern California. His research focuses on measuring, modeling, and ending inequalities in educational outcomes by race/ethnicity and socioeconomic status.
References
Supplementary Material
Please find the following supplemental material available below.
For Open Access articles published under a Creative Commons License, all supplemental material carries the same license as the article it is associated with.
For non-Open Access articles published, all supplemental material carries a non-exclusive license, and permission requests for re-use of supplemental material or any part of supplemental material shall be sent directly to the copyright owner as specified in the copyright notice associated with the article.
