
Abstract
School turnaround has emerged as a predominant strategy to improve chronically low-performing schools, although the approach remains controversial. This meta-analysis synthesizes results from 35 studies to examine the relationship between school turnaround and various student outcomes. We find that school turnaround is associated with improved attendance, standardized test scores, and graduation rates. When separating the results by the different turnaround models, transformation, turnaround, and restart models are associated with improvements in student test scores. We find no evidence of a significant relationship between school closure or state turnaround conducted under No Child Left Behind (NCLB) waivers and student test scores. We describe how changes in organizational operations, human capital, and the governance and/or management of low-performing schools might have contributed to this observed relationship.
Increasing resources and improving organizational conditions of schools enrolling children living in poverty have been a decades-long goal of policymakers. Yet, previous attempts to improve organizational culture and instructional delivery at scale have been decidedly mixed (Berends et al., 2001). For instance, comprehensive school reform was marked by weak, often inconsistent implementation, and despite early evidence of success (Borman et al., 2003), showed little evidence of sustained improvements in student outcomes (Gross et al., 2009). A chief explanation for the lack of success of these incremental whole-school improvement efforts was that the problems faced by chronically underperforming schools were multidimensional and intertwined, including ineffectual leadership, low levels of instructional capacity, staff demoralization, a lack of resources, and high teacher turnover (Dee, 2012; Payne, 2008). The structural nature of the challenges faced by the lowest performing schools provided the basis for calls for more drastic interventions, calls that gained momentum with success stories of “beat the odds” schools that turned around performance among traditionally underserved student subgroups (Mid-continent Research for Education and Learning, 2005).
Proficiency-based measures of student achievement established under No Child Left Behind (NCLB) shed additional light on school and student subgroup performance, allowing for more systematic identification and scrutiny of chronically underperforming schools (Calkins et al., 2007). Under NCLB, schools that failed to meet proficiency goals for three or more consecutive years were required to implement a suite of strategies related to changes in school organization, staffing, management, and governance—forerunners to the school turnaround strategies examined in this meta-analysis. These options included restructuring school programs, replacing administrators and teachers (the transformation and turnaround models, respectively), restarting the school as a charter school or under the management of a private company, closure, and state turnaround, such as the school improvement efforts conducted under NCLB waivers (Murphy & Bleiberg, 2019). As NCLB granted states the flexibility to determine the conditions under which schools had to undergo corrective action, initial implementation of these strategies was decidedly uneven (Herrmann et al., 2014; Schueler et al., 2017). Three federal policy changes led to the widespread adoption of school turnaround: (a) School Improvement Grants (SIG) targeted the lowest performing 5% of schools in a state and provided substantial resources to support the implementation of a prescribed turnaround strategy; (b) a criterion in Race to the Top (RTTT) applications was to turn around the lowest performing schools in a state; and (c) the Every Student Succeeds Act (ESSA) required states to differentiate and support consistently underperforming schools (Hamilton et al., 2014). 1
In contrast to other school improvement efforts designed explicitly to improve the instructional core (Elmore, 2000), school turnaround emphasizes changes in organization, human capital, and management as precursors to making improvements in student outcomes (Peurach & Neumerski, 2015). Critics have pointed to two notable consequences of this approach. First, by transforming the underlying educational infrastructure and not just the instructional culture of a school, school turnaround is purposefully disruptive (Rhim & Redding, 2014; Trujillo & Renée, 2012). This disruption to school operations and management, critics argue, removes local control from schools and creates school conditions counter to successful improvement (Trujillo & Renée, 2012), including high staff turnover, an influx of inexperienced teachers, student instability, and a weak school climate (de la Torre et al., 2013; Malen et al., 2002). Second, school turnaround cannot be divorced from the broader policy context of high-stakes test-based accountability. By identifying schools in need of improvement based on student proficiency levels, federal turnaround policy tacitly endorsed a vision of school reform agnostic to the broader sociopolitical context of schools, even though what determines performance levels are largely outside of school control (Murphy & Bleiberg, 2019; Trujillo & Renée, 2012).
Amid this criticism has been an emerging discourse that school turnaround has been an ineffective strategy at improving and sustaining positive student outcomes. The basis for this view comes from a Practice Guide from the Institute of Education Sciences (IES) that found no experimental or quasi-experimental studies demonstrating the efficacy of school turnaround (Herman et al., 2008), as well as more recent narrative reviews. These reviews have come to this conclusion largely as a result of what are seen as shortcomings in the theory of change underlying school turnaround rather than the systematic review of the empirical evidence on the effectiveness of school turnaround (Malen & Rice, 2009; Meyers & Smylie, 2017; Murphy & Bleiberg, 2019; Peck & Reitzug, 2014; Trujillo & Renée, 2012). Yet, in the past decade, school turnaround has been the subject of extensive study. Importantly, researchers examining school turnaround across diverse district and state contexts have adopted quasi-experimental research designs that allow for causal inferences.
By pooling results from 35 studies of school turnaround, this meta-analytic study allows us to make three main contributions to this literature. First, by conducting a meta-analysis, we determine the overarching association between school turnaround and student and school outcomes. Given that school turnaround marked a sharp increase in federal involvement in the operations and performance of chronically low-performing schools, we assess whether this involvement was associated with desirable educational outcomes. Second, we examine the extent to which specific school turnaround models—transformation, turnaround, restart, closure, or other state-led school improvement efforts—were more or less effective at improving student outcomes, and the ways in which years of implementation and changes in school management and/or governance moderated this overall relationship. Third, given that states have increased flexibility in how they support the lowest performing schools under ESSA, we intend for our results to provide guidance on the provision of supports for schools in need of comprehensive supports and improvement. Evidence that school turnaround has been an effective strategy to improve student performance in chronically underperforming schools would indicate the lowest performing schools in a state would benefit from substantive intervention and significant resources.
This study is guided by two main research questions:
In the next section, we introduce four mechanisms by which turnaround is hypothesized to influence student outcomes: improved organizational performance, improved human capital, changes in governance and/or management, and high-stakes accountability policies. We link these mechanisms to the theory of change for each specific turnaround model to explain how the model is predicted to improve student outcomes above and beyond disruptions posed to students and/or school personnel. We then describe our methods for identifying and coding studies included in the meta-analysis and the analytic strategy, including how we address the issue of study quality and risk of bias in our meta-analysis. In describing our results, we report on the overall relationship of school turnaround on student outcomes and how this overall effect is moderated by turnaround model, years of implementation, and a change in management or governance. We conclude with a discussion of the significance of our findings, directions for future research, and policy implications.
Conceptual Framework
The term “turnaround” has been used imprecisely among researchers and policymakers to refer to drastic changes to the operations of chronically underperforming schools. In our definition, turnaround refers to the identification of low-performing schools with the goal of making drastic changes to the organization, staffing, and governance of schools to improve student outcomes (Herman et al., 2008). Each model presupposes a different set of mechanisms by which the academic performance and behavioral outcomes of students attending low-performing schools may improve.
There are four main mechanisms by which school turnaround is hypothesized to influence student outcomes. First, improved organizational performance is the basis for the transformation and turnaround models. The school practices designed to transform school operations have their roots in the organizational practices of effective schools (Bryk et al., 2010). These practices include adopting comprehensive instructional reform (e.g., use interim assessments, use data to evaluate instructional programs), increasing teacher effectiveness (e.g., use performance measures to evaluate teachers, provide multiple-session professional development), increasing principal effectiveness (e.g., use student achievement growth and other performance measures to evaluate principals, professional development on aligning teacher professional development with evaluation results), increasing learning time and community-oriented schools (e.g., establish schedules to increase learning time, change community engagement strategies), and having operational flexibility (e.g., autonomy over budgeting, hiring, or discipline; Herrmann et al., 2014). As a whole, these strategies are intended to improve teachers’ instructional capacity and give administrators’ greater flexibility in staffing decisions and targeting financial resources toward unique school problems.
The second mechanism is changes in human capital. A substantial research base details how the effectiveness of teachers and principals varies across schools, but on average, less effective school personnel work at schools serving the highest concentrations of traditionally underserved students (Goldhaber et al., 2015). By replacing the principal, the hope is that the new principal will be more effective in inciting drastic changes to improve the school operations and culture (Duke, 2015; Leithwood et al., 2010). This logic, adapted from the larger management literature, recognizes the complex task of organizational turnaround requires competent leaders capable of addressing a variety of school domains (Murphy & Bleiberg, 2019). When replacing teachers, the idea is that newly hired teachers will not only be more effective at improving student outcomes, but they will also be more willing to adopt school practices linked to improved organizational performance (Malen et al., 2002). Current evidence is mixed in terms of the degree to which turnaround schools have an adequate supply of qualified and committed personnel (Hamilton et al., 2014; Le Floch et al., 2016) and suggests that replacement teachers are more effective but possibly less experienced (Heissel & Ladd, 2018; Strunk, Marsh, Hashim, Bush-Mecenas, & Weinstein, 2016; Sun et al., 2017).
The third mechanism relates to changes in the governance and/or management of low-performing schools. The underlying assumption of this mechanism is that districts, on their own, are either incapable or unwilling to improve the underlying conditions of the lowest performing schools and require external intervention (Zimmer et al., 2017). With a change in governance, a state takes over control of low-performing schools or school districts. By giving local school and district leaders enhanced autonomy over personnel, scheduling, budgeting, and curricular decisions, they might be able to alter the conditions for the improved organizational performance of low-performing schools. States can also establish broad coalitions with the capacity to support low-performing schools (Calkins et al., 2007). As an example of this change, under RTTT, several states set up departments with expertise in school turnaround, knowledge, and capacity that was arguably missing within local districts (Baroody, 2011). Finally, increased participation in governance can shift accountability, in part, to state-level officials, possibly improving responsiveness toward low-performing schools in the state (Murphy & Bleiberg, 2019). Governance changes tend to correspond with changes in management, which involves shifting the day-to-day operations of a school to an education or charter management organization. Altering the management of schools might improve school outcomes when school personnel can make more drastic changes in school operations outside the purview of elected school boards, school districts, and teachers’ unions (Chubb & Moe, 1990; Zimmer et al., 2017).
Finally, improved student outcomes may be a result of school stakeholders responding to the broader incentive structure imbedded within high-stakes accountability policies. As opposed to any of the aforementioned mechanisms, improved performance may simply result from greater teacher and administrator productivity to avoid continued or more severe sanctions (Ahn & Vigdor, 2014; Finnigan & Gross, 2007). For instance, the threat of dismissal may lead teachers or administrators to seek out and implement new instructional practices that they would not have adopted otherwise (Dee, 2012). We next describe how these hypothesized mechanisms are enacted within the different approaches to school turnaround: transformation, turnaround, restart, closure, and state turnaround conducted under NCLB waivers. We explain how differences in the enactment of these mechanisms across the different turnaround models can help elucidate the factors driving any improvements in student learning outcomes in chronically underperforming schools.
School Transformation
The two defining practices of school transformation are to implement a set of practices to improve organizational performance and to replace the principal. Although the specific practices meant to improve organizational performance are quite varied, commonly adopted practices include using data to inform instruction, increasing teacher technology access, providing ongoing professional development on student learning needs, and using benchmark assessments (Herrmann et al., 2014; Le Floch et al., 2016; Sun et al., 2017). The efficacy of school transformation, however, may not come from the adoption of a set of scripted practices but the appointment of a new school leader who is better positioned to rebuild organizational capacity than the outgoing principal (Duke, 2015). A burgeoning literature describes specific competencies of leaders in transformation and turnaround schools (Duke, 2015; Leithwood et al., 2010). These leaders are characterized as transformational leaders who are capable of motivating school staff to work toward a shared school vision. Other accounts emphasize leaders’ ability to frame and solve problems, develop strategies in response to shared problems of practice, persist through challenging circumstances, and demonstrate and incite a commitment to student learning (Hitt et al., 2018).
School Turnaround
In addition to the two main practices of the transformation model, the turnaround model includes replacing at least half of the teaching staff. Besides the potential for improvements in human capital brought about by replacing teachers, the efficacy of school turnaround hinges on the degree to which teachers and administrators in the reconstituted school are committed to organizing collective efforts around a shared instructional vision focused on meeting students’ learning needs. This ambitious goal stands in sharp contrast to the negative climate of many chronically underperforming schools. Payne (2008) writes about the pervasiveness of social demoralization among teachers working in chronically underperforming urban schools, a demoralization that often presents insurmountable barriers to school change. Against this backdrop, the process of teacher reconstitution is envisioned as being the only means to re-culture schools that have historically been reluctant to or incapable of change. The turnaround process might also compel school leaders to improve other school operations that have been neglected. Prior to reform, turnaround schools are often characterized as disorderly, chaotic, and even unsafe (Hamilton et al., 2014). Turnaround principals often prioritize the development of policies and practices to monitor and manage student behavioral problems (Duke, 2015). When disciplinary policies are consistently enforced, they can create a more orderly school environment that is more conducive to successful teaching and learning (Bryk et al., 2010; Cucchiara et al., 2015).
As with school transformation, researchers have described how the anticipated benefits of turnaround are in contrast to the disruption brought about by staff replacement (Hamilton et al., 2014; Malen et al., 2002). The chief critique of staff reconstitution is the disruption brought about by staff replacement undermines the school relational climate. This disruption is noteworthy, as the broader school improvement literature describes a student-centered learning climate, teacher collegiality, and parent–community ties as critical supports for organizational improvement (Bryk et al., 2010). Overall, for turnaround to have a positive impact on student learning and behavioral outcomes, these disruptions need to be overshadowed by improvements in teacher and administrator quality, school operations, and teacher learning brought about by the introduction of new energy and ideas into the school. To understand whether or not changes in human capital must also include replacing teachers, in moderation analyses described below, we compare the turnaround and transformation models.
School Restart
The school restart model assumes changes in school management may be necessary to improve student outcomes. With autonomy over operations, charter school leaders have the potential to create more efficient operations without the bureaucratic oversight of traditional public schools (Chubb & Moe, 1990). Charter school leaders also have increased control in the hiring and firing of teachers. As charter school teachers are not typically unionized and lack the job protections of traditional public school teachers, administrators can hire teachers without the constraints posed by seniority or tenure, possibly improving teacher human capital (Abdulkadiroğlu et al., 2016). In moderation analyses, evidence that the restart model is more effective than school transformation or turnaround would suggest that changes in the management of low-performing schools are needed to improve student success. In addition, it is worth emphasizing the effect of charter school restarts may be the result of how administrators and school staff respond to accountability pressures, given their role in preventing the revocation or nonrenewal of the school’s charter.
Accountability-Driven School Closure
Although schools are closed for a number of reasons, including school or district consolidation, declining enrollments, budgetary shortfalls, or for persistently low performance, we focus on the latter to understand how this strategy has been used to improve the outcomes of students attending chronically underperforming schools. Accountability-driven school closure is negatively characterized because of the academic disruption it causes students and families (Sunderman et al., 2017). This view is supported by the broader research on student mobility that shows that the disruption caused by mobility weakens students’ academic and social support systems (Welsh, 2017).
Despite the disruption faced by students when they are displaced from their current school, a school likely located within their neighborhood, displacement might be positive when students move to higher performing schools (Bifulco & Schwegman, 2020). Compared with the other turnaround models that aim to improve the organizational conditions of schools, an underlying assumption of accountability-driven school closure is that closed schools were unable to make these improvements and students will have better educational opportunities in a higher performing school. Still, students’ school choices may be constrained, they may face lengthy travel to their new school, the quality of the teachers or peers may only be marginally better, and the school may be unequipped to handle the influx of new students from nearby schools that were closed (Bifulco & Schwegman, 2020).
State Turnaround
In contrast to these federally sanctioned approaches to turnaround, some states engaged in alternative efforts to improve their lowest performing schools under NCLB waivers (Bonilla & Dee, 2020; Dee & Dizon-Ross, 2017; Dougherty & Weiner, 2019). These state turnaround approaches can be characterized by the use of school accountability systems to identify the schools most in need of technical assistance (Dee & Dizon-Ross, 2017). The types of supports offered to these schools varied across states, but include comprehensive school improvement planning and reforms aimed at improving school operations (Bonilla & Dee, 2020; Dougherty & Weiner, 2019). Comparing student outcomes between state turnaround efforts and other SIG-promoted turnaround models can demonstrate the extent to which the increased flexibility and reduced resources under ESSA are sufficient for improving the lowest performing schools in a state or if these schools require systematic changes in human capital or management/governance.
Explaining Heterogeneous Outcomes of School Turnaround
With distinct mechanisms underlying each turnaround model, we would expect to observe heterogeneous student outcomes. For instance, when contrasting the transformation and turnaround models, improved organizational performance may only be possible when teachers are replaced as well, suggesting that school turnaround may be more effective than school transformation at improving student outcomes. On the contrary, replacing teachers may create turmoil within a school, limiting school administrators’ ability to improve school operations. Alternatively, it may be that turning around schools at scale is unfeasible and that students in the lowest performing schools benefit the most from school closure (Smarick, 2010).
Even if the different school turnaround models are able to improve student outcomes, a critical question is how long it takes for improvements to emerge. Duke (2015) has argued a tactic of turnaround leaders is to accomplish “quick wins,” early improvements in student outcomes that motivate more substantial improvements. These accomplishments can “boost confidence that positive change is possible” (Duke, 2015, p. 145). This view is in contrast to the body of research on school improvement suggesting the complexity of large-scale school improvement precludes rapid changes, given the critical role of administrator and teacher learning in creating high-performing organizations (Peurach & Neumerski, 2015). There is reason to believe the benefits of attending a restart charter school would also be concentrated after the first year of implementation. Restart charter schools may face rocky operations in their first year, resulting in lower student performance in the first year in operation that fades over time (Carruthers, 2012; Sass, 2006). As a result, we would expect the benefits for students attending a transformation, turnaround, or restart charter school to be concentrated after the first year of implementation. As with the other turnaround models, there is also a temporal element to school closure. Perhaps more than the turnaround models, the mobility caused by closure is linked with depressed student outcomes following closure or even in the year closure is announced (de la Torre & Gwynne, 2009). The expediency with which students adjust socially and academically to the new school community is a key factor in explaining the degree to which accountability-driven school closure is ultimately beneficial for students’ academic success.
Finally, it is possible that improving school operations or changing human capital is necessary but insufficient to improve the performance of low-performing schools. To spur meaningful improvements in student outcomes might require changes in school management or even governance. Shifts in the management or governance of schools present additional accountability pressures and scrutiny for schools, but it is often in exchange for increased autonomy and a reduction in bureaucratic constraints. If successful turnaround depends on changing the management or governance of a school, we would expect the effect of school turnaround to be concentrated within the schools or districts where school management and governance changes occurred alongside other turnaround strategies. In the next section, we describe the moderation analysis used to explain heterogeneous outcomes of school turnaround. Comparing the different turnaround models also helps us understand the relative importance of the different mechanisms of our conceptual framework when trying to improve the outcomes of students attending the lowest performing schools.
Method
Eligibility Criteria
Our meta-analysis is designed to examine the association between school turnaround and student outcomes. Following Malen and Rice (2009), who observed that the specific provision of turnaround policies can be difficult to identify in practice, we adopt a somewhat conservative definition of school turnaround. Our operational definition is informed, foremost, by the federal turnaround models established under the SIG program that were described in the previous section, but also includes state-led school improvement efforts adopted under NCLB waivers. In most instances, study authors distinguish the specific turnaround model being implemented, and, given that federal funding was tied to the implementation of specific practices, we have no reason to believe that there is significant misclassification of turnaround models.
To ensure that other studies that were not explicitly engaged in school turnaround were excluded in the study, we established a series of decision rules for excluding studies (see Supplementary Appendix Table 1 in the online version of the journal). We excluded other school reform models, including comprehensive school reform (e.g., Slavin et al., 2013) and wraparound services (e.g., Gandhi et al., 2018), unless the study authors explicitly describe replacing administrators and/or teachers as part of the reform process. Studies were also excluded if they classified schools as “turnaround” based on the school’s performance trajectory rather than the adoption of a prescribed turnaround model (e.g., Hochbein, 2012; Meyers et al., 2012). In terms of school closure, we focus on accountability-driven school closure, excluding school closure linked to school finances and/or student enrollment (e.g., Billger, 2010). Given that different factors shape the decision to close a charter school compared with a traditional public school, we also exclude studies examining the effect of charter school closure on student outcomes (e.g., Carlson & Lavertu, 2016; Chingos & West, 2015). Finally, it should be noted that our definition allows for turnaround to occur in the context of school improvement efforts conducted under NCLB waivers (Bonilla & Dee, 2020; Dee & Dizon-Ross, 2019; Dougherty & Weiner, 2019; Hemelt & Jacob, 2017) as well as state takeover of low-performing schools (Schueler et al., 2017; Zimmer et al., 2017).
Building off of this definition, primary studies eligible for inclusion needed to meet the following criteria: (a) The students are located in a school, district, or state that underwent a school turnaround effort; (b) the study reports student outcomes, including standardized tests, state end of course exams, attendance rate, graduation, and college attendance; 2 (c) there is a business-as-usual comparison group; and (d) the sample comprises students in K–12 schools in the United States. Our primary goal is to inform turnaround policies in the United States and, as such, we focus on U.S. studies because school accountability and turnaround policies in the United States are substantively different than those outside the United States (e.g., Jensen & Farmer, 2013). We choose standardized test scores as an outcome because of its prevalent use in school accountability policy, but we recognize test scores are only one measure of effective schooling and the limitations associated with using such a measure. Thus, when possible, we include other measures of student outcomes of interest to researchers and policymakers.
Literature Search
Primary studies were identified by searching several economic and general social science databases, including Google Scholar, ERIC, WorldCat, ProQuest, JSTOR, NBER, and Directory of Open Access Journal (DOAJ). Using an iterative process and balancing an inclusive search string and a reasonable number of records that can be screened and analyzed thoroughly, we created the following search string: “school turnaround” OR “turnaround school” OR “school improvement grants” OR “turnaround reform” OR “school reconstitution” OR “reconstituted school” OR “school closure” OR “school restart.” This search returned more than 13,800 studies (Supplementary Appendix Table 2 in the online version of the journal). In efforts to reach saturation, we also conducted an ancestral search from the reference lists of previous reviews of school turnaround (e.g., Murphy & Bleiberg, 2019; Trujillo & Renée, 2012) and the initial articles identified from the search process. To attempt to find any additional research published outside academic publishing or distribution channels (i.e., “gray” literature), we also conducted a hand search of publications from private research firms, large school districts, research associations, government research agencies, and funding agencies. The search was limited to studies in English, but not publication date or location. Our official search ended the first week of February 2019.
Identifying Studies for Final Inclusion
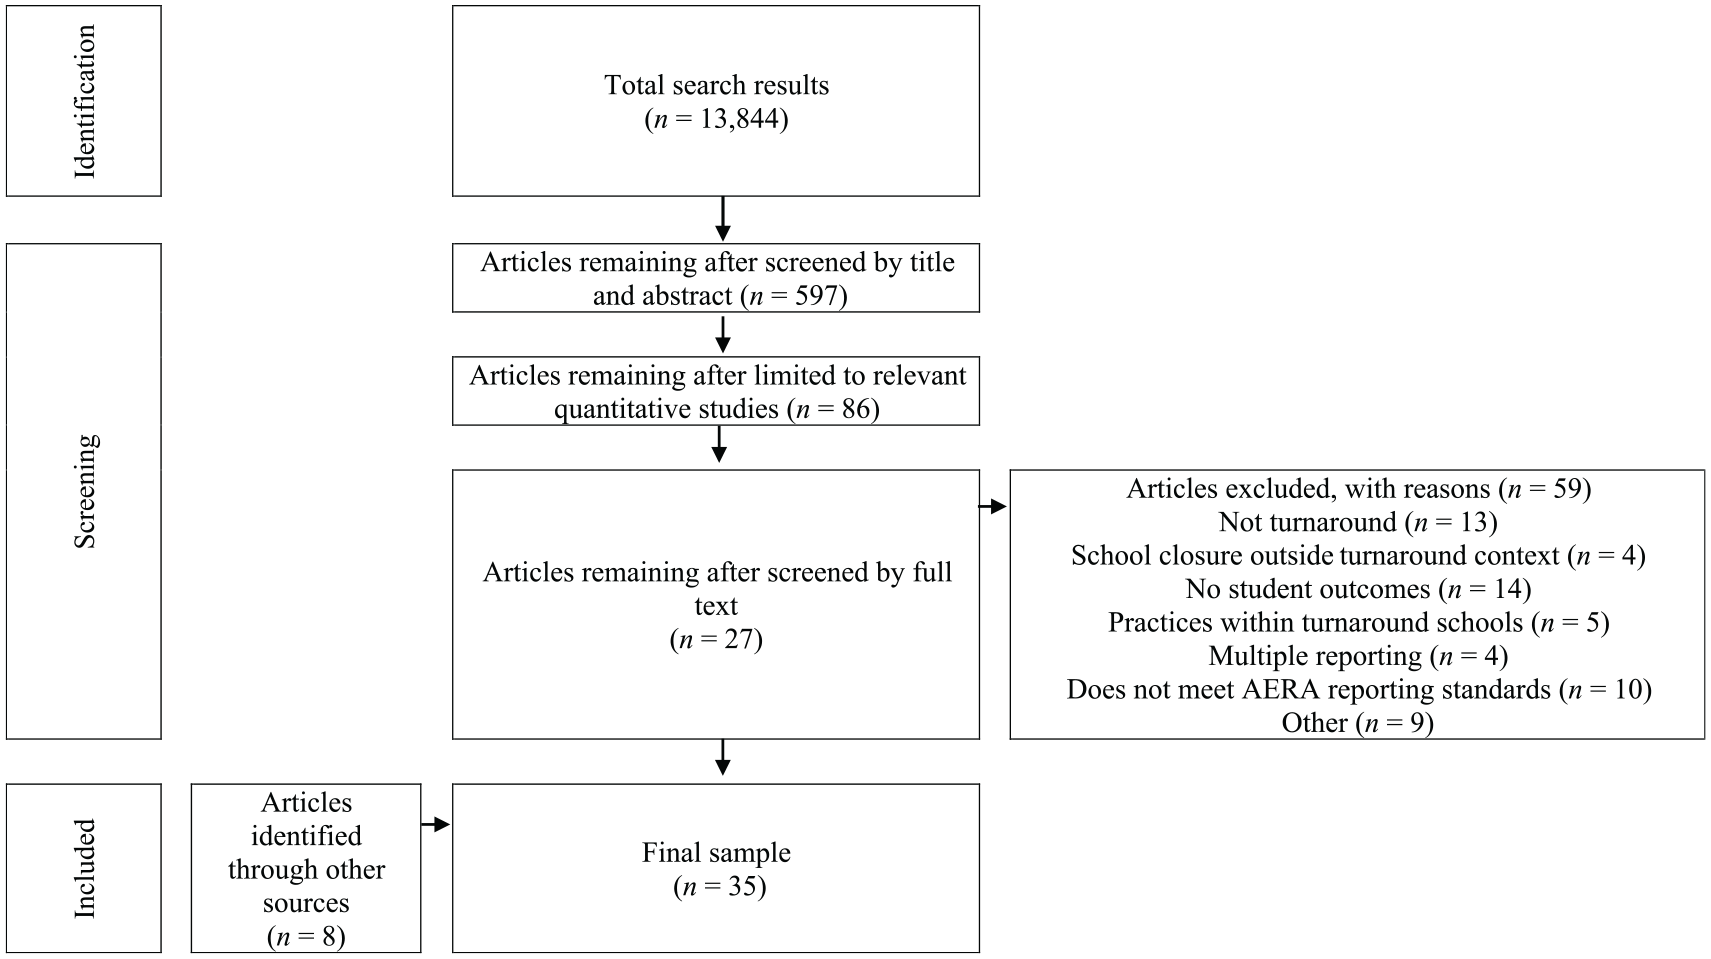
Figure 1 depicts the phases that were used to screen primary studies meeting all eligibility criteria. Three coders began by reading the title, abstract, and introduction for the first 1,000 studies listed when entering our search string in Google Scholar. After discussing discrepancies and reasons for inclusion or exclusion, the remaining 13,800 studies were split for single-author review. We retained a study if the title, abstract, or introduction indicated the study contained empirical results pertaining to quantitative estimates of the effect of school turnaround on student outcomes. While a considerable literature has emerged on school turnaround, the overwhelming majority of these studies do not estimate the impacts of school turnaround on student outcomes. Supplementary Appendix Table 1 (in the online version of the journal) provides examples of excluded studies and the reasons for exclusion.
Study selection.
After limiting the articles to relevant quantitative studies, the authors independently determined whether or not the 86 studies fit the eligibility criteria outlined above. As described in Figure 1, studies were excluded if they were not focused on school turnaround, not focused on accountability-driven school closure, had no student outcomes, examined practices within turnaround schools, had multiple reports from the same study (e.g., journal article or reports from multiple years for the same evaluation), or did not meet American Educational Research Association (2006) reporting standards. In the case of multiple reports from the same study, we used the most recent publication. In addition to the 27 articles identified through this initial literature search, eight additional articles were identified through reference harvesting or other hand-searching, resulting in a sample of 35 studies that met all eligibility requirements. These studies serve as the analytic sample for the meta-analysis.
Coding Reports
Study characteristics and outcomes were then coded for all 35 eligible studies using a common coding schema (Supplementary Appendix Table 3 in the online version of the journal). The authors discussed which information needed to be coded, how to categorize school turnaround, issues concerning model specifications and the primary study’s preferred estimation strategy, selection of intent-to-treat (ITT) versus treatment-on-the-treated (TOT) estimates, and how to assess risk of bias (see Supplementary Appendix Tables 3 and 4 in the online version of the journal for more details). To practice coding, we selected and independently coded a few studies before comparing and then discussed and compared the exact information we coded. The authors met weekly to verify the information was coded consistently, particularly if multiple estimation models were presented. When possible, we coded authors’ preferred estimates, which we ascertained by authors’ explicit mention of their preferred estimates or their discussion of specific estimates. When the primary studies did not indicate a preferred estimate, we selected estimates based on the methods used and the extent to which robustness checks and sensitivity analyses were employed to establish internal validity. Moreover, when the authors provide both ITT estimates and TOT estimates, we preference the TOT estimates as we are interested in the impact of school turnaround on student outcomes. Finally, as we are interested in how the association between school turnaround and student outcomes varies by both the turnaround model and the length of time, when available, we obtained separate estimates from the same study. For instance, we have several estimates from Zimmer and colleagues (2017) as they provide separate estimates by the turnaround model as well as whether the estimate was in Year 1, or Year 2, or Year 3 of the program. Coding discrepancies were noted and resolved by consensus. Coder agreement occurred in 95% of the cells. Once these studies were coded, study authors were contacted in efforts to obtain missing information from eligible studies.
Study Quality
In our search, we chose to use an inclusive approach to include all studies satisfying our eligibility criteria. While this procedure represents the recommended approach in meta-analysis (Moher et al., 2009; Pigott & Polanin, 2020), bias may be introduced into meta-analytic effect estimates from poorly designed studies that do not account for selection bias. In response, we independently and holistically rated each study’s quality on a 1 to 5 scale, where 1 has high risk of bias and 5 has low risk of bias (Lipsey & Wilson, 2001). Supplementary Appendix Table 4 (in the online version of the journal) contains the general criteria used to determine our rating. Supplementary Appendix Table 5 (in the online version of the journal) lists the method-specific criteria used to assess risk of bias for each primary study. Any discrepancies between our ratings were resolved through consensus. In the main results presented in the article, we focus our sample to studies with scores of 3 or higher that were deemed to have a lower risk of bias. We indicate whether each primary study was rated as having a low or high risk of bias in Supplementary Appendix Table 6 (in the online version of the journal). We also present the results from our main analyses when we do not make this sample restriction (Supplementary Appendix Table 10 in the online version of the journal) and formally test the extent to which study quality is associated with the summary effect sizes (Supplementary Appendix Table 11 in the online version of the journal).
Effect Size
Our effect size of interest is the standardized mean difference (
In sum, our process follows the methods outlined in Lipsey and Wilson (2001) and Cohen (2013) and have been employed by other current meta-analyses (e.g., Holme et al., 2010; Nguyen et al., 2019; Valentine et al., 2017). Finally, while there may be debate about the extent to which the primary studies included in our article apply a research design that allows for causal inference, we use the language of effect size for consistency with meta-analytic nomenclature.
Moderating Variables
We coded a series of a priori moderators to examine how the association of school turnaround and student test scores varied by different program and study characteristics. Specifically, we included the following variables as moderators: (a) the specific turnaround model (all inclusive, transformation, turnaround, restart, closure, and state turnaround); (b) the treatment year (Year 1 vs. Years 2, 3, and 4); (c) change in governance or management; and (d) the methods employed to obtain the estimate such as regression discontinuity (RD). Research suggests the effectiveness of school turnaround may also be moderated by other factors, including the quality of implementation (Dragoset et al., 2017), urbanicity (Ayers, 2011; Heissel & Ladd, 2018), and program costs (Dee, 2012). Unfortunately, these additional moderators were not systematically examined in the studies included in this meta-analysis, thus limiting this analysis to the four aforementioned moderators.
We delineate the turnaround model based on the federal turnaround models (i.e., transformation, turnaround, restart, and closure) or implementation of state-led effort to improve the lowest performing schools under NCLB waivers (i.e., state turnaround). Studies that do not separate the results by a specific turnaround model or specify which turnaround model was implemented but otherwise followed our definition of school turnaround are included in an inclusive category. For instance, if a study examines how school transformation and turnaround both influence student outcomes, then we would classify these estimates in the general category (i.e., Hallberg et al., 2018; Sun et al., 2017). To understand whether a change in management or governance is associated with improved student outcomes, we compare schools that maintained local control during their turnaround process to restart schools and schools that were taken over by the state (i.e., Recovery School District; Achievement School District).
The final moderation analysis explores the sensitivity of the estimated meta-analytic effects to a study’s research design. Some research suggests the schools that make the largest gains under school turnaround are the lowest performing (Henry et al., 2015). If this phenomenon is widespread, a research design such as DD or propensity score matching (PSM) would be preferable as they estimate average treatment effects. Yet, such methods are also susceptible to selection bias, and, in the case of DD, pretreatment differences between turnaround and non-turnaround schools that may shape outcomes during the implementation of a turnaround model (Heissel & Ladd, 2018). As a result, an RD design likely provides less biased estimates of the effect of school turnaround, although this local average treatment effect is estimated for the highest performing of the low-performing schools in a state, where we might expect a smaller effect of school turnaround (Henry et al., 2015). To explore how the estimated effect varies across research design, we compare studies employing an RD design to all other studies.
Analytic Strategy
Because of the variation across studies in terms of how the schools were selected to be turned around, the type of intervention that took place, whether the effect sizes are based on first-year implementation or subsequent years, and the characteristics of the students in these schools, we adopt a random-effects model. Unlike a fixed-effects model, the random-effects model makes no assumption about a constant effect size across all studies, a reasonable assumption given the heterogeneity in turnaround models and variation across settings. In addition, we relied on heterogeneity statistics to inform our decision to use random-effects models.
Results
Descriptive Information of Individual Studies
Supplementary Appendix Table 6 (in the online version of the journal) provides information about the studies included in our meta-analysis, including the turnaround models in the study, the sample population, the outcomes and methods of analysis, whether there is higher or lower risk of bias, and the overall results. From this table, we observe there is a balance of studies across the years of publication, turnaround models, and the state(s) or location(s) in which the turnaround efforts took place. In particular, we see the primary studies cover a wide range of states, California, Ohio, Michigan, Texas, North Carolina, New York, and Louisiana, to name a few, covering all levels of K–12 students. Moreover, there is also extensive coverage of cohorts of students from 1997 to 2015. In addition, these studies also include a variety of quasi-experimental strategies including RD, DD, comparative interrupted time series (CITS), PSM, instrumental variable (IV), and a variety of fixed effects. We also observe that, while most studies find no significant effects, there are many studies that find positive relationships between school turnaround and student outcomes and that these positive relationships vary across the turnaround model, the population sample, and the research design. In short, Supplementary Appendix Table 6 (in the online version of the journal) illustrates the extent to which turnaround efforts have been employed as a means to turn around low-performing schools in the United States and how researchers have spent a tremendous amount of time and effort to analyze the relationship between school turnaround and student outcomes.
Table 1 presents descriptive information about the primary studies included in the meta-analysis separated into the full sample and high-quality studies only. About three quarters of the studies in the sample are high-quality studies. We focus on the high-quality studies in our analysis and discussion as we believe these studies provide the most rigorous estimates of the relationship between school turnaround efforts and student outcomes. We note, however, that the high-quality studies do reflect the full sample based on the percentage of peer review studies, the sample size, program characteristics, and number of treatment estimates. Although we emphasize the high-quality studies, we provide the results with the full sample in Supplementary Appendix Table 10 (in the online version of the journal).
Descriptive Information on the Primary Studies by Study and Program Characteristics

Note. High-quality studies include studies with scores 3 or higher on our subjective rating scale. See Supplementary Appendix Table 3 (in the online version of the journal) for further details on study ratings. Peer review includes only peer-reviewed studies. ELA = English language arts.
All of the high-quality studies included in the meta-analysis come from 2009 to 2019 and a little more than half are peer-reviewed. The median sample size is 100,000 students, ranging from more than 5,000 students to nearly six million students. In terms of program characteristics, 28% of the studies’ estimates examine the overall effect of federal school turnaround but not disaggregated into a specific type of turnaround, whereas 17% examine transformation, 22% turnaround, 8% restart, 17% closure, and 11% examine state turnaround. In terms of the treatment year, 31% of the estimates are for the effects from the first year of implementation, whereas 69% are for subsequent years. Finally, the majority of the estimates examine the relationship between school turnaround and standardized mathematics and ELA test scores, while there are some studies that examine attendance, graduation, and college enrollment. These statistics are comparable to the full sample of studies.
Estimating Meta-Analytic Effects Across Studies of School Turnaround
Table 2 presents the meta-analysis random-effects estimates of the relationship between school turnaround and student outcomes using only high-quality studies. The lower and upper bounds come directly from the 95% confidence intervals of the summary estimates, so a negative lower bound indicates a nonsignificant result at the 5% level. For student attendance rates, the summary estimate from 14 estimates indicates school turnaround is associated with a 0.41 percentage point increase in student attendance. 8 Across seven estimates, we find school turnaround is associated with a 9.8 percentage point increase in graduation rates. As the vast majority of studies examine standardized test scores, we have the most evidence on math and ELA test scores. Across 83 estimates, school turnaround is associated with a 0.081 SDU increase in students’ math test scores, and similarly, across 74 estimates, a 0.040 SDU increase in students’ ELA test scores. Overall, the results indicate a positive association between school turnaround and attendance, standardized test scores, and graduation.
Meta-Analytic Results of the Association of Turnaround Interventions on Academic Outcomes
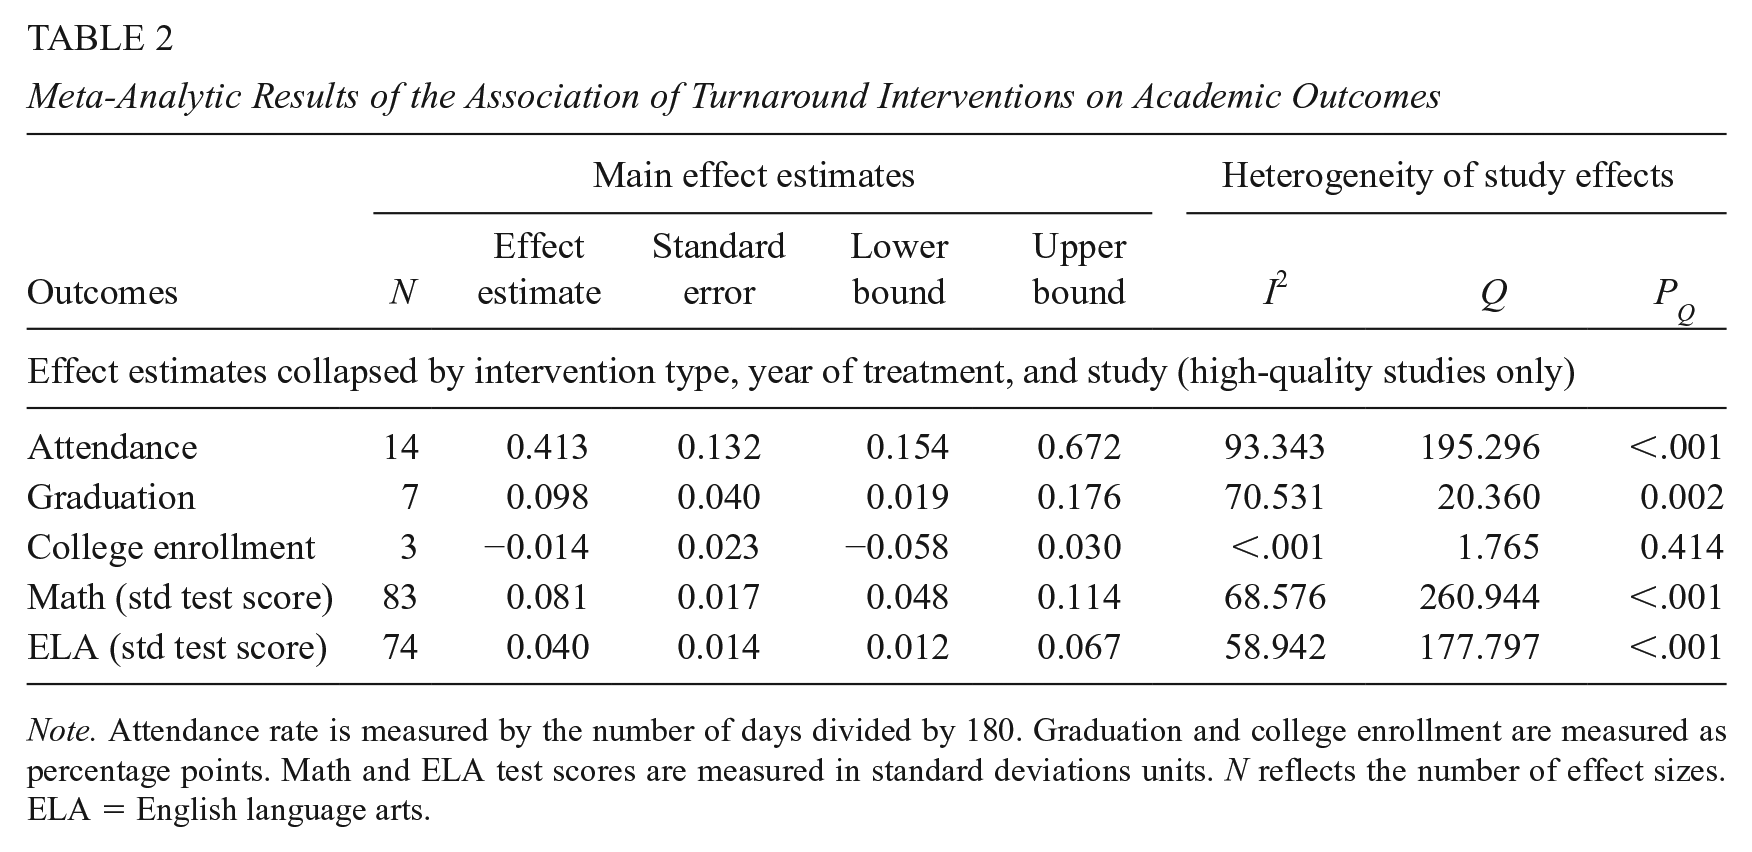
Note. Attendance rate is measured by the number of days divided by 180. Graduation and college enrollment are measured as percentage points. Math and ELA test scores are measured in standard deviations units. N reflects the number of effect sizes. ELA = English language arts.
As discussed in the “Method” section, we rely on the random-effects meta-analytic model because we expect the relationship between school turnaround efforts and student outcomes to vary by the intended population, the type of intervention, and the length of implementation. We also present empirical evidence that random-effects models are more appropriate than fixed-effect models in the last three columns of Table 2. As there are a limited number of estimates on most of the outcomes except standardized test scores, we focus our discussion of a set of standard heterogeneity statistics on ELA and math test scores. For math test score, the percentage of observed variance across the 74 estimates that reflects the true heterogeneity in effect sizes (I2) is 68.694, indicating that about 31 percent of the total variation can be attributed to random error. The Cochrane’s Q statistics, which tests the null hypothesis of homogeneity across studies, indicates the true dispersion of effect sizes is not zero (p < .001). These empirical results suggest the random-effects models are appropriate for our analysis. We find similar evidence of heterogeneity for math test scores and we explore these variations graphically in the forest plots and in our moderator analysis below.
Heterogeneity of Effects of School Turnaround
Our first step in describing the heterogeneous treatment in math and ELA test scores is to present forest plots. Supplementary Appendix Figure 1 (in the online version of the journal) presents stylized forest plots for math and ELA with estimates for each study and type of turnaround model. Because these forest plots use estimates that do not consider the length of the intervention, we emphasize the meta-analytic results presented from Supplementary Appendix Figure 1 (in the online version of the journal) are slightly different than the full sample but correspond to Supplementary Appendix Table 10, Panel B (in the online version of the journal). Each row represents an effect estimate for a turnaround model from each study that examined math or ELA outcomes, plotted in order of increasing effects. Furthermore, each figure presents the 95% confidence interval and the point estimates and the weight that each study contributes to the summary effect size. The dotted vertical line intersecting the diamond shows the meta-analytic effect for that outcome. For math test scores, only one estimate by Engberg et al. (2012) for the closure intervention reports a statistically significant negative effect, whereas the vast majority of the studies report null results or positive significant results. For instance, Dragoset et al. (2017) and Heissel and Ladd (2018) report that school turnaround has little to no effect on math test scores. However, their results are imprecise, and their confidence intervals indicate a possible range of −0.13 to 0.14 standard deviations in math test scores. As we move down Panel A of Supplementary Appendix Figure 1 (in the online version of the journal), there are a number of studies such as Schueler et al. (2017), Silander (2012), Strunk, Marsh, Hashim, Bush-Mecenas, and Weinstein (2016), Sun et al. (2017), and Zimmer et al. (2017) that find a positive relationship between school turnaround and math test scores. There are also studies that find marginally significant results (e.g., Carlson & Lavertu, 2018; Dee, 2012). Next, we explore three explanations for this heterogeneity, including the turnaround model, the number of years of implementation, and the study’s research design.
Differences in Student Test Scores by Turnaround Model
Different turnaround models employ different mechanisms to drive changes to student experiences and outcomes, but also pose unique disruptions to school staff and students. In Table 3, we examine the relationship between turnaround models and math (Panel A) and ELA test scores (Panel B). In Panel A, when the primary studies examine the overall relationship between turnaround efforts and math test scores but do not (or are unable to) separate their estimates by turnaround model, we observe school turnaround is associated with a 0.062 SDU increase in students’ math test scores. For the transformation model, this relationship increases to 0.177 SDUs. For the turnaround model, the magnitude of this relationship is 0.093 SDUs. For the restart model, the summary estimate is a 0.214 SDU increase in math test scores. We find no evidence of a significant relationship between school closure or state turnaround and math test scores. Across 14 estimates, the relationship between the closure model and math test scores is effectively zero. The summary estimate for state turnaround model is negative, albeit statistically insignificant. For ELA test scores, we find the summary estimates for the transformation, turnaround, and restart models are the most substantial—0.057, 0.083, and 0.143 SDUs, respectively—although restart is only marginally significant. Both the closure and state turnaround models are negative and again statistically insignificant. 9
Meta-Analytic Results of Moderators of Association of Turnaround Interventions on Test Scores by Intervention Type
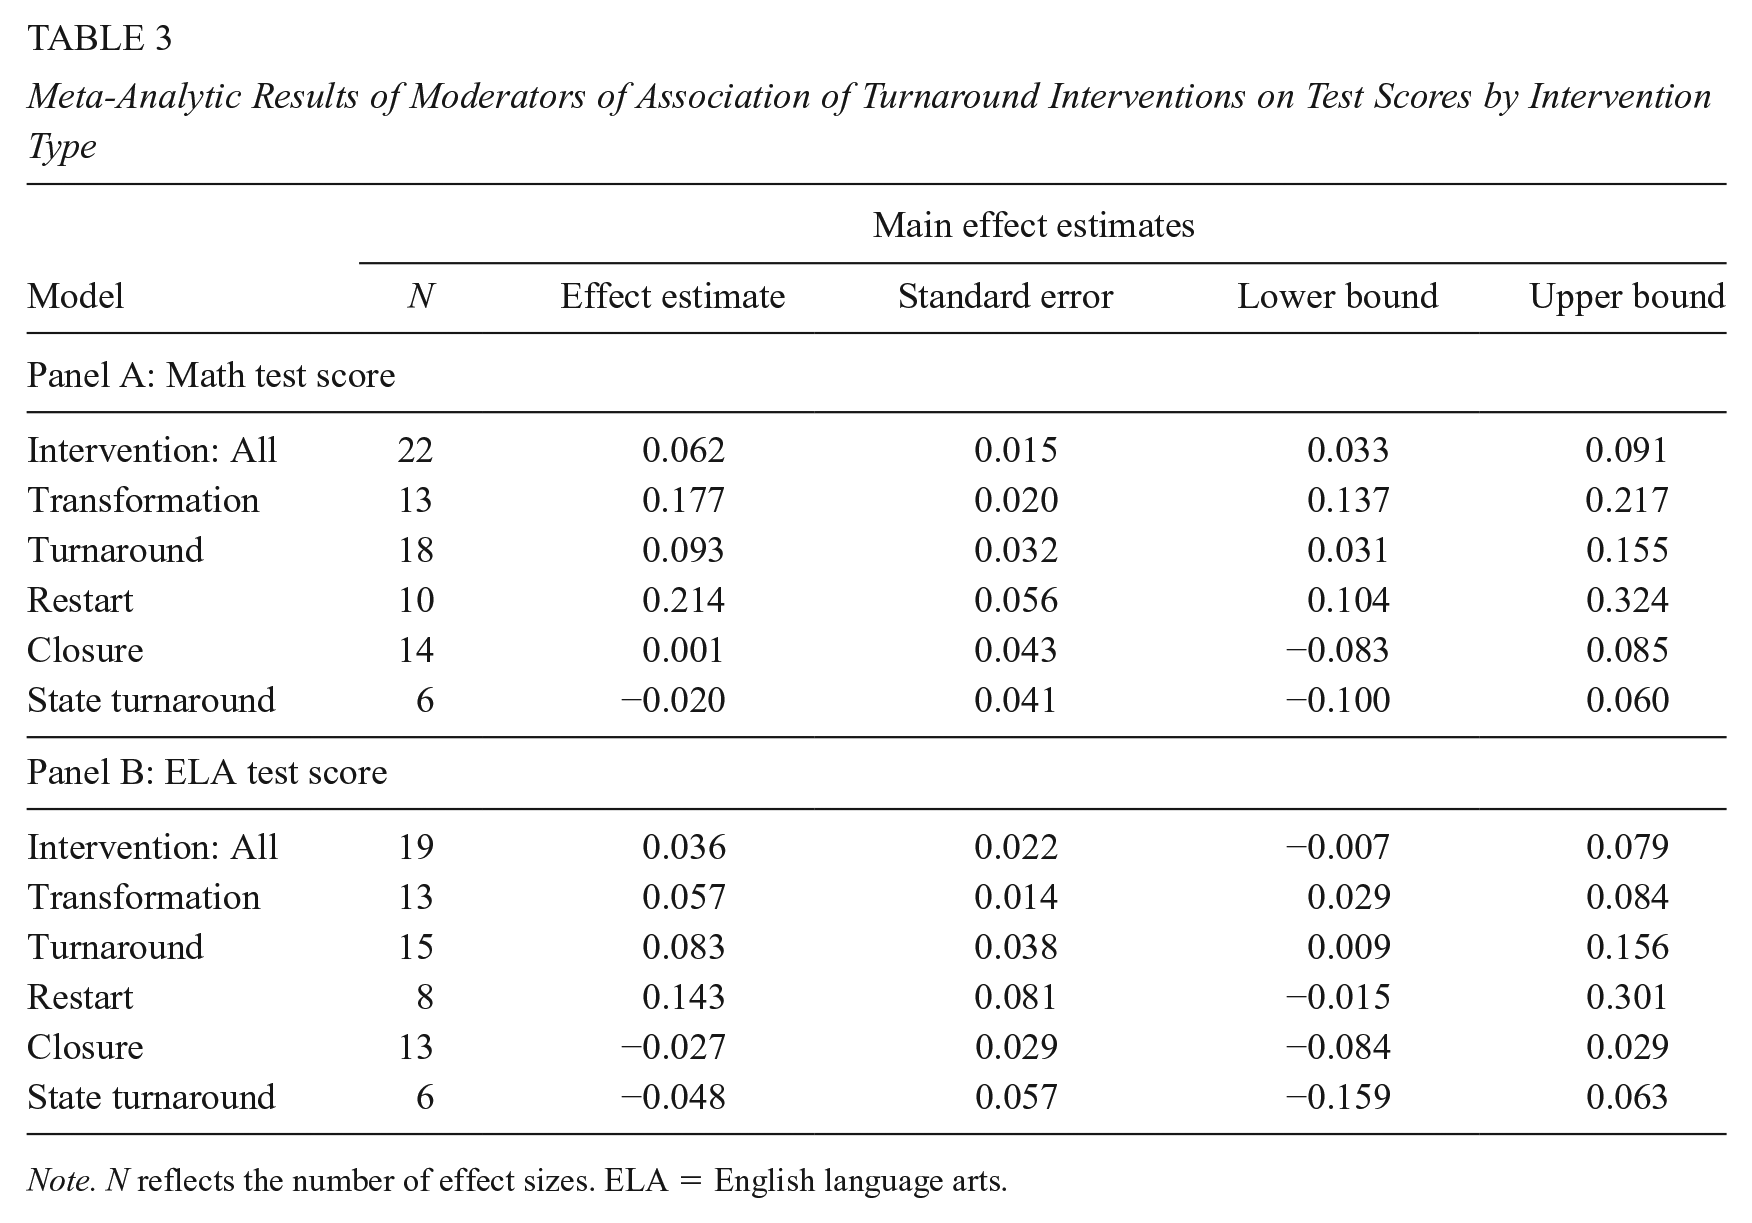
Note. N reflects the number of effect sizes. ELA = English language arts.
To test these differences in intervention type and treatment year more formally, we employ meta-regression (Supplementary Appendix Table 7 in the online version of the journal), where we regress effect estimates on intervention type and treatment year. Our meta-regression results confirm many of the subgroup differences that we observe in Tables 3. For instance, for math test scores, we observe the reported effect estimates from restart models are 0.214 SDUs higher than effect estimates from the school closure model. Relatedly, turnaround models and transformation models are 0.101 and 0.183 SDUs higher than closure models, respectively. In ancillary analysis, we shift the reference group to examine the extent to which the different turnaround models are more effective than one another. We find no significant differences between the transformation, turnaround, and restart models, respectively. State turnaround, however, is consistently found to be less effective than these federally sanctioned approaches to turnaround.
Differences in Student Test Scores by Treatment Year
Another potential explanation for differences in the relationship between school turnaround and student test achievement is whether outcomes are examined in the first year of implementation or the second through fourth years. In Panel A of Table 4, we show evidence more consistent with the hypothesis that the effect of turnaround takes time to emerge. For math test scores, the summary estimate for Year 1 estimates is insignificant at conventional levels, whereas the summary estimate for Year 1 for ELA is essentially zero and insignificant. In subsequent years, school turnaround efforts have a more positive association with student test scores. The meta-analytic results indicate students in turnaround schools gain an additional 0.127 SDUs in math and 0.084 SDUs in ELA. Even when accounting for turnaround model in the meta-regression, results indicate that differences between the first year of implementation and subsequent years—0.081 SDUs in math and 0.072 SDUs in ELA—are statistically and practically meaningful (Supplementary Appendix Table 7 in the online version of the journal).
Meta-Analytic Results of Moderators of Association of Turnaround Interventions on Test Scores by Treatment Year, Changes in Governance and/or Management, and Research Design
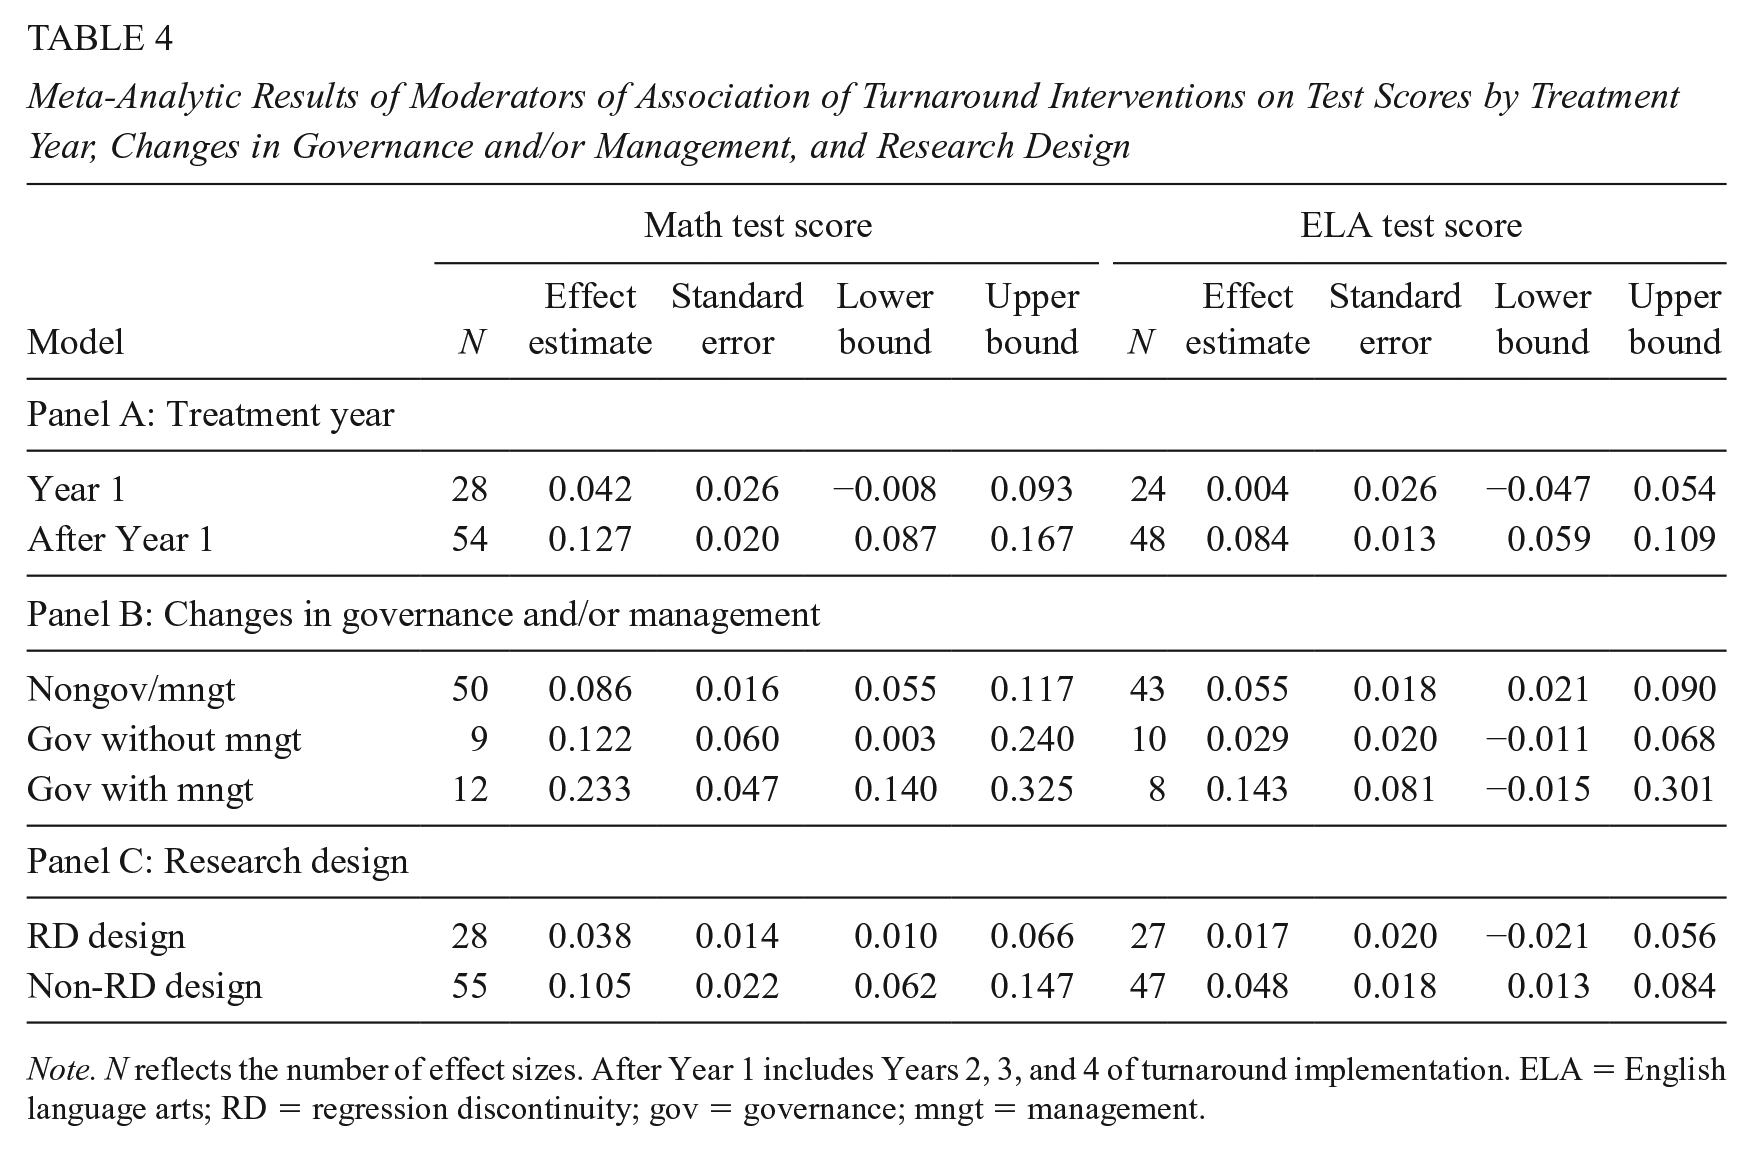
Note. N reflects the number of effect sizes. After Year 1 includes Years 2, 3, and 4 of turnaround implementation. ELA = English language arts; RD = regression discontinuity; gov = governance; mngt = management.
Differences in Student Test Scores by Change in Governance and/or Management
As discussed previously, changes in governance and/or management may be a mechanism to improve low-performing schools as states may be able to make changes that districts may be unwilling or unable to do on their own. As such, we examine whether changes in governance or management are associated with student outcomes relative to turnaround models that require no such change (Panel B of Table 4). Across 50 estimates that do not include a change in governance or management, we find students’ math test scores are 0.086 SDUs higher. For 21 estimates from turnaround that included changes in governance without management and 12 estimates from turnaround that included changes in governance and management, students’ math test scores are 0.122 SDUs and 0.233 SDUs higher, respectively. Students’ ELA test scores are 0.055 SDUs without a change in management or governance. Changes in governance without management and changes in governance and management were associated with 0.029 and 0.143 SDU higher ELA test scores, respectively, although neither estimate is statistically significant. When these differences are tested formally in a meta-regression framework (Supplementary Appendix Table 8 in the online version of the journal), we find no evidence that turnaround that involved changes in governance was significantly different from turnaround without changes in governance or management. However, compared with turnaround without changes in governance or management, changes in governance and management were associated with 0.166 SDUs higher math test scores and 0.099 SDUs higher and marginally significant ELA test scores. In other words, while turnaround without changes in governance or management is associated with positive student outcomes, the meta-regression results suggest that increases in student test scores are even larger for turnaround models that include a change in governance and management. 10
Differences in Student Test Scores by Research Design
The analytic methods employed by the primary studies may also play a role in the observed heterogeneity. In particular, several studies employ RD designs. While RD might yield the unbiased effect of school turnaround near the cutoff score that determines assignment to turnaround status (Schochet et al., 2010), these local average treatment effect estimates are less relevant for the worst performing schools that may benefit the most from school turnaround (Henry et al., 2015). We examine the extent to which RD estimates are in fact smaller relative to non-RD estimates by separating the effect estimates by research design (i.e., RD design vs. non-RD design) in Panel C of Table 4. Across 28 RD estimates, we observe that students’ standardized math test scores are 0.038 SDUs higher. In comparison, across 55 non-RD estimates, we observe the summary estimate to be 0.105 SDUs. When this difference is tested more formally with meta-regression in Supplementary Appendix Table 9 (in the online version of the journal), we find that RD estimates are 0.079 SDUs lower than non-RD estimates for math test scores and significant at the .05 level. The summary estimate for students’ ELA test scores is 0.017 SDUs for the RD studies (and not statistically significant) and 0.048 SDUs for the non-RD studies, but the difference is insignificant, though the point estimate is again negative. The chief explanation for this difference between RD and non-RD studies is that students in the lowest performing turnaround schools make the largest performance gains (Henry et al., 2015), although we cannot rule out the possibility that the non-RD studies are upwardly biased compared with the RD studies or more susceptible to mean reversion among students in the lowest performing schools.
Sensitivity Analyses
Robustness of Main Findings
As discussed previously, we prefer the high-quality studies that attempt to account for selection bias and other confounding factors when estimating the relationship between school turnaround and student outcomes. In Panel A of Supplementary Appendix Table 10 (in the online version of the journal), we replicate Table 2 using all the available studies found in the systematic search. These results are all substantively similar to our preferred estimates, with only slight changes in the magnitude of the estimates and no changes in direction or significance. To more formally test the extent to which the meta-analytic effect estimates might be influenced by the inclusion of the lower quality studies that are more susceptible to bias, we treat study quality as a moderator of the effect estimates (Supplementary Appendix Table 11 in the online version of the journal). The meta-regression results show that study quality does not have a significant relationship with the overall summary effects.
The meta-analytic results reported in Table 2 include multiple estimates from the same study to account for differences in turnaround model and years of implementation. As noted above, we argue that it is more appropriate to separate the results by treatment year as the literature suggests differences in the treatment effect over time. To address concerns that studies providing multiple effect sizes will be weighted more than studies providing only a single effect size, in Panel B of Supplementary Appendix Table 10 (in the online version of the journal), we replicate Table 2 but we do not take into account whether the estimates were first year estimates or estimates from subsequent years of implementation. While the test score estimates are slightly attenuated (0.081 vs. 0.063 in math and 0.040 vs. 0.025 in ELA), the effect estimate for attendance increases in magnitude. The effect estimate for graduation and ELA test scores are only marginally significant.
Exploring the Negative Findings
Even though the vast majority of the primary studies find positive or null relationships between school turnaround and student academic outcomes, as illustrated by Supplementary Appendix Figure 1 (in the online version of the journal), several studies find there may have been detrimental effects of school turnaround. We identify three possible reasons why the findings from these particular studies are contrary to other research. For school closure, the negative effects of school closure found in some studies decrease over time and can be offset for students who move to higher performing schools (e.g., Engberg et al., 2012; Özek et al., 2012). Another factor shaping negative or null findings relates to implementation quality. Dougherty and Weiner (2019) find suggestive evidence that state turnaround model in Rhode Island may have detrimentally affected student academic learning, particularly in schools where they were required to implement more interventions than those implementing fewer. They suggest that the context and coherence of implementation likely contribute to whether turnaround is effective, which is reinforced by other studies that also find a null or negative relationship with test scores (Bross et al., 2016; Dragoset et al., 2017; Hemelt & Jacob, 2017; Sherrod & Dawkins-Law, 2013; Strunk, Marsh, Hashim, Bush-Mecenas, & Weinstein, 2016). A final factor that may explain the negative findings relates to the composition of the student body in turnaround schools. Heissel and Ladd (2018) find a 3.4 to 6.0 percentage point increase in the percentage of free and/or reduced price lunch (FRPL) students in a school as a result of non-FRPL students exiting the school at higher rates.
Publication Bias
A common threat in meta-analyses is publication bias whereby the primary studies may be systematically unrepresentative of the true population of the completed studies (Banks et al., 2012). To explore this threat, we include Supplementary Appendix Figures 2 and 3 (in the online version of the journal) that show the contoured enhanced funnel plots for math and ELA outcomes. 11 Supplementary Appendix Figures 2 and 3 (in the online version of the journal) provide evidence that our analysis includes many insignificant findings thereby reducing the risk of publication bias. However, there are asymmetries in both figures due to a lack of precise negative effect estimates. While these plots suggest the possibility of bias in the nonpublication of precisely estimated negative results, the extent of this bias is likely small, if any. In addition to the concentration of studies with precisely estimated effects near zero, only half of our studies were published in peer-reviewed journals, which mitigates the concern that insignificant or negative results are being systematically excluded. Furthermore, large-scale studies, particularly on such an important and widely recognized topic, are likely to be published even if they found negative or null effects given the substantial amount of money invested and the widespread interest among researchers and policymakers in the effects of school turnaround on student outcomes. For instance, we have several studies with negative or null findings in our sample, many of which are not published in peer-reviewed journals (e.g., Bross et al., 2016; Dragoset et al., 2017; Tate, 2016). We also conducted Egger’s regression and Trim and Fill analyses to examine bias. The results indicate little to no bias is present. Consequently, we do not suspect publication bias is a serious threat to our findings.
Discussion
There is no debate that children placed at risk by society and its institutions need access to effective teachers and school supports to aid in their academic, behavioral, and social development. School turnaround has been a contentious strategy to reach this goal given its emergence from high-stakes test-based accountability and deliberatively disruptive approach to improving school operations (Rhim & Redding, 2014; Trujillo & Renée, 2012). Furthermore, that the challenges facing the lowest performing American schools are structural in nature has led some to question the efficacy of an approach that prioritizes school leadership and operations over students’ underlying barriers to success (Heissel & Ladd, 2018). Amid these criticisms of school turnaround, our meta-analysis shows evidence that school turnaround is associated with improvements in student attendance, math and ELA test scores, and graduation. When we separate the test score results by turnaround model, we find that the school transformation, school turnaround, and school restart models were all associated with improved ELA and math test scores. No evidence was found of a positive or negative relationship between accountability-driven school closure or the state turnaround efforts conducted under NCLB waivers and student test scores.
While the transformation, turnaround, and restart models are all associated with improved student test scores, our results give little indication of one model being more efficacious than others. This lack of evidence for a difference between the transformation and turnaround models contrasts to the findings from several studies suggesting that turnaround is more influential at improving student outcomes than transformation (Carlson & Lavertu, 2018; Dee, 2012; Dragoset et al., 2017; Sun et al., 2017). As a result, our findings do not indicate whether or not staff reconstitution is needed to bring about meaningful change in chronically low-performing schools or whether replacing the principal is sufficient. In terms of our conceptual framework, such a result implies that it is likely the interplay between improved organizational operations and human capital that explains this positive finding in transformation and turnaround schools.
Across all turnaround models, however, our results provide strong evidence that school turnaround shows limited success in improving student test scores in the first year of implementation, with positive associations concentrated in the second, third, or fourth year of implementation. This finding is consistent with the body of research on school improvement that suggests that the organizational complexity of schools precludes rapid improvements (Peurach & Neumerski, 2015), but is counter to the expectation among some turnaround proponents (Calkins et al., 2007). We stress these results do not speak to the long-term viability of this approach to school improvement. Even with positive associations concentrated in the later years of implementation, some have suggested that turnaround schools may revert, in part, to their original performance or the rate of improvement may level off after initial successes (Harris et al., 2019; Hochbein, 2012), a hypothesis we were unable to test in this study.
We also explored the extent to which successful turnaround was contingent on changing school management or governance. Students in turnaround schools that did not undergo changes to the management or governance still made significant improvements in achievement. Yet, meta-regression results indicate that increases in student test scores are even larger for the turnaround models that include a governance and management change. Understanding the factors driving this finding are beyond the scope of this study, although our conceptual framework suggests that the combination of high-stakes accountability pressures and reduced bureaucratic hurdles related to the hiring and firing teachers and improving organizational operations are possible factors shaping this finding (Zimmer et al., 2017).
To contextualize these findings, we first compare the effect estimates to other whole-school reform efforts. The effect estimates are consistent, if not slightly smaller than other recent whole-school reform efforts. The effect estimates for school transformation, school turnaround, and school restart range from 0.057 to 0.214 SDUs, generally smaller than 0.15 to 0.21 effect sizes for comprehensive school reform models reported by Borman and colleagues (2003). The results are comparable to recent evidence on the relationship between research–practice partnerships and student attendance (Cannata et al., 2019). For high school graduation, the 9.8 percentage point effect estimate is comparable to the 8 to 10 percentage point increase in high school graduation (Booker et al., 2011) and the 9.5 percentage point effect of attending a small high school in New York City (Bloom & Unterman, 2013).
The second way in which we interpret our findings is based on initial metrics developed to indicate successful school turnaround. Most measures of turnaround success offer what is arguably an overly optimistic picture of low-performing schools’ capacity to make substantial and sustained improvements in student outcomes (e.g., Meyers et al., 2012). As a result, we follow the more tempered measures of success suggested by Herman and colleagues (2008) in the IES Practice Guide on school turnaround. The authors’ measures include a 10-percentage point decrease in dropout rates and a quarter standard deviation improvement on test performance. Although the estimated test score effect estimates reported in this study do not meet this threshold, a 9.8-percentage point increase in the likelihood of graduating resembles the measures of success suggested in the IES Practice Guide.
Limitations and Directions for Future Research
There are a couple limitations to this meta-analysis that should be noted. First, to obtain meta-analytic effects of school turnaround, we have to aggregate our results across studies applying different research designs. As each research design requires a different set of identifying assumptions to obtain causal effects, estimates are not always perfectly comparable to one another. That being said, the magnitude of the meta-analytic effect estimates varies across research designs but is only significantly different for math test scores when comparing studies applying RD to all other studies.
Second, to best approximate the effect of school turnaround on student outcomes, we focus our main analysis on well-designed studies that best account for selection bias. It is possible, however, that our holistic measure of study quality may vary for other research teams with different perspectives on causal inference. This concern is somewhat assuaged by the fact that we detected no significant relationship between study quality and the overall summary effects. That being said, future meta-analyses could code not only a broad indicator of study quality but also method-specific design features to better understand possible sources of variation in meta-analytic effects.
With the exception of accountability-driven school closure and state turnaround efforts conducted under NCLB waivers, this study offers little conclusive evidence regarding the extent to which some turnaround strategies are more important than others in terms of improving student outcomes. Future research can continue to understand the relative importance of the four conceptual mechanisms described in this study. For instance, given evidence of the inequitable distribution of effective, experienced, and qualified school leaders and teachers across schools (Goldhaber et al., 2015), a critical avenue for improving low-performing schools is in terms of human capital. Several of the studies included in this meta-analysis indicate that improvements in teacher effectiveness following turnaround may have helped to disrupt long-standing inequities in low-income students’ exposure to high-quality teachers (Strunk, Marsh, Hashim, Bush-Mecenas, & Weinstein, 2016; Sun et al., 2017; Zimmer et al., 2017). More research is needed regarding administrators’ approaches to hiring teachers in turnaround schools. Le Floch and colleagues (2016) point out that school leaders might face a tradeoff between hiring new staff who are committed to school turnaround but have weaker content knowledge or pedagogical skills. Furthermore, as turnaround has led to the displacement of teachers of color (Barrett & Harris, 2015; de la Torre et al., 2013), research could more clearly highlight the racialized dynamics in staffing turnaround schools.
More evidence is also needed regarding the sustained retention of high-quality teachers in turnaround schools. With evidence that positive working conditions are associated with lower levels of teacher turnover (Simon & Johnson, 2015), future research could examine the extent to which improved organizational performance within turnaround schools is linked to lower teacher turnover or if the practices promoted as part of school turnaround increase the work demands on teachers, thereby exacerbating turnover (Heissel & Ladd, 2018). The retention of high-quality teachers has important implications for the long-term sustainability of school turnaround efforts, an important point our review is unable to address. When attending to these longer-term dynamics surrounding school turnaround, researchers could also examine the important question of the extent to which the short-term influx of resources and support in the lowest performing schools is sufficient in positioning them for future achievement or if significant investments must be sustained in these schools (Hitt & Meyers, 2017). Answering this question is important in the ESSA era, particularly since evidence from our meta-analysis showed that the approach to turnaround that most closely resembles current efforts—state turnaround efforts conducted under NCLB waivers—was not found to be effective among the high-quality studies. That being said, as state turnaround was the only turnaround model where the effect estimate changed in direction and significance when including the lower quality studies, more work is needed to examine state turnaround efforts, particularly in Massachusetts where two studies showed modest positive effects on student achievement (LiCalsi & Píriz, 2016; Papay, 2017).
A stronger evidence base is also needed regarding the concept of turnaround leadership. While this concept has been described extensively (Duke, 2015; Hitt et al., 2018; Steiner et al., 2008), it remains to be seen whether there are distinct, measurable characteristics of principals who lead turnaround schools that are different from other leadership approaches. Frameworks of turnaround leader competencies have been developed (Steiner et al., 2008), although they have yet to be validated, including documenting the extent to which measures of turnaround leadership are conceptually and empirically distinct from transformational or instructional leadership. Another approach would be to apply Grissom and colleagues’ (2015) measures of principal value-added to the leaders of the lowest performing schools, with a particular focus on the stability of principal value-added when principals work in multiple low-performing schools.
The results from this study suggest that changes in governance and management can prove beneficial for student outcomes (Zimmer et al., 2017). As a whole, this set of findings shows some support for a system of school management whereby district leaders maintain authority over the district, possibly adopting a portfolio management model (Marsh et al., 2013). Future research on portfolio management can explore the relative importance of changes in management and governance to improve the lowest performing schools in a district.
Future research can also work to better understand other factors that shape the efficacy of school turnaround. For instance, it has been emphasized that school turnaround is likely a more appropriate reform strategy in urban than rural school systems, given the greater supply of qualified replacement teachers and administrators (Heissel & Ladd, 2018). Unfortunately, this proposition was not systematically tested in the studies included in this meta-analysis. Future research can also examine the importance of implementation quality in turnaround schools and the relative importance of different organizational practices designed to improve organizational performance. For instance, while the broader school improvement literature suggests community ties is a critical component in effective schools (Bryk et al., 2010), only two of the studies in this review explicitly examined parent and community engagement (Dragoset et al., 2017; Heissel & Ladd, 2018). Finally, although SIG and RTTT provided states significant resources to invest in school turnaround efforts, our analysis is unable to link program cost with the positive student outcomes. The critical role of sustained resources dedicated to improving low-performing schools is a critical area of future research, particularly under ESSA, when states receive fewer federal investments directed toward ambitious school improvement.
More broadly, we believe that estimating the meta-analytic effects of school turnaround is an important first step in understanding the potential of this approach to school reform. That being said, we acknowledge that evidence on student outcomes is only part of the picture. Murphy and Bleiberg (2019) write, “Interwoven in turnaround are issues of democracy, constituent influence and control over organizational decisions, ownership of public institutions, trust, and organizational accountability” (p. 19). To this list of humanistic concerns, we add structural racism, as the process of turning around, restarting, and closing schools has introduced disproportionate disruptions for communities of color, particularly among the staff working at turnaround schools (Ewing, 2018). To reconcile what has become a somewhat fractured literature on school turnaround, we advocate for policymakers to weigh the evidence of positive associations with student outcomes with the negative externalities related to school turnaround. One worthwhile approach could be the application of Brighouse et al.’s (2018) framework to assess the evidence and underlying values of this reform model. Such a synthesis would help district, state, and the federal policymakers to decide how best to support low-performing schools, given the tradeoffs imbedded in the different school turnaround models.
Policy Implications
Improving the academic outcomes of students attending schools enrolling high concentrations of children living in poverty remains a persistent concern of education policymakers. As a whole, our results suggest that districts and states should continue to invest in efforts to improve the lowest performing schools. Yet, we worry that ESSA’s combination of increased state flexibility and more modest federal investments geared toward ambitious school reform will likely be insufficient to improve the academic outcomes of students attending schools with a history of low performance (Jacob, 2017). Even without the infusion of substantial federal funds, our results indicate that state and district leaders should still consider ambitious turnaround models, including the transformation, turnaround, and restart models, which were all shown to be effective approaches to improving student achievement. Alongside evidence that the chronically low-performing schools can be turned around, we show that accountability-driven school closure has no relationship with student achievement. Counter to the assertion that states and districts do not have the capacity to turn around schools at scale (Smarick, 2010), the results in this study suggest that working to improve low-performing schools rather than closing them is a worthwhile endeavor. A caveat to this policy recommendation is that district and state stakeholders should weigh the benefits to student achievement associated with school turnaround against the disruption that the process can bring to school systems and communities.
Second, we urge policymakers to temper their expectations regarding the immediacy of turnaround efforts taking hold and leading to positive student outcomes. Turnaround leaders’ continued employment is often contingent on demonstrated success within the first year, if not first months of their tenure. As successful improvement often takes time, district and state personnel overseeing turnaround efforts should define success carefully, including measures of school culture alongside growth in student achievement. Moreover, as our primary results show evidence of growth in terms of student test scores, evidence of success may be even more modest or slower to emerge when examining student performance levels. In addition, we also encourage skepticism in regard to management or governance changes as necessary for improvement. While changes in management may help lead to larger student achievement gains, they are by no means necessary for improved student outcomes in the lowest performing schools.
Supplemental Material
Christopher_Redding_Online_Appendix – Supplemental material for The Relationship Between School Turnaround and Student Outcomes: A Meta-Analysis
Supplemental material, Christopher_Redding_Online_Appendix for The Relationship Between School Turnaround and Student Outcomes: A Meta-Analysis by Christopher Redding and Tuan D. Nguyen in Educational Evaluation and Policy Analysis
Footnotes
Acknowledgements
We wish to thank Jael Gattle for assistance in the preparation of this manuscript.
Declaration of Conflicting Interests
The author(s) declared no potential conflicts of interest with respect to the research, authorship, and/or publication of this article.
Funding
The author(s) received no financial support for the research, authorship, and/or publication of this article.
Notes
Authors
References
Supplementary Material
Please find the following supplemental material available below.
For Open Access articles published under a Creative Commons License, all supplemental material carries the same license as the article it is associated with.
For non-Open Access articles published, all supplemental material carries a non-exclusive license, and permission requests for re-use of supplemental material or any part of supplemental material shall be sent directly to the copyright owner as specified in the copyright notice associated with the article.