



Abstract
Students with disabilities (SWDs) are more likely to be suspended or expelled than their general education peers and more likely to be chronically absent. This study uses 5 years of student-level data for all Michigan special education students to examine the relationship between educational setting, absenteeism, and disciplinary outcomes. Using within-student variation in an educational setting, I find that the degree of inclusion is associated with fewer disciplinary incidents and better attendance. However, the relationship between inclusion and disciplinary outcomes only exists for certain subgroups, and primarily for students who transitioned from more to less inclusive settings experiencing more disciplinary referrals and suspensions after these moves.
Keywords
Absences and exclusionary discipline are problematic for SWDs because they further limit learning opportunities for students who face academic challenges. Lower academic achievement often accompanies chronic absenteeism (Gershenson et al., 2017; Goodman, 2014; Gottfried, 2014; Gottfried & Kirksey, 2017) and exclusionary discipline (Anderson et al., 2019; Beck & Muschkin, 2012; Cobb-Clark et al., 2015; Kinsler, 2013; Noltemeyer et al., 2015). Furthermore, given concerns about the school-to-prison pipeline (Christle et al., 2005; Fabelo et al., 2011), exclusion from school may contribute to the overrepresentation of people with disabilities in the juvenile justice system (Coalition for Juvenile Justice, 2001; Kim et al., 2010).
The higher rate of chronic absenteeism for SWDs could be driven by a variety of factors, including health reasons, community factors (violence and trauma), a lack of appropriate educational placements, or school aversion (Attendance Works and the Healthy Schools Campaign, 2015). Similarly, the higher rate of exclusionary discipline for SWDs could theoretically be driven by a variety of factors. One statewide analysis finds that students receiving special education services are about 18 percentage points more likely to receive exclusionary discipline than GENs, even controlling for school fixed effects, the type of behavior, and behavioral history, suggesting that differences in student behavior are not driving all of the SWD-GEN discipline gap (Anderson & Ritter, 2017). Moreover, a student’s risk of chronic absence and disciplinary issues may be linked, as absenteeism is associated with illicit substance use (Hallfors et al., 2002), social disengagement, and alienation (Finn, 1989; Gottfried, 2014).
One potential lever for improving student outcomes is a student’s educational setting—in particular, the degree to which SWDs are educated in a general education classroom. SWDs in New York City included in general education classrooms are less likely to be chronically absent than their less-included peers, perhaps due to greater feelings of belongingness or engagement with school (Gottfried et al., 2019), which is related to absences (Gottfried, 2014). In addition, SWDs in Washington State who spend at least 80% of the day in general education classrooms have better attendance and other academic outcomes than SWDs who spent less time in general education settings but were otherwise observably similar (Theobald et al., 2017). While these studies are not able to fully account for selection into educational setting, they do suggest potential benefits of inclusion. The influence of educational setting is also an important topic for designing good policy and practice, because of the Individuals With Disabilities Education Act (IDEA, 2004) requirement to provide SWDs a “free and appropriate education” (FAPE) in the “least restrictive environment” (LRE).
Accordingly, the goal of this study is to determine how educational setting relates to absenteeism and disciplinary outcomes for SWDs. This study uses 5 years of student demographic, attendance, and discipline incident data for all SWDs in Michigan’s K–12 public schools. A key contribution of this study is the use of student fixed effects to investigate the role of student placement in predicting attendance and disciplinary outcomes. While some have used this approach to estimate the impact of special education placement on student achievement (Hanushek et al., 2002; Hurwitz et al., 2020; Schwartz et al., 2019) and attendance (Schwartz et al., 2019), the application of this approach to changes in educational setting for SWDs is particularly novel. To my knowledge, none of the work on the role of educational setting (e.g., Daniel & King, 1997; Gottfried et al., 2019; Rea et al., 2002; Theobald et al., 2017) have accounted for student heterogeneity in this way.
Michigan is a particularly relevant context in which to study these issues given the state’s recent identification as the only state in the nation—in addition to the District of Columbia—in need of intervention for failing to meet the IDEA requirements for individuals aged 3 to 21 (U.S. Department of Education, 2018a). Michigan’s SWDs experience high drop-out rates (29%), low graduation rates (63%), and poor academic achievement (Chambers, 2018). Given the negative correlates of absenteeism and exclusionary discipline described previously, it is possible that discipline and absenteeism may be contributing to these disturbing statistics.
Michigan’s SWDs experience disproportionality in exclusionary discipline and absenteeism at very similar rates to SWDs in the nation as a whole. For example, in 2013–2014, SWDs in Michigan were 2.1 times as likely as GENs to receive at least one OSS, and this disproportionality at the national level was nearly the same: 2.0 (Civil Rights Data Collection, n.d.). Similarly, the elevated risk (1.4 times) of being chronically absent for SWDs in Michigan was nearly identical to the national disproportionality. Still, the results of this study are likely to be more generalizable to demographically and regionally similar states, such as those that are predominantly White, as Michigan is 1 of 20 U.S. states with student populations that are 65% White or higher (National Center for Education Statistics, 2017).
I find that students are less likely to receive disciplinary referrals and be suspended during years in which they are in the general education classroom 80% or more of the day (i.e., mainstreamed), relative to when they are in less inclusive settings. Sensitivity analyses indicate these results should not be interpreted as causal, and moreover, this positive association is only significant for certain groups, which has important implications for designing policies aimed at addressing discipline disproportionalities. More inclusive educational settings are also associated with better attendance, with these relationships estimated to be statistically significant more consistently across subgroups.
This study has important implications for the IDEA’s requirement for schools to educate SWDs in the LRE meaning that, to the extent possible, SWDs should be educated alongside nondisabled students. In particular, there is a need to further understand any potential mechanisms at work and to further assess how to best support individual students.
Background on IDEA and Student Discipline
IDEA’s restrictions on disciplinary actions for SWDs might influence schools’ decision about what choice of consequence to use (in-school suspension [ISS], OSS, expulsion, or removal to alternative environment). Next, I summarize some of these relevant restrictions.
Beginning in 1997, IDEA stipulated that schools may remove a student with a disability for misconduct for up to 10 school days as long as the removal did not constitute a pattern of removal. A student cannot be removed for longer periods for behavior determined to be a manifestation of a disability. The 1997 amendments also allowed removal to an interim alternative educational placement for up to 45 days for students who possess a dangerous weapon or illegal drugs at school (U.S. Department of Education, 1999).
The 2004 reauthorization clarified that SWDs committing serious offenses such as drug possession, weapon possession, or infliction of serious bodily injury on another person may be removed to an interim alternative educational setting for up to 45 school days, regardless of a manifestation determination. For lesser violations, IDEA allows school personnel to suspend SWDs out-of-school for no more than 10 school days. If the removal is for more than 10 days, or if there is a series of removals that constitute a pattern, 1 a manifestation determination is required (Ryan et al., 2007). If the behavior is determined to be a manifestation of the disability, the educational placement cannot be changed without either parental consent or an Individualized Education Program (IEP) modification. For suspensions longer than 10 days, the student is entitled to educational services that will enable academic progress through the general education curriculum, address the undesirable behavior, and fulfill the goals of the student’s IEP.
Literature Review
Discipline Disproportionalities for SWDs
Concerns about exclusionary discipline are commonly expressed in the educational community, particularly with respect to students of color and SWDs. The overrepresentation of SWDs in suspensions, expulsions, and referrals to law enforcement (U.S. Department of Education, 2018b) raises concerns about whether SWDs are accessing an FAPE in the LRE, in the full spirit of the IDEA.
Overreliance on exclusionary discipline for SWDs is of concern because suspensions may be less effective for students with particular needs such as those with emotional and behavioral disorders/disabilities (EBD; Krezmien et al., 2006) or problems with aggression, hyperactivity, and social skills (Atkins et al., 2002). See Supplementary Table A in the online version of the journal for definitions of disability types (Michigan Department of Education, 2018). In addition, given that students with EBD also struggle academically (Kutash & Duchnowski, 2004), exclusion from educational opportunities is of particular concern. Even ISS, which is arguably less exclusionary than OSS or expulsion, may not be an effective response to misbehavior, as the quality of ISS differs greatly from district to district, ISS supervisors are often paraprofessionals without adequate training to work with “at-risk” students (Adams, 2000, p. 146), and receipt of ISS is still correlated with worse academic outcomes (Anderson et al., 2019; Noltemeyer et al., 2015).
Disability type might influence a student’s risk of exclusionary discipline in several ways. Manifestation of a disability such as an EBD, referred to in Michigan’s definitions (see Supplementary Table A in the online version of the journal) as an “emotional impairment,” might affect a student’s ability to regulate their own behavior. This is concerning because students with EBD require intensive and consistent interventions, and disruptions due to discipline referrals may impact their academic success (Krezmien et al., 2006).
Moreover, educational structures, resources, and context might affect the likelihood of students with EBD being involved in the disciplinary system. Growth in special education rates over time and a shortage of teachers to fill these positions led many school districts to rely on emergency licensure or alternative certification to fill special education teacher vacancies, with this stopgap strategy being applied disproportionately for students with EBD (Katsiyannis et al., 2003). Accordingly, Billingsley et al. (2006) found that teachers of students with EBD were younger, less experienced, less likely to be fully certified, and more likely to be certified through an alternative route than other special education teachers. Similarly, Henderson et al. (2005) found that teachers who primarily served students with EBD were less likely than other special education teachers to have a master’s, less likely to be fully certified, and more likely to have an alternative certification credential. Many studies have indicated that students with EBD are viewed by teachers as the most difficult and/or stressful to include in the general education classroom (Avramidis et al., 2000; Heflin & Bullock, 1999; Soodak et al., 1998; Yell, 1995). In addition, some have raised concerns about whether including students with EBD in a general education classroom actually sufficiently provides them with the intended benefits of inclusion such as opportunities for social interaction (Heflin & Bullock, 1999).
Students with other health impairments (OHI) may also be at higher risk for involvement in the school disciplinary system. OHI includes, for example, attention deficit disorder (ADD) and attention deficit hyperactivity disorder (ADHD), and students with ADD/ADHD may appear off-task, noncompliant, aggressive, impulsive, or may exhibit an inability to listen, sustain attention, or complete assignments (Al-Yagon, 2016; Tarver et al., 2014; Wehmeier et al., 2010), putting them at higher risk for disciplinary referral. LeFever et al. (2002) find that students diagnosed with ADHD are about 7 times as likely to receive a suspension or expulsion.
While the Michigan data used here do not indicate precisely what share of students with OHI is diagnosed with ADD/ADHD, over 11% of parents of Michigan 4- to 17-year-olds indicated their child was currently diagnosed with ADHD on a national survey (Centers for Disease Control and Prevention, n.d.). Although some of these students may not be receiving special education services for ADHD (because OHI only represents about 12.8% of all SWDs), it is reasonable to suspect that a large share of students with OHI have ADD/ADHD-related needs.
Students may exhibit undesirable behaviors if and when they feel excluded or otherwise unengaged, and disability type may be related to these feelings of belongingness. For example, students with learning disabilities in inclusion classrooms report more feelings of loneliness and are less popular than their classmates without disabilities (Pavri & Luftig, 2000). Similarly, Stiefel et al. (2018) find that middle school students with EBD and OHI are less likely than GENs to feel included with peers.
Indeed, some studies have directly shown that students with EBD (Achilles et al., 2007; Bowman-Perrott et al., 2013; Fabelo et al., 2011; Sullivan et al., 2014), ADHD (Achilles et al., 2007; Bowman-Perrott et al., 2013), OHI (Krezmien et al., 2006; Sullivan et al., 2014), and learning disabilities (Krezmien et al., 2006), in particular, are at higher risk for exclusionary discipline. Some have argued that these disparities suggest that schools may be poorly managing behavior and/or not considering a student’s disability when determining what type of disciplinary response to take, which is problematic because responding punitively might be counterproductive and reinforce negative behavior by making academic tasks more aversive (Krezmien et al., 2006).
Absenteeism Among SWDs
It is well established that SWDs, as a group, tend to be absent from school more than GENs (Theobald et al., 2017; U.S. Department of Education, 2016), but there are differences by disability type as well. Some studies suggest that students with emotional disorders tend to be at particularly high risk for absences, relative to other disabilities (Gottfried et al., 2019; Lane et al., 2006). ADD/ADHD (included in OHI) are associated with higher absenteeism (Kent et al., 2011). Other work also suggests that children with ADHD, autism spectrum disorder, intellectual disability, or other developmental delay were more likely to be chronically absent than students without developmental disabilities (Black & Zablotsky, 2018).
The higher rate of chronic absenteeism for SWDs could be driven by a variety of factors, including health reasons, community factors (violence and trauma), a lack of appropriate educational placements, or school aversion (Attendance Works and the Healthy Schools Campaign, 2015). Moreover, a student’s risk of chronic absence and disciplinary issues may be linked, as absenteeism is linked to the use of illicit substances (Hallfors et al., 2002), social disengagement, and alienation (Finn, 1989; Gottfried, 2014).
The Relationship Between Educational Setting and Student Attendance and Behavioral Outcomes for SWDs
The educational services provided to SWDs, and in particular the inclusiveness of the student’s educational setting, might have important implications for behavior and attendance. Inclusion relates directly to the LRE component of IDEA, based in part on the normalization principle (Dybwad, 1980), which argues for individuals with disabilities to have available all the same opportunities as nondisabled people. Some arguments for inclusion are that exposure to the general education curriculum could help students develop socially and feel more accepted and included (Ballard et al., 1977; Fitch, 2003).
While inclusion has been a national trend, there is little empirical evidence that the practice is actually effective (Gilmour, 2018; Stiefel et al., 2018), and some in the education community have argued for improvements in the quality of inclusive education programs, particularly for students with severe disabilities (Downing & Peckham-Hardin, 2007). Some scholars have questioned whether general education teachers have adequate motivation and preparation to educate SWDs effectively (Kauffman, 1993; Kavale & Forness, 2000; Zigmond & Kloo, 2017), which could create opportunities for SWDs to disengage from school or exhibit problematic behaviors. Many educators feel underprepared to meet the learning needs of students with exceptionalities (Scruggs & Mastropieri, 1996).
Early work found that SWDs included in general education classrooms exhibit lower levels of self-esteem (Daniel & King, 1997), which may lead certain students to act differently in an inclusive setting. More recent work, however, suggests that students’ feelings of inclusion are not closely related to the degree of inclusiveness of the student’s educational setting, except that for students with low-incidence (LI) disabilities, they actually felt more included when assigned to less inclusive settings (Stiefel et al., 2018).
Inclusion with GENs might help children with disabilities learn prosocial behaviors, at least for young children (Buysse & Bailey, 1993). This implies that positive behaviors might be learned through inclusion in general education settings. However, Daniel and King (1997) found that students in more inclusive settings exhibited more behavioral problems than their peers in noninclusion classrooms, based on the Child Behavior Checklist (CBCL).
Inclusion is also associated with better attendance outcomes (Gottfried et al., 2019; Rea et al., 2002; Theobald et al., 2017), perhaps due to greater feelings of belongingness (Gottfried et al., 2019), which is related to better attendance (Gottfried, 2014). However, less is known about how educational settings or services are associated with student likelihood of disciplinary referrals for SWDs, with some evidence that students with learning disabilities in inclusive classrooms received no more suspensions than students in a pullout program (Rea et al., 2002). In addition, these studies are not able to fully account for selection into educational setting, and placement is likely correlated with a variety of unobservable student characteristics that might predict behavioral and attendance outcomes as well. In other words, placement into educational setting is endogenous, and these findings should not be interpreted as causal.
The key contribution of the present study is to assess the relationship between educational setting and student behavioral and attendance outcomes, while accounting for unobservable characteristics of students that may be associated with educational setting. In addition, I estimate whether these relationships differ by disability type or other student characteristics. While I cannot fully rule out selection bias into educational setting, the results are informative about the types of students for whom inclusion appears to be associated with more positive outcomes, which has implications for designing policy and practical solutions.
Data and Descriptive Statistics
I use 5 years of student demographic data, attendance records, and incident-level disciplinary records from 2012–2013 to 2016–2017 for students identified as receiving special education services in the state of Michigan. 2 Descriptive statistics comparing the characteristics of student–year observations for students in special education, relative to students in general education, are available in Table 1. In Michigan, males, economically disadvantaged students, 3 and Black/African American students—groups who are already overrepresented in the school discipline system—are overrepresented among students receiving special education services. Students in special education are also less likely to be identified as limited English proficient.
Descriptive Statistics of Student–Year Observations for General and Special Education

Note. These descriptive statistics are based on student–year observations. Discipline infraction types, consequence types, and disability types are only reported for the 97% of students in the four most common educational settings, which defines the analytic sample. Low-incidence infractions include alcohol, arson, bomb or similar threat, and firearm. The total number of infractions (283,691) is higher than the total number of incidents (283,114) because some incidents included multiple infraction types. In some cases, multiple consequences were used for the same incident. In these cases, I counted the incident in the most exclusionary group. For example, a report of expulsion plus out-of-school suspension would be reported as expulsion. ***p < .01.
Table 1 also reports two attendance outcomes: the percent of days in the year that a student was absent and the share of students who are chronically absent, defined as missing at least 10% of the school days in a given year. 4 SWDs miss a greater percent of days, on average, and are about 1.6 times as likely as GENs to be chronically absent.
Table 1 also shows the frequency of each infraction type, consequence type, and disability type. For the years of this study, schools were only required to report disciplinary data for students in special education. 2 If additional incidents were reported for GENs, they were dropped from these analyses. The discipline data include codes for one or more infraction type (alcohol, arson, bomb threats, firearms, illicit drugs, other weapons, tobacco, violence with injury, violence with no injury, and other). 5 In approximately 0.2% of all disciplinary incidents reported, more than one infraction type is reported. Each incident reported indicates at least one consequence (expulsion, ISS, OSS, and removal to an alternative educational setting). 6
Students in some educational settings are at lower risk of involvement in a typical public school discipline system and may also not be in settings that record attendance in a consistent way, so they are excluded from this analysis. In particular, I drop 3% of student observations for which the primary educational setting was either an early childhood program, homeschooling, hospitalization, correctional facility, private schooling, or other nonschool setting. This results in keeping the 97% of observations in the four most common school-based settings. Ranging from most to least inclusive, these include a general education classroom 80% or more of the day (66% of SWD student–year observations), general education 40% to 79% of the day (15%), general education less than 40% of the day (11%), or a public or private special education school building at public expense (6%). For SWDs, educational placement decisions are made by the IEP team, which assesses the IEP at least once a year. The Michigan Department of Education (MDE, 2004, p. 2) provides guidance on determining the appropriate LRE for students. Notably, the MDE recommends that “education assignments are not to be based on the label describing the student’s disability or the availability of programs.” This means that the process of determining educational placement should be specific to student needs, and it is difficult for researchers to obtain an exogenous predictor of student placement.
Table 1 shows the frequency of infraction types for this restricted set of students (those in the four most frequent educational settings) in Michigan. In about 0.2% of incidents, more than one infraction type is recorded in the administrative data. In Table 1, each of these infraction types is reported separately rather than combined into one incident. The most common type of infraction (81%) is the “other” category, which I refer to as other nonspecified, to indicate that these were only coded as “other” in the data and are not a researcher-created category. The inability to separate this group of infractions into more specific categories is a limitation, as the types of infractions included may differ by school and also over time. I use school and academic year fixed effects to control for possible school-specific reporting practices or secular time trends related to reporting.
More serious infractions occur less frequently: physical violence without injury (12.8%), physical violence with injury (2.3%), illicit drugs (1.2%), tobacco (1.1%), and other (nonfirearm) weapons (0.9%). LI referrals such as alcohol, arson, bombs or similar threats, and firearms are particularly rare and represent only 0.5% of the total number of infractions. In a given year, less than 12% of SWDs in Michigan receive one or more referrals.
Table 1 also shows the frequency of disciplinary consequences, by type. I order these by the degree of exclusion (expulsion and removals to alternative settings as the most exclusionary, followed by OSS and ISS). In some cases (approximately 2.3% of all disciplinary incidents reported), more than one consequence was reported, so in these instances, I code the consequence as the most exclusionary listed, following this hierarchy of exclusion: (a) expulsion or removal to alternative educational setting (either unilaterally or by a hearing officer), 7 (b) OSS, and (c) ISS. For example, if an incident resulted in OSS and ISS, it was coded as OSS.
Finally, Table 1 shows the frequency of each student disability type. The most common disability types are specific learning disabilities (SLDs, 35.4%), speech and language impairment (21.1%), OHI (12.8%), cognitive impairment (10.4%), autism spectrum disorder (8.8%), and emotional impairment (6.3%). Severe multiple impairments are rare (1.6%), and I group another six categories, each representing less than 1.5% of the total, as “low-incidence” disabilities. 8 The sum of the LI disabilities represents only 3.6% of total student–year observations. Some categories have experienced large growth over time. OHI grew 19.6% over the 5-year period, and autism spectrum disorders grew 18.6% over the 5-year period. See Supplementary Table B in the online version of the journal for the frequency of reported disability types by year.
As in Michigan, across the United States, students with SLDs are the most common category of SWDs, representing 42% of all students receiving special education services in the country (Cortiella & Horowitz, 2014). The term “learning disabilities” is often used interchangeably with “specific learning disabilities” (Pullen et al., 2017). While this category experienced fast growth between 1976 and 2000, the number of students identified with SLDs declined by 18% between about 2002 and 2011 (Cortiella & Horowitz, 2014).
Next, Table 2 shows how the frequency of disciplinary referrals and absenteeism differs across disability type. The bulk of disciplinary incidents, 79%, are for students representing three disability types (SLD, emotional impairment, and OHI). While students with SLD and OHI are chronically absent at a rate similar to those of SWDs overall, students with emotional impairment are also more likely to be chronically absent (38.1%) than the average SWD (23.2%), a finding that was consistent with prior research (Gottfried et al., 2019; Lane et al., 2006). The likelihood of chronic absenteeism is also particularly high for students with severe multiple impairments (51.7%), but these students represent only 1.6% of SWDs.
Counts of Disciplinary Infractions and Consequences and Absenteeism Measures by Disability Type

Note. Data only reported for the 97% of students in the four most common educational settings, which defines the analytic sample. Low-incidence infractions include alcohol, arson, bomb or similar threat, and firearm. The total number of infractions (283,691) is higher than the total number of incidents (283,114) because some incidents included multiple infraction types. In some cases, multiple consequences were used for the same incident. In these cases, I counted the incident in the most exclusionary group. For example, a report of expulsion plus OSS would be reported as expulsion. ALE = alternative learning environment/alternative educational setting; OSS = out-of-school suspension; ISS = in-school suspension.
In addition, over 99% of consequences are either OSS or ISS, and over 96% of infractions fall into three categories: other nonspecified, violence without injury, and violence with injury. The main analyses will focus on these three common infraction types, OSS and ISS, and two measures of absenteeism, and when estimating separate models by disability type, I focus only on the three groups for which disciplinary issues are more common. 9
Analytic Methods
I conduct a series of student fixed effects models that use within-student temporal variation in educational setting to estimate the relationship between educational setting, attendance, and disciplinary outcomes. This approach controls for unobservable but time-invariant characteristics of students that might be related to educational setting and the outcomes of interest. However, causal identification requires the setting switches to be conditionally random which is unlikely, as such changes may be based on the student’s educational experience, which may include academic and behavioral outcomes.
An alternative approach could be to use an exogenous shock to policy or availability of resources that leads to a change in the use of a particular type of placement. Ballis and Heath (2019) use instrumental variables to exploit variation in the removal of special education services that was exogenously induced by a state policy requiring reductions in special education course loads, and theoretically, such an approach could be applied to a study of placement decisions as well. However, in Michigan, these types of exogenous determinations would actually be prohibited from being used for decisions about setting placement, as the MDE (2004, p. 2) recommends that “education assignments are not to be based on the label describing the student’s disability or the availability of programs.” This means that the process of determining educational placement should be specific to student needs, and it is difficult for researchers to obtain an exogenous predictor of student placement. As a result, while I use panel data methods to control for student heterogeneity, I do not draw causal conclusions from these models.
The student fixed effects models follow:
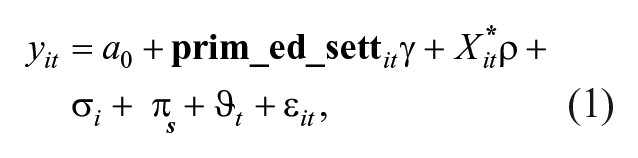
where the outcomes,
1. Whether student i had at least one disciplinary referral in year t.
2–4. Separately, by infraction type: whether student i was referred for any of the three most common infraction types (other nonspecified, violence without injury, and violence with injury), at least once in year t.
5–6. Separately, by consequence type: whether student i received at least one of each of the two most common consequence types (OSS and ISS) in year t.
7. Percent of days that student i was absent from school in year t (as a percent of days possible).
8. Whether student i was chronically absent in year t, defined as being absent at least 10% of days possible in year t.
I use linear probability models10 to estimate the binary outcomes (1-6 and 8). The variable of interest is
I include a student fixed effect,
In the student fixed effects models, only students who have variation in their primary educational setting across two or more of the 5 years of the study period will contribute to the estimates of the relationship between educational setting and the outcomes of interest.
About 22.5% of the students had at least one setting change, with about 14.4% of students having only one, 6.4% having two, and 1.7% having three or four. These changes are a roughly equal mix of moves to less inclusive settings (51.6%) and to more inclusive settings (48.4%). 12 Descriptive analyses of students who change educational setting indicate that they are somewhat different from other students: They are more likely to be economically disadvantaged and less likely to be White. They also have larger numbers of disciplinary infractions on average and are more likely to have cognitive impairments, emotional impairments, SLD, autism spectrum disorders, or OHI, but less likely to have speech and language impairments, severe multiple impairments, or LI impairments.
In addition to estimating student fixed effects models across all students, I test for heterogeneous effects by gender, race, and economic disadvantage, as well as for students labeled with the three most common disability types. To protect against Type I error (false positives) across a large number of models, I adjust the p values using the Benjamini and Hochberg (1995) false discovery rate correction, assuming a false discovery rate of 0.05.
Results
Next, I present in Table 3 the results, following Equation 1, overall and for subgroups of students that differ by race, gender, or economic disadvantage. Relative to being in a general education classroom 80% or more of the day (the reference category), less inclusive settings are associated with a similar or higher risk of disciplinary referrals (overall, and for each of the three most common infraction types, as shown in Panels A–D). The estimated relationships between educational setting and referrals occur primarily for males, White and Asian students, and noneconomically disadvantaged students, and these relationships are generally larger and more often statistically significant for other nonspecified referrals, as opposed to the less common violence-related referrals.
Predicting Discipline and Absenteeism Outcomes, Overall and by Student Group
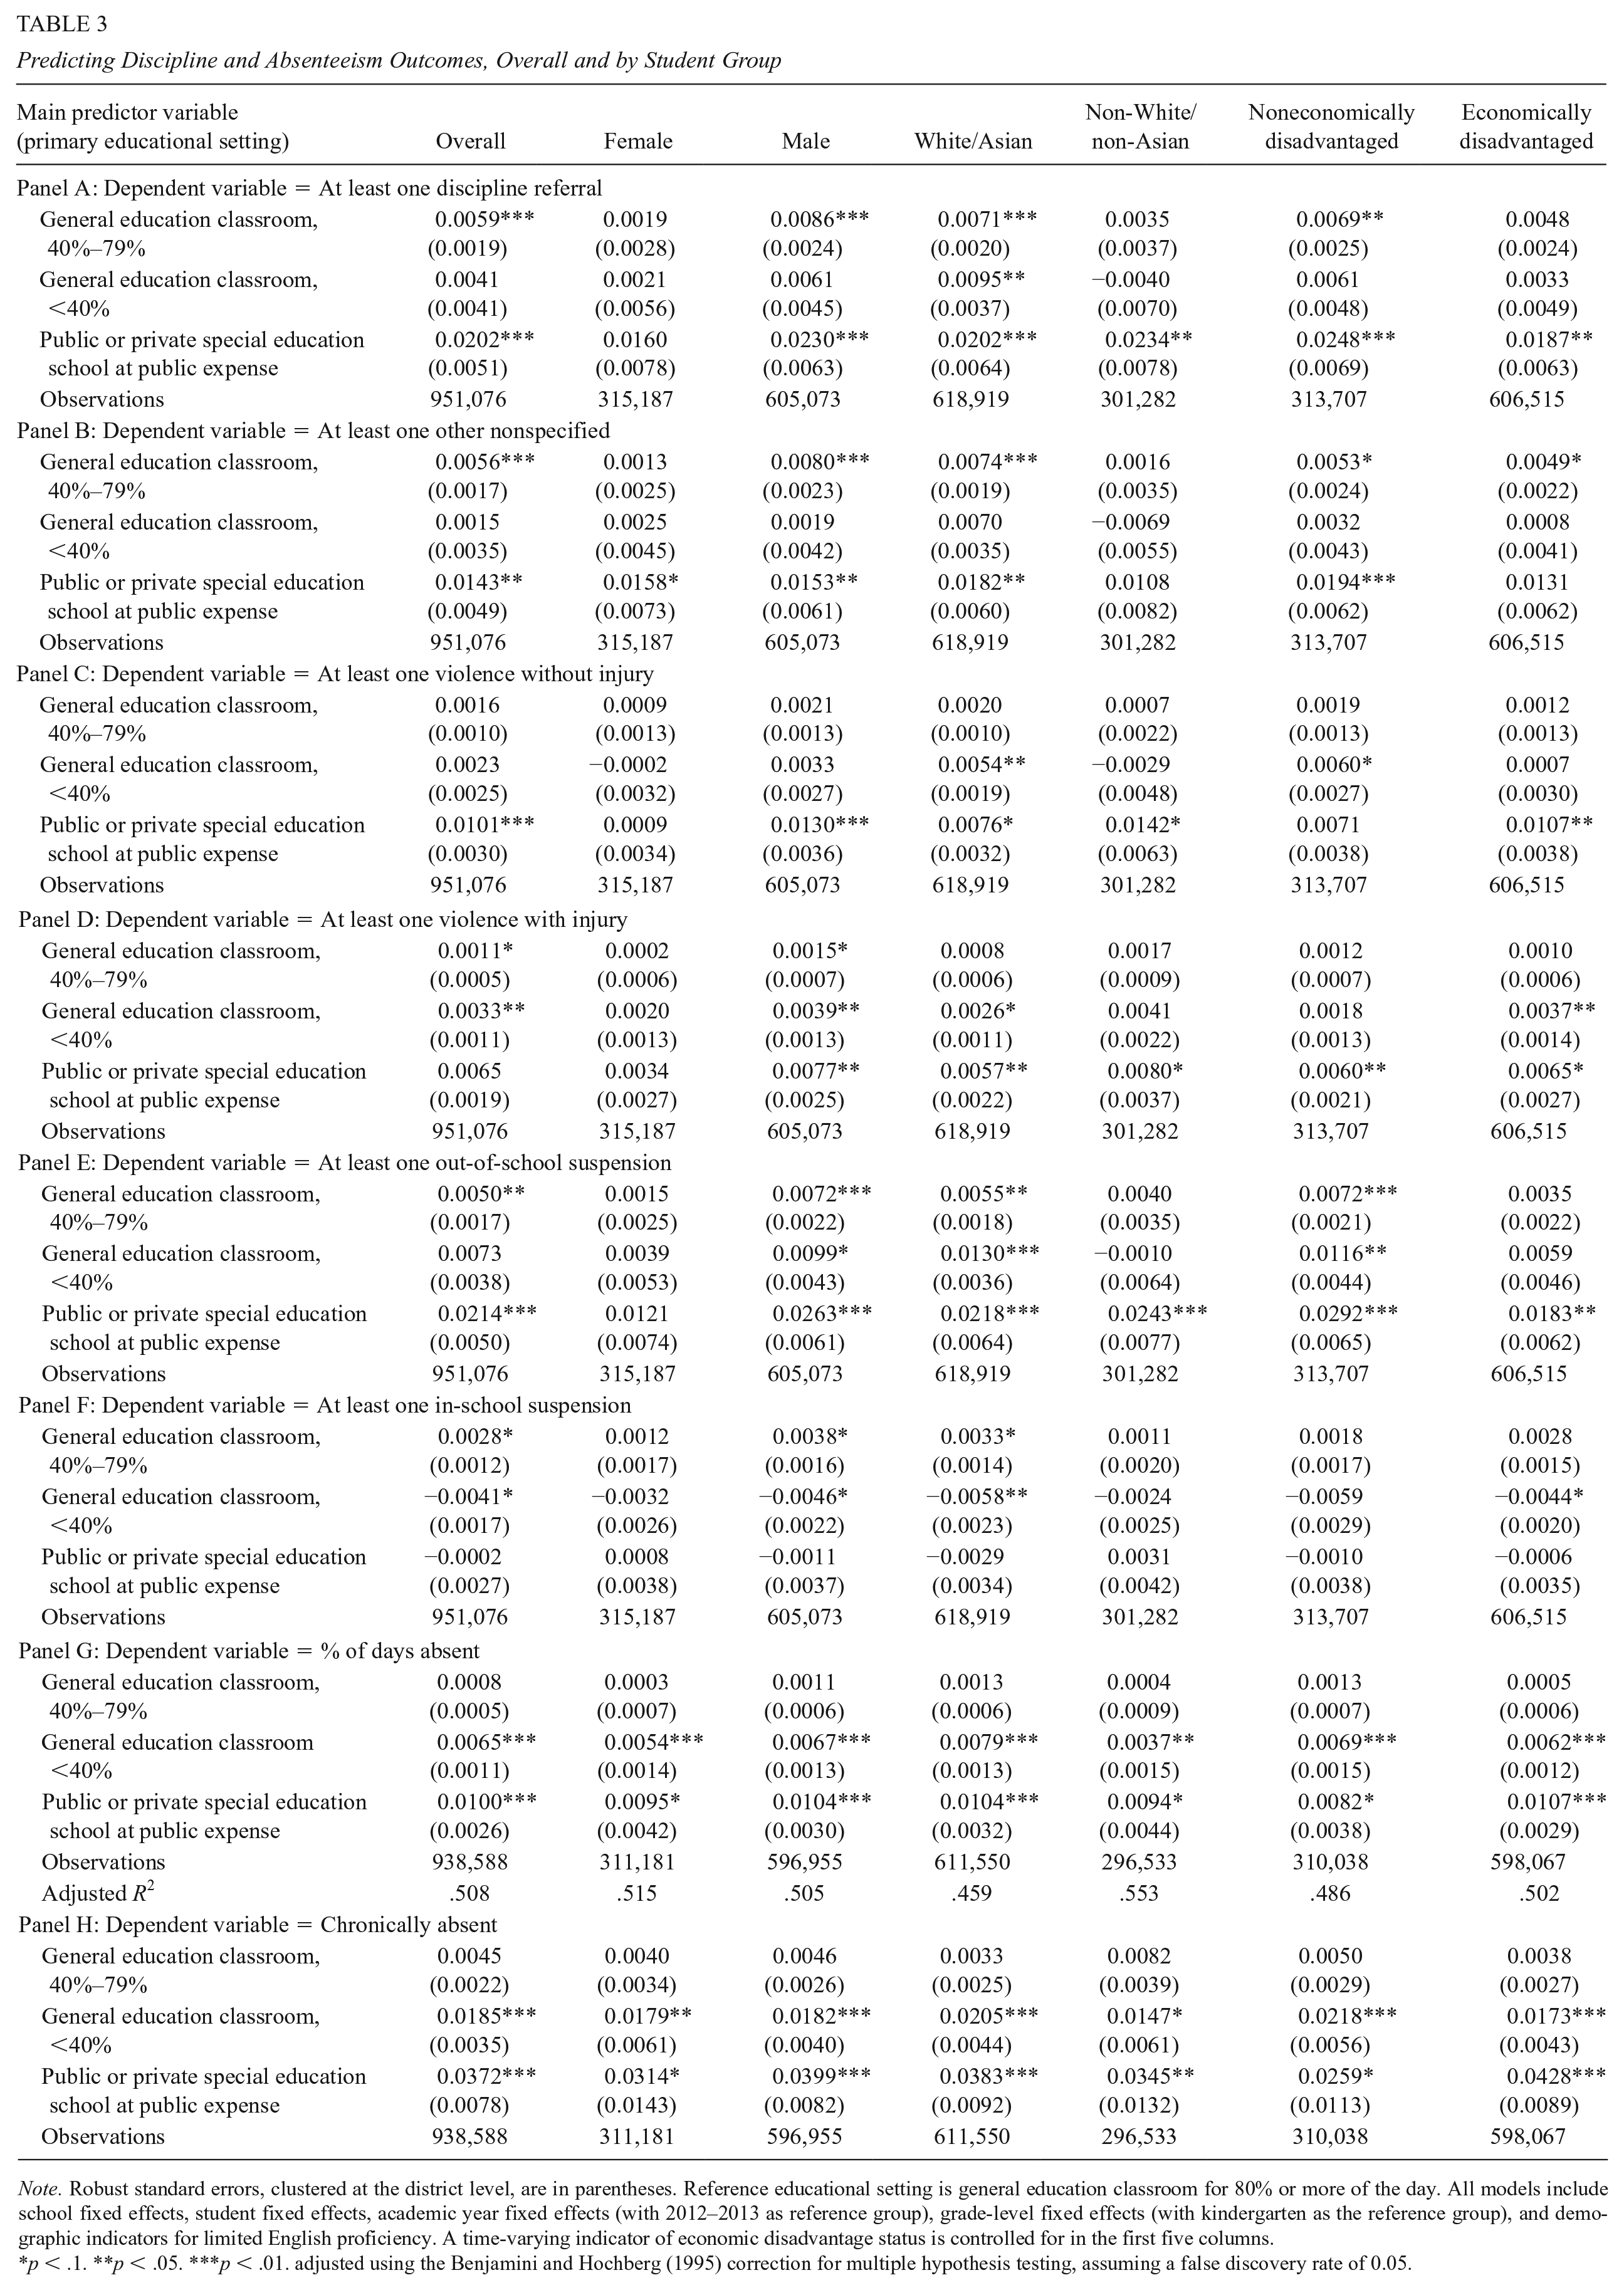
Note. Robust standard errors, clustered at the district level, are in parentheses. Reference educational setting is general education classroom for 80% or more of the day. All models include school fixed effects, student fixed effects, academic year fixed effects (with 2012–2013 as reference group), grade-level fixed effects (with kindergarten as the reference group), and demographic indicators for limited English proficiency. A time-varying indicator of economic disadvantage status is controlled for in the first five columns.
p < .1. **p < .05. ***p < .01. adjusted using the Benjamini and Hochberg (1995) correction for multiple hypothesis testing, assuming a false discovery rate of 0.05.
Panels E and F show the relationship between educational setting and receipt of at least one OSS or at least one ISS. Relative to the most inclusive setting (general education classroom 80% or more of the day), less inclusive settings are often associated with a higher likelihood of receiving OSS, particularly among male students, White or Asian students, and noneconomically disadvantaged students, generally consistent with the findings in Panels A to D.
The ISS results, in Panel F, are mostly only marginally significant, but suggest that students are more likely to receive at least one ISS when in a general education setting 40% to 79% of the time (relative to more time), but are less likely to receive at least one ISS when in a general education setting for less than 40% of the time.
Just as the most inclusive educational setting (general education classroom 80% or more of the day) is shown to be associated with lower likelihood of referral and OSS, placement in this setting is also associated with similar or better attendance outcomes, as indicated by Panels G and H. Specifically, relative to being in a general education classroom 80% or more of the day, being in a general education classroom less than 40%, and being in a public or private special education school at public expense are associated with higher rates of absenteeism. There are no significant differences in attendance for students comparing between 80% or higher and 40% to 79% of their time spent in general education classrooms.
I also assess whether these relationships differ across student disability types, focusing on the three types most commonly represented in the disciplinary data (SLD, emotional impairment, and OHI). Given that a student’s labeled disability type may change over time, I group students into disability types based on the first identified type. The results, in Table 4, indicate that the lower risk of referrals and OSS when in the most inclusive setting (general education 80% or more of the day) is generally only statistically significant for students with emotional impairments, but that a relationship between educational setting and absenteeism also exists for students with SLD and students with OHI. 13
Predicting Discipline and Absenteeism Outcomes by Student Disability Type
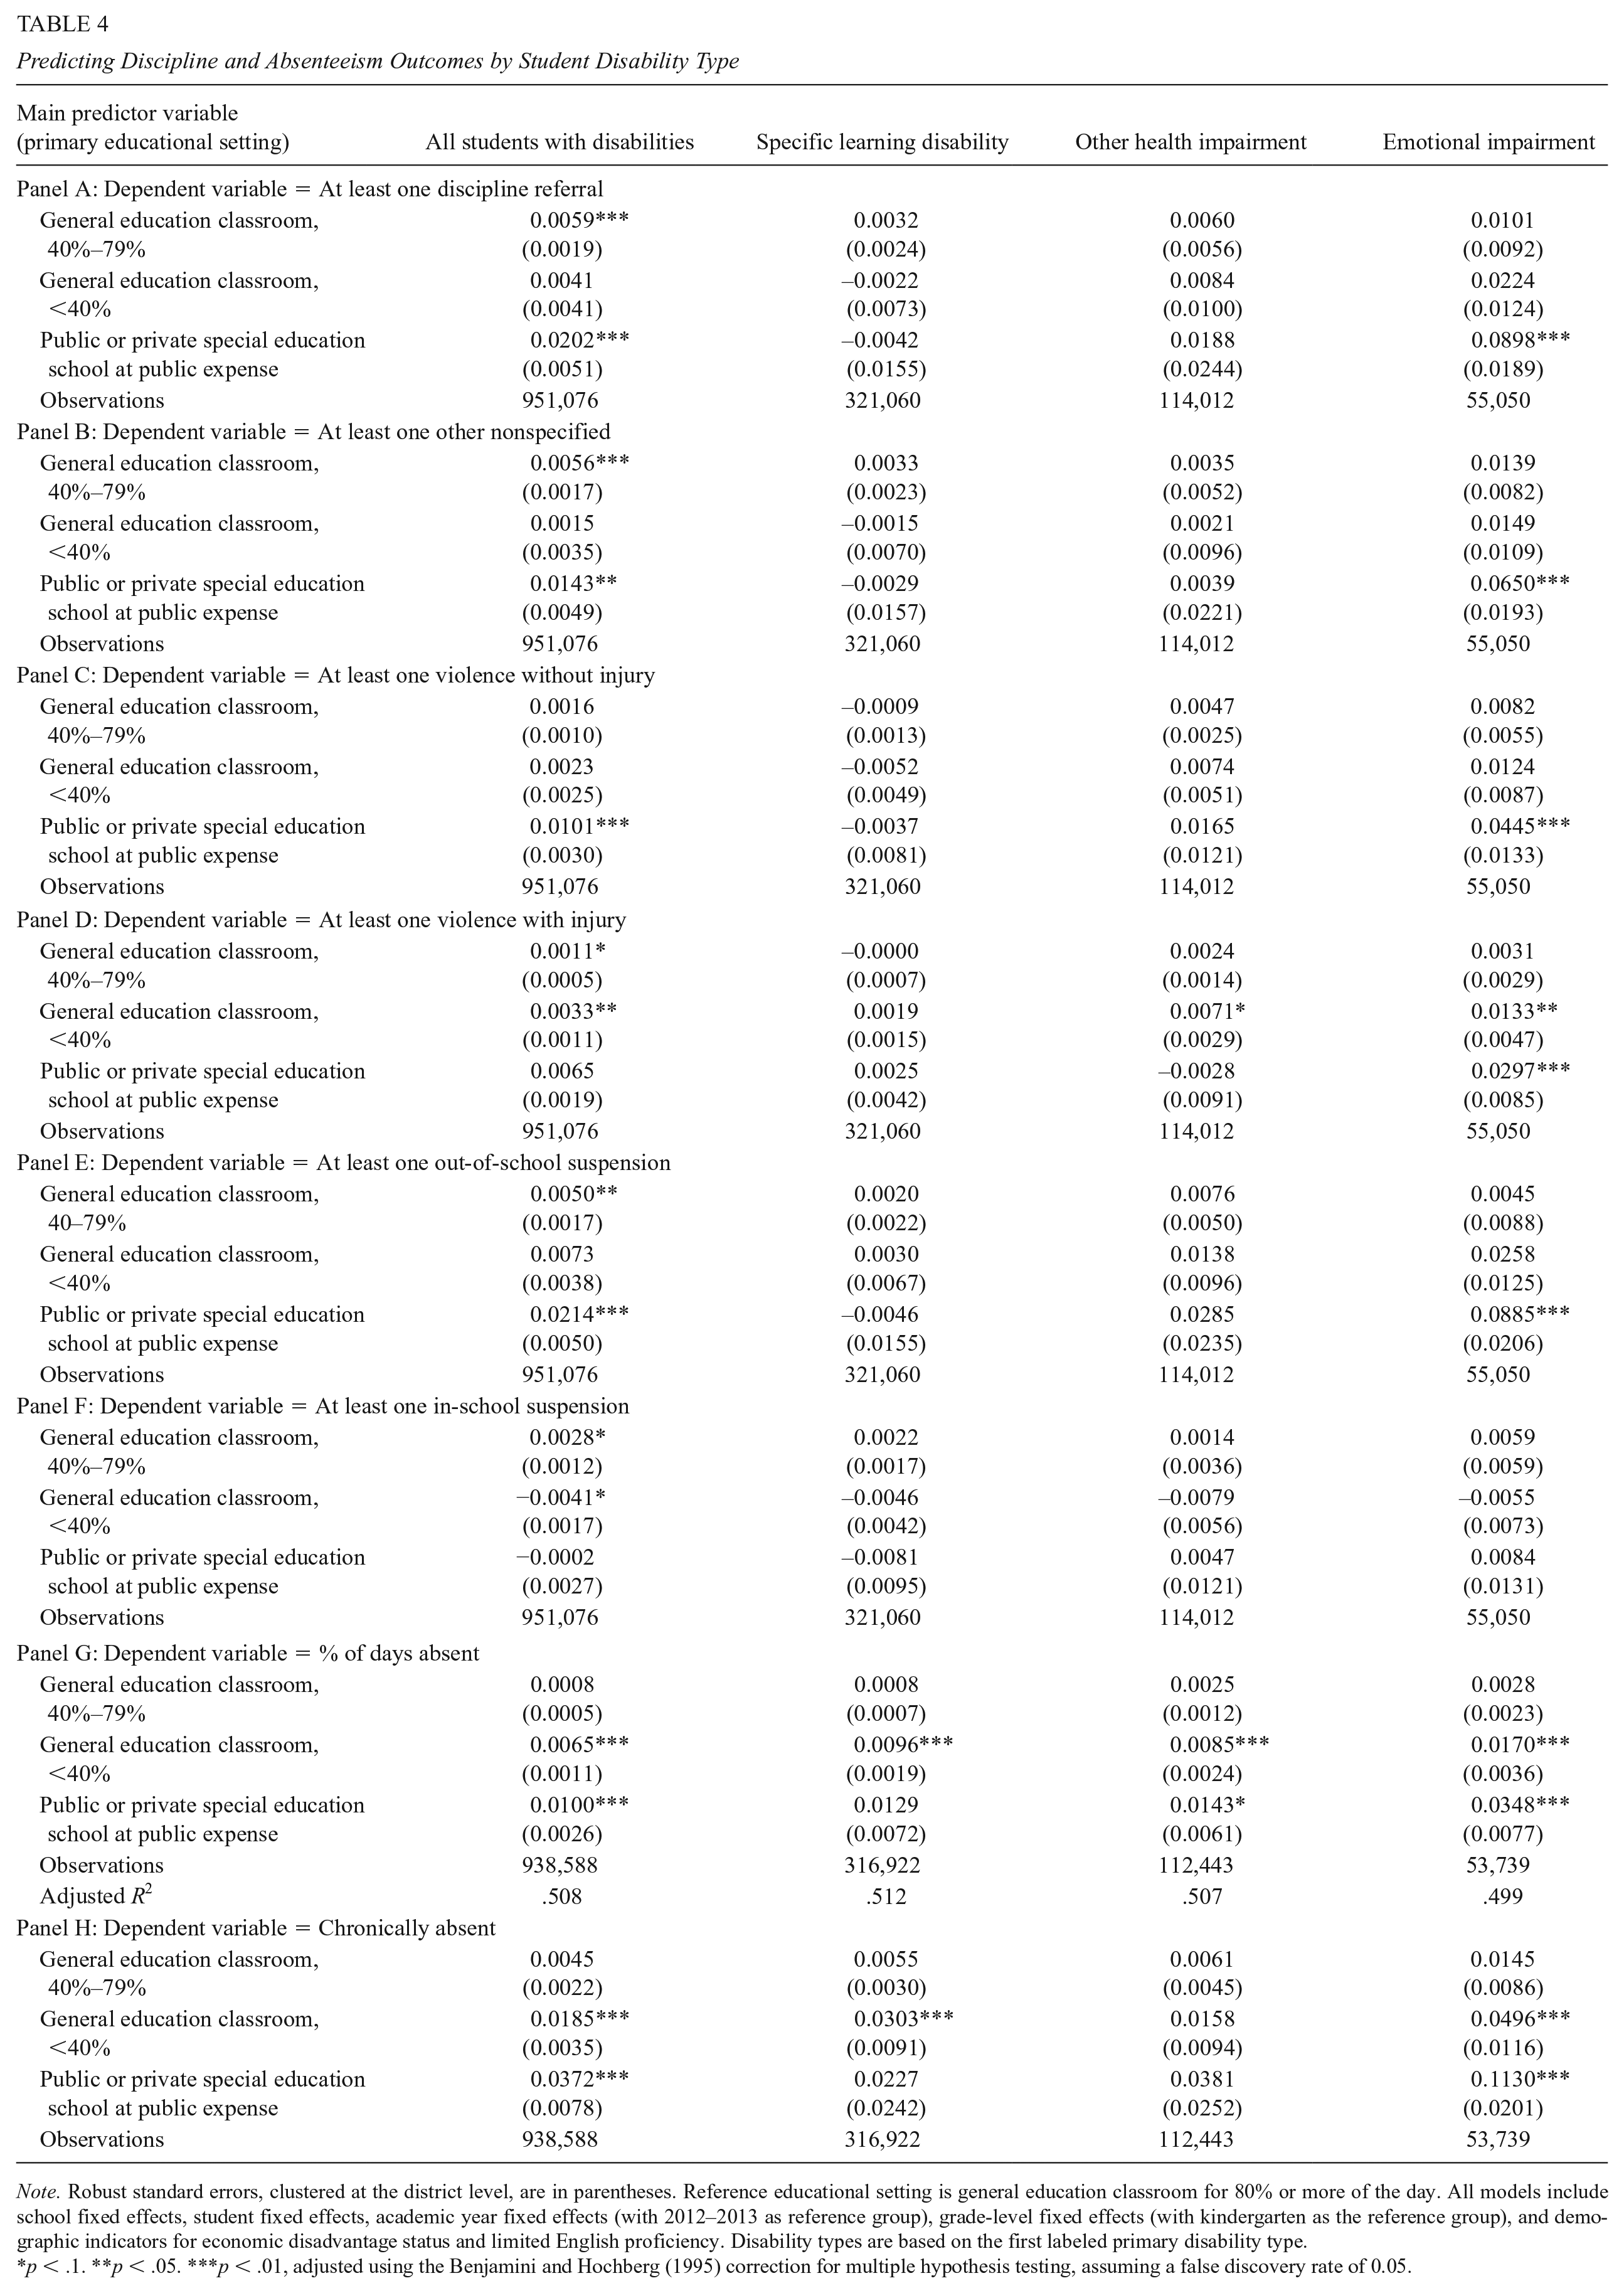
Note. Robust standard errors, clustered at the district level, are in parentheses. Reference educational setting is general education classroom for 80% or more of the day. All models include school fixed effects, student fixed effects, academic year fixed effects (with 2012–2013 as reference group), grade-level fixed effects (with kindergarten as the reference group), and demographic indicators for economic disadvantage status and limited English proficiency. Disability types are based on the first labeled primary disability type.
p < .1. **p < .05. ***p < .01, adjusted using the Benjamini and Hochberg (1995) correction for multiple hypothesis testing, assuming a false discovery rate of 0.05.
Sensitivity Checks
The student fixed effects models identify the relationships between educational setting and student attendance and discipline outcomes using within-student variation in educational setting over time. Given that these transitions can be of different types (either to a more or less inclusive setting), I estimate the same models separately for students exhibiting different transition patterns to test for heterogeneity across these transition types. For example, students who transitioned to a more inclusive setting may have demonstrated positive engagement with school and/or an ability to meet behavioral expectations, leading to a transition. Alternatively, those with more exclusive moves might experience feelings of stigmatization or isolation following these moves, which could trigger behavioral issues. Such hypotheses reiterate that placement decisions are unlikely to be conditionally random, precluding a causal interpretation.
Specifically, I estimate the relationship between educational setting and student outcomes for three groups of students: those whose transitions over the 5-year panel were only to more inclusive settings, those with transitions only to less inclusive settings, and those who experienced a mix of more inclusive and less inclusive moves. This is similar to an approach taken by Hanushek et al. (2002) to identify the effects of special education on student achievement separately for those transitioning into and out of special education. Note that “more” and “less” here refer to the relative degree of inclusion before and after the move, not the absolute level of inclusion. For example, a move from a public/private special education school at public expense to being in a general education classroom less than 40% of the day would represent a move to a more inclusive setting.
Table 5 shows the overall results, plus the results for each student move type. The students who never moved settings (628,924 in the discipline models and 619,380 in the absenteeism models) are excluded from the last three columns. The estimated relationships between educational setting and disciplinary outcomes are generally only statistically significant for the set of students who only had moves to less inclusive settings. When in more inclusive settings, these students were at lower risk of referrals overall, for other nonspecified infractions and for violence with injury infractions, and they were less likely to receive an OSS. The estimated beneficial association between inclusive settings and lower risk of disciplinary outcomes was less consistently found for students with other types of moves (only more inclusive moves or a mix of moves), suggesting, for example, that educators should not necessarily expect a move to a more inclusive setting would result in fewer disciplinary referrals.
Predicting Discipline and Absenteeism Outcomes by Student Move Type

Note. Robust standard errors, clustered at the district level, are in parentheses. All models include school fixed effects, student fixed effects, school year fixed effects (with 2012–2013 as reference group), grade-level fixed effects (with kindergarten as the reference group), limited English proficiency, and economic disadvantage. Disability types are based on the first labeled primary disability type.
p < .1. **p < .05. ***p < .01, adjusted using the Benjamini and Hochberg (1995) correction for multiple hypothesis testing, assuming a false discovery rate of 0.05.
I also test whether the results differ by grade span, estimating the same models separately for students in Grades K–5, 6–8, and 9–12. These models have less statistical power, because the student fixed effect models only identify the relationship of interest for students who change educational setting within the panel, so when splitting the sample in three ways, it limits the number of students contributing to these estimates. The results are in Supplementary Table C in the online version of the journal. Statistically significant relationships between educational setting and disciplinary outcomes are generally only estimated for students in Grades K–5, with some marginally significant relationships for students in Grades 6–8. However, the statistically significant relationships between educational setting and absenteeism tend to be for students in Grades 9–12.
Finally, I conduct additional sensitivity tests, proposed by Altonji et al. (2005) and Oster (2017). Altonji et al.’s (2005) test estimates the degree of selection on observable characteristics and then calculates a ratio indicating how large selection on unobservables would have to be (relative to the selection on observables) to attribute the entire estimated relationship to selection bias. This test (Altonji et al., 2005) makes the assumption that if all unobservables were able to be observed by the researcher, the outcome variable could be fully explained (i.e., a model R2 of 1). This is a strong assumption in the presence of measurement error, so Oster (2017) proposes testing various assumptions about the maximum R2 possible. As a result, I conduct both Altonji et al.’s (2005) and Oster’s (2017) tests, 14 and conclude that I cannot rule out the possibility that significant bias remains in my estimates. In some cases, the results indicate that the amount of selection on unobservable characteristics would only have to be as much as 1% of the degree of selection on observable characteristics to explain all of the estimated “effect.” As a result, a causal interpretation is not supported.
Discussion and Policy Implications
This study assessed the potential influence of educational setting on attendance and behavioral outcomes for SWDs. Although sensitivity checks indicate the findings should not be interpreted as causal, the findings have important implications for special education policy and practice, and in particular, the IDEA requirement to educate SWDs in the LRE. Next, I note a few key takeaways from this work.
First, there is substantial heterogeneity in outcomes within the broader category of SWDs. Disciplinary outcomes and absenteeism differ widely by disability type, for example, and significant relationships between educational setting and important behavioral outcomes were only estimated for certain groups of students. Because students with SLD, OHI, and emotional impairment are at higher risk of exclusionary discipline, and students with emotional impairment are also at high risk for absenteeism, practitioners and policymakers should attend to the particular needs of these groups of students when designing possible interventions.
A second major finding is that even a large-scale statewide study utilizing individual-level panel data to control for time-invariant unobservable characteristics of students has its limitations. The sensitivity checks (Altonji et al., 2005; Oster, 2017) indicate that bias likely still remains in these estimates. While experimental research is likely not legal or ethical in this case, there continues to be a need for large-scale quasi-experimental research on the levers available within special education policy and practice.
Other key findings relate directly to the main results: In general, students have better attendance when in the most inclusive educational settings. In particular, attendance does not differ for students when comparing between 40% to 79% and 80% or more of the day in a general education setting, but students who are in general education classrooms for even less time tend to have worse attendance. This attendance-related finding is more stable across groups of students than the findings related to disciplinary outcomes.
In terms of behavioral outcomes, in general, the results suggest that a higher degree of inclusion is associated with a lower risk of referral and OSS. However, the results for ISS are a bit different. For example, relative to the most inclusive setting (general education 80% or more of the time), students are more likely to receive at least one ISS when in a general education setting 40% to 79% of the time, but are less likely to receive at least one ISS when in a general education setting for less than 40% of the time. This indicates that at least within the two highest levels of inclusion, more inclusion is associated with a lower risk of ISS, but that schools may not view ISS as an appropriate educational setting—even for a short-term disciplinary consequence—for the types of students who are served primarily (60% or more) outside of the general education classroom.
Comparing students with various types of moves, I also find that the estimated relationships between the degree of inclusion and disciplinary outcomes are generally only statistically significant for students who only had moves to settings that were less inclusive than their previous setting. This could indicate a number of things occurred after moving to less inclusive settings: (a) These students had worse behavior, (b) they had similar—or even better—behavior but were more likely to be referred for disciplinary issues, or (c) some combination of worse behavior and higher likelihood of referral. Student behavior might worsen, for example, if a move to a less inclusive setting creates feelings of stigmatization, isolation, or lack of belonging, that in turn lead to lower engagement and misbehavior. Or, students misbehave at similar rates in both settings, but that in a general education classroom, a student may be in a larger class where misbehaviors could go unnoticed and unreported, while in a less inclusive setting, there could be more attention and scrutiny placed on individual students, leading to an increase in referrals. Unfortunately, a key limitation of these data is that I do not have validated observational reports of student behavior and only observe the types of behaviors reported in the disciplinary system, so it is impossible to distinguish whether this higher risk of referral is due to differences in student behavior, differences in teacher/administrator reporting practices, or both. Notably, recent evidence indicates that teachers’ expectations of social readiness for kindergarten are higher for general education teachers serving students with EBD than general education teachers who do not have students with EBD in their classrooms (Gottfried & Ansari, 2019), indicating that teacher expectations may also play a role and are an important area for future study.
In general, these results suggest that moving students from one setting to a more inclusive setting would not necessarily reduce their likelihood of disciplinary referrals, and that, if anything, educators should use caution when considering moving students from one setting to a less inclusive setting. There remains a need to promote inclusive environments that allow truly meaningful social interactions for students. Inclusion requires much more than simply placing a student in a general education classroom, and principals can play an important role in promotion of an inclusive environment within a school (Heflin & Bullock, 1999; MacFarlane & Woolfson, 2013). For example, “teachers are more willing to accommodate students in their classrooms when they perceive that their school administration fosters a supportive climate and when the culture of the school encourages teaming and collaboration” (Soodak et al., 1998, p. 483). In addition, when teachers have preservice or in-service training focused specifically on the needs of SWDs, including behavior management, teachers have higher self-efficacy beliefs about their ability to include SWDs in a general education environment (Brownell & Pajares, 1999), which is important because teachers with more positive attitudes about mainstreaming are more likely to use effective strategies as well (Bender et al., 1995).
In addition, given that relatively advantaged students (White or Asian students and economically advantaged students), as well as males, were the ones experiencing fewer disciplinary issues when in more inclusive settings, there is a need to carefully consider how any potential benefits might be accruing, and how to expand these benefits to relatively underserved populations as well. For example, if some student misbehavior is more likely to go unnoticed in a general education classroom, this raises important concerns about why other groups are still at high risk of disciplinary referrals in the general education classroom. Therefore, further work should seek to understand how other factors—including, perhaps, educator implicit bias—might be influencing these outcomes.
There are some important limitations to note. First, as mentioned previously, only reported behaviors are included. This makes it hard to distinguish between changes in student behavior and changes in policies, structures, or educator behaviors that are associated with risk of disciplinary referrals. Similarly, because reporting of disciplinary incidents was only required for special education students in Michigan during this time period, I am also not able to compare the differences between years in which students are eligible for special education services or not, nor am I able to compare their disciplinary outcomes with those of their general education peers. 2
There are some suggested differences by grade level, but these analyses are limited in terms of statistical power, so I do not draw strong conclusions. For example, the statistically significant differences related to discipline were predominantly for students in Grades K–5, while the differences related to attendance were predominantly for students in Grades 9–12. In addition, some of the coefficients (though not statistically significant) for Grades 6–8 suggest the opposite of our main results, suggesting that the relationship may not hold for that group. These differences across school contexts are relevant for educators making decisions about educational placement and remain an area for future study.
Determining the best environment for a particular student and when to consider changing an IEP or educational setting is a complex decision. While this study informs some aspects of that decision, the overall well-being of a student must be considered. Many in the special education community have noted that true inclusion is more than just educational placement, and that the type and quality of supports are important (e.g., Bricker, 1995; Heflin & Bullock, 1999; Zigmond et al., 2009). Therefore, the inability to fully understand the differences in educational environments is a limitation.
This study also does not speak to the potential impacts of SWDs on their peers in a general education classroom. Some scholars have raised concerns about the lack of available evidence on the peer effects of SWDs in general education (Gilmour, 2018). Some studies have found that students who are exposed to classroom-level peers with emotional disorders have lower academic performance (Fletcher, 2010) and are more likely to be chronically absent (Gottfried et al., 2016). These studies are correlational but suggest that while the LRE requirement focuses on what is appropriate for the particular students’ “unique circumstances” (Endrew F. v. Douglas County School District, 2017), there may be other effects as a result.
Regardless of educational setting, educators may need to make additional efforts to reduce suspensions for SWDs. While students with emotional impairments are understandably at higher risk of behavioral issues in the learning environment, the existence of large gaps in suspensions for these students suggests, as Krezmien et al. (2006) also concluded, that schools need to do more to manage these behaviors and/or take into account a student’s disability when determining the appropriate response to misbehavior. This study, while limited in some ways, is a step in the right direction toward understanding one important lever for policy and practice.
Supplemental Material
Online_appendix_Edited – Supplemental material for The Relationship Between Inclusion, Absenteeism, and Disciplinary Outcomes for Students With Disabilities
Supplemental material, Online_appendix_Edited for The Relationship Between Inclusion, Absenteeism, and Disciplinary Outcomes for Students With Disabilities by Kaitlin P. Anderson in Educational Evaluation and Policy Analysis
Footnotes
Author’s Note
This research result used data structured and maintained by the Michigan Education Research Institute (MERI)–Michigan Education Data Center (MEDC). MEDC data are modified for analysis purposes using rules governed by MEDC and are not identical to those data collected and maintained by the Michigan Department of Education (MDE) and/or Michigan’s Center for Educational Performance and Information (CEPI). Results, information, and opinions solely represent the analysis, information, and opinions of the author(s) and are not endorsed by, or reflect the views or positions of, grantors, MDE and CEPI, or any employee thereof.
Declaration of Conflicting Interests
The author(s) declared no potential conflicts of interest with respect to the research, authorship, and/or publication of this article.
Funding
The author(s) received no financial support for the research, authorship, and/or publication of this article.

Notes
Author
KAITLIN P. ANDERSON is an assistant professor of educational leadership at Lehigh University. Her research interests include issues of equity and opportunity in educational organizations, and, in particular, the implementation and impacts of education policies such as student discipline policy, teacher policies, and school choice.
References
Supplementary Material
Please find the following supplemental material available below.
For Open Access articles published under a Creative Commons License, all supplemental material carries the same license as the article it is associated with.
For non-Open Access articles published, all supplemental material carries a non-exclusive license, and permission requests for re-use of supplemental material or any part of supplemental material shall be sent directly to the copyright owner as specified in the copyright notice associated with the article.
