



Abstract
Income gaps in college enrollment, persistence, and graduation raise concerns for those interested in equal opportunity in higher education. We present findings from a randomly assigned scholarship for low-income students at a medium-sized public 4-year university. The program focused solely on the first four semesters of enrollment and tied aid disbursements to modest academic benchmarks and enhanced academic advising. Meaningful decreases in time to degree appear to be driven by students with the lowest academic preparation and family income. Treated students took out approximately 20% less in student loans during the duration of the program. Participants also indicated high satisfaction with the program’s model of enhanced academic advising.
Keywords
Vision Inspired Scholarship through Academic Achievement (VISTA) was part of the national Performance-Based Scholarship (PBS) Demonstration which used random assignment to measure the effectiveness of incentive-based payments on college achievement in several locations across the United States. More than 12,000 college students in six different states participated in PBS interventions, where scholarships varied in duration, funding amounts, and incentives tied to receiving additional aid. In some cases, programs reduced student loan debt, increased college enrollment, encouraged increased course taking, and resulted in modest improvements in college graduation. 2 This article presents the final follow-up on the New Mexico demonstration, which was implemented by MDRC with primary funding from the Bill and Melinda Gates Foundation. 3
Our analysis builds on earlier work that tracked students 5 years following randomization. The shorter follow-up in earlier work did not allow for a thorough examination of the program’s effect on college graduation and time to degree. Whereas overall graduation rates for the New Mexico cohort examined were 15% within 4 years, 47% within 6 years, and 54% within 8 years, previous work at best provided an incomplete picture of the program’s true graduation effects. 4 We present updated results tracking students 7 years following randomization.
Compared with other PBS demonstrations, the structure of the New Mexico experiment was unique: Of the six experiments, it is the only one conducted exclusively at a 4-year university. Other PBS Demonstrations were conducted at community colleges, except for California, where students were provided scholarships that could be used to attend any accredited 2- or 4-year institution in the state. VISTA tied additional financial aid disbursements to modest academic benchmarks and regular contact with advisers. Recipients were required to maintain a 2.0 GPA (grade point average), only slightly higher than the 1.7 GPA freshmen needed to remain in good standing and the same as the university requirement for students after freshmen year. The program required that students enroll in 15 credit hours after the first semester, 3 hours more than the minimum required to maintain full-time status for federal financial aid. Scholarship recipients received enhanced academic advising in the sense that it was higher frequency, more “holistic” in nature, and administered by dedicated academic advisors, with advising appointments prioritized over non-VISTA students. No other PBS demonstration included an enhanced advising component.
Students randomly assigned to the program were significantly more likely to earn the minimum number of credits required for VISTA eligibility (i.e., 12 credit hours in the first semester, 15 credit hours in the second through fourth semesters) compared with the control group. This led to a modest and imprecisely estimated increase in credit hours by the end of the second, and final, year of the program. The program had significant effects on timely graduation: It boosted the percent of students who graduated in nine semesters by 5.4 percentage points (24%) and the percent of students who graduated in 10 semesters by 5.1 percentage points (15%). These improvements reduced the income gap in graduation and were driven by students in the lower half of the high school grade distribution and students from the lowest income families. In addition to reductions in time to degree, results from a follow-up survey indicated that VISTA students were significantly more satisfied with the advising they received relative to non-VISTA students. Students receiving additional financial aid took out fewer loans but ended up working more hours during college. Importantly, because receipt of the scholarship was conditioned on receiving enhanced academic advising, we are not able to distinguish whether treatment effects were driven by enhanced advising, additional financial aid, or some combination thereof. Results from focus groups and a follow-up survey aid in assessing the effectiveness of enhanced academic advising.
The remainder of the article proceeds as follows: The section “(Quasi-)Experimental Literature on Aid, Advising, and Graduation” discusses the scientific literature on financial aid, academic advising, and college graduation; the “Research Design” section details the research design and data; section “Effects of VISTA on Academic Progress” presents results; the “Exploring Mechanisms for the Program Effect” section summarizes the mechanisms through which VISTA may affect student outcomes; the “Concluding Remarks” section concludes with policy implications.
(Quasi-)Experimental Literature on Aid, Advising, and Graduation
Financial Aid and College Graduation
Until relatively recently, there have been few studies of financial aid and college outcomes beyond enrollment. As Castleman and Long (2016) note, the relatively small number of studies is partially due to the longer follow-up required to track students to completion—often 6 years or longer. Endogeneity is another impediment to estimating the effects of financial aid on college graduation. Students qualifying for merit-based aid may have better academic preparation and thus may be more likely to graduate in the absence of aid, for example. Students qualifying for need-based aid have fewer financial resources and may be more likely to have attended lower quality high schools. Without randomizing financial aid eligibility, it is difficult to distinguish the impact of financial aid on graduation from other (often unobserved) characteristics that influence student success in college, such as soft skills, expectations, social and family support systems, and so on.
Due to a recent shift from need-based to merit-based financial aid in the United States, several studies exploit presumably exogenous variation in financial aid based on state residence. A handful of studies using state-level data have failed to find meaningful population graduation effects of state merit scholarships (Dynarski, 2008; Jia, 2019; Sjoquist & Winters, 2012a, 2012b). In contrast, studies using administrative data at the university- or university-system-levels have found mixed evidence regarding the relationship between state merit-aid and college graduation (Bruce & Carruthers, 2011; Cohodes & Goodman, 2014; Erwin & Binder, 2020; Scott-Clayton, 2011; Scott-Clayton & Zafar, 2019). Evidence from administrative studies suggest that it may only be stronger students who respond to merit requirements. For example, Scott-Clayton (2011) and Scott-Clayton and Zafar (2019) found evidence of reductions in time to degree for students just above an American College Testing (ACT) cutoff for West Virginia’s PROMISE scholarship program, compared with students just below. Using a similar strategy, Bruce and Carruthers (2011) found no program effect for Tennessee’s lottery scholarship. The discrepancy between these two studies may arise from differences in student characteristics. Because of differences in program requirements, all students in the West Virginia sample had high school GPAs of 3.0 or higher and all students in the Tennessee sample had high school GPAs below 3.0. 5 Other studies support the idea that only stronger students may benefit from merit-based aid. For example, Erwin and Binder (2020) estimated the impact of New Mexico’s state merit scholarship on college completion, finding no overall completion effect of the program. Instead, results suggested a divergent effect—Graduation rates increased for students with better academic preparation and decreased for less academically prepared students.
Numerous studies focus on the relationship between financial aid and graduation for low-income students. Studies generally point to positive effects of need-based financial aid on college completion. Large-scale need-based grant appear to increase graduation rates and decrease time to degree (Bettinger et al., 2019; Castleman & Long, 2016; Denning et al., 2019). Other studies find that need-based grants do not have an impact on overall graduate rates but do result in some students graduating faster than they otherwise would (Goldrick-Rab et al., 2016; Mayer et al., 2016). 6 A subset of the literature on need-based financial aid examines changes to aid when students are relatively far along in their college studies (i.e., senior year or later). In this small but growing body of literature, at least one study shows that college seniors graduate earlier when financial aid is increased near the end of their studies (Denning, 2019). Others, however, find that increases in the net price of continuing college beyond “normal time” reduce time to degree (Garibaldi et al., 2012; Mabel, 2020).
Academic Advising and College Graduation
Under VISTA, disbursement of financial aid was contingent upon students meeting with their advisers up to three times per semester. Administrators at the study institution identified academic advising as a key component in getting students on track to graduate. Just before the study, the average graduate at the study institution had accumulated 140 credit hours, 12 more than required for a bachelor’s degree. 7 It was widely perceived that better advising would help students reduce or eliminate inefficient credit hours, thereby reducing time to degree. Another goal of the advising component was to connect students to available on-campus support for nonacademic challenges, including financial setbacks and other emergencies. It was expected that a stronger connection to advisers would improve students’ sense of belonging and increase their affinity for the institution (Akerlof & Kranton, 2002).
Similar to financial aid, the lack of exogenous variation in academic advising poses a challenge for establishing a robust evidence base (Karp, 2011). Students who receive more advising may be systematically different from those who receive little or no advising. Advising services vary with the type and selectivity of the college and are thus likely to be associated with other factors that affect college achievement such as student characteristics and instructional resources. Students who seek out advising are likely to be more committed to completing college and may be more likely to take advantage of other available resources, such as tutoring. It is therefore difficult to separate advising from other services and from individual characteristics. As a result, scientific literature on academic advising is relatively sparse at the college level. There is, however, evidence that pairing additional financial aid with increased academic support can improve grades, student persistence, and degree completion rates (Angrist et al., 2009; Page et al., 2017) and that individualized student coaching for older, nontraditional students increases college persistence and graduation (Bettinger & Baker, 2014).
Most of the literature on academic advising is at the high school level, yet it is worth briefly summarizing here. 8 As VISTA students are young, traditional college entrants, academic advising may help them in ways similar to high school seniors. There is evidence that college counseling in high school has meaningful benefits across several postsecondary outcomes, especially for high achieving, low-income students. Additional access to college counseling has been shown to increase enrollment rates at 4-year universities (Bettinger et al., 2012; Bos et al., 2012; Carrell & Sacerdote, 2013; Horng et al., 2013; Hurwitz & Howell, 2013; Oreopoulos et al., 2017; Seftor et al., 2009; Stephan & Rosenbaum, 2013). Counseling has also been shown to increase financial aid applications, prompt more students to enter college directly after completing high school, and increase the selectivity of schools attended (Avery, 2010, 2013, 2014; Seftor et al., 2009; Sherwin, 2012). Receipt of college counseling appears to increase persistence, especially for low-income and first-generation students (Barr & Castleman, 2017; Castleman & Goodman, 2018). Evidence suggests that “summer melt,” occurring when spring high school graduates get admitted to college but fail to enroll in the fall, may be reduced by providing college counseling over the summer period (Castleman et al., 2014; Castleman & Page, 2014, 2015).
Contribution to the Literature
Our examination of the VISTA experiment is well-positioned to make a significant contribution to the literature. As far as the authors know, it is the first study randomizing aid and enhanced academic advising solely to low-income students at a public 4-year university. Other experimental studies of academic advising and financial aid do not exclusively target this demographic. For example, although other PBS Demonstrations were randomized with eligibility limited to low-income students, they took place at community colleges and were not targeted at freshmen aged 17 to 20. 9 Other studies randomizing additional advising and financial incentives are not directly comparable because they were either not focused on low-income students, not focused on traditional students, or both (Angrist et al., 2009; Bettinger & Baker, 2014). 10
Another distinguishing feature of VISTA is its focus on “enhanced” academic advising. By enhanced we mean that VISTA advising was high frequency (i.e., three visits were required per semester to receive the maximum award); provided by an advisor trained in offering support with academic, financial, and situational challenges that may arise during college; and administered by a dedicated advisor; and VISTA students were given priority in both walk-in sessions and setting appointments online. There are few (quasi-)experimental studies on such models of academic advising (see Page et al., 2017, for one exception).
Research Design
VISTA was implemented at the University of New Mexico (UNM), a medium-sized, 4-year public research university that enrolled more than 18,000 undergraduate and 5,000 graduate students on its main campus during the program period of 2008–2010. 11 Reflecting New Mexico’s demographics, the majority of students belong to minority groups, and the university is a U.S. Department of Education–designated Hispanic-Serving Institution. 12 Generous admissions policies result in very high rates of acceptance and low graduation rates compared with other research universities.
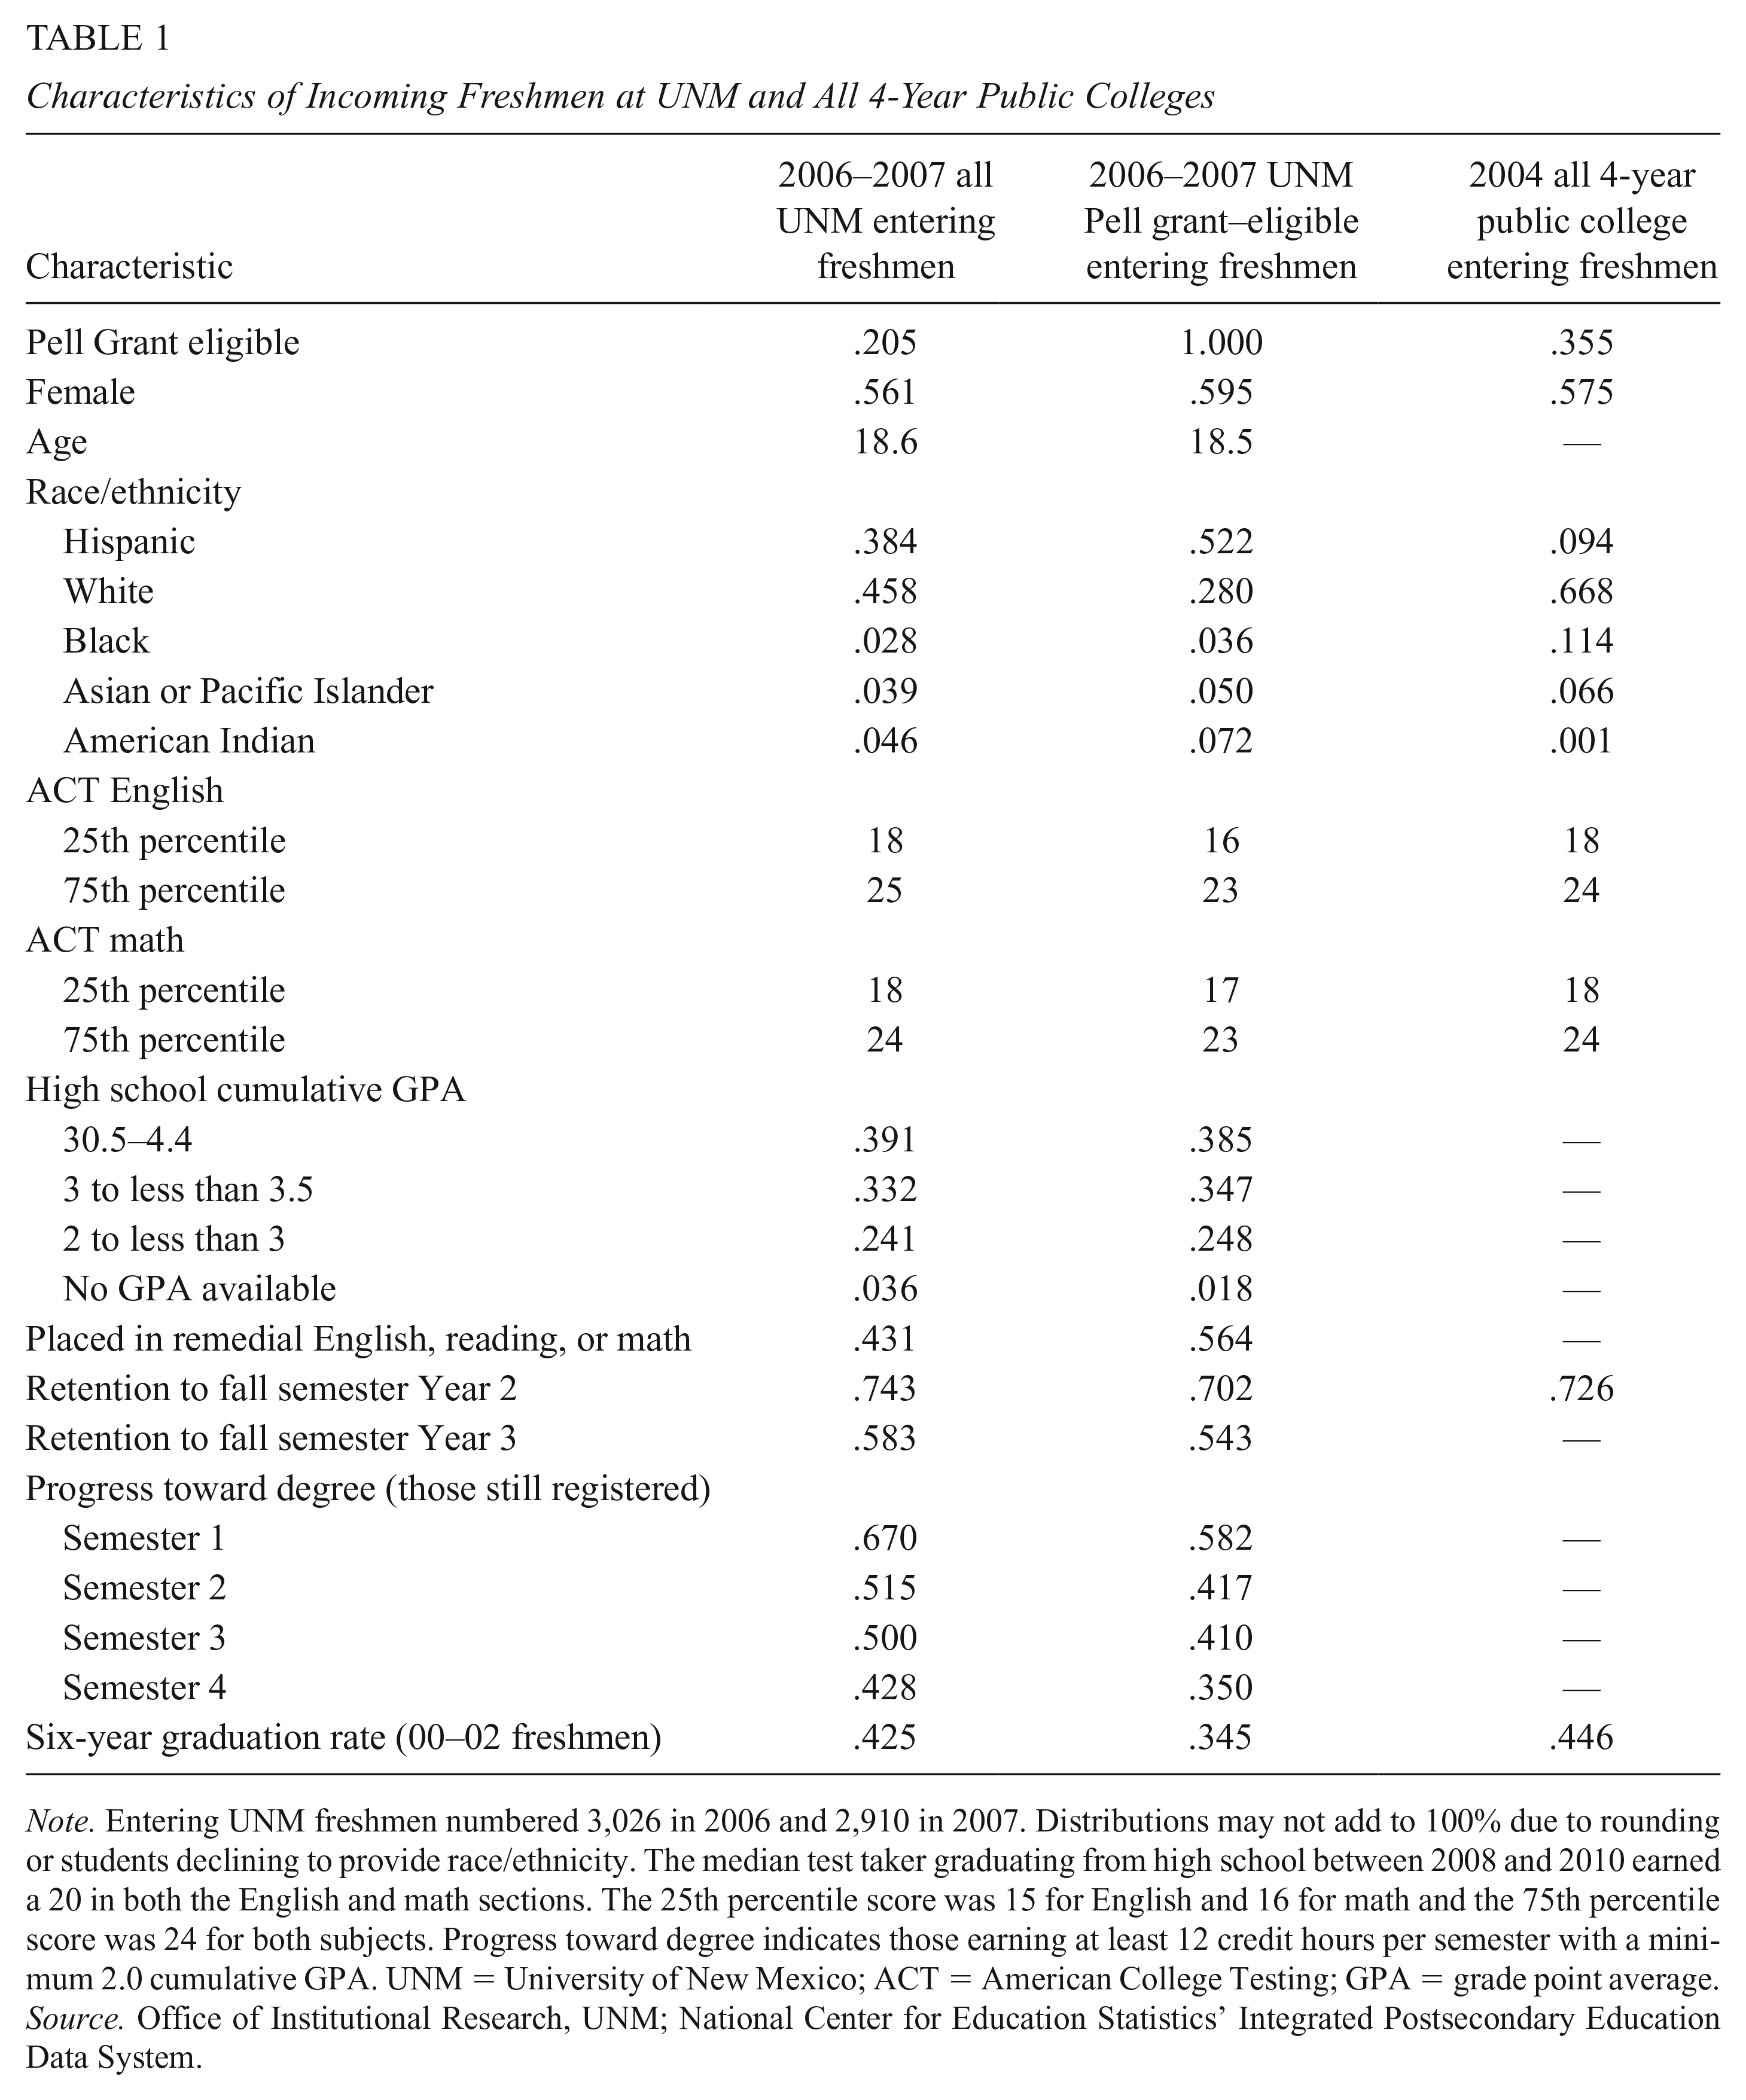
To place UNM in the larger context of higher education in the United States, Table 1 provides a demographic and academic comparison of all first-year students at UNM, those first-year students eligible for a federal need-based Pell Grant at the university, and 4-year public college students nationally just before the study began. The study institution is clearly distinguished by its high enrollment of minority students. Hispanic students constituted 38.4% of entering freshmen, compared with the national average of 9.4% for 4-year colleges. American Indians constituted 4.6% of entering freshmen, compared with 0.1% nationally. Nevertheless, students at the study institution were typical among public college students nationally in terms of ACT scores and second-year retention. Graduation rates at UNM are relatively low, not uncommon for a public institution with generous admissions criteria (Bound et al., 2010).
Characteristics of Incoming Freshmen at UNM and All 4-Year Public Colleges
Note. Entering UNM freshmen numbered 3,026 in 2006 and 2,910 in 2007. Distributions may not add to 100% due to rounding or students declining to provide race/ethnicity. The median test taker graduating from high school between 2008 and 2010 earned a 20 in both the English and math sections. The 25th percentile score was 15 for English and 16 for math and the 75th percentile score was 24 for both subjects. Progress toward degree indicates those earning at least 12 credit hours per semester with a minimum 2.0 cumulative GPA. UNM = University of New Mexico; ACT = American College Testing; GPA = grade point average.
Source. Office of Institutional Research, UNM; National Center for Education Statistics’ Integrated Postsecondary Education Data System.
Pell-eligible students trailed their more affluent peers on all academic measures except high school GPA. For students who remained enrolled, a smaller proportion of Pell-eligible students took enough credit hours to make timely progress toward earning a degree. Pell-eligible students trailed all students on this measure by eight to nine percentage points in the first four semesters. Not surprisingly, the 6-year graduation rate for Pell-eligible students was eight percentage points lower than the graduation rate for all students.
The VISTA scholarship program aimed to address lagging college outcomes and substantial unmet need for low-income students by providing up to US$1,000 in additional financial aid in each of the first four semesters, in increments tied to academic milestones and with payments made directly to students. Financial aid disbursed through VISTA was neither first- nor last-dollar and did not consider the student’s unmet need. The 2-year term of the program was designed to stave off the high rate of attrition between the first and second years of college and to help students accumulate enough credits early on to enable them to earn a degree in a timely fashion. Students received US$250 for registering for 12 or more credit hours in the first semester and for 15 or more credit hours in the second through fourth semesters; US$250 for earning a 2.0 or higher GPA at midterm; and US$500 for completing the required hours with a 2.0 or higher GPA. A student received the registration and midterm payments only after meeting with a dedicated academic adviser who confirmed the student had met the milestones. VISTA students could thus receive up to US$1,000 per term if they met all of the program benchmarks.
These requirements were only slightly more stringent than those for the Pell Grant. At the time of the program, the university defined satisfactory academic progress as a 1.7 GPA for the first 30 credit hours earned, and a 2.0 GPA thereafter. Moreover, full-time status for federal financial aid purposes required only 12 credit hours per semester. Yet a student who registered for 12 credit hours per semester needed 11 semesters (5½ years) to earn the 128 credit hours required for graduation. 13 VISTA thus rewarded students for making timely progress toward graduation. Students who accumulated 12 credit hours in the first semester and 15 credit hours in each additional semester could graduate in nine semesters (4½ years). The payment schedule and the fact that payment was contingent on meeting with an adviser encouraged students to stay on track during the semester and interact with their academic advisers.
As mentioned before, advising services offered to VISTA students differed from those offered to the general student population (including the control group) in three ways. First, VISTA students were assigned to one adviser for the duration of the program. Control group and other students could request to see a particular adviser, but during the study period, they typically saw whoever was first available. According to UNM officials, this was the norm for freshmen advisement for large public colleges at the time. Although VISTA advisers did not have smaller caseloads per se (as no adviser had any particular caseload), VISTA students were given priority to see their assigned advisers when they came into the advising office and when making appointments online. As walk-ins, they were put to the front of the line. Online, there were specific time blocks they had priority in reserving in advance. As a result, advisers were much more likely to get to know their VISTA advisees as they saw them consistently and more frequently. Note that there was very little turnover in trained VISTA advisors over the duration of the program: One advisor left the university shortly after the program’s inception, and this individual’s students were assigned to the remaining VISTA advisors. Second, advisers got to know the VISTA students better, and they were trained to provide holistic advising, which involves learning about—and potentially providing referrals for—nonacademic aspects of a student’s life, such as health, work, and family issues. 14 Third, VISTA students were encouraged (indeed, given incentive) to meet with their advisers three times during the semester: at registration, midterm, and at the end of each term to register for the next semester. Control group and other students typically only met with an adviser at the end of the semester to register for the next semester. Toward the end of each semester, advisers see literally hundreds of students, and thus advising sessions are necessarily shortened and are much less likely to include any holistic components.
The VISTA program was explicitly designed to benefit students who fell below the 2.5 GPA required for the state’s lottery-funded scholarship. However, VISTA also provided incentives for students who had a rough start in college to keep trying, providing them payments in any of the four semesters that they met the requirements. To illustrate, a VISTA student who failed to meet eligibility requirements in the first two semesters of college could still earn the full US$1,000 in aid during both Semesters 3 and 4. This structure contrasts with the more stringent rules of state lottery-funded scholarships, which once lost cannot be regained.
Random assignment of 1,081 eligible students took place at the first-year student orientation sessions for incoming freshmen in 2008 and 2009. All entering students attend these 2-day sessions, which take place weekly over the summer. Students were eligible for the study if they were state residents, had completed the Free Application for Federal Student Aid (FAFSA), and were eligible for a Pell Grant. 15 A financial aid officer identified these students and sent them letters before their scheduled orientation session. They attended a separate VISTA scholarship session during their orientation. In the VISTA session, students learned about the study, signed an informed consent form if they were willing to participate, and filled out a baseline survey. Once the surveys were completed and submitted, students were randomly assigned to either research group based on a computer algorithm. The treatment and control groups consisted of 536 and 545 students, respectively.
Our analysis relies primarily on two sources of data: (a) the baseline survey, which included student-provided information on parental education, employment status, marital status, primary language spoken in the home, and (b) registration and financial aid data from the institution’s administrative records. We also examined data from an Internet survey of the second study cohort (those who entered college in 2009), fielded in the spring of the cohort’s first academic year. The survey asked about student experiences in the first semester of college, including participation in extracurricular activities, employment, study habits, and academic advising. Of the 594 students invited to participate in the survey, 388 responded, for a response rate of 65%. Because of the potential for sample nonresponse bias, data should be interpreted cautiously.
Finally, we make use of a qualitative evaluation of program implementation, which included interviews with VISTA program coordinators and academic advisers and data from three focus group interviews with 19 students in the VISTA group and 12 students in the control group. Interviews with program coordinators and advisers indicated that key components of VISTA were implemented successfully—in particular, recruiting and signing up eligible students for the program, deploying academic advisers to regularly communicate with their assigned VISTA advisees, and distributing scholarship payments to students who met program milestones. Once VISTA program coordinators enrolled eligible students in the program, advisers reached out to their advisees multiple times via email, phone, or social media sites to remind them of their upcoming milestone deadlines and to schedule their required advising appointments.
Table 2 presents data for each research group, drawn from the baseline survey and administrative records. Just over 60% of the sample was female, which reflects the Pell-eligible population in general at the university. As the program targeted first-time entering freshmen, nearly all of the students were 17 to 18 years of age. About 60% of the students were Hispanic and 7% of the students identified as American Indian. Average parental income was below US$30,000. In terms of academic performance, the students appeared to be relatively well prepared. Nearly 40% had a high school GPA of 3.5 or higher and the average ACT score was 21, which matches the average among all test takers nationally. 16 About a third of the students reported that they were the first in their family to attend college. Finally, about half of the students were working at the time they entered the study.
Baseline Characteristics of VISTA Recipients and Nonrecipients

Note. The p value from a regression of research status on baseline characteristics was .185. Two-tailed t tests indicated no significant differences between treatment and control means at the 5% level. Distributions may not add up to 100% due to rounding. ACT outcomes reflect percentile scores—t tests of significant differences are not conducted using these figures. VISTA = Vision Inspired Scholarship through Academic Achievement; ACT = American College Testing; GPA = grade point average; GED = general educational development; UNM = University of New Mexico; FAFSA = Free Application for Federal Student Aid.
Source. Data from MDRC calculations using the Baseline Information Form, UNM placement test and high school transcripts, and FAFSA filings.
The two research groups could not be distinguished by any of the 23 characteristics that were subjected to statistical testing. 17 Taken as a whole, the characteristics listed in Table 2 do not jointly predict assignment to the VISTA group, suggesting that a simple comparison of means provides a valid estimate of the program’s effect. Nevertheless, to improve the precision of estimated average treatment effects, we include covariates in ordinary least squares and linear probability models of the form:

where yi is a registration, grade, or degree attainment outcome, and
Because we test for many hypotheses, we are concerned that multiple testing may result in an unacceptably large number of false positives (i.e., rejections of null hypotheses that are false). Thus, in addition to commonly accepted levels of statistical significance, we report significance levels using a false discovery rate procedure controlling for the expected proportion of Type I errors following Benjamini and Hochberg (1995). Similar hypotheses are grouped together. As an example, Table 3 tests for enrollment effects after each of the 7 years of follow-up, so N = 7 in our procedure to adjust p values for multiple testing.
Effects of VISTA on Enrollment

Note. ATEs are the covariate-adjusted difference between treatment and control groups. A two-tailed t test was applied to differences between the research groups. ATEs are estimated using regression models controlling for gender, race/ethnicity, parents’ education, current employment status, language spoken at home, high school GPA, ACT composite score, and family income. Standard errors (SE) are shown in parentheses. VISTA = Vision Inspired Scholarship through Academic Achievement; ATE = average treatment effect; UNM = University of New Mexico; ACT = American College Testing; GPA = grade point average.
Source. UNM Office of Institutional Research.
Effects of VISTA on Academic Progress
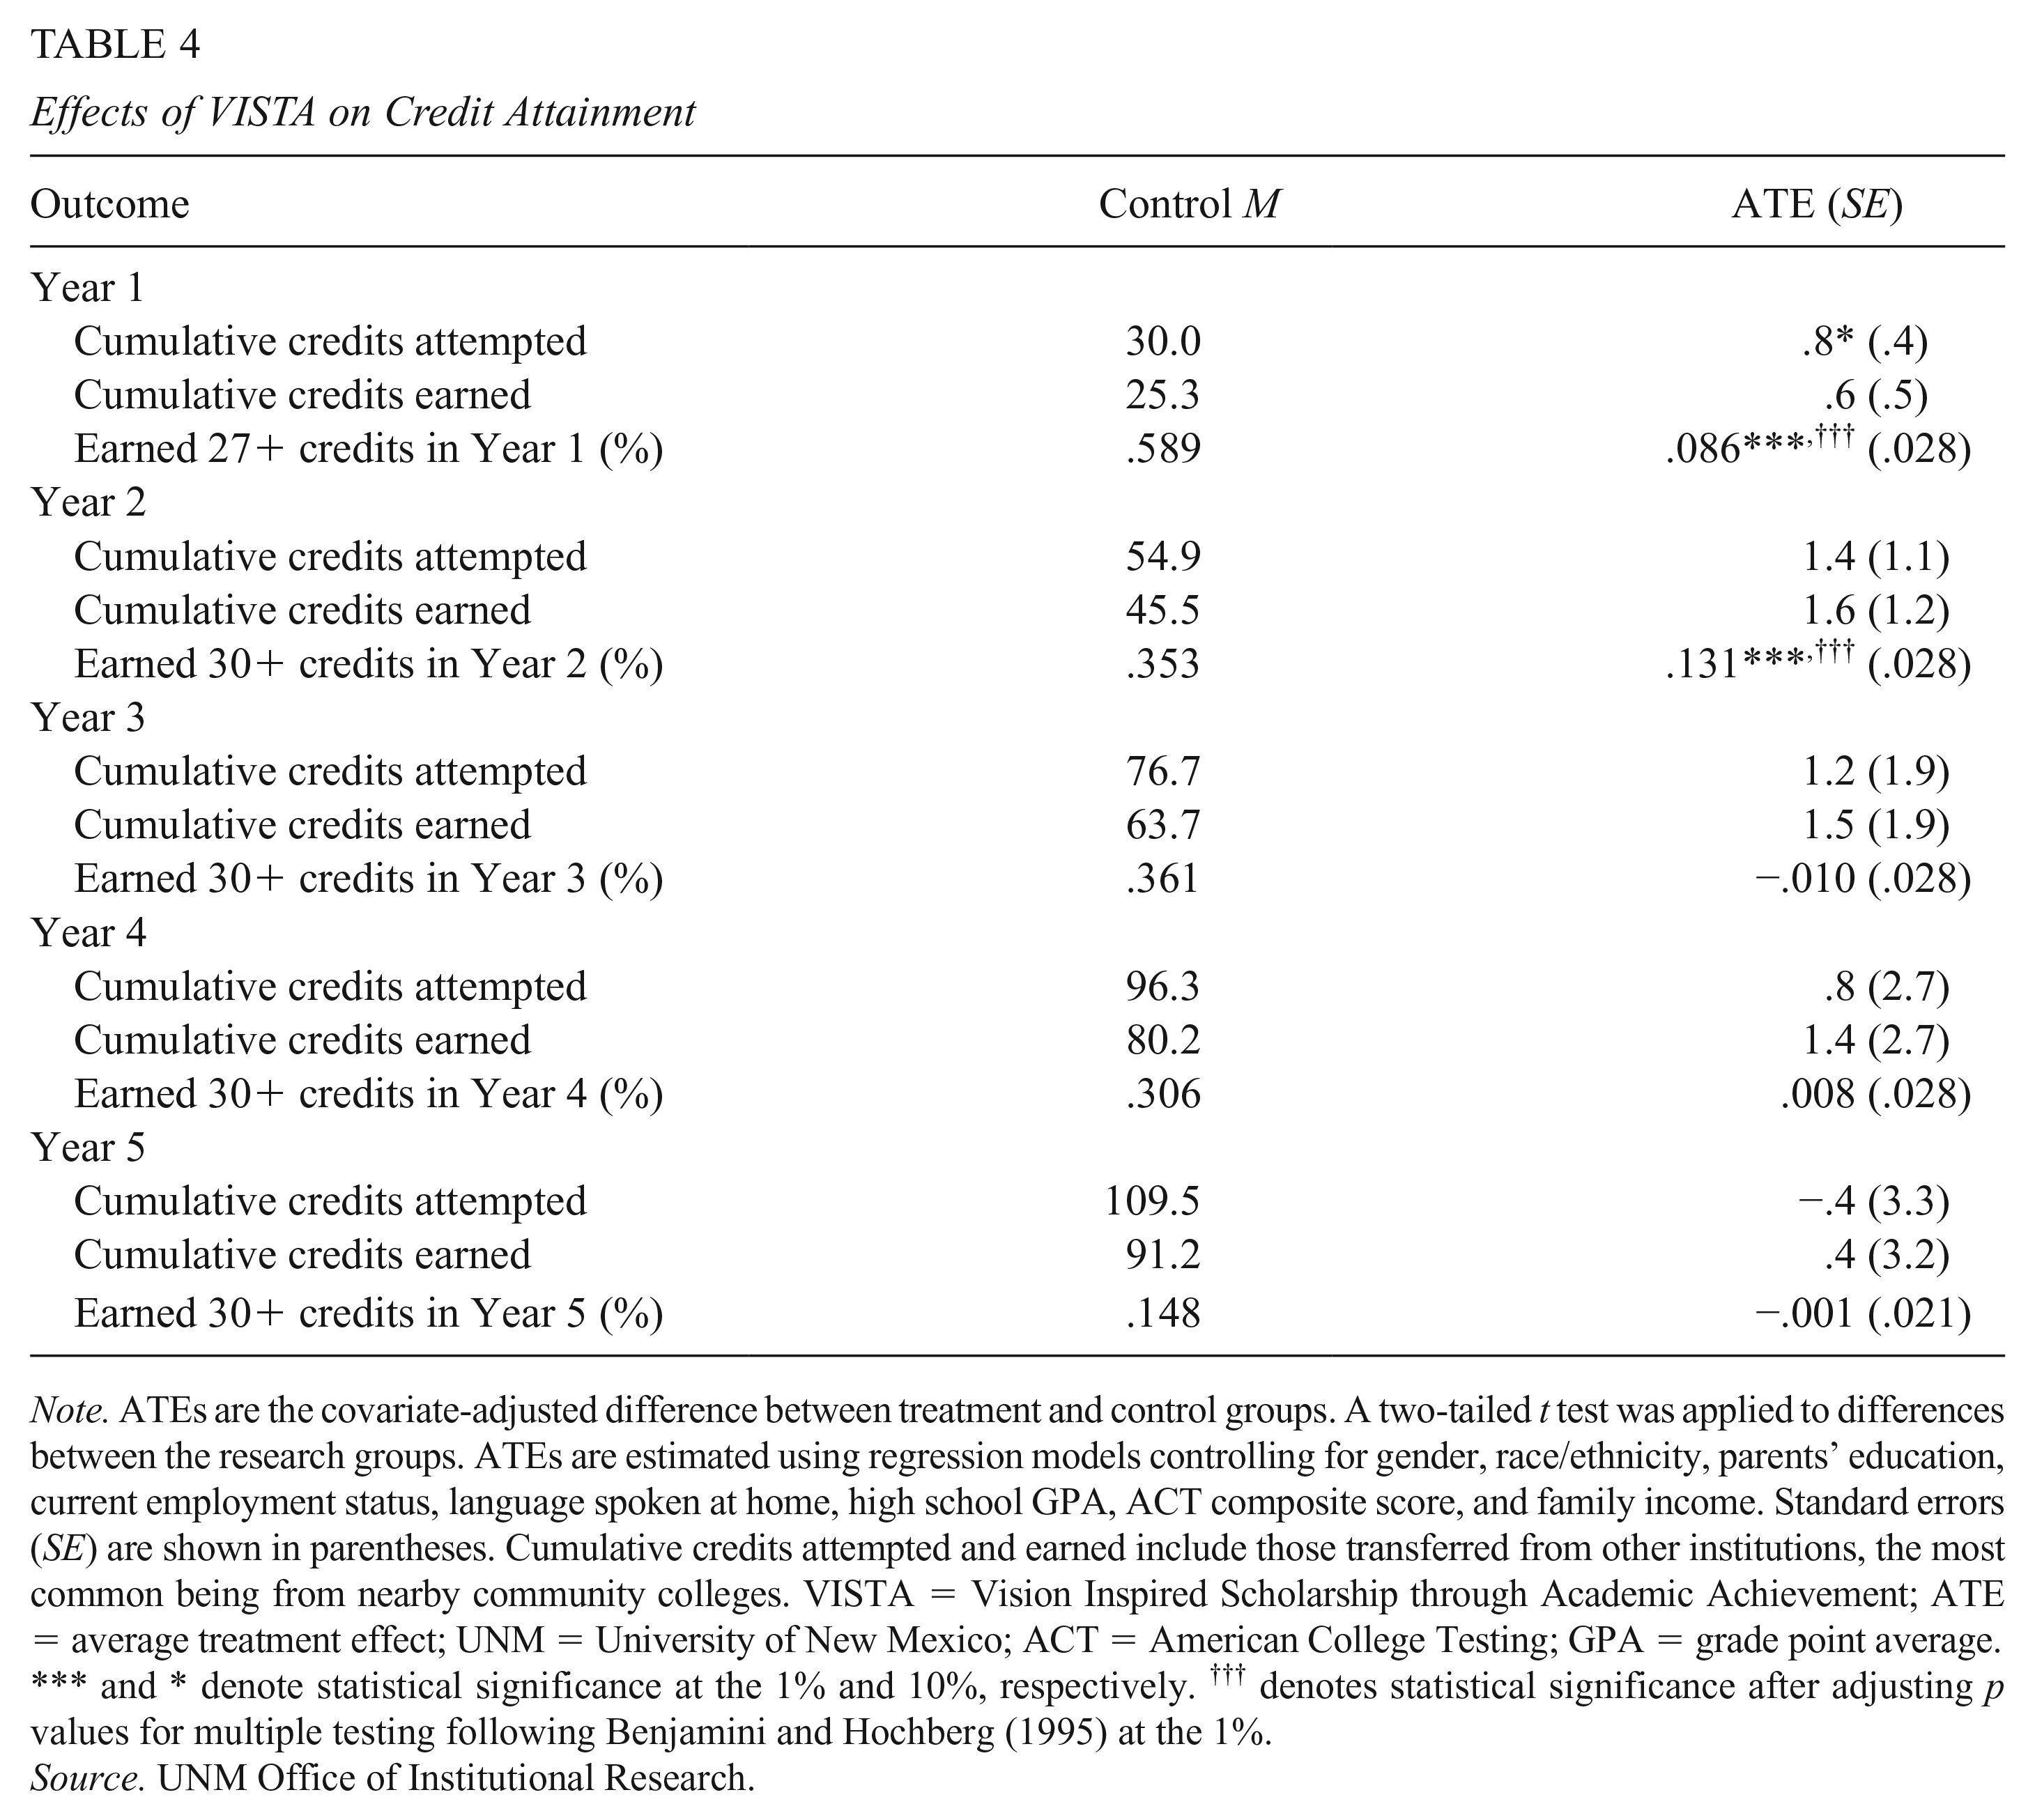
Table 3 through Table 5 present the effects of VISTA on academic progress. Table 3 shows that the program did not improve enrollment retention in the first 5 years after study entry. 19 Note that point estimates are consistently negative, which may indicate that the more stringent rules of VISTA may have induced some students to drop out. If so, it is likely on a small scale as evidenced by imprecisely estimated treatment effects. Table 4 presents estimates on course-taking behavior. The program created large differences in the likelihood of earning the minimum number of credits required to earn the full VISTA award measure in the first and second year. VISTA students were nine percentage points (15%) more likely to earn at least 27 credits in the first year, and 13 percentage points (37%) more likely to earn at least 30 credits in the second year. We interpret this as evidence that VISTA students responded to financial incentives by taking larger credit loads in the first 2 years. This information is visually displayed in Figure 1. Despite this, VISTA students exhibited no meaningful increase in overall credits earned in either the first or second year of the program compared with non-VISTA students. Figure 2 shows that VISTA students earned higher average credits per semester than non-VISTA students over the length of the program, although differences are not significantly different from zero. The expectation that students would be more likely to continue to carry a 15 credit hour load after the conclusion of the program was not realized. As shown in Table 4, VISTA students were no more likely than control group students to earn 15 credit hours or more in subsequent years. The change in the distribution of credit hours resulted in a small (and only marginally significant) effect on credits attempted. In the first year, VISTA students attempted 0.8 more credit hours than control group students. Despite their heavier course load, VISTA students had the same pass rate and GPA distribution as control group students (not shown), suggesting that the increase in credit hours earned was due largely to an increase in credit hours attempted. Nonetheless, focus group data suggest that taking additional credit hours was a burden for students. Some students who participated in the focus groups said that it was difficult managing the time needed to meet the 15 credit hour requirement in the second semester. This extra work led to additional pressure and stress, particularly for students who had jobs. The VISTA advisers corroborated the students’ sentiments about transitioning from 12 to 15 credit hours; according to one adviser, adding an additional class to an already busy schedule—that for many included work—was a serious challenge.
Effects of VISTA on Credit Attainment
Note. ATEs are the covariate-adjusted difference between treatment and control groups. A two-tailed t test was applied to differences between the research groups. ATEs are estimated using regression models controlling for gender, race/ethnicity, parents’ education, current employment status, language spoken at home, high school GPA, ACT composite score, and family income. Standard errors (SE) are shown in parentheses. Cumulative credits attempted and earned include those transferred from other institutions, the most common being from nearby community colleges. VISTA = Vision Inspired Scholarship through Academic Achievement; ATE = average treatment effect; UNM = University of New Mexico; ACT = American College Testing; GPA = grade point average.
and * denote statistical significance at the 1% and 10%, respectively. ††† denotes statistical significance after adjusting p values for multiple testing following Benjamini and Hochberg (1995) at the 1%.
Source. UNM Office of Institutional Research.
Effects of VISTA on Degree Attainment
Note. ATEs are the covariate-adjusted difference between treatment and control groups. A two-tailed t test was applied to differences between the research groups. ATEs are estimated using regression models controlling for gender, race/ethnicity, parents’ education, current employment status, language spoken at home, high school GPA, ACT composite score, and family income. Standard errors (SE) are shown in parentheses. VISTA = Vision Inspired Scholarship through Academic Achievement; ATE = average treatment effect; UNM = University of New Mexico; GPA = grade point average; ACT = American College Testing.
and * denote statistical significance at the 5% and 10%, respectively.
Source. UNM Office of Institutional Research.

Proportion of enrollees attempting 15 or more credits, by semester and treatment status.
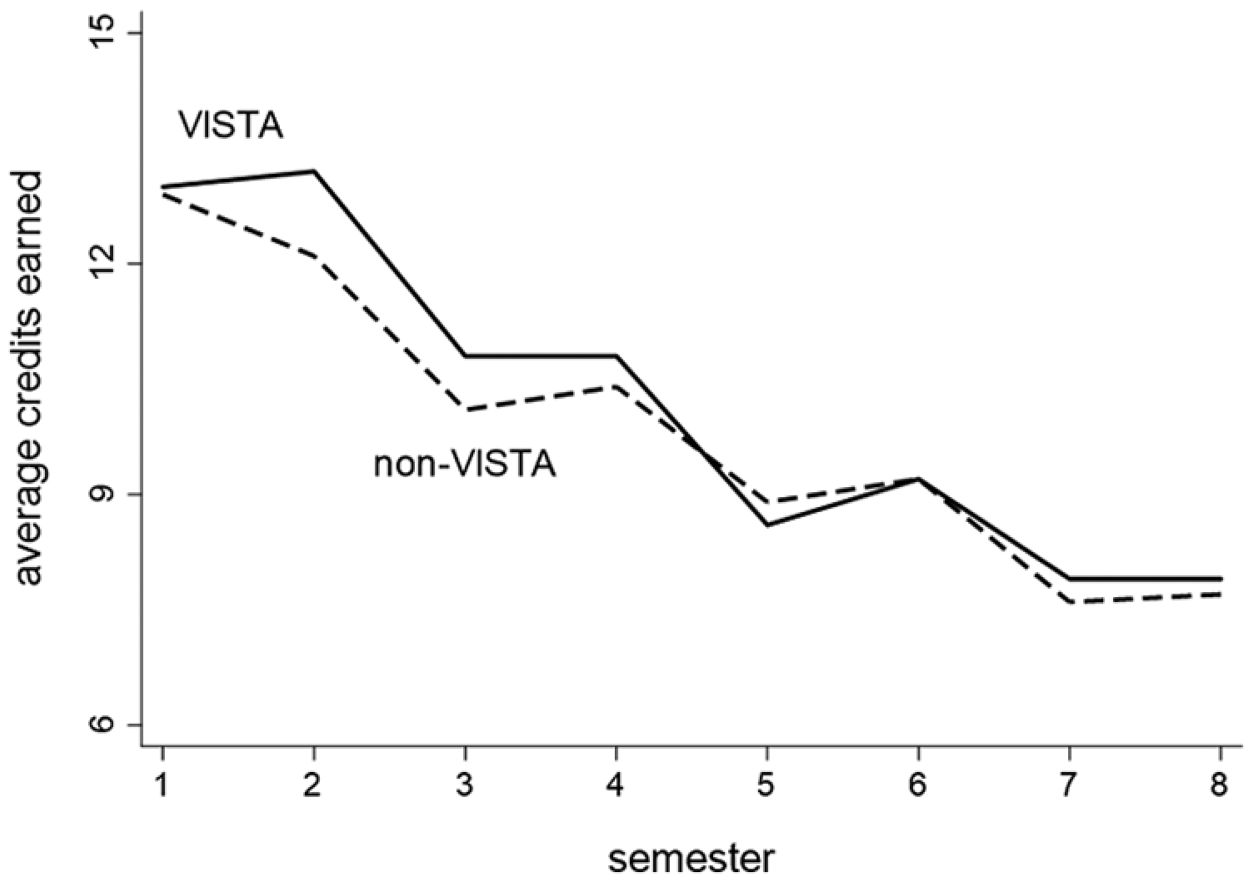
Average credits earned by semester and treatment status.
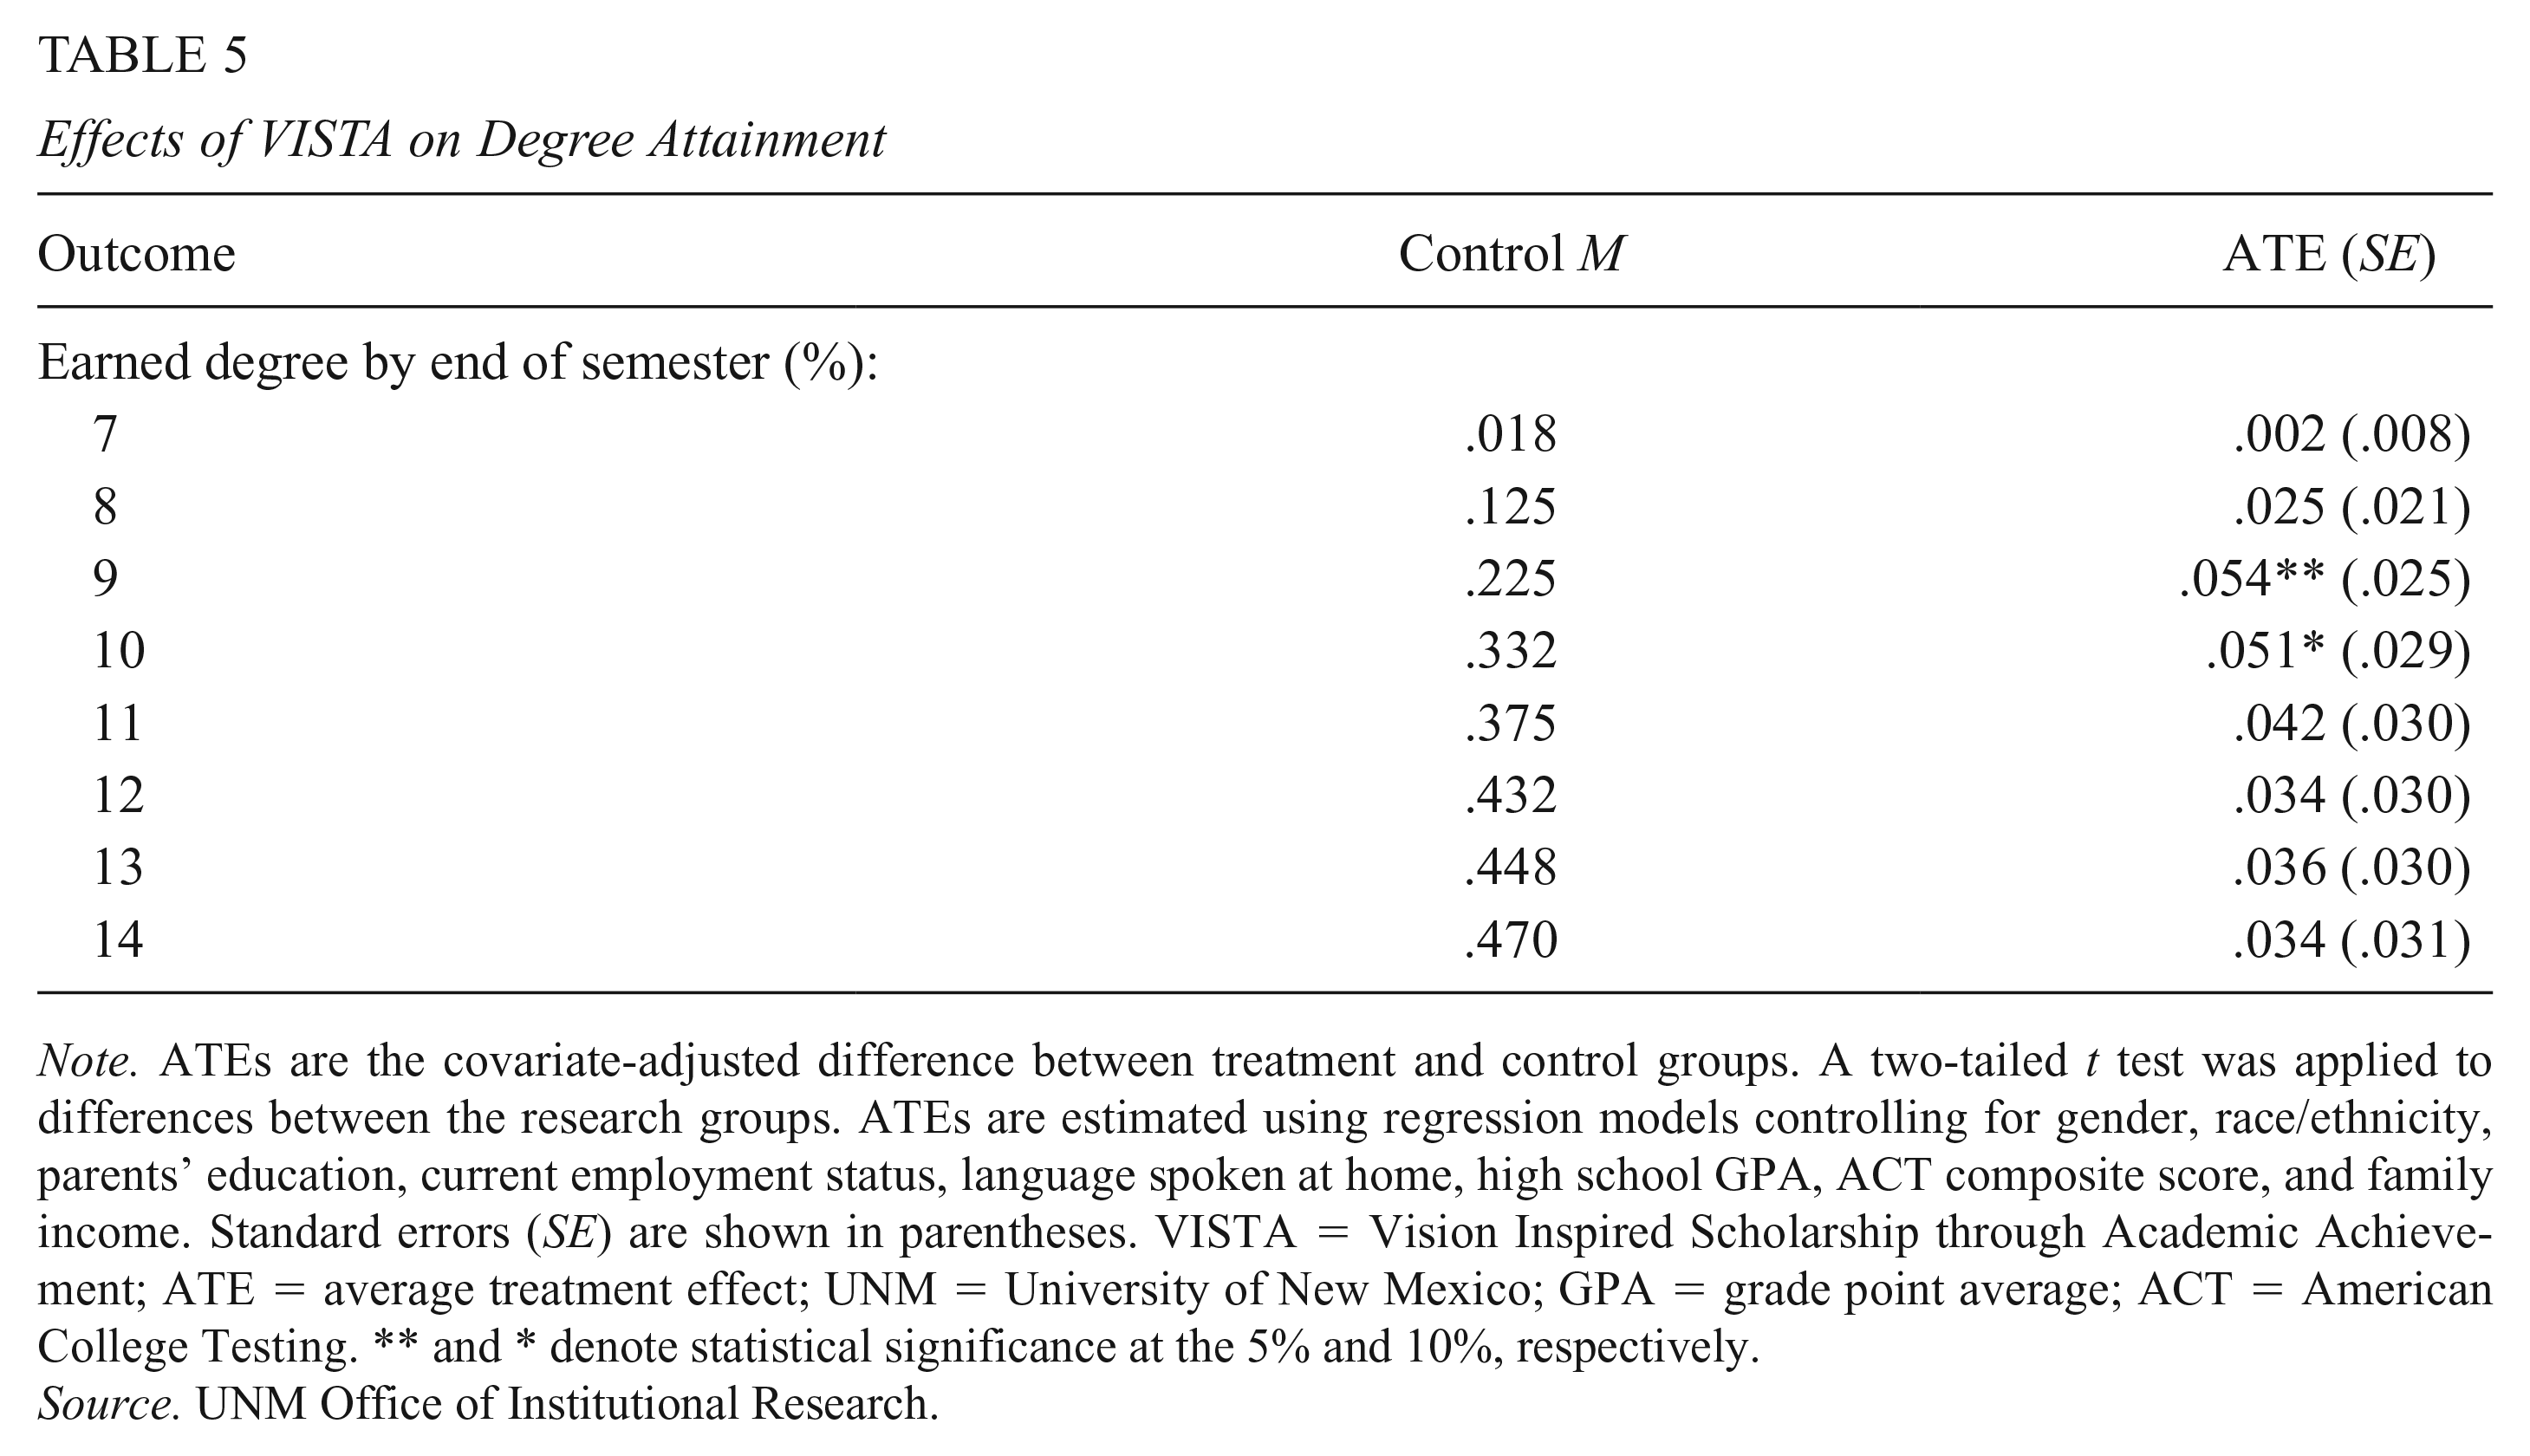
Table 5 presents data on degree attainment. VISTA did not significantly increase 4-year graduation rates for program participants, although there were statistically meaningful increases in later periods. Specifically, the likelihood of completing a degree within 4½ years (nine semesters) increased by 5.4 percentage points (or 24%) for the VISTA group relative to the control group. This is indicative of program efficacy, as the minimum credit requirement of VISTA put students on a track to graduate in 4½ years. The graduation rate within 5 years (10 semesters) increased by 5.1 percentage points (or 15%). These program effects represent a large share of the university’s previously measured eight percentage point income gap in graduation. The program effects are also very similar to the 4.6 percentage point increase in 6-year graduation rates reported by Castleman and Long (2016) for the Financial Student Assistance Grant (FSAG) program. However, similar to Scott-Clayton (2011) and Mayer et al. (2016), completion effects are imprecisely estimated at later semesters, suggesting that VISTA reduced time to degree without affecting graduation rates overall. Nevertheless, and as we discuss later, there are significant benefits from reducing time to degree.
We also examined the effects for students according to their family income and high school GPA. Lower income, Pell-eligible students might be most responsive to the scholarship program if, for example, they were more responsive to financial incentives to progress in school, or if the effects of additional aid were larger for those with lower incomes. Academic preparation at college entry might also affect responsiveness to the program, although it is not obvious which students would respond more. Whereas more-prepared students might find it easier to respond to the program’s incentives by taking and passing more credit hours (as appears to be the case in Leuven et al., 2010; Scott-Clayton, 2011; and Castleman & Long, 2016), less-prepared students might benefit more from the enhanced, personalized advising offered by the program.
Table 6 shows program effects for students above and below the median high school GPA for the study group, and above and below the median family income for the study group. Larger program effects for students in the lower part of the distributions, particularly for high school GPA, appear to be driving the overall effects shown in Tables 4 and 5. For example, less academically prepared VISTA students earned 7% and 10% more credits during the first and second years of the program, respectively. Lower income VISTA students attempted 4% more credits during the first year of the program. Importantly, when we split the sample by academic preparation and family income, effects are imprecisely measured, and none approach significance after adjusting for multiple testing. A lack of statistical power may contribute to this finding.
Effects of VISTA on Cumulative Credits by Income and GPA
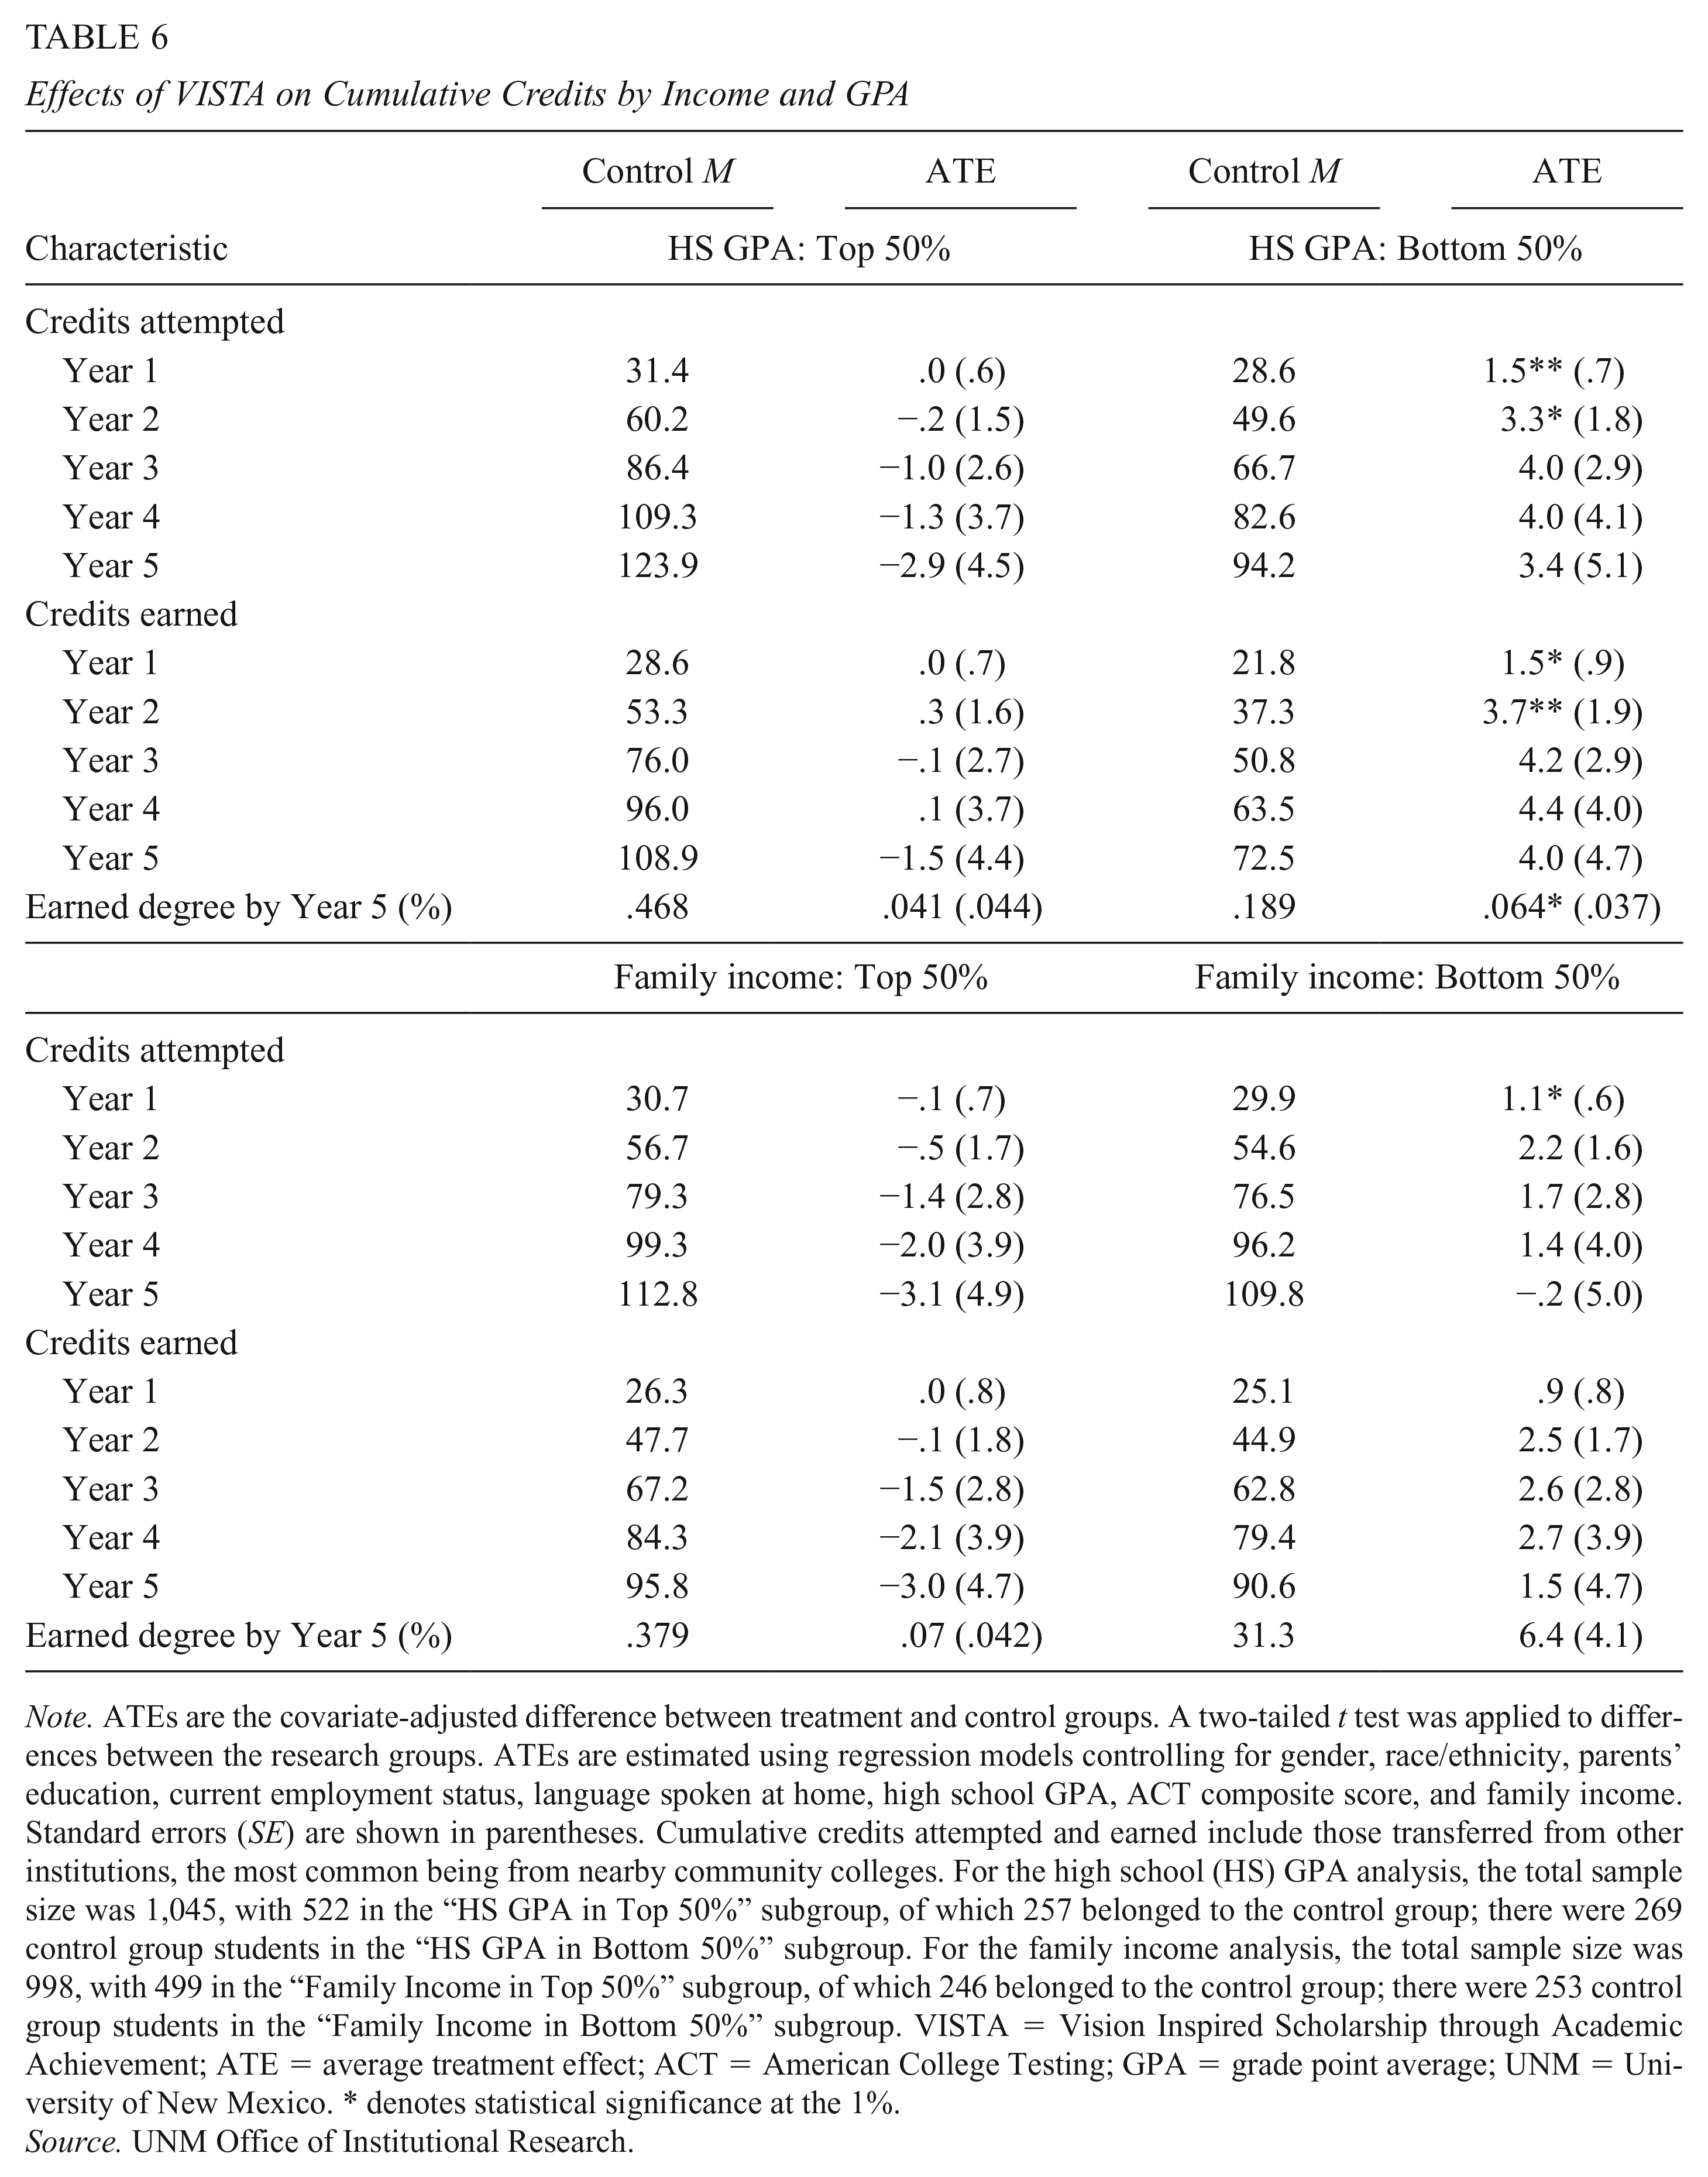
Note. ATEs are the covariate-adjusted difference between treatment and control groups. A two-tailed t test was applied to differences between the research groups. ATEs are estimated using regression models controlling for gender, race/ethnicity, parents’ education, current employment status, language spoken at home, high school GPA, ACT composite score, and family income. Standard errors (SE) are shown in parentheses. Cumulative credits attempted and earned include those transferred from other institutions, the most common being from nearby community colleges. For the high school (HS) GPA analysis, the total sample size was 1,045, with 522 in the “HS GPA in Top 50%” subgroup, of which 257 belonged to the control group; there were 269 control group students in the “HS GPA in Bottom 50%” subgroup. For the family income analysis, the total sample size was 998, with 499 in the “Family Income in Top 50%” subgroup, of which 246 belonged to the control group; there were 253 control group students in the “Family Income in Bottom 50%” subgroup. VISTA = Vision Inspired Scholarship through Academic Achievement; ATE = average treatment effect; ACT = American College Testing; GPA = grade point average; UNM = University of New Mexico.
* denotes statistical significance at the 1%.
Source. UNM Office of Institutional Research.
Exploring Mechanisms for the Program Effect
It is admittedly complicated to interpret the mechanisms behind a financial aid experiment simultaneously randomizing a package of financial aid incentives and enhanced academic advising. Some results are salient: VISTA students took higher course loads during the program, graduated earlier, took out fewer student loans during the program, and were more satisfied with their academic advising. However, interpreting results regarding student engagement and labor market effort require more nuance.
Theoretical expectations regarding the labor market efforts of VISTA students were ex ante ambiguous. On one hand, financial constraints are likely binding for Pell-eligible students, so additional financial aid may result in more time spent studying and engaging in extracurricular activities, and less time spent working. On the other hand, if low-income students are loan averse and have legitimate concerns over scholarship loss, then perhaps working more during the first semester makes sense. Results indicate that VISTA students worked 3.3 more hours per week relative to the control group, a result not counterbalanced by a decrease in time spent studying. VISTA students were less likely to engage in extracurricular activities and saw their advisors more often. These results invoke the question as to whether financial aid for low-income students provides them more time to study. Our results suggest that low-income students worked the same, if not more, hours per week and were less likely to engage in extracurricular activities as a result of receiving additional financial aid.
We do find evidence that VISTA group students carried less debt than students in the control group. As shown in Table 7, financial aid packages for program students were US$1,062 and US$861 more than the packages for control group students in the two program years, reflecting both the VISTA award and reduced borrowing. VISTA group students borrowed about US$300 less than control group students in each program year. 20 Once the 2-year eligibility period ended, the size and composition of the financial aid packages received by the VISTA students and the control group students were very similar.
Effects of VISTA on Financial Assistance During the First 4 Years

Note. Rounding may cause slight discrepancies in sums and differences. ATEs are the covariate-adjusted difference between treatment and control groups. Two-tailed t tests were applied to differences between the research groups. ATEs are estimated using regression controlling gender, race/ethnicity, parents’ education, current employment status, language spoken at home, high school GPA, ACT composite score, and family income. Standard errors (SE) are shown in parentheses. State Lottery grant includes all Lottery Success scholarships and all Bridge to Success scholarships and grants. The VISTA scholarship was available only for program group students in the first and second year. Other grants include grants and scholarships such as the Presidential Scholarship, state incentive grants, and tribal scholarships. Loans category includes all subsidized and unsubsidized loans. Work study includes the amount the student received in the semester from both Federal and University work study. VISTA = Vision Inspired Scholarship through Academic Achievement; ATE = average treatment effect; UNM = University of New Mexico; ACT = American College Testing; GPA = grade point average.
, **, and * denote statistical significance at the 1%, 5%, and 10%, respectively. †††, ††, and † denote statistical significance after adjusting p values for multiple testing following Benjamini and Hochberg (1995) at the 1%, 5%, and 10%, respectively.
Source. UNM Office of Institutional Research.
Where the survey does indicate significant differences is in responses to questions about academic advising. As shown in Table 8, program group students were more likely than control group students to report that advising about their majors and careers and developing academic plans were somewhat or very important when meeting with their advisers, and they reported more (although shorter) advising sessions and greater satisfaction with the advising services. In particular, program group students were 13 percentage points more likely than control group students to agree or strongly agree that “My adviser helped me take on more responsibility for my academic career” (70% vs. 57%), 14 percentage points more likely than control group students to express satisfaction with the amount of time spent meeting with an adviser (83% vs. 69%), and 20 percentage points more likely than control group students to agree or strongly agree that “Interactions (meetings, phone calls, emails, etc.) with my adviser were helpful” (79% vs. 58%).
Differences in First Semester College Experiences
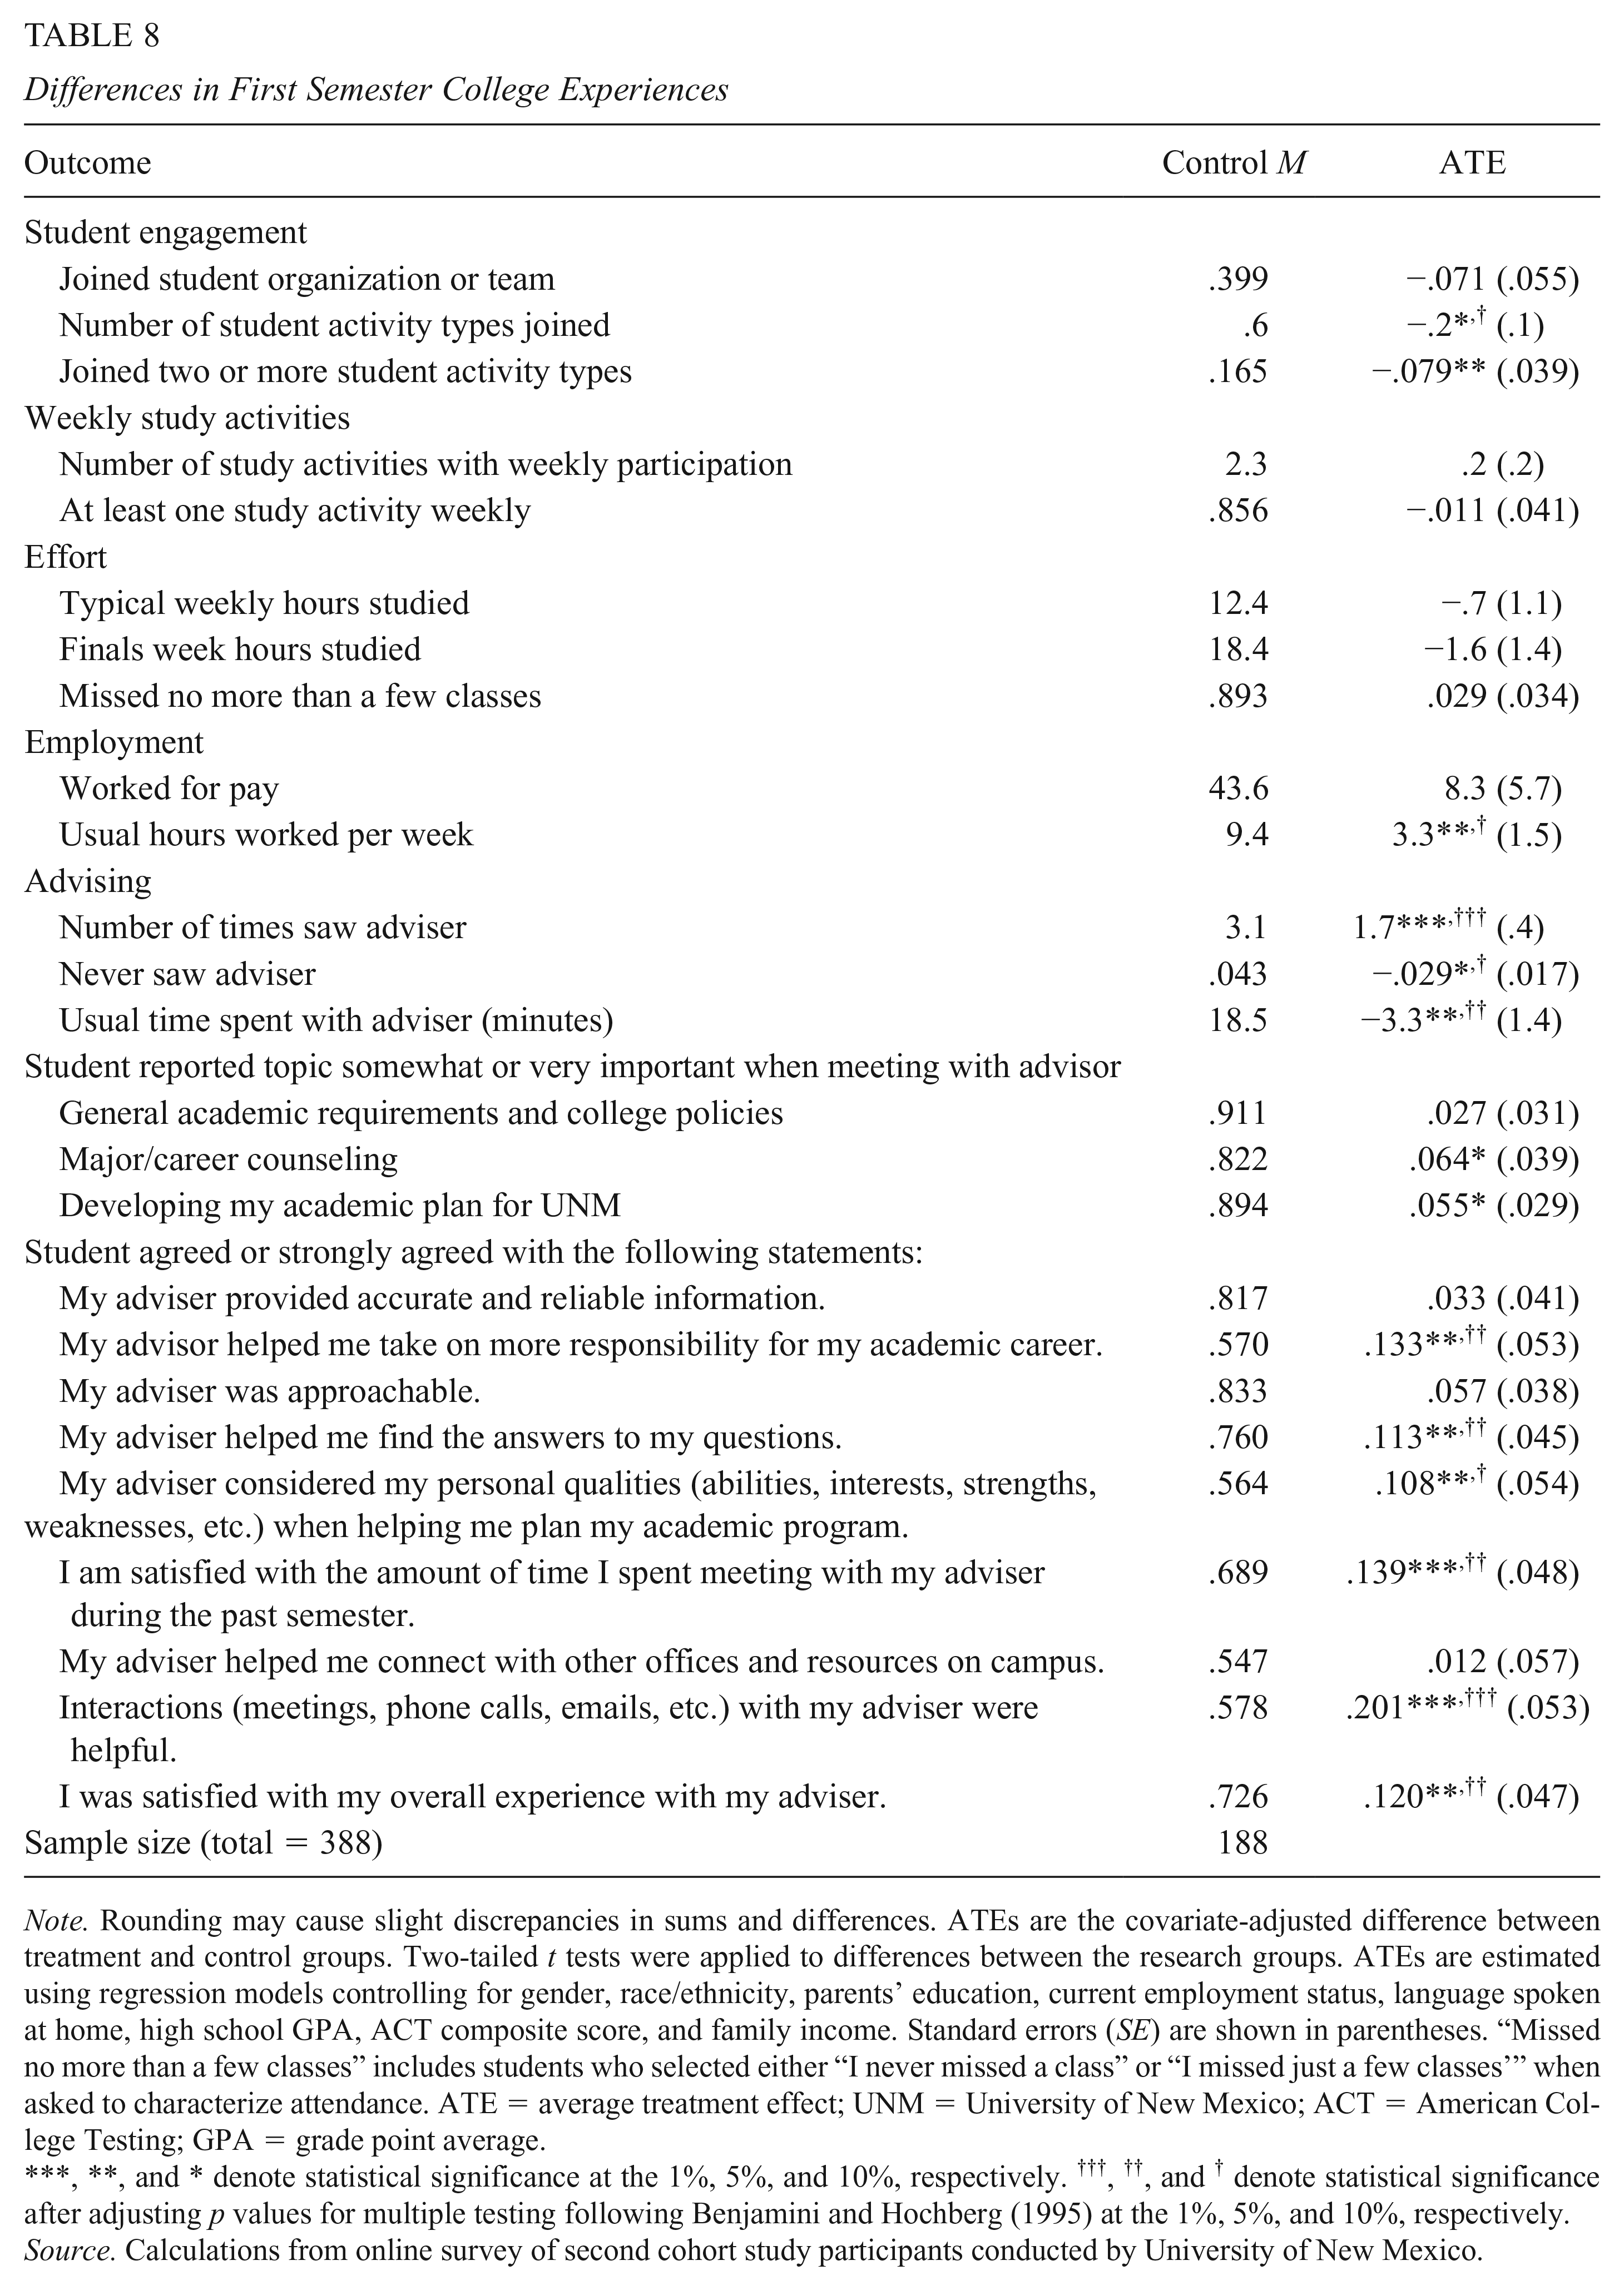
Note. Rounding may cause slight discrepancies in sums and differences. ATEs are the covariate-adjusted difference between treatment and control groups. Two-tailed t tests were applied to differences between the research groups. ATEs are estimated using regression models controlling for gender, race/ethnicity, parents’ education, current employment status, language spoken at home, high school GPA, ACT composite score, and family income. Standard errors (SE) are shown in parentheses. “Missed no more than a few classes” includes students who selected either “I never missed a class” or “I missed just a few classes’” when asked to characterize attendance. ATE = average treatment effect; UNM = University of New Mexico; ACT = American College Testing; GPA = grade point average.
, **, and * denote statistical significance at the 1%, 5%, and 10%, respectively. †††, ††, and † denote statistical significance after adjusting p values for multiple testing following Benjamini and Hochberg (1995) at the 1%, 5%, and 10%, respectively.
Source. Calculations from online survey of second cohort study participants conducted by University of New Mexico.
In interpreting the survey results, it is important to consider potential biases. One source of bias may be introduced by sample selection. As mentioned earlier, the overall response rate to the online survey was 65%. The response rate was higher for the VISTA group, at 68%, compared with the control group, at 63%. We would expect that more engaged students would be more likely to respond. The bias, however, would work against finding differences between the groups, as the control group respondents are likely to be even more engaged than program group respondents, who are more familiar with, and therefore more likely, to respond to requests concerning the program. This is consistent with the higher level of engagement in extracurricular activities reported by control group respondents. 21
Students in the program group who participated in the focus groups reported that the advising was the most valuable component of VISTA. Nearly all of these students expressed appreciation for the opportunity to develop sustained relationships with their advisers that continued throughout the 2-year program. According to these students, VISTA advisers provided both academic and emotional support, support that would not have otherwise been available to them on campus.
Advisers also communicated the value of cultivating ongoing relationships with students in the VISTA program. One adviser noted that the program allowed her the time needed to convey the importance of taking more credit hours and persisting term to term to her students, many of whom would not have done so otherwise. Other advisers said that struggling VISTA students who took advantage of the advising services were able to transition off academic probation. Advisers also assisted students on probation by encouraging them to enroll in summer or winter intersession courses and to reduce their work hours or extracurricular activities to spend more time in the tutoring centers or studying.
Staff credited the program with helping students take advantage of other campus resources, such as the tutoring centers, the student health center, and the career center. Many students accessed these resources because their VISTA advisers had referred them. As one VISTA student shared, “being in VISTA helps us [students] get services and information all in one place.”
Concluding Remarks
Results suggest that VISTA did not increase the overall likelihood of obtaining a degree, but did help some students obtain degrees in a more timely manner. The savings to both students and the university from reducing the time to a degree are substantial: Each additional year in school is expensive in terms of direct costs of attendance and foregone wages. A formal benefit–cost analysis is beyond the scope of this article; however, a rough estimate of costs can be calculated using the average VISTA scholarship received per student (US$2,576 over four semesters) plus the additional costs of enhanced advising. If we assume a total cost per student of US$3,000, then the cost per additional degree earned is roughly US$59,000 (or US$3,000 divided by the 0.051 increase in degree receipt by the tenth semester). This amount should be compared with the increase in expected lifetime earnings from obtaining a college degree versus only some college, and with the benefit of completing a degree in 5 rather than 6 years. For the former comparison, the program clearly passes the benefit–cost test. For the latter, the program cost is similar to at least one estimate of the cost of delaying graduation by a year (Abel & Deitz, 2014).
Our analysis of the VISTA program suggests that tying additional aid to enhanced advising and a heavier course load can make a big difference in narrowing the income graduation gap. The combination of encouraging students to attempt 15 or more credit hours per semester and providing enhanced advising appears to have helped students make greater progress toward graduation. We find it particularly encouraging that the improvement in graduation rates was driven by students in the lower half of the high school GPA distribution, especially because positive outcomes in other programs reported in the literature are concentrated among those with better academic records. What distinguishes VISTA from these other programs is the incentive to make use of enhanced advising, which may be particularly helpful for students with weaker academic preparation. It is possible that comparable effects might occur for students offered a program with the same structure concerning requirements and advising, but with smaller grants. The promising outcome from VISTA should encourage colleges to experiment with similar programs.
Footnotes
Acknowledgements
We extend our thanks to the students who participated, as well as the administrators who implemented the program, especially Terry Babbitt and Vanessa Harris. The authors are solely responsible for any errors.
Declaration of Conflicting Interests
The author(s) declared no potential conflicts of interest with respect to the research, authorship, and/or publication of this article.
Funding
The author(s) disclosed receipt of the following financial support for the research, authorship, and/or publication of this article: This study was funded by Bill & Melinda Gates Foundation; College Access Foundation of California; Helios Education Foundation; Institute of Education Sciences, U.S. Department of Education; The Joyce Foundation; The Kresge Foundation; NYC Center for Economic Opportunity; The Ohio Department of Job and Family Services through the Ohio Board of Regents; Open Society Foundations; and Robin Hood Foundation.
