
Abstract
Automatic admissions policies (AAPs, “percent plans”) redistribute college-going opportunities across segregated high schools to diversify college enrollments, increasing opportunities at predominantly minority high schools. If students “game” AAPs by attending schools with increased opportunities, AAPs could alter racial sorting across high schools. Comparative interrupted time series analyses provide evidence that Texas’s and California’s AAPs reduced Black–White segregation in highly segregated school districts. These effects were concentrated in sparsely populated areas in Texas, and they were modest in California, so it seems unlikely this significantly undermined AAPs’ ability to reduce racial disparities in college-going opportunities. It shows, however, that strategic responses to policies that redistribute opportunities in segregated contexts can create tension between segregation and inequality of opportunity.
Keywords
I explore the tension between these school-based opportunity redistributions and segregation at the secondary level: Segregation is the basis on which AAPs work, but AAPs could incentivize behaviors that reduce it. This tension emerges because strategic actors might find ways to “game” AAP policies (Cullen et al., 2013). Such gaming could undermine the goal of reducing racial inequality of opportunity (and campus diversity) if, for instance, White students increasingly attend what had been disproportionately minority high schools, potentially taking some of these schools’ newfound opportunities. This is plausible, as White people often perceive minority students and predominantly minority schools to be academically subpar (Goyette et al., 2012; Sikkink & Emerson, 2008), and AAPs provide incentives to attend less competitive high schools so as to increase one’s class rank.
I examine whether AAPs enacted in Texas, California, and Florida in the late 1990s and early 2000s altered the way students sorted across high schools in ways that reduced racial segregation. I focus mainly on Black–White segregation but also provide some analyses of Hispanic-White segregation. I use comparative interrupted time series designs (Shadish et al., 2002) with two types of comparisons to rule out unobserved confounders: a synthetic control group (Abadie et al., 2015) of states that never enacted AAPs, which controls national period and cohort effects, and grade-level comparisons that control state-specific period effects. I expect AAPs to have reduced segregation most where the policy benefit was greatest (Texas, which was unique in allowing students above the class rank threshold to attend any state university), where school choice or mobility was most convenient and least costly (within districts rather than between districts or sectors), and in highly segregated settings in which it is easiest to link differential school racial composition to perceptions of academic competitiveness or school-based opportunities.
I cannot determine the impact changes in segregation had on admissions opportunities, but the findings speak to the ways strategic behaviors can threaten egalitarian reforms. This is an interesting case. Competitive opportunity-seeking is often expected to promote racial inequality via “opportunity hoarding” and segregation across unequal districts, schools, tracks, or other organizational spaces (Diamond & Lewis, in press; Hanselman & Fiel, 2017; Siegel-Hawley et al., 2018; Tilly, 1998). But here, opportunity-seeking across segregated spaces could undermine the mechanisms by which AAPs reduce racial inequality, even as (and because) it reduces segregation. If so, policymakers will need to consider people’s strategic responses and who actually has access to opportunities when designing similar school-based reforms.
AAPs
Although AAPs are crafted to be race-neutral, it is an open secret that they leverage secondary school segregation to boost diversity in college admissions (Tienda & Niu, 2006a). Black and Hispanic students are underrepresented on many university campuses, especially selective ones, but they are overrepresented at disproportionately minority high schools. By guaranteeing admissions slots for all high schools, AAPs increase slots in schools serving underrepresented students, thereby boosting opportunities for minority students.
Three states implemented AAPs in the late 1990s and early 2000s (Flores & Horn, 2015; Horn & Flores, 2003). The best-known is Texas’s Top Ten Percent Plan (TTPP). TTPP began in 1998 after the Fifth Circuit U.S. Appeals Court decision in Hopwood v. Texas (1996) led Texas universities to stop using applicants’ race as an admissions factor. TTPP guaranteed all students in the top 10% of their high school’s graduating class admission to any state university of their choosing. The University of California system started its Eligibility in Local Context (ELC) policy in 2001 after a voter referendum banned affirmative action in college admissions. ELC guaranteed students in the top 4% of their graduating classes admission to at least one UC university but not necessarily one of their choice. 1 Compared with TTPP, ELC’s higher rank threshold and more limited benefit may have made it less consequential. Florida began its Talented 20 (T20) program in 2000 as part of a statewide rollback of affirmative action policies. T20 had a lower rank threshold but also a limited benefit: It promised the top 20% of each high school’s graduating class admission to at least one state university but not the one of their choice. 2 Scholars have described the T20 program as decentralized, chaotic, and onerous for students, which may have hindered its impact (Flores & Horn, 2015; Marin & Lee, 2003). 3 In Marin and Lee’s (2003) report on T20’s early years, the program’s administrator said it was designed to motivate students who otherwise might not have considered college (not necessarily to diversify enrollments at selective universities).
Of the three AAPs, only Texas’s has been extensively studied. It is clear that minority enrollments in Texas universities fell between Hopwood and TTPP and that TTPP helped them recover some but not to pre-Hopwood levels. This was especially true in the most selective universities (Alon & Tienda, 2007; Flores & Horn, 2015; Kain et al., 2005; Long & Tienda, 2008). The effects of California’s and Florida’s AAPs have not been examined rigorously, but enrollment trends are also consistent with slight increases in college diversity (Long, 2007; Long & Bateman, 2020). TTPP’s potential to heighten diversity in admissions has also been empirically linked to racial imbalances across Texas high schools, specifically to the underrepresentation of students from predominantly Black and Hispanic high schools at selective state universities (Tienda & Niu, 2006a). Moreover, analyses of enrollment data show that being in the top decile of one’s high school class boosted enrollments in Texas state flagships after TTPP, these effects were stronger for Black and Hispanic students than White students, and they were concentrated in predominantly minority high schools (Niu & Tienda, 2010).
More pertinent for my purposes, TTPP also reduced inequality across high schools with respect to applications and enrollments at Texas’s most selective universities. It increased the diversity of feeder high schools with respect to geography (enrollment increases for rural high schools), racial composition (increases for predominantly minority high schools), and economic composition (increases for high-poverty high schools; Long et al., 2010). There is further evidence that, because admissions are finite, state flagship enrollments declined from traditional feeder schools, which had disproportionately White enrollments (Domina, 2007). These effects were apparently not sufficient, however, to erase the long-held advantage of students from the most competitive high schools in applying to state flagships (Tienda & Niu, 2006b). Overall, TTPP seems to have distributed college-going opportunities more equally across high schools and recovered some but nowhere near all of the losses in minority representation at selective universities that followed the affirmative action ban.
How AAPs Might (and Might Not) Reduce Segregation
Stepping back, AAPs are an interesting appro-ach to addressing racial educational inequality because they revolve around two distinct reform strategies and operate differently at two organizational levels. The primary strategy is akin to a higher education desegregation strategy: reduce racial educational inequality by diversifying selective universities. But this strategy works by implementing a different strategy at the high school level (Domina, 2007): redistributing opportunities across segregated schools. The latter is the focus of this study.
This strategy of equalizing schools despite segregation gained popularity as primary and secondary school desegregation receded (Fiel & Zhang, 2019; Orfield & Eaton, 1996). On top of long-standing resistance among desegregation opponents, some formerly supportive Black communities became dissatisfied with desegregation’s implementation. Discriminatory treatment of Black students and opportunity hoarding in ostensibly desegregated schools (e.g., racialized tracking) led to within-school segregation and inequality that undermined desegregation’s purpose (Mickelson, 2001; Tyson, 2011; Wells & Crain, 1997). This shifted some support toward school-based egalitarian reforms that might increase opportunities in predominantly Black schools (Bell, 1980; Garland, 2013). This is how AAPs work at the high school level. But while scholars have examined some ways strategic opportunity-hoarding behaviors undercut desegregation, we have not considered the way it might disrupt school-based equalization reforms. AAPs provide an opportunity to do so.
Gaming AAPs
By tying admissions to class rank, AAPs make one’s performance and one’s high school distinct admissions factors: one’s chances increase as one’s own performance improves and as the number of high-performing classmates declines. By altering perceived college-going opportunities at different high schools, AAPs could induce some students who expect to fall short of the class rank cutoff in one high school to game the policy by choosing another school where they expect a better chance of exceeding it. Note that students’ perceptions of opportunities are key. TTPP was widely publicized, and it may have equalized perceived opportunities more than it changed objective admissions chances (Domina, 2007; Long et al., 2010), but surveys also found Black and Hispanic students less aware of the policy than White and Asian students (Niu et al., 2008).
Two studies provide evidence that students gamed the TTPP. Cullen et al. (2013) find that after TTPP, students of middling achievement levels became more likely to attend lower-achieving high schools. Cortes and Friedson (2014) link the TTPP to increasing property values in neighborhoods with low-achieving schools, suggesting it increased demand to attend less competitive schools enough to affect housing decisions. Both are patterns we might expect if opportunity-seeking in response to AAPs affects sorting across schools.
These prior studies focus on achievement-based sorting. Do families have the information to pull off this sort of gaming? It helps that the states that passed AAPs previously implemented accountability policies with publicly reported data on schools’ test performance (Dee & Jacob, 2011; McDermott, 2003), but effectively gaming AAPs requires complex analyses of additional information students may not have. Students would project their own academic performance (grades) in all the schools they were considering while knowing how difficult courses are as well as the distribution of their schoolmates’ performance (especially high-performing ones), not to mention knowing whom their schoolmates would be and what courses they would take.
Implications for Segregation
People may compensate for limited information by using status characteristics as proxies for high schools’ academic competitiveness, an important one being school racial composition. Many people view predominantly minority schools as low in quality (Goyette et al., 2012; Holme, 2002; Sikkink & Emerson, 2008; Wells et al., 2009), and there are pervasive stereotypes about minority intelligence, behavior, and poverty (Brezina & Winder, 2003; Kao, 2000). These and other studies often find such attitudes more pronounced among White people than other racial categories and more pervasive against Black people than other non-Whites (Bobo & Hutchings, 1996; Bobo & Zubrinsky, 1996). Evidence also indicates that people in competitive scenarios prefer to choose competitors with devalued status characteristics (Savage et al., 2020). Because under AAPs one’s college-going opportunities increase if one’s peers are less academically competitive, AAPs may increase the appeal of predominantly minority high schools to White students, which could reduce segregation.
AAPs’ potential impact on segregation may be limited, however, by their specificity: They redistribute a specific opportunity (admission to state universities) at a given time (high school graduation) through a narrow mechanism (class rank). When choosing where to live and send children to school, families likely care about access to “bundles” of long-term school and neighborhood-based opportunities (Tiebout, 1956). School districts are especially important, given district-based taxing and funding mechanisms and districts’ impact across many schools over the educational career (Brunner et al., 2012; Chakrabarti & Roy, 2015; Urquiola, 2005). This explains why much economic school and residential segregation occurs across school district boundaries (Owens, 2016; Owens et al., 2016). Given the potential breadth of educational opportunities at stake over the long term and the costliness of securing them in the housing market, it seems unlikely that families choose neighborhoods years in advance of college based on their perceptions of specific high schools’ academic competitiveness, just to game AAPs.
Nonetheless, as high school approaches, families may pay more attention to the college-going opportunities attached to specific schools, and AAPs may become salient. As others have argued, I expect the nature of AAPs, the costs of moving and other avenues of school choice, and the pull of neighborhoods (e.g., proximity to desirable amenities, resources, and relationships) to limit the scale of most gaming to choosing among nearby high schools that do not require long-distance moves during adolescence (Cortes & Friedson, 2014; Cullen et al., 2013). Specifically, I expect gaming to be most likely within public school districts. Most states (including those with AAP policies) allow districts to implement intradistrict transfer policies, and although we lack comprehensive data on these transfers, they have likely been among the most prevalent forms of school choice. A district can offer many schooling options, and within-district transfers or moves entail lower organizational barriers and financial costs than other forms of choice (e.g., no private school tuition or district housing premia and no need for administrative cooperation or long-distance moves or transportation across districts; Phillips et al., 2015).
AAPs also have the most potential to reduce segregation where schools are highly segregated. There is more room to reduce segregation where it is higher, and people can more readily associate school racial composition with perceived school-based opportunities (or academic competitiveness) where schools differ starkly in racial composition.
There are other reasons AAPs may not impact segregation. Segregation is driven by more than the competition for educational opportunities, and the highly segregated areas where gaming is most likely to reduce segregation may be settings where “tastes” for racial segregation (e.g., discrimination) or other factors are a stronger driver of sorting than educational opportunities. Moreover, because the opportunities from AAPs operate through students’ relative achievement, they resemble “frog pond” effects (Attewell, 2001). Families may recognize potential trade-offs between opportunities tied to a less competitive pool of peers and others tied to high-performing classmates (Goldsmith, 2011). This could dampen any influence of AAPs on school desirability. Expanding opportunities at predominantly minority schools may also heighten their appeal to minority students in ways that counter any increased appeal to White students. Finally, AAPs are only relevant to students who think they are near the class rank threshold and who want to attend a state university. If this is a small number of students, AAPs may not have an appreciable impact on segregation even if some gaming occurs.
Hypotheses
Following the foregoing discussion, I test the following hypotheses.
Data and Measures
I focus on school segregation between 1993 and 2011. This period spans several years before and after the policy reforms and has the requisite school-level racial composition data for public and private schools in the United States. I start by creating a panel of school-level racial composition data from the Common Core of Data’s (CCD) Public Elementary/Secondary School Universe Survey and the Private School Survey (PSS), both from the National Center for Education Statistics. 4 I measure Black–White segregation in each year using racial imbalance measures, which capture how unevenly distributed Black and White students are across a set of schools (e.g., a district), regardless of that set’s overall racial composition. My primary measure is the information theory index (H), but supplementary analyses using dissimilarity (D) yield similar results. 5 H measures, as a proportion, how much less diverse schools are than the set as a whole, which reflects how imbalanced racial groups are across schools. I rescale it to range from 0 to 100. I conduct supplementary analyses of Hispanic–White segregation as well.
I calculate segregation throughout the United States because I will be using states without AAPs as a control group. I focus primarily on segregation within traditional public school districts because this is where effects are likely most pronounced. I additionally examine segregation in broader schooling markets that include multiple districts, charter schools, and private schools. I operationalize these markets as metropolitan areas (Combined Statistical Areas or Core-Based Statistical Areas) or nonmetropolitan counties based on 2015 county boundaries. Supplementary analyses at the market level also examine segregation between school districts as well as segregation between the public and private sectors.
Because changes in school sorting in response to gaming AAPs should occur primarily across high schools, and because I use grade-level comparisons as an additional way to control unobservable confounders, I calculate segregation separately at three levels: elementary (KG–5th grades), middle (6th–9th grades), and high school (10th–12th grades). I use these grade ranges and focus on high school versus elementary school differences because of inconsistency in middle school grades over time. Middle schools often house either Grades 6 to 8 or 7 to 9, but this has shifted more toward the former in recent decades, which could distort changes in segregation at these grade levels. 6 I aggregate grade-specific enrollment data up to these three levels for each school and then calculate segregation. Comprehensive grade-specific racial composition data are not available in public schools in the early 1990s or private schools at any time, so when they are not available I estimate them from school-level race-specific enrollments and school-level grade-specific enrollments (e.g., I multiply a school’s Black enrollment share by total first-grade enrollment to estimate first-grade Black enrollment). These estimates are very highly correlated (>0.95) with actual grade- and race-specific enrollments for cases in which the latter are reported.
I then create a district-grade-year segregation panel for within-district analyses and a market-grade-year panel for market-level analyses. I drop district-grade-year or market-grade-year cases with fewer than two schools, and I only include district grades or market grades that appear in the data both before and after the AAP. I also drop districts or markets where either of the two racial groups comprised an average of less than 3% of the student population during the panel.
AAP Data
I include indicators for the timing of the AAP policies starting the first year they could have affected admissions—1998 for Texas’s analysis, 2000 for Florida’s, and 2001 for California’s—and spanning the next 10 years. I drop cases more than 10 years after the AAP.
Control Variables and Interactions
My research design will rule out some unobserved confounders that could have altered segregation around the time of the AAP. I also include covariates likely related to school segregation as controls. My district-level analyses include indicators of whether there was ever a desegregation court order and whether one was still active, and my market-level analyses control for the log-transformed numbers of districts and students under active desegregation orders. This information comes from the ProPublica School Desegregation Order data (Qiu & Hannah-Jones, 2014) and some minor updates from Fiel and Zhang (2019). I also control for market-level residential segregation (between-tract dissimilarity, calculated from Census data) between the two groups in 1990; in district-level analyses, this is the market in which the district is located. Finally, I include several pretreatment measures, averaged for the 3 years preceding the AAP, from CCD and PSS data: district/market racial composition (average enrollment shares of Black and White students), the log-number of students and schools in the market/district, the log-number of districts in the market, and private sector’s share of students and schools in the market. Very few cases (<2%) are dropped due to missing covariates.
Analyses
Because there are only three AAPs that likely have different effects, I analyze Texas, California, and Florida separately. I use a comparative interrupted time series (CITS) design with two types of comparisons to control unobserved confounders (Shadish et al., 2002): one involving states without AAP policies and one involving differences across grade levels. Note that when analyzing one AAP state, I always exclude cases from the other two AAP states from the comparison group. I implement these CITS approaches with ordinary least square (OLS) regression models with standard errors adjusted for clustering at the state level.
A basic ITS regression of district-grade-year segregation (

I will plot basic ITS results for descriptive purposes, but they are flawed for testing my hypotheses because the AAP effect estimates will be confounded by other changes that influenced segregation and coincided with the AAP. I mentioned several control variables in the prior section, but there may be unobserved confounders as well. Such confounders could operate broadly or be unique to the treatment states. They could also affect all students in school around the time of the AAP (period effects) or be unique to specific cohorts that entered high school after AAP implementation (cohort effects). I build onto the basic ITS with two design elements to remove all such confounders except treatment state-specific cohort effects.
The first incorporates comparisons of high school segregation trends in “control” states without AAPs that were subject to similar broad period and cohort effects. Equation 2 adds to the prior equation a treatment state indicator (

I refine this using a synthetic control group approach (Abadie et al., 2015), reweighting the districts (or markets) from control states so that their pretreatment segregation mirrors the treatment state’s. To get the weights, I estimate random growth models (Singer & Willett, 2003) of segregation for all districts (or markets) nationally in the pre-AAP years (separately by grade level), and I save the Empirical Bayes estimates of each district’s (or market’s) (a) pretreatment segregation trend, (b) predicted segregation level in the treatment year, and (c) the product (interaction) of the two. I then use entropy balancing (Hainmueller, 2012) to calculate weights that, when applied to the control sample, yield means for the high school segregation parameters comparable to those of the treatment state. 7 I use these weights when estimating the regression, and I also include the pretreatment segregation estimates as controls. The supplement provides more details; it shows that the synthetic control group draws on districts from a wide range of states, and no cases have extreme weights that would make them overly influential.
This design is still vulnerable to confounders specific to the treatment state. I incorporate the second comparison, between elementary and high school grade levels, to eliminate period effects unique to the treatment state. The logic is that AAP effects due to gaming should be concentrated at the high school level, whereas apparent effects at lower grades could plausibly be due to other changes that coincided with the AAP. If so, removing any detected effects at the elementary level from those at the high school level will remove spurious effects due to those alternative explanations. Note that this cannot remove state-specific cohort effects, as grade-level comparisons at a given time are inherently cross-cohort comparisons. Hence, the main threats to validity in this design are changes that altered segregation uniquely in the treatment state for the cohorts that started high school after the AAP.
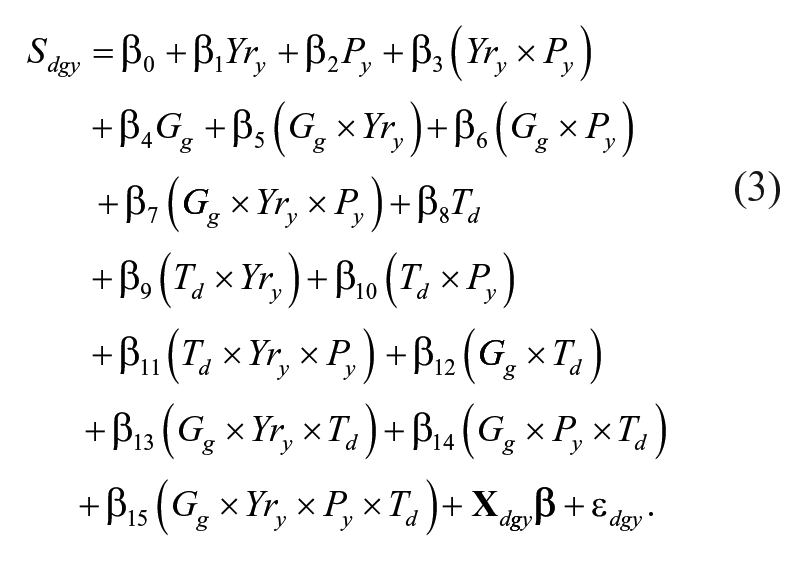
I extend the prior regression by incorporating cases from all grade levels and adding grade-level (
Beyond accounting for unobserved confounders, these comparisons reduce the potential influence of model specification problems, such as nonlinear time trends, regression to the mean, or ceiling/floor effects at high/low segregation levels. Although we might expect segregation to decrease more in highly segregated districts, for instance, this should occur similarly in both the treatment and the control states and will not bias the AAP effect estimates.
The synthetic control group approach also permits placebo tests to probe the robustness of any detected effects (Abadie et al., 2015). For each treatment state, I iteratively repeat the analysis while pretending each comparison state received the treatment. In the Texas placebo analysis, for instance, I exclude Texas and repeat the entire analysis as if Minnesota (and then each other control state) implemented an AAP in 1998; any apparent AAP effects in control states would be spurious. I save the distribution of AAP effect estimates from these placebo analyses and calculate the proportion of states with effect estimates more negative than the actual treatment state. These are states that had greater contemporaneous declines in segregation than the treatment state despite having no AAP (after ruling out the same types of confounders). This is a sort of pseudo-p value, and it should be low if we are to have confidence that the treatment effect estimates are truly attributable to AAPs (Abadie et al., 2015).
Results
Within-District Segregation
Table 1 summarizes the distributions of cases and variables for the analytic sample used in the Black–White within-district segregation analyses, separately for each treatment state (including cases from comparison states). The Texas sample, for example, includes 58,176 district-grade-year observations, nested within 1,426 districts and 37 states, and it spans the years 1993 to 2008, 10 years after Texas’s 1998 AAP. Average Black–White school segregation, measured by H on a 0 to 100 scale, is around 8 to 10 points with substantial variation. For readers more familiar with dissimilarity, the average value of within-district D is 24 (Supplemental Table S6 in the online version of the journal). Residential segregation is higher at around 35 points (H); it is measured between census tracts for the entire surrounding market (metro area or county), not just the school district. Around one third of cases were in districts ever under a court desegregation order, and about one fifth were under an active order. Black students comprise roughly one fourth and White students roughly two thirds of student enrollment in the average case.
Summary Statistics: Black–White Within-District Analyses

Note. AAP = automatic admissions policy.
Pretreatment measures averaged over 3 years preceding AAP (except 1990 residential segregation and nonmetropolitan status).
The plot on the left of Figure 1 shows descriptive segregation trends for the Texas analyses. It plots average yearly segregation at the high school level for both Texas (black) and comparison states (gray), for all districts (solid) and then separately for districts with high (dashed) and low (dash-dot) segregation prior to the AAP. The trend lines are piecewise linear fits from basic ITS regressions shown in Equation 1. This plot has not accounted for control variables or incorporated cross-grade comparisons with the elementary level, but it appears that high school segregation fell more in highly segregated Texas districts than in highly segregated comparison state districts after the AAP.

Texas within-district segregation trends and state-grade CITS results.
The plot at right shows trendlines based on predictions from the full state-grade CITS analyses (Equation 3). Table 2 summarizes the AAP effect estimates from these analyses, including both the immediate (Level) and the gradual (Trend) effects on Black–White within-district segregation. The table includes two columns for each state, the first reporting estimated AAP effects across all districts, and the second reporting interactions by pretreatment segregation levels. With interactions included, the main effects pertain to highly segregated districts, and the interaction terms capture differences in AAP effects in less segregated districts. The table includes standard errors adjusted for state-level clustering (in parentheses) and pseudo-p values from the placebo analyses (in italics). The supplement provides more details on the placebo effects for specific comparison states.
AAP Effects on Black–White Within-District Segregation (H): State-Grade CITS

Note. AAP = automatic admissions policy; CITS = comparative interrupted time series.
p < .10, based on the proportion of placebo states with more negative coefficients than treatment states (in italics). Models include controls and balancing weights (not shown). bp < .10; standard errors adjusted for clustering within states (in parentheses).
p < .05.
For Texas’s TTPP, the first column reports results for all districts. The level coefficient indicates that segregation fell only 0.36 points at the time of the AAP; this is not statistically significant, and the placebo p value indicates that segregation levels fell more than this in 47% of placebo states that did not have AAPs. The trend coefficient indicates that segregation fell 0.40 points-per-year following Texas’s AAP; this is statistically significant, although 19% of placebo states had gradual declines greater than this. The second column shows that Texas’s AAP effects were stronger in districts highly segregated prior to the AAP. In highly segregated districts, segregation fell 2.39 points upon AAP implementation and another 1.75 points-per-year following the AAP. The level coefficient is not statistically significant, but the trend effect is, and only 2.8% (1 of 36) of placebo states had downward trends more pronounced than this. The interaction coefficients are similar in magnitude in the opposite direction, indicating negligible effects in less segregated districts; the trend interaction coefficient is statistically significant.
Returning to Figure 1, the plot on the right illustrates the covariate-adjusted pre-AAP trends in Texas and the shift in those trends that corresponds to the AAP effect estimates just discussed. In the full sample (solid), modest negative effects on segregation emerge gradually. There are negligible effects in less segregated districts (dash-dot), but substantial declines (more than 11 points after 5 years) in highly segregated districts (dash).
The next two columns in Table 2 summarize the findings for high school segregation around California’s ELC policy. There are small negative AAP effects overall that are not statistically significant. With interactions, a statistically significant gradual effect of about −0.25 points-per-year appears in highly segregated districts. Note, however, that 35% of placebo states had gradual declines more pronounced than this around the same time. The interaction coefficients again show that any declines in segregation were concentrated in highly segregated districts. Figure 2 illustrates these findings, showing that declines in segregation were limited to highly segregated districts, and these effects were more modest than in Texas.
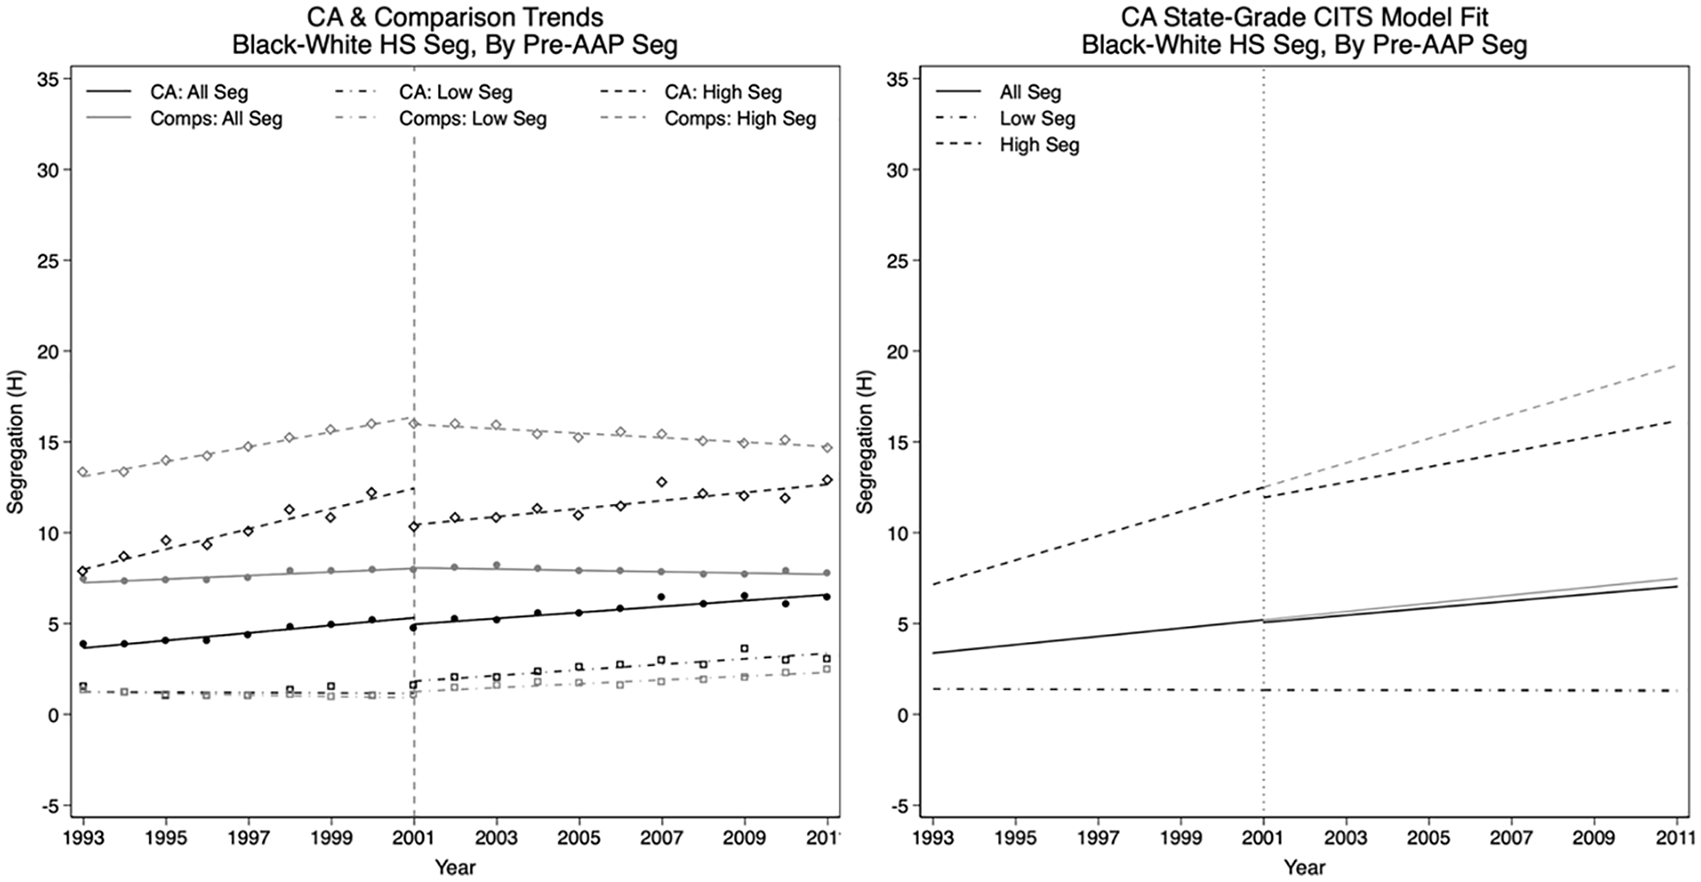
California within-district segregation trends and state-grade CITS results.
The final two columns in Table 2 include the same estimates for Florida’s T20 program. The estimates are all small and are not statistically significant overall or in highly segregated districts. Although the interaction on the trend coefficient is statistically significant, the trend effects are not significant in either the highly segregated (ß = 0.13) or less segregated (ß = 0.13–0.28 = −0.15) districts. Figure 3 illustrates the lack of apparent AAP effects in Florida.
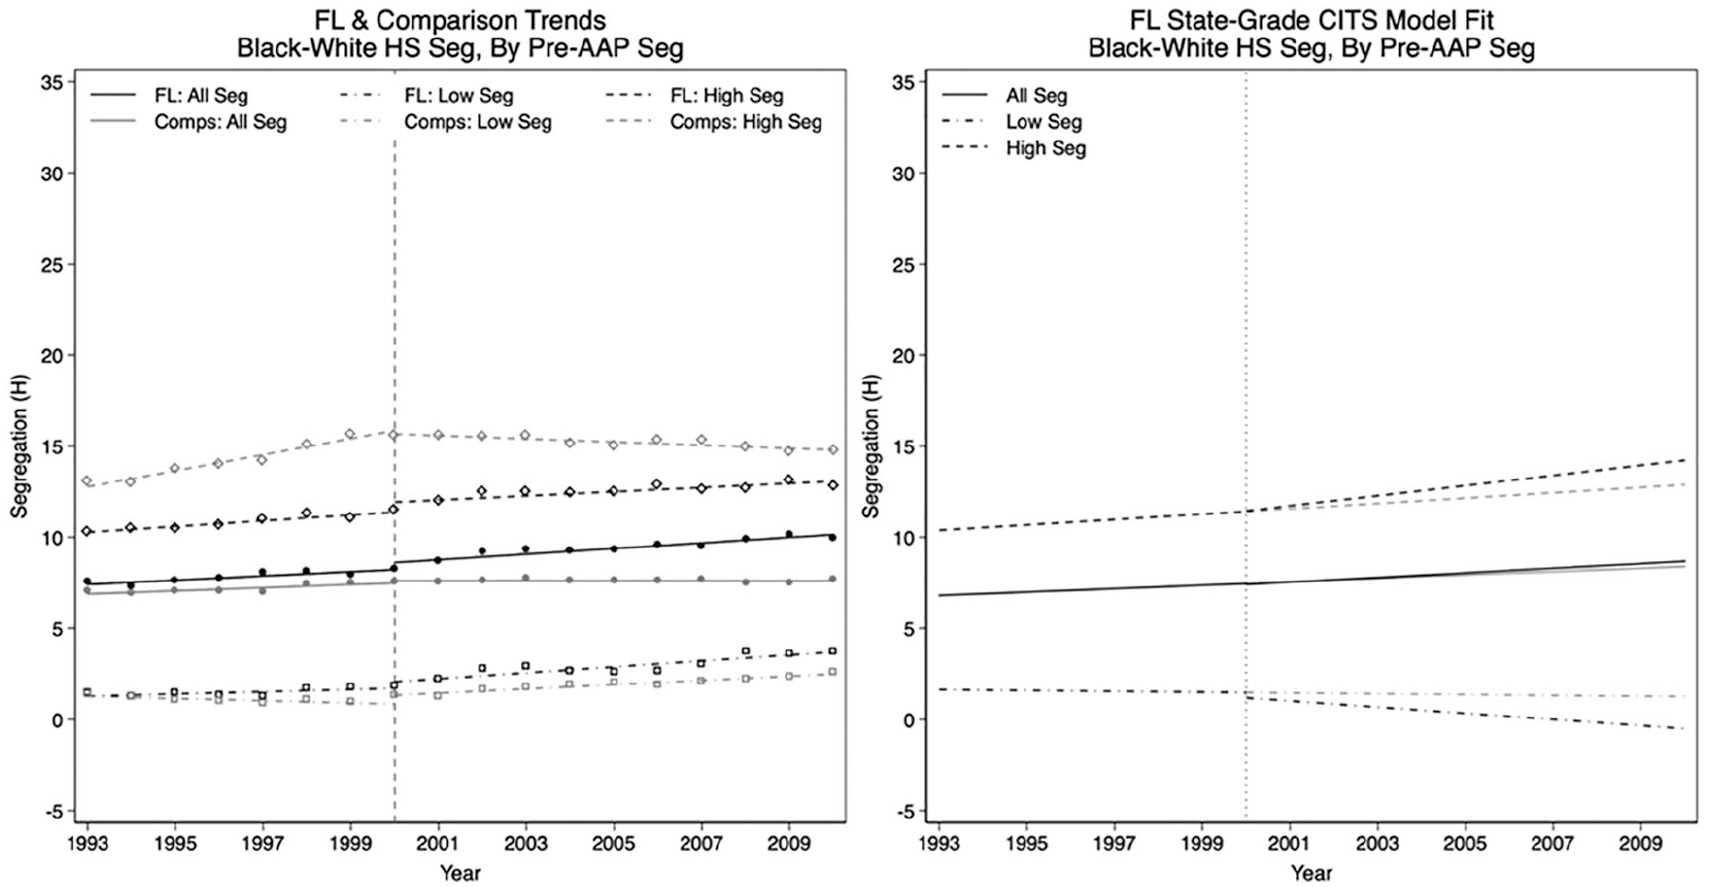
Florida within-district segregation trends and state-grade CITS results.
Overall, these findings are consistent with the hypotheses that AAPs reduce Black–White segregation in high schools, that these effects were most pronounced for the AAP with the largest benefit (Texas), and they were concentrated in highly segregated districts.
Alternative Specifications
I will now summarize additional analyses, presented in supplemental materials, that probe these AAP effects more deeply. First, I examine alternative specifications of the state-grade CITS analyses that include additional control variables which might alter within-district segregation in ways only loosely related to AAPs (Tables S3–S5 in the online version of the journal). I add time-varying measures of districts’ enrollment, racial composition, number of schools, and of the prevalence of charter and private schooling in the markets in which districts are nested. These might tap alternative sources of change in segregation related to sorting across district lines, but they also include post-treatment years and might capture endogenous sorting into or out of districts in ways relevant to gaming AAPs. Hence there is a risk of overcontrol bias. I also include additional interactions to allow desegregation orders to alter subsequent segregation trajectories, and I incorporate school district fixed effects. Across these specifications, I continue to find statistically significant negative AAP effects within highly segregated districts in Texas and California. I find no evidence of declining within-district segregation following Florida’s AAP.
Second, I replicate the AAP analyses using dissimilarity (D) rather than the information theory segregation index (H). The findings for within-district D follow the same patterns as those for H (Tables S6–S9 in the online version of the journal).
Third, I replicate the main analyses with weights for each district’s pretreatment student enrollment; the previously reported analyses weight each district year equally. I find smaller (but still statistically significant) post-AAP declines in segregation within highly segregated Texas districts when weighted by student enrollment, suggesting that AAP effects were stronger in less populated Texas districts (not shown). This led me to estimate the state-grade CITS regression models with interactions by metropolitan status. I find that Texas’s post-AAP declines in segregation were concentrated in nonmetropolitan areas (see Supplementary Table S10 and Figure S4 in the online version of the journal). This was not the case in California or Florida.
Within-District School Enrollment Changes
To examine in more detail the shifts in school enrollment patterns surrounding these AAP policies, I also conduct within-district school-level analyses that examine the association between race-specific school enrollments and lagged (1-year prior) school racial composition, before and after the AAP. I include all high schools used in the within-district segregation analyses and estimate state-grade CITS regressions similar to Equation 3, in that they use control state and elementary level comparisons to isolate post-AAP changes in enrollment patterns unique to treatment state high schools. To focus on within-district sorting, I include district fixed effects. I describe these in more detail in the supplement. I am most interested in how school-level Black and White enrollment shares in the prior year predict subsequent Black and White enrollments, and how this changed with the AAPs.
In these analyses (Table S11 in the online version of the journal), prior to the AAPs, the strongest associations are Black enrollment shares with higher subsequent Black enrollments and White enrollment shares with higher subsequent White enrollments. Higher Black enrollment shares also predict lower subsequent White enrollments, consistent with White students’ avoidance of schools with relatively large shares of Black students. White enrollment shares do not reliably predict subsequent Black enrollments. The AAP effects of interest are interactions that capture how these associations changed upon AAP implementation. The estimates indicate that White enrollment became significantly less negatively associated with prior Black enrollment shares after Texas’s AAP, consistent with the hypothesized mechanisms that White students may become less averse to schools with large Black enrollments following the TTPP.
This was not the case in California, however. The findings there are consistent with both Black and White enrollments becoming less positively associated with prior shares of their same-race peers after the ELC policy. This fits the findings of declining segregation within California districts but not necessarily in the ways expected under the hypothesized gaming mechanisms. In Florida, the opposite occurred, with both White and Black enrollments becoming more positively associated with their own group’s prior enrollment shares.
Market-Level Segregation
The next question is how these effects carry over to the broader schooling markets districts are located in. Table 3 provides summary statistics for the market-level data. Recall that markets are either metropolitan areas or nonmetropolitan counties; they include all of the districts, private schools, and charter schools in those areas. Prior research shows that within-district segregation makes up a modest share of segregation in contemporary schooling markets; it is dominated by imbalances between school districts and among various alternatives to traditional public schools (Fiel, 2013; Reardon et al., 2000). Accordingly, I find school segregation 2 to 3 times higher at the market level (22–24 points H) than within districts.
Summary Statistics: Black–White Market-Level Analyses
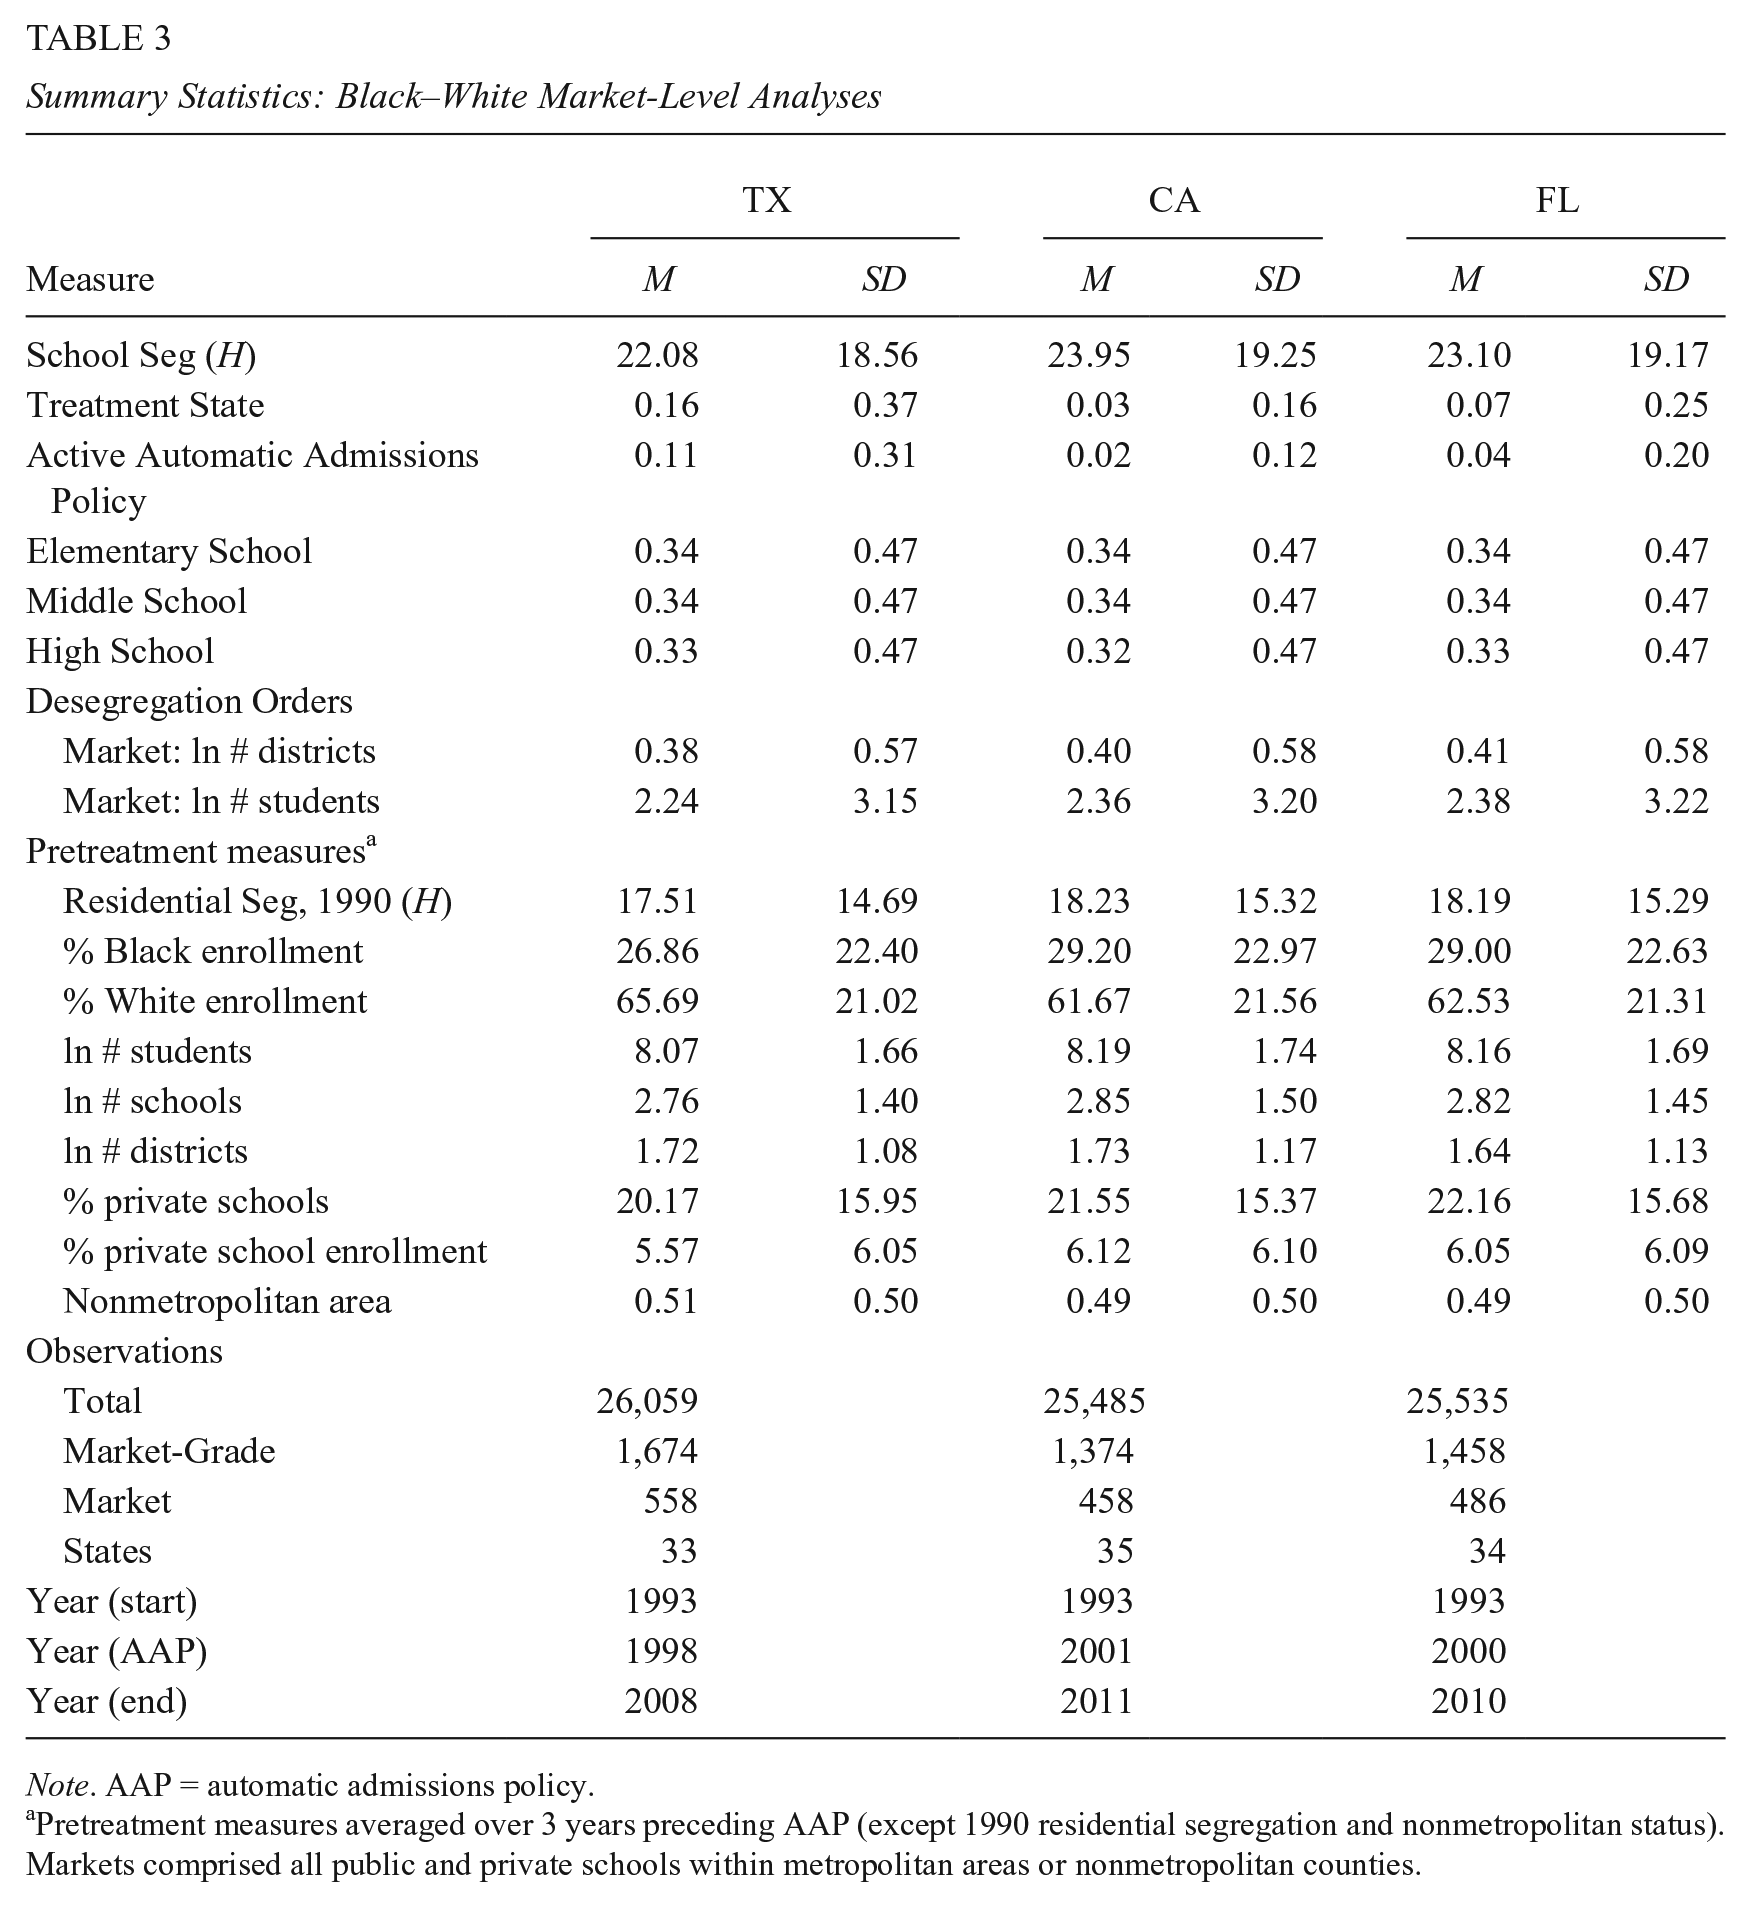
Note. AAP = automatic admissions policy.
Pretreatment measures averaged over 3 years preceding AAP (except 1990 residential segregation and nonmetropolitan status). Markets comprised all public and private schools within metropolitan areas or nonmetropolitan counties.
Table 4 summarizes market-level estimates from state-grade CITS analyses. They indicate small gradual declines in highly segregated markets for Texas’s TTPP (0.83 points-per-year). These are less pronounced than the within-district effects, they are only marginally significant (p < .10), and about 11% of placebo states had downward trends more pronounced than this. Additional analyses (see Supplementary Table S1–S2 in the online version of the journal) provide no evidence that the AAP affected between-district segregation within these markets, although there is evidence that between-sector segregation fell within Texas markets with previously high public-private segregation. State-grade CITS analyses of market-level enrollment data also show that White students’ share of private school enrollment declined following the TTPP, consistent with White students shifting from the private to the public sector to game the AAP (Supplemental Table S12 in the online version of the journal).
AAP Effects on Black-White Market-Level Segregation (H): State-Grade CITS
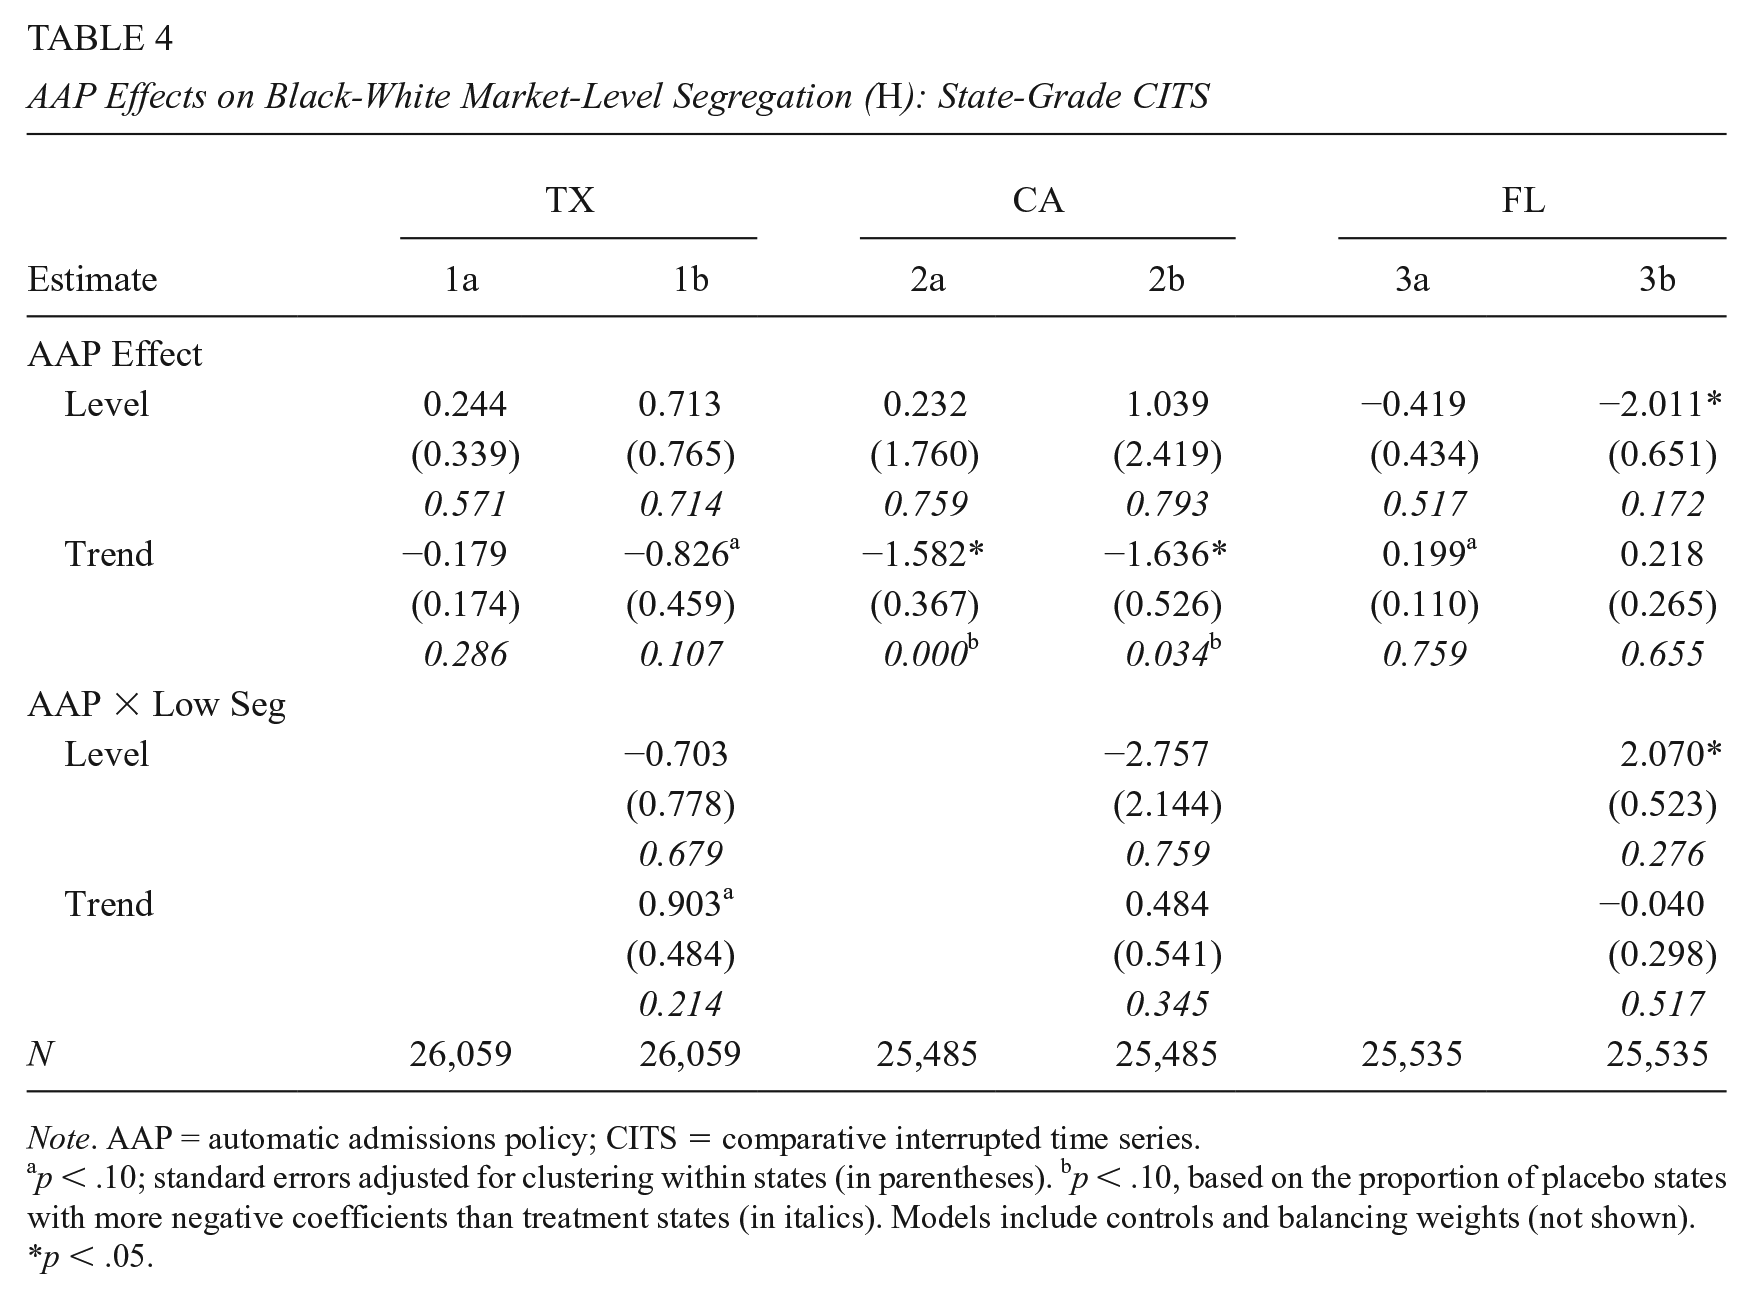
Note. AAP = automatic admissions policy; CITS = comparative interrupted time series.
p < .10; standard errors adjusted for clustering within states (in parentheses). bp < .10, based on the proportion of placebo states with more negative coefficients than treatment states (in italics). Models include controls and balancing weights (not shown).
p < .05.
For California’s ELC, there are statistically significant gradual AAP effects around −1.6-points-per-year at the market level; no placebo states had trends more negative than this. These declines were not more pronounced in more highly segregated than less segregated markets, however, counter to expectations. There was no clear impact on between-district segregation following California’s AAP (Table S1 in the online version of the journal). Between-sector segregation fell very slightly over time (see Supplementary Table S2 in the online version of the journal), but there was no evidence of changes in White or Black students’ relative representation in private schools (see Supplementary Table S12 in the online version of the journal).
For Florida’s T20, there was a statistically significant immediate drop of about 2 points in highly segregated markets, but 17% of placebo states had larger declines, and the small positive trend coefficient would offset this decline after about 8 years. Segregation fell between districts in highly segregated markets, both immediately and further gradually after the AAP, and it fell slightly and gradually between sectors in highly segregated markets (see Supplementary Table S1 and S2 in the online version of the journal). There is also evidence of declines in White students’ share of private school enrollment (see Supple-mentary Table S12 in the online version of the journal). Although consistent with the timing of the T20, it is tough to square these findings with the lack of declines in within-district segregation if the changes are truly due to gaming the AAP.
Summary of Black–White Segregation
Overall, the findings for Texas are clearest and most consistent with the hypotheses. Black–White segregation fell appreciably within highly segregated districts after the TTPP, and it fell much less at the broader market level (not at all between districts, but somewhat between the public and private sectors). Within-district analyses of school enrollments further suggest the AAP worked as hypothesized, reducing White students’ aversion to high schools with relatively large Black enrollment shares. One caveat is that the declining segregation in Texas was largely concentrated in nonmetropolitan districts with relatively small populations. In retrospect, this makes sense because a modest number of students changing the way they sort across schools to game the AAP would have more impact on aggregate racial imbalance when the overall population is small. A few students changing schools would make little difference to aggregate segregation in heavily populated districts.
The results for California are less clear. There is evidence that segregation fell within highly segregated districts after California’s ELC policy. These effects were more modest than in Texas, but they also seem more widespread, not concentrated in less populated areas. There is mixed evidence of declining segregation at the market level in California. Moreover, analyses of school enrollments are not consistent with White students’ reduced aversion to schools with large Black enrollment shares; they suggest instead that both Black and White students were less prone to attend schools with high concentrations of same-race peers after the AAP.
In Florida, segregation appears not to have changed much after the T20 AAP, at least at the district level, and changes in enrollment patterns were not consistent with expectations related to gaming behaviors. There is some evidence of modest declines in market-level segregation, but it is not very robust and makes little sense absent changes within districts.
Hispanic–White Segregation
The supplement includes similar analyses of Hispanic–White segregation (see Supplementary Tables S13–S16 in the online version of the journal). Overall Hispanic-White segregation is about half as extreme as Black–White segregation. I find no evidence that Texas’s AAP reduced Hispanic–White segregation within districts, and the level and trend effects at the market level are in opposite directions. There are no significant AAP effects at the district or market levels in California. In Florida, estimates suggest modest declines within districts and larger declines within markets, but at least 12% of placebo states had greater declines in segregation, and the findings are not robust to the inclusion of other controls. In sum, there is negligible evidence that AAPs reduced segregation between Hispanic and White students.
Discussion
The basic question here is whether AAPs altered sorting across high schools in ways that reduced racial segregation. Findings suggest they did reduce Black–White segregation, under some logical conditions. The evidence is clearest and the AAP effects appear strongest and most consistent with expectations in Texas, whose policy had the strongest benefit: enrollment at any state university for graduates in the top 10% of their high school class. These effects were concentrated within highly segregated districts, as expected. Further analyses found that White enrollments became less negatively associated with schools’ prior Black enrollment shares after the AAP. There was less impact at the broader schooling market level, although between-sector segregation fell as White students’ share of private school enrollment dropped. This is consistent with White students becoming less averse to Black schoolmates and to public schools, perhaps because they view them as less competitive for class-rank-based automatic admissions slots.
The within-district effects in Texas seem large. Together the immediate and gradual effects imply declines of around 11 points over 5 years when measured with the information theory index (H) or 16 points when measured with dissimilarity (D). To put this in context, the reversal of desegregation orders in this same period is linked to increases in Black–White D of about 5 points (Reardon et al., 2012). Such large reductions in segregation may seem a stretch for the unintended effects of AAPs. But Texas’s AAP effects appear to be concentrated in relatively sparsely populated and highly segregated districts, so a modest number of students redistributed across a few schools could meaningfully alter their racial balance. In short, I find strong evidence tying substantial declines in segregation to Texas’s TTPP, but these declines are confined to a relatively small corner of the school system.
Post-AAP declines in Black–White within-district segregation were more modest and some findings were less consistent with expectations in California, whose ELC had a weaker benefit: admission to some UC campus, but not necessarily a students’ top choice. The estimates in California equate to a drop of roughly 2 points (H) over 5 years. Unlike Texas, these effects are not concentrated in less populated districts and seem less surprising in magnitude. The chief problem is the lack of evidence that White students became less averse to enrolling in schools with higher Black enrollment shares following the ELC policy. Overall, there is compelling evidence tying modest but widespread declines in segregation to California’s ELC policy, but some findings leave room for skepticism when attributing this to the AAP policy.
The evidence of AAP effects on segregation is weakest in Florida, where segregation did not decline within districts and enrollment patterns did not shift in the expected ways. Segregation did decline at the market level overall, but these effects are modest (2 points) and difficult to square with a lack of evidence consistent with gaming at the district level.
Overall, these patterns across states are largely consistent with expectations given that Texas’s AAP policy had the strongest benefit, California’s had a more limited benefit, and Florida’s had a more limited benefit along with potential logistical problems. Note that one alternative candidate for this pattern of effects is unlikely: Accountability policies with publicly reported school achievement data could have facilitated gaming and heightened (or dampened) AAP effects on segregation, but these policies preceded AAPs in all three states.
Finally, there was little evidence that AAPs in these three states affected Hispanic–White segregation. This could be because any changes in racial sorting due to gaming are likely driven by stereotypes about academic competitiveness (which are less pronounced for Hispanic than Black students), linked with prior segregation (which is greater between Black and White students than between Hispanic and White students).
Efforts to more closely tie these changes to shifts in the opportunity distribution—which students and schools actually gained admissions opportunities—are limited by data constraints and will require additional research (see Supplementary material in the online version of the journal). Prior research suggests the policy did work as planned to some degree (Long et al., 2010; Niu & Tienda, 2010), but publicly available data are not sufficient to determine how this might have been undermined in districts where segregation fell. Public high school–level data on university enrollments in Texas are limited to relatively large schools and districts, but the declines in segregation were limited to less populated school systems. Given the latter finding, however, it seems unlikely that the changes in segregation documented here would have greatly undermined TTPP’s potential to diversify university enrollments statewide. In short, my findings suggest that gaming may have occurred in ways that reduced segregation, but they do not necessarily imply that gaming drastically undermined AAPs’ intended effects.
One take on these findings is that while they are theoretically interesting, AAPs are unlikely to appreciably reduce racial segregation on a large scale. The enrollment shifts necessary to do so may require behaviors too costly to have been impacted by AAPs for many students. However, AAPs only redistribute a specific opportunity that is salient to a narrow group of students. It is worth examining how other school-based redistributive policies with more breadth might affect segregation as well as the potential impacts changes in student sorting ultimately have on inequality of opportunity. For now, the findings here affirm that it is important for policymakers to consider how people respond to egalitarian school-based reforms to design policies that effectively reduce inequality.
Supplemental Material
sj-docx-1-epa-10.1177_01623737221078286 – Supplemental material for Opportunity Seeking Across Segregated Schools: Unintended Effects of Automatic Admission Policies on High School Segregation
Supplemental material, sj-docx-1-epa-10.1177_01623737221078286 for Opportunity Seeking Across Segregated Schools: Unintended Effects of Automatic Admission Policies on High School Segregation by Jeremy E. Fiel in Educational Evaluation and Policy Analysis
Footnotes
Acknowledgements
The views expressed are those of the author and do not necessarily reflect the views of these organizations. The author is grateful for helpful feedback from Christina Diaz, Sean Reardon, Sarah Reber, participants of the Fall 2019 seminar of the Center for Research on Educational Opportunity at the University of Notre Dame, and participants of the Fall 2020 seminar of the Interdisciplinary Training Program in Education Sciences at the University of Wisconsin-Madison.
Declaration of Conflicting Interests
The author(s) declared no potential conflicts of interest with respect to the research, authorship, and/or publication of this article.
Funding
The author(s) disclosed receipt of the following financial support for the research, authorship, and/or publication of this article: This research was supported by a National Academy of Education/Spencer Foundation Postdoctoral Fellowship, awarded to the author.
Supplemental Material
Supplemental material for this article is available online
Notes
Author
JEREMY E. FIEL is an assistant professor of sociology at Rice University. His research examines segregation, education, and social stratification, with particular interests in racial/ethnic school segregation, educational inequality, and intergenerational mobility. He is also interested in quantitative methods for causal inference.
References
Supplementary Material
Please find the following supplemental material available below.
For Open Access articles published under a Creative Commons License, all supplemental material carries the same license as the article it is associated with.
For non-Open Access articles published, all supplemental material carries a non-exclusive license, and permission requests for re-use of supplemental material or any part of supplemental material shall be sent directly to the copyright owner as specified in the copyright notice associated with the article.